Article

Performance of Integrated Near-Infrared Spectroscopy and Intravascular Ultrasound (NIRS-IVUS) System against Quantitative Flow Ratio (QFR)

by
Magdalena M. Dobrolińska
1,
Paweł M. Gąsior
1,
Elżbieta Pociask
2,
Grzegorz Smolka
1,
Andrzej Ochala
1,
Wojciech Wojakowski
1 and
Tomasz Roleder
3,*
1
Division of Cardiology and Structural Heart Diseases, Medical University of Silesia, 40-635 Katowice, Poland
2
Department of Biocybernetics and Biomedical Engineering, AGH University of Science and Technology, 30-059 Krakow, Poland
3
Regional Specialist Hospital, Research and Development Center, 51-124 Wroclaw, Poland
*
Author to whom correspondence should be addressed.
Diagnostics 2021, 11(7), 1148; https://doi.org/10.3390/diagnostics11071148
Submission received: 2 June 2021 / Revised: 17 June 2021 / Accepted: 21 June 2021 / Published: 23 June 2021
(This article belongs to the Section Medical Imaging and Theranostics)

Abstract

:
Quantitative flow ratio (QFR) is a new opportunity to analyze functional stenosis during invasive coronary angiography. Together with a well-known intravascular ultrasound (IVUS) and a new player in the field, near-infrared spectroscopy (NIRS), it is gaining a lot of interest. The aim of the study was to compare QFR results with integrated IVUS-NIRS results acquired simultaneously in the same coronary lesion. We retrospectively enrolled 66 patients in whom 66 coronary lesions were assessed by NIRS-IVUS and QFR. Lesions were divided into two groups based on QFR results as QFR-positive group (QFR ≤ 0.8) or QFR-negative group (QFR > 0.8). Based on ROC curve analysis, the best cut-off values of minimal lumen area (MLA), minimal lumen diameter (MLD) and percent diameter stenosis for predicting QFR ≤ 80 were 2.4 (AUC 0.733, 95%CI 0.61, 0.834), 1.6 (AUC 0.768, 95%CI 0.634, 0.872) and 59.5 (AUC 0.918, 95%CI 0.824, 0.971), respectively. In QFR-positive lesions, the maxLCBI4mm was significantly higher than in QFR-negative lesions (450.12 ± 251.0 vs. 329.47 ± 191.14, p = 0.046). The major finding of the present study is that values of IVUS-MLA, IVUS-MLD and percent diameter stenosis show a good efficiency in predicting QFR ≤ 0.80. Moreover, QFR-positive lesions are characterized by higher maxLCBI4mm as compared to the QFR-negative group.

1. Introduction

Fractional flow reserve (FFR), which enabled analyzing the hemodynamic significance of coronary stenosis, was a real game-changer in the diagnosis and treatment of coronary artery disease (CAD) [1,2]. Recently developed quantitative flow ratio (QFR), which computes FFR without the necessity of drug-induced hyperemia or utilization of additional pressure wire [3], is a promising technology with the potential to improve outcomes of percutaneous coronary interventions (PCI). QFR applies fluid dynamics equations and is calculated from three-dimensional quantitative coronary angiography (3D-QCA). It was previously validated and showed high diagnostic accuracy in identifying hemodynamically significant stenosis and the prediction of ≤0.8 FFR [4,5,6].
Not only the functional severity of the lesion but also morphology plays a significant role in the stenosis assessment. Intravascular ultrasound (IVUS) has proven its value in the analysis of plaque morphology, and as a result, an IVUS-guided PCI demonstrated a reduction in adverse events and cardiovascular death [7,8,9]. Besides the fact that IVUS itself is not sufficient to replace the guidance of FFR during PCI, the relationship between the functional severity of the stenosis and parameters assessed by IVUS, including minimal lumen area (MLA) and minimal lumen diameter (MLD), was also shown [10,11,12].
Importantly, if the near-infrared spectroscopy (NIRS) is added to IVUS, it enables differentiating between lipidic and fibrotic plaques [13]. NIRS detects lipids within plaques, and the amount of lipids is measured as a lipid core burden index (maxLCBI4mm). Lesions with maxLCBI4mm ≥ 265 are identified as thin cap fibrous atheroma (TCFA) [14] and are associated with an increased risk of post-PCI myocardial infarction (MI) [15,16].
The aim of this study was to assess the value of parameters measured by integrated NIRS-IVUS system in the detection of significant stenosis defined by QFR.

2. Materials and Methods

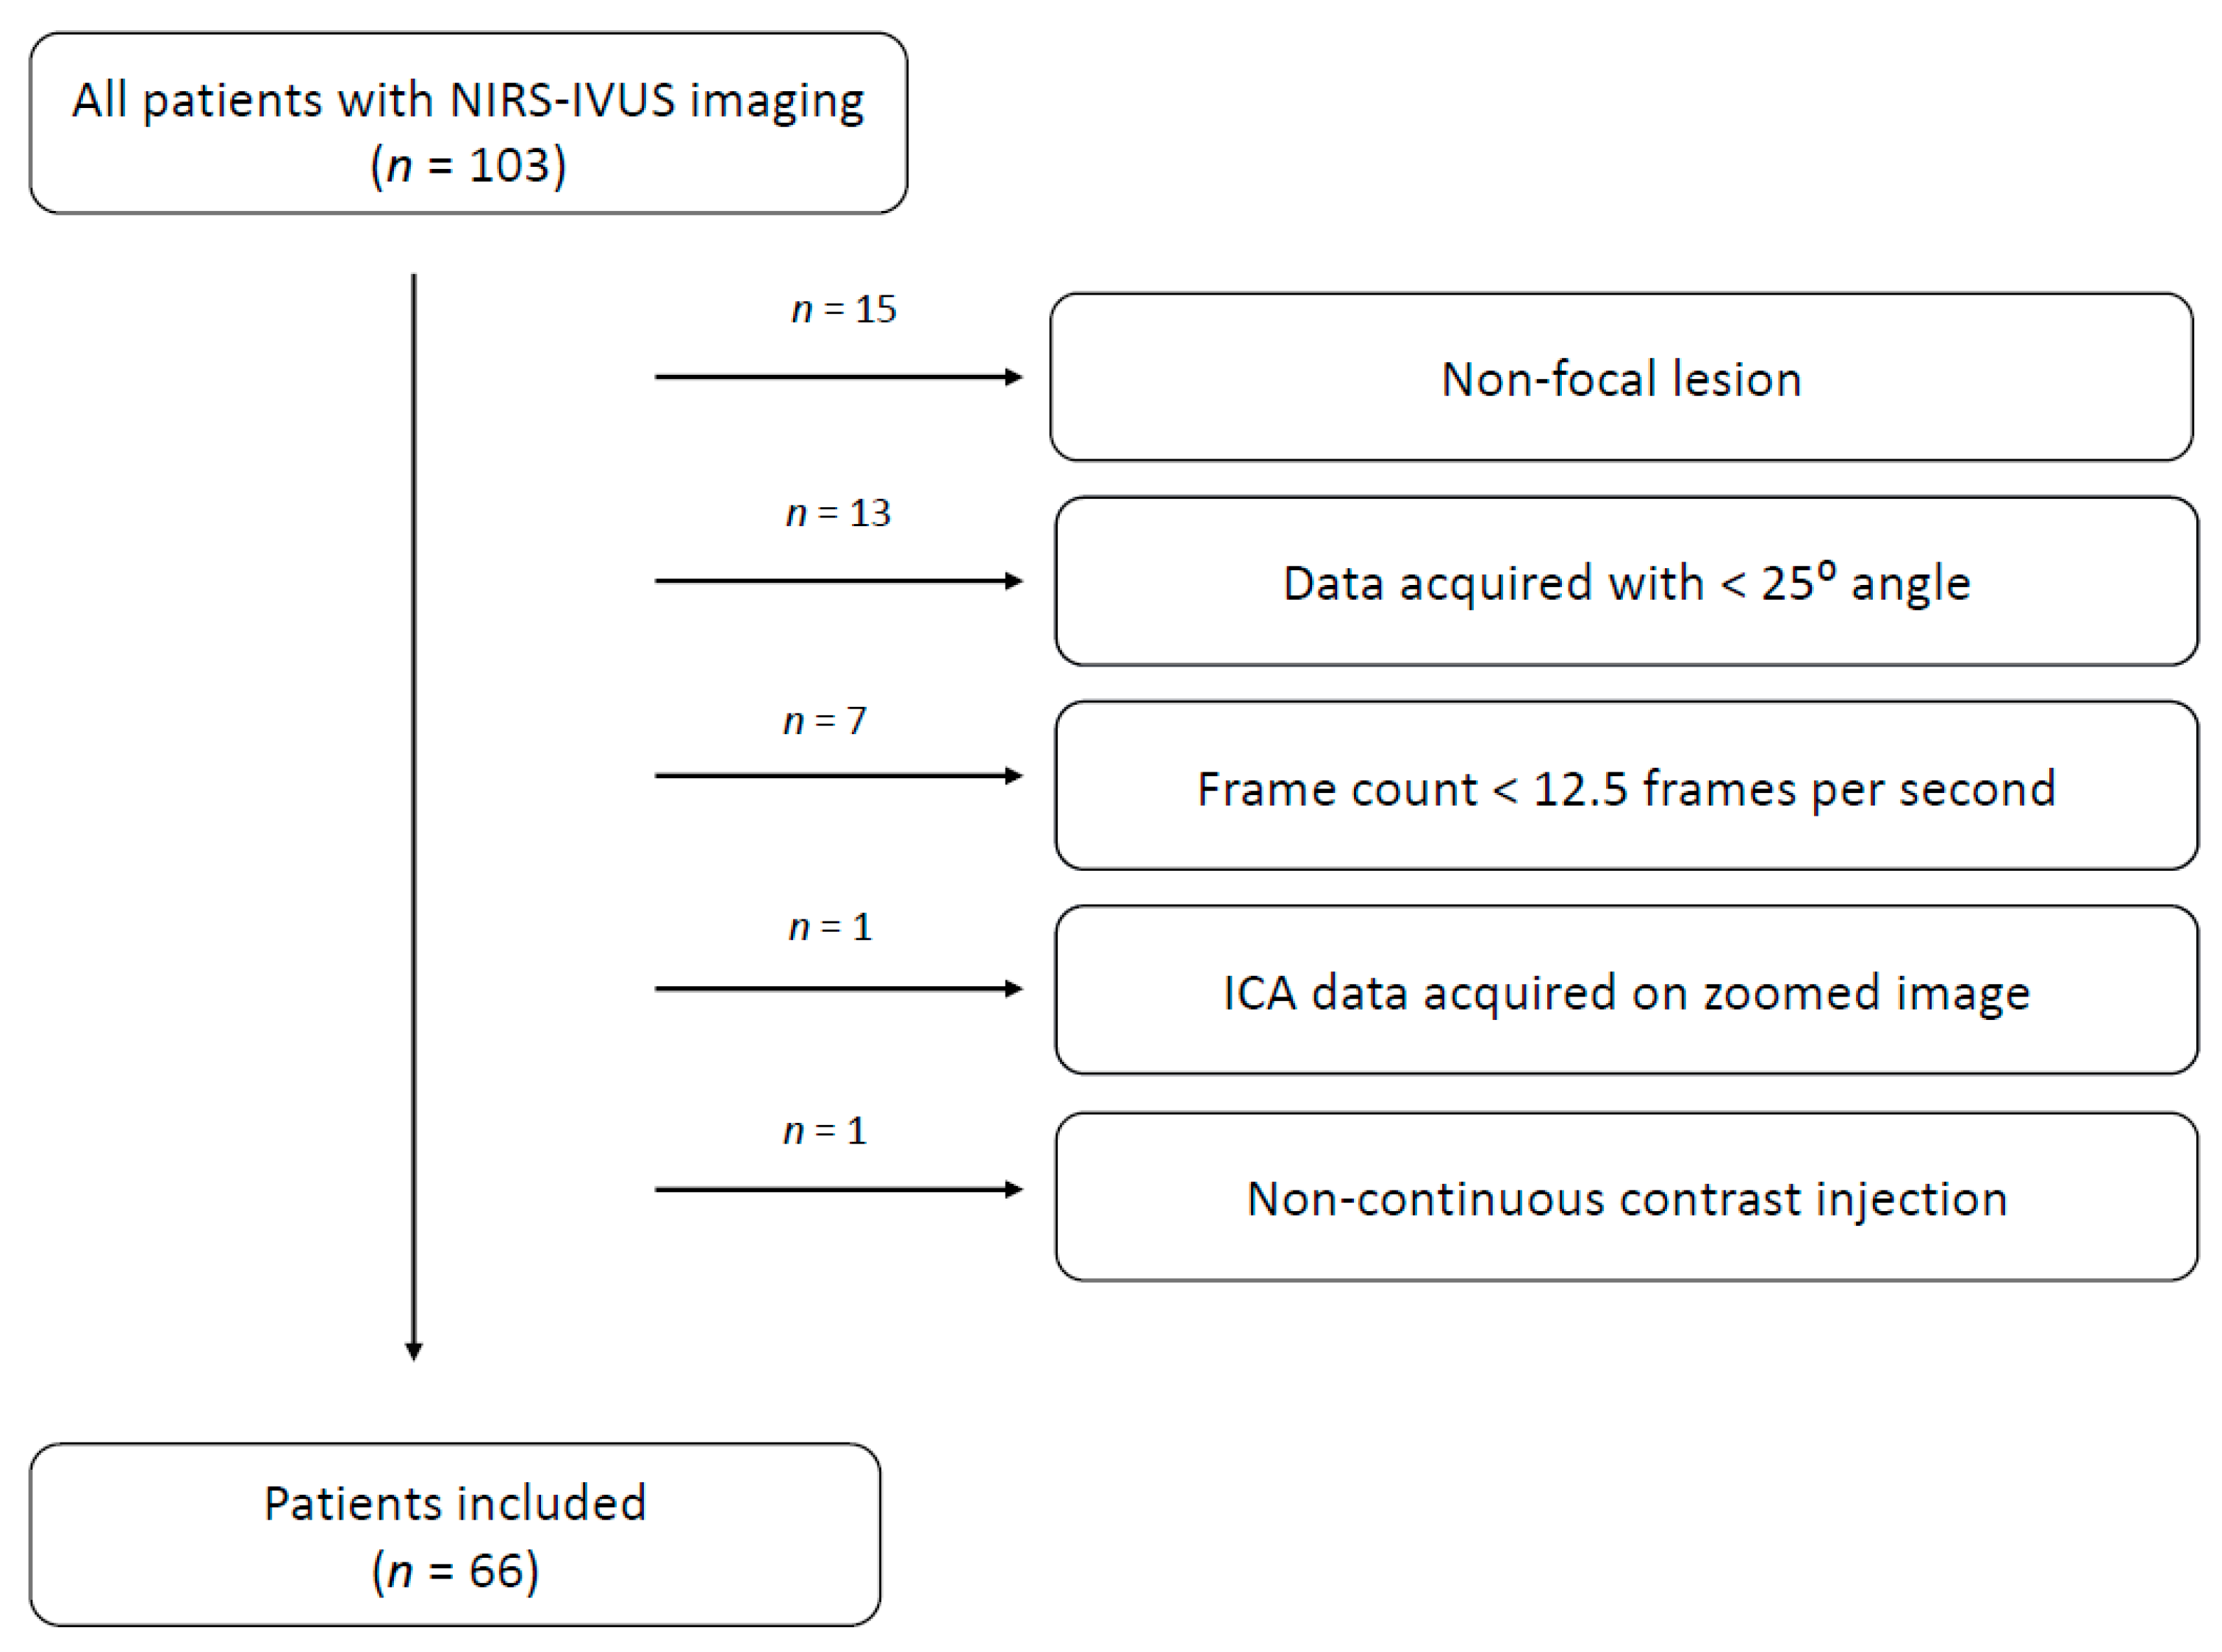
2.1. Study Population

We retrospectively enrolled 66 patients diagnosed with chronic coronary syndromes (CCS) and acute coronary syndromes (ACS) between 2012 and 2015, in the high-volume tertiary center (Figure 1). Each of the enrolled patients underwent integrated NIRS-IVUS imaging and had two angiographic images acquired at different 25° angles, based on which we calculated QFR. Patients were divided into two groups based on QFR results. Those with QFR ≤ 0.8 were included in the QFR-positive group (n = 37), while others were included in the QFR-negative group (n = 29). Exclusion criteria were as follows: stent restenosis as target lesion, aorto-ostial stenosis, bifurcation lesions, tandem lesions, renal failure (creatinine >1.5 mg/dL), hemodynamic compromise and contrast allergy. None of the patients developed any complications due to integrated NIRS-IVUS imaging. Clinical demographics and medical history were obtained from hospital records. The study conformed to the Declaration of Helsinki. Due to retrospective design, further application was not needed.

2.2. Invasive Coronary Angiography

The PCI was performed under angiography guidance and neither integrated NIRS-IVUS system nor QFR data were used for this purpose (Figure 2a). The region to treat was selected by the operator after the diagnostic angiogram. In all of the included lesions, the drug-eluting stent (DES) was implanted. The study projections were acquired at a minimum of 12.5 frames per second with continuous and brisk contrast injections without any zooming or table movements.

2.3. QFR Measurement

QFR was computed with the QAngio XA-3D/QFR solution (Medis Medical Imaging Systems bv., Leiden, the Netherlands) based on a previously published method (Figure 2b) [17]. QFR was evaluated in lesions, which were previously analyzed with NIRS-IVUS. The left main artery was excluded from the analysis. The retrospective patient selection for the study was based on angiographic image projections which were acquired at different 25° angles. Images with low angiographic quality and poor contrast filling were excluded from further analysis. Only focal lesions were included. For each study, the end-diastolic frame was used for the reconstruction of the segmented vessel. After the vessel references and lesion were marked, the lumen contour was automatically delineated by validated algorithms. In the case of suboptimal angiographic image quality, manual correction was allowed. The contrast frame count was performed in an angiographic run. Frame-count-based contrast QFR was used for each analysis. In our study, the vessel contrast QFR was considered a main parameter for each analyzed coronary artery. Vessel QFR was calculated for the entire contoured segment. The QFR analysis was performed by one observer who was blind to the results of the PCI procedure and NIRS-IVUS analysis results. The percent diameter stenosis (%DS) was assessed using 2D-QCA.

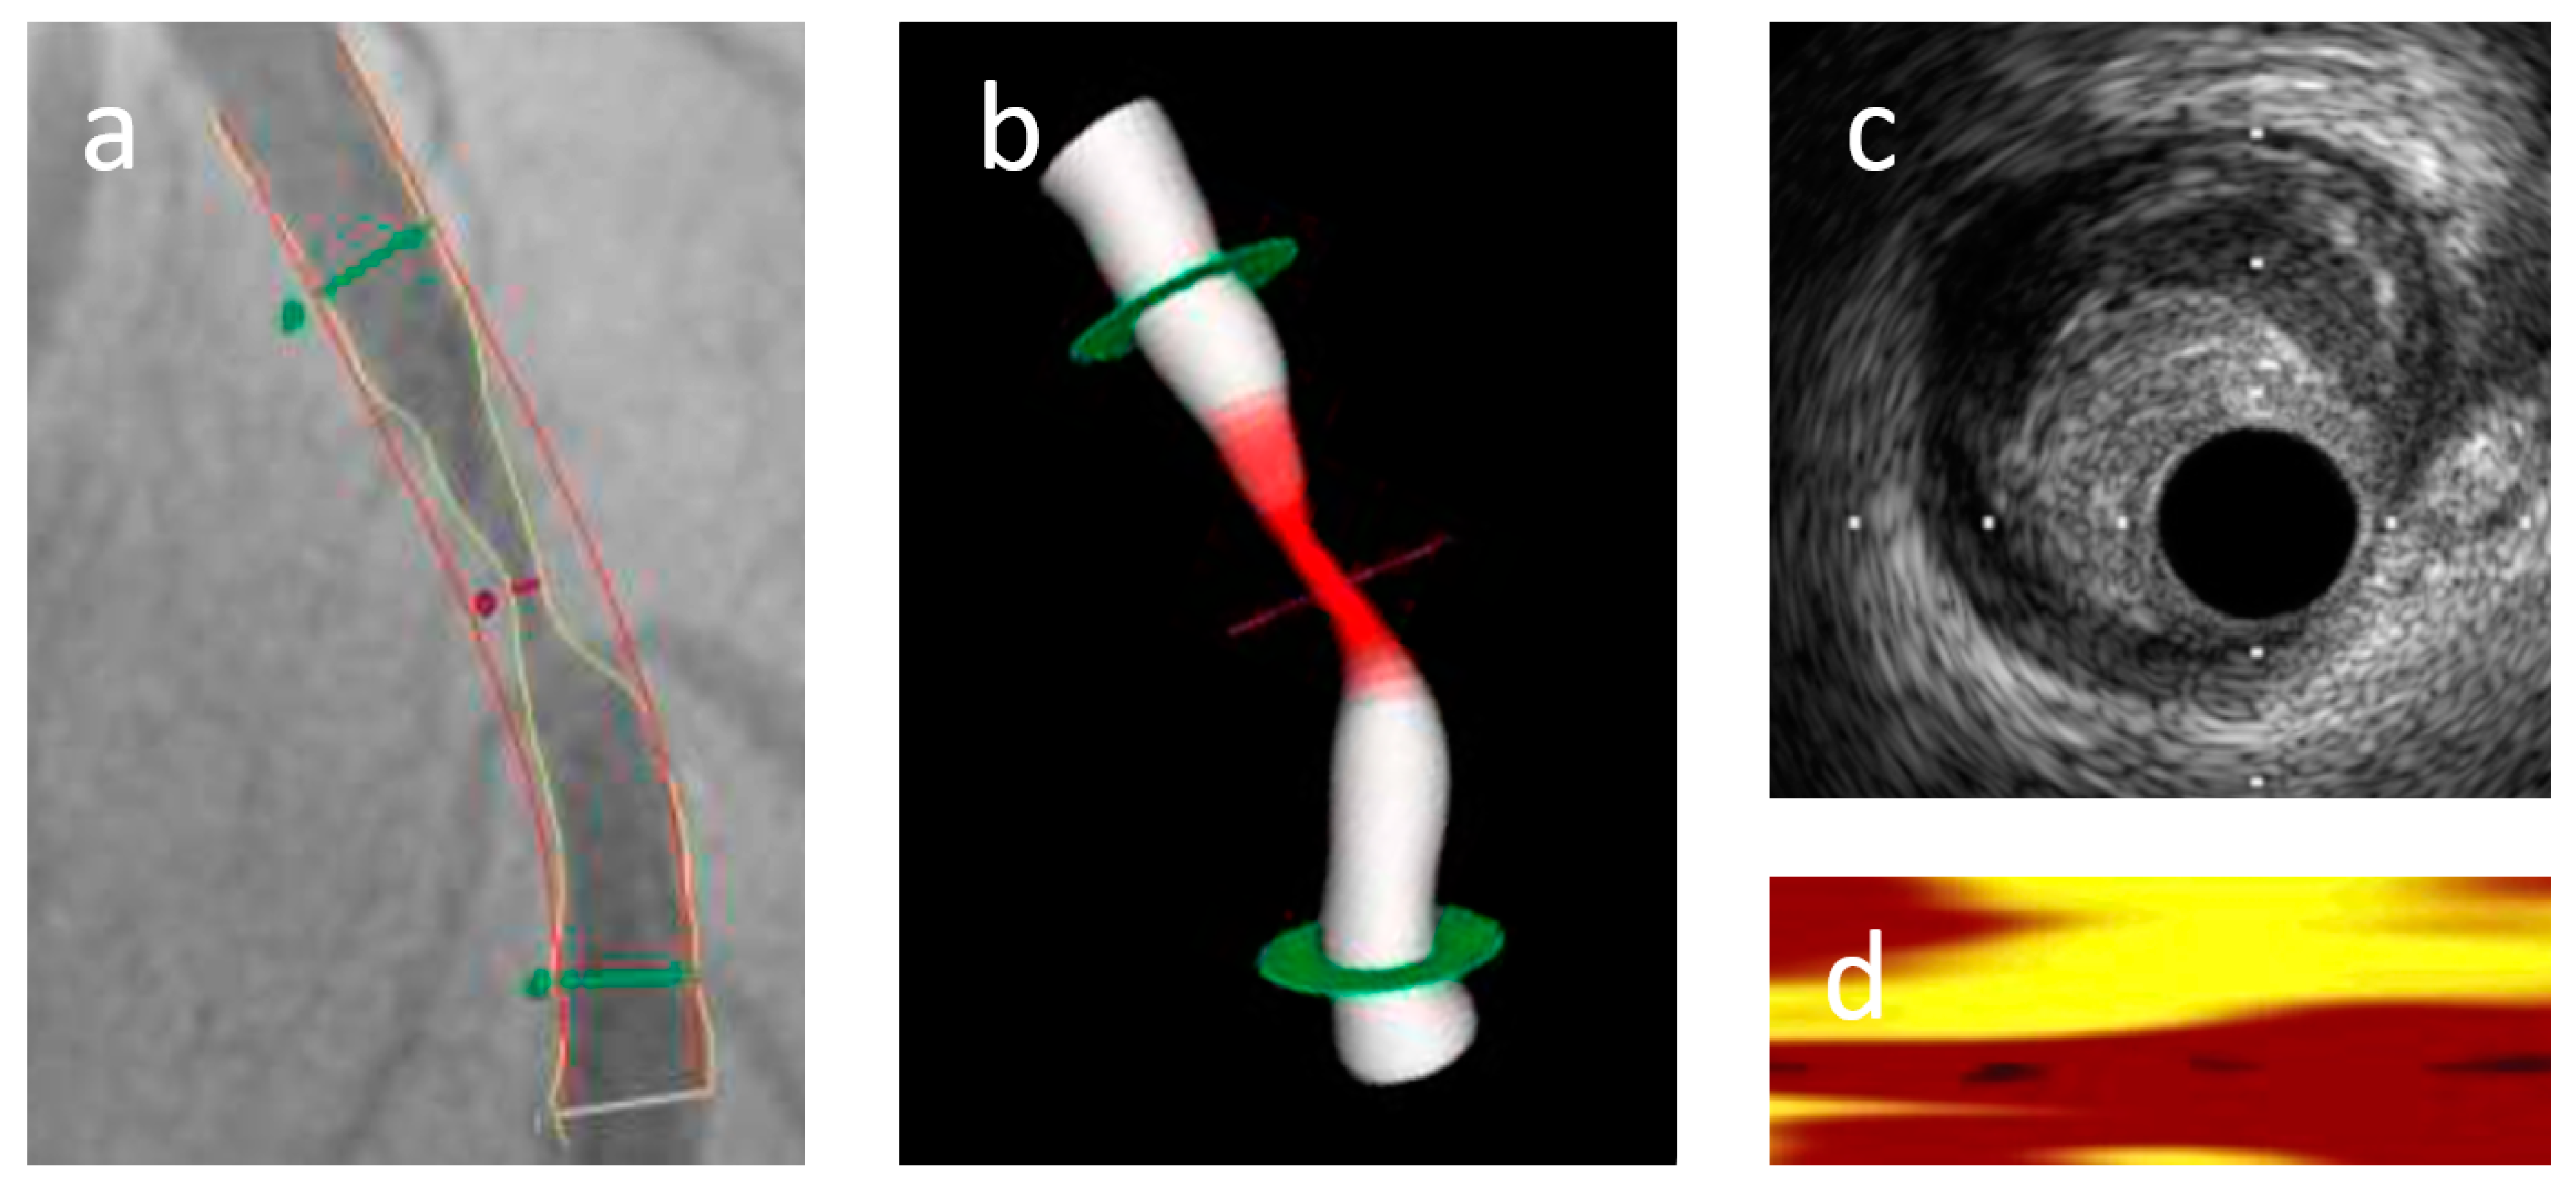
2.4. NIRS-IVUS Analysis

The integrated NIRS-IVUS system was used to perform a culprit lesion analysis before and after stent implantation (Figure 2c,d). For this study, only a preimplantation image analysis was used. Before the insertion of the integrated NIRS-IVUS system, heparin anticoagulation (activated clotting time >300 s) was used and followed by administration of intracoronary nitroglycerine (100–200 µm). The automated pullback started with a speed of 0.5 mm/s (240 rotations/min) when the 2.4 Fr. TVC Insight Catheter (InfraReDx, TVC Imaging System, Burlington, MA, USA) was positioned at least 10 mm distal to the target lesion. The pullback stopped when the TVC catheter entered the guiding catheter. Quantitative IVUS measurements were performed in every millimeter within the region of interest (ROI), which had to be at least 4 mm long. We analyzed IVUS parameters measured on cross-sectional IVUS images, including minimal lumen area (MLA), minimal lumen diameter (MLD), lesion length and plaque burden. Plaque burden was calculated as total plaque area divided by EEM CSA × 100 (%). The remodelling index (RI) was calculated by dividing EEM area at the MLA by the reference EEM area. Negative and positive remodeling were defined as RI ≤ 0.95 and RI ≥ 1.05, respectively. RI between these values was defined as a nonremodeled vessel.
The chemical composition of the plaque within ROI was analyzed using NIRS. On NIRS chemogram, 1 pixel every 0.1 mm on the x-axis displays the pullback position, while 1 pixel every 1° shows the circumferential position. The fraction of yellow pixels within the ROI, indicating lipids, was calculated as a lipid core burden index (LCBI). Within the ROI, the maximal amount of lipids in 4 mm was automatically chosen by the software and expressed as maximal LCBI in 4 mm (maxLCBI4mm). Thin cap fibrous atheroma (TCFA) suspected lesions were defined as maxLCBI4mm ≥ 265. NIRS-IVUS data were analyzed off-line using CAAS intravascular software (Pie Medical Imaging BV, Maastricht, the Netherlands).

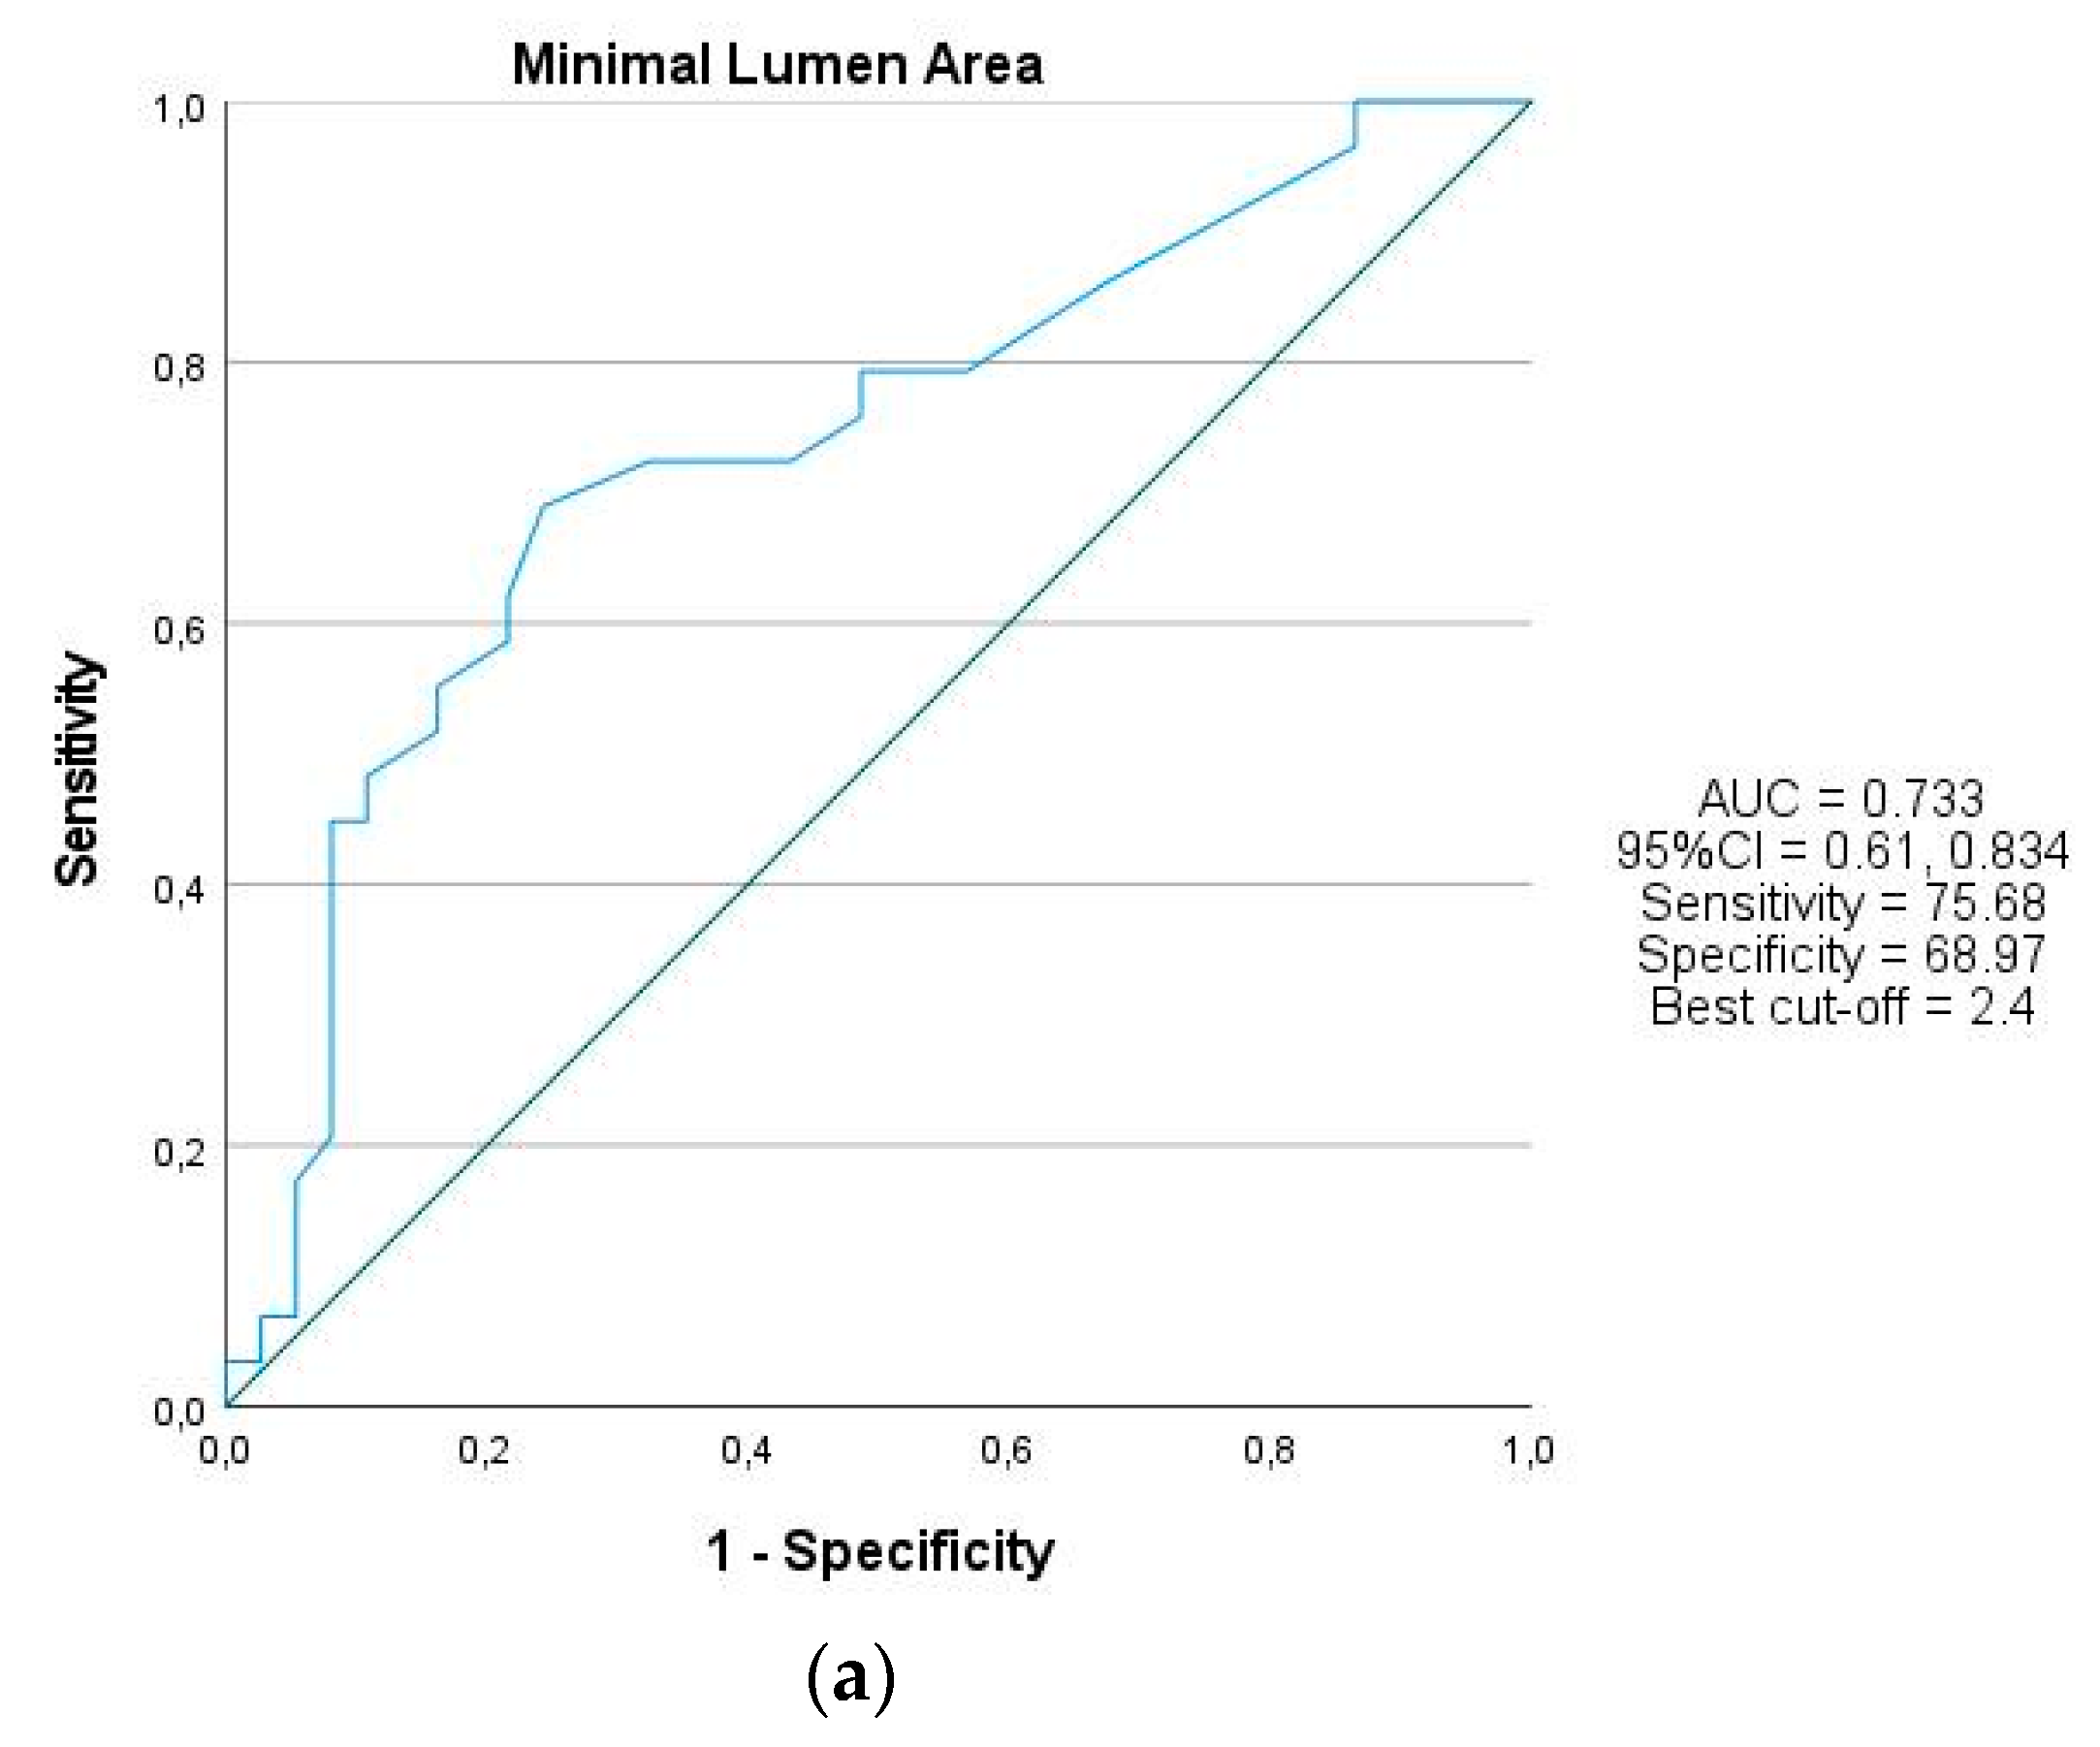
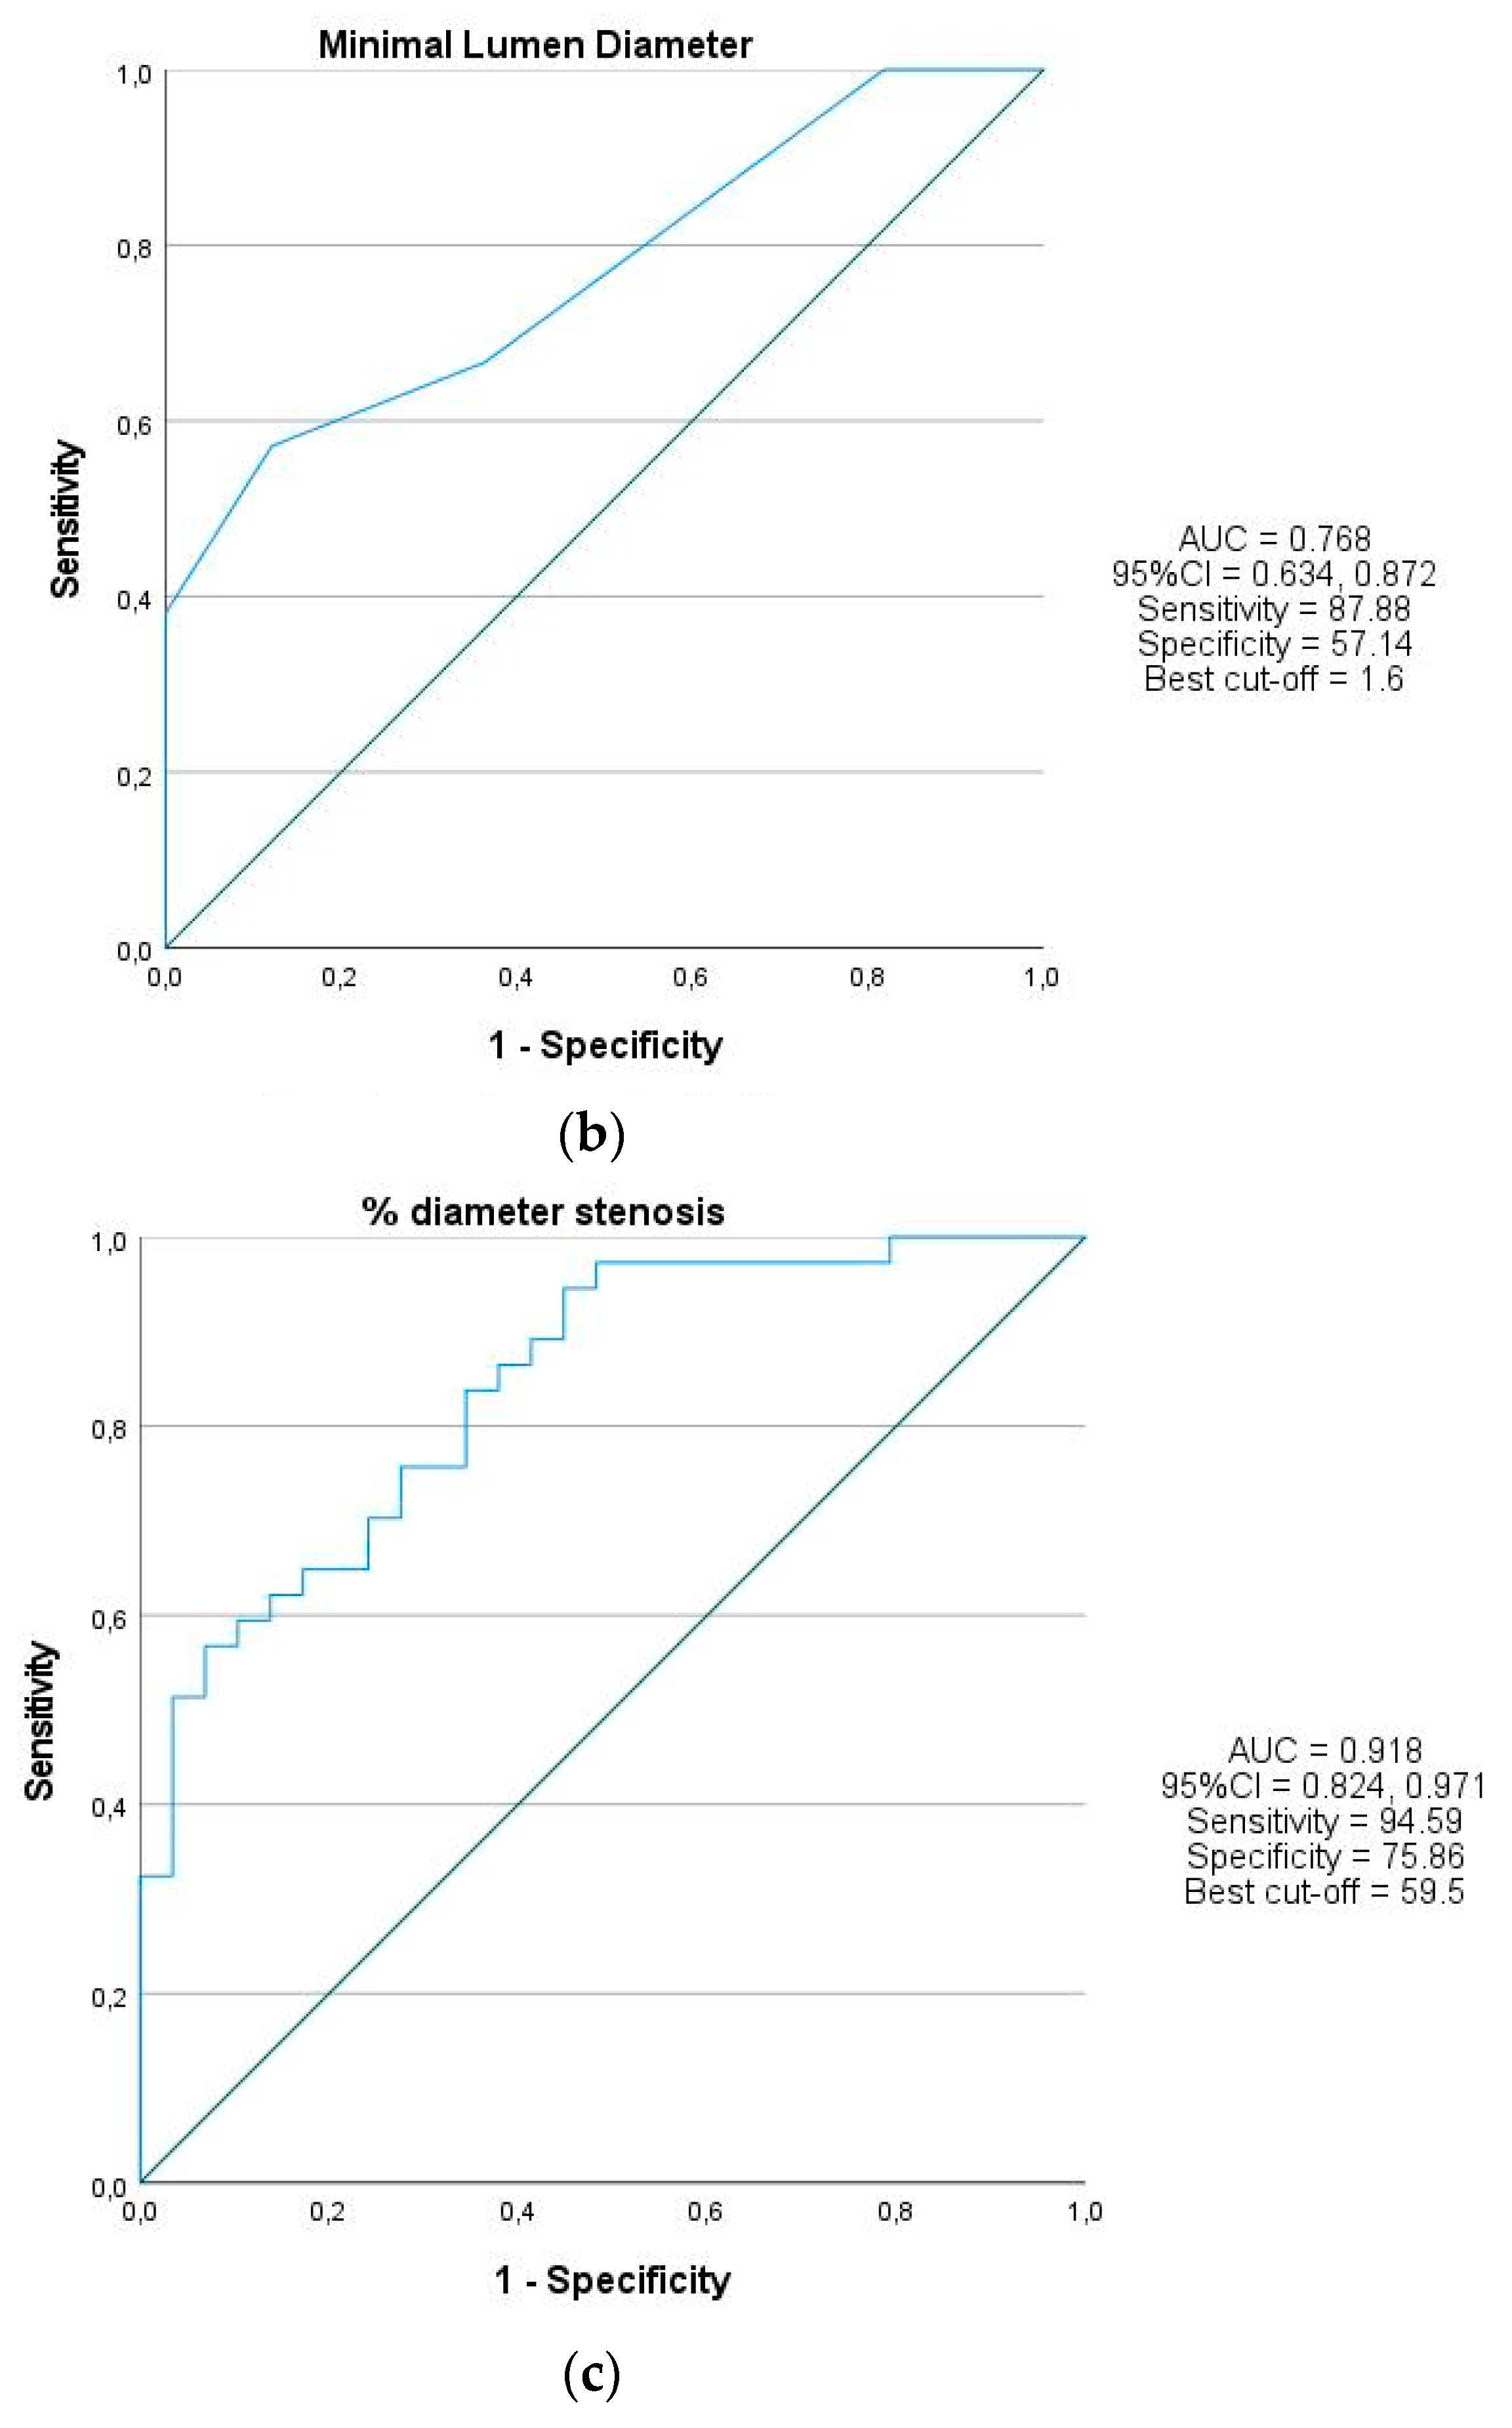
2.5. Statistical Analysis

Continuous variables are presented as means with standard deviation (±SD) or medians with interquartile intervals (IQR, 1st, 3rd). Categorical data are shown as the number or percentage (%). For the comparison, the one-way ANOVA and Mann–Whitney test were used [18]. Correlation was measured using Pearson’s or Spearman’s rank-order correlation. The categorical data were compared using Fischer’s exact test or chi-square test. Receiver operating characteristic (ROC) curve analyses were performed to identify the optimal cut-off values of IVUS parameters for the prediction of hemodynamic significance with maximum accuracy [19]. A value of p < 0.05 was considered statistically significant. MedCalc version 15.8 (MedCalc 15.8, MedCalc Software, Ostend, Belgium) and SPSS (SPSS v.23, Armonk, NY, USA) were used for statistical analysis.

3. Results

3.1. Patients Characteristics

Patients’ characteristics are summarized in Table 1. We analyzed 66 focal lesions in 66 patients. Patients from the QFR-positive group were not significantly younger than patients from the QFR-negative group (63.3 ± 10.34 vs. 62.8 ± 10.9; p = 0.767). There were no significant differences in the percentage of patients who had hypertension (43.2% vs. 79.3%, p = 0.246), dyslipidemia (35.1% vs. 62.0%, p = 0.114) or diabetes mellitus (21.6% vs. 20.7%, p = 0.246) in QFR-positive and QFR-negative groups. The QFR-negative group was characterized by a higher percentage of patients who had PCI in the past (34.5% vs. 10.8%, p = 0.016).

3.2. Lesion Characteristics

Of the lesions analyzed, 46.9% were located in the left anterior descending coronary artery (LAD). The mean diameter of the proximal reference was equal to 2.89 ± 0.50 mm. The mean percent diameter stenosis was 63.25 ± 14.93%. The median MLA and MLD were 2.35 (1.97, 2.95) and 1.5 (1.5, 1.7), respectively. The median vessel contrast QFR value for a total of 66 lesions was equal to 0.8 (0.7, 0.9). Lesions with QFR ≤ 0.8 were included in the QFR-positive group (n = 37), while others were included in the QFR-negative group (n = 29). Based on ROC curve analysis, the best cut-off values of MLA, MLD and percent diameter stenosis for predicting QFR ≤ 0.80 were 2.4 (AUC 0.733, 95%CI 0.61, 0.834, p < 0.001), 1.6 (AUC 0.768, 95%CI 0.634, 0.872, p < 0.001) and 59.5 (AUC 0.918, 95%CI 0.824, 0.971, p < 0.001), respectively. ROC curves are displayed in Figure 3a–c.

3.3. QFR and NIRS-IVUS Lesion Analysis

The mean vessel QFR in positive and negative groups was equal to 0.67 ± 0.14 and 0.9 ± 0.06, respectively. In the QFR-positive group, only 59.5% of lesions had diameter stenosis >70% measured by 2D-QCA. NIRS-IVUS results are reported in Table 2. In the QFR-positive group, lesions were not significantly longer than QFR-negative lesions (27.7 ± 10.74 vs. 22.91 ± 11.02, p = 0.48). The QFR-positive group was characterized by smaller MLA (2.2 ± 0.42 vs. 3.12 ± 1.44; p = 0.007) and MLD (1.5 (1.5, 1.6) vs. 1.7 (1.5, 1.9); p = 0.001) as compared to QFR-negative group. In QFR-positive lesions, the maxLCBI4mm was significantly higher than in QFR-negative lesions (450.12 ± 251.0 vs. 329.47 ± 191.14, p = 0.046); however, there was no difference in the amount of TCFA lesions between the two groups. There were no significant differences in plaque volume and plaque burden between the two groups (respectively p = 0.252, p = 0.286). There was also no difference in lumen volume and EEM volume between both groups (respectively p = 0.737, p = 0.658). We did not find a difference in RI between both groups as well (1.02 (0.8, 1.27) vs. 1.00 (0.84, 1.44); p = 0.69).

3.4. QFR and NIRS-IVUS Correlation Analysis

The percent diameter stenosis in the QFR-positive and QFR-negative groups was 71.98 ± 8.67% and 49.42 ± 12.13% (p = 0.000), respectively. Correlations are displayed in Table 3. In the QFR-positive group there was no correlation between vessel QFR and MLA (r = 0.151, p = 0.721), MLD (r = 0.064, p = 0.722), plaque volume (r = −0.229, p = 0.173) or plaque burden (r = −0.227, p = 0.176). In the QFR-negative group, there was also no correlation between vessel QFR and MLA (r = 0.151, p = 0.435), MLD (r = 0.388, p = 0.082), plaque volume (r = −0.212, p = 0.271) or plaque burden (r = −0.177, p = 0.358).

4. Discussion

The main finding of this study is that, based on NIRS-IVUS analysis, MLA and MLD were better than plaque burden as predictors of hemodynamically significant stenosis based on QFR of ≤0.80, and %DS measured in 2D-QCA was also a better predictor than plaque burden. Moreover, the QFR-positive group was characterized by higher maxLCBI4mm. Interestingly, we did not find any correlation between vessel QFR and MLA, MLD, plaque volume or plaque burden in the QFR-positive group or the QFR-negative group.
Currently, the invasively measured FFR remains the gold standard in the assessment of coronary stenosis severity. Despite its undeniable clinical value, the costs of pressure wires and the need for hyperemia limit its everyday use in many centers. Importantly, the response to adenosine-induced hyperemia not only varies between individuals, including increased heart rate or decreased blood pressure, but also causes patient discomfort [20,21,22]. Even though adenosine-free methods, including instantaneous wave-free ratio (iFR) or resting full-cycle ratio (RFR), are available, the use of additional wire is still required. Owing to the availability of QFR, which is an angiography technique computing FFR without drug-induced hyperemia or a pressure wire, it has gained a lot of interest.
FAVOR Pilot and FAVOR II were the first studies demonstrating that wire-free QFR is superior to standard quantitative coronary angiography for evaluation of intermediary coronary artery stenosis [23]. When the QFR was applied to the 2D-QCA, the diagnostic accuracy of combined QFR-QCA increased to 92.7% as compared to quantitative coronary angiography [4]. Furthermore, the functional coronary lesion assessment by QFR showed a good diagnostic accuracy as compared to FFR, which indicates that it is a reliable method for the assessment of coronary hemodynamics [24,25,26]. Recently, QFR was successfully used to select the most appropriate patients for further FFR evaluation [5]. There was also a high agreement between QFR and iFR [27,28]. Moreover, QFR measurement has a low interobserver variability, which proves its value as a feasible method in everyday practice [29]. Additionally, the results of the WIFI-II study showed that the addition of QFR into everyday assessment may reduce the use of pressure wires [25]. In our study, based on 2D-QCA, all of 66 lesions underwent stent implantation. According to the QFR results, only 56% of them were hemodynamically significant. Therefore, based on QFR results, 44% of lesions treated in our study might have been potentially safely deferred.
During the last two decades, many attempts have been made to assess coronary hemodynamics based on lesion anatomy [30]. According to Okabe et al., IVUS is considered a valuable tool to guide PCI which not only assesses the morphology of the lesion but also reduces the occurrence of stent thrombosis [31]. As the insertion of two additional wires during one procedure is not considered a desirable approach, the ability of IVUS to assess functional lesion severity attracts attention. Although several studies, including large international multicenter trials, have investigated the relationship between FFR severity and IVUS parameters, there are no data comparing IVUS to QFR.
As reported by Voros et al. [32], within the IVUS-derived measurements, MLD had the strongest correlation with FFR, whereas MLA was the best predictor by ROC and multivariable analysis. The FIRST study showed a moderate correlation of IVUS results with the FFR values. However, the cut-off values of MLA measured by IVUS for detecting hemodynamically relevant stenosis (<2.4, <2.7 and <3.6 mm2) dependent on vessel size (reference vessel diameters <3.0, 3.0–3.5 and >3.5 mm, respectively) were found [10]. Specifically, IVUS-derived MLA ≥ 2.4 mm2 was considered useful to rule out lesions with FFR < 0.80 [33]. Furthermore, a meta-analysis showed that for lesions with an angiographic diameter greater than 3 mm, the MLA cut-off was equal to 2.8 mm2, while for lesions smaller than 3 mm, the MLA cut-off was 2.4 mm2 [34]. The cut-off MLA value from our study, which was calculated based on QFR analysis, is comparable to results from other studies when FFR as a reference was used. Moreover, Gonzalo et al. found a cut-off value of IVUS-derived MLD equal to 1.59 mm with FFR as a reference, while the IVUS-MLD cut-off value in our study equals 1.6 mm [35]. As compared to the analyses in which FFR was used as a reference, our results with QFR as a reference are similar. Interestingly, there was no correlation between anatomical values, including MLA, MLD, plaque burden and plaque volume, and functional vessel QFR, even though both MLA and MLD were significantly lower in the QFR-positive group.
As far as morphology is concerned, NIRS enables not only the periprocedural analysis of chemical plaque composition but also the quantitative measurement of lipid content as a maxLCBI4mm [36,37]. It should be noted that neither QFR nor IVUS enable the determination of lipid-rich lesions. NIRS simultaneously distinguishes lipid-core plaques (LCP), which are associated with increased risk of periprocedural MI and restenosis rates following stent implantation [38,39,40]. The specific lipid-rich lesions with maxLCBI4mm ≥265 were defined as TCFA [14]. In our study, QFR-positive lesions were characterized by greater maxLCBI4mm. Importantly, in our study, there was no significant difference in the number of TCFA lesions between QFR-positive and QFR-negative groups. As we know from the PROSPECT-II study, a lipid-rich lesion increases the risk of coronary events in the future [13]. According to that, the integrated NIRS-IVUS system may not only detect significant stenosis, but also enable planning further lipid-lowering therapy and follow-up of patients with hemodynamically insignificant lesions.
Initial studies on QFR indicate its great potential due to wire-free, nonhyperemic measurement and the fact that the addition of QFR to the standard procedure does not increase the contrast use. Furthermore, the hybrid NIRS-IVUS-QFR guidance enables not only the functional but also anatomical and morphological plaque assessment. Moreover, the adjustment of NIRS to IVUS gives a unique opportunity to plan further treatment and optimize the lipid-lowering therapy in patients with TCFA lesions.
This study has several limitations. First, this study was a single-center, retrospective study involving a small number of patients. Second, we selected only lesions that were evaluated by NIRS-IVUS and met the criteria for QFR measurement, which may result in selection bias. Additionally, lesions were only analyzed after angioplasty followed by stent implantation, which may have led to an inaccurate assessment of the association between QFR and IVUS. Moreover, we did not use FFR, which is considered a gold standard. A larger and prospective study is needed to verify the results of this study.

5. Conclusions

In the present study, we found that IVUS values of IVUS-MLA, IVUS-MLD and percent diameter stenosis show good accuracy in predicting QFR ≤ 80. Additionally, we showed that QFR-positive lesions are characterized by higher maxLCBI4mm as compared to the QFR-negative group. However, we did not find any correlation between vessel QFR and MLA, MLD, plaque volume or plaque burden in the QFR-positive group or the QFR-negative group. As the assessment of stenosis function with a pressure wire has some limitations due to contraindication for adenosine infusion or patient discomfort during hyperemia, the combination of NIRS-IVUS and QFR may play an important role in further diagnosis and treatment.

Author Contributions

Conceptualization, M.M.D., P.M.G., W.W., T.R.; Methodology, M.M.D., P.M.G., E.P., T.R.; Software, M.M.D., E.P.; Formal Analysis, M.M.D.; Investigation, M.M.D., P.M.G., G.S., A.O.; Writing—Original Draft Preparation, M.M.D.; Writing—Review and Editing, P.M.G., W.W., T.R.; Supervision, T.R.; Data Acquisition, G.S., A.O., W.W., T.R. All authors have read and agreed to the published version of the manuscript.

Funding

This research received no external funding.

Institutional Review Board Statement

The study conformed to the Declaration of Helsinki. Due to retrospective design, further application was not needed.

Informed Consent Statement

Informed consent was obtained from all subjects involved in the study.

Data Availability Statement

Data sharing is not applicable to this article.

Conflicts of Interest

The authors declare no conflict of interest.

References

  1. Van Nunen, L.X.; Zimmermann, F.M.; Tonino, P.A.L.; Barbato, E.; Baumbach, A.; Engstrøm, T.; Klauss, V.; Maccarthy, P.A.; Manoharan, G.; Oldroyd, K.G.; et al. Fractional flow reserve versus angiography for guidance of PCI in patients with multivessel coronary artery disease (FAME): 5-year follow-up of a randomised controlled trial. Lancet 2015, 386, 1853–1860. [Google Scholar] [CrossRef]
  2. Zimmermann, F.M.; Ferrara, A.; Johnson, N.P.; van Nunen, L.X.; Escaned, J.; Albertsson, P.; Erbel, R.; Legrand, V.; Gwon, H.-C.; Remkes, W.S.; et al. Deferral vs. performance of percutaneous coronary intervention of functionally non-significant coronary stenosis: 15-year follow-up of the DEFER trial. Eur. Heart J. 2015, 36, 3182–3188. [Google Scholar] [CrossRef] [PubMed] [Green Version]
  3. Tu, S.; Westra, J.; Yang, J.; von Birgelen, C.; Ferrara, A.; Pellicano, M.; Nef, H.; Tebaldi, M.; Murasato, Y.; Lansky, A.; et al. Diagnostic Accuracy of Fast Computational Approaches to Derive Fractional Flow Reserve From Diagnostic Coronary Angiography: The International Multicenter FAVOR Pilot Study. JACC Cardiovasc. Interv. 2016, 9, 2024–2035. [Google Scholar] [CrossRef] [PubMed]
  4. Xu, B.; Tu, S.; Qiao, S.; Qu, X.; Chen, Y.; Yang, J.; Guo, L.; Sun, Z.; Li, Z.; Tian, F.; et al. Diagnostic Accuracy of Angiography-Based Quantitative Flow Ratio Measurements for Online Assessment of Coronary Stenosis. J. Am. Coll. Cardiol. 2017. [Google Scholar] [CrossRef]
  5. Smit, J.M.; Koning, G.; van Rosendael, A.R.; El Mahdiui, M.; Mertens, B.J.; Schalij, M.J.; Jukema, J.W.; Delgado, V.; Reiber, J.H.C.; Bax, J.J.; et al. Referral of patients for fractional flow reserve using quantitative flow ratio. Eur. Heart J. Cardiovasc. Imaging 2019, 20, 1231–1238. [Google Scholar] [CrossRef]
  6. Cortés, C.; Carrasco-Moraleja, M.; Aparisi, A.; Rodriguez-Gabella, T.; Campo, A.; Gutiérrez, H.; Julca, F.; Gómez, I.; San Román, J.A.; Amat-Santos, I.J. Quantitative flow ratio-Meta-analysis and systematic review. Catheter. Cardiovasc. Interv. Off. J. Soc. Card. Angiogr. Interv. 2021, 97, 807–814. [Google Scholar] [CrossRef]
  7. Parise, H.; Maehara, A.; Stone, G.W.; Leon, M.B.; Mintz, G.S. Meta-analysis of randomized studies comparing intravascular ultrasound versus angiographic guidance of percutaneous coronary intervention in predrug-eluting stent era. Am. J. Cardiol. 2011, 107, 374–382. [Google Scholar] [CrossRef]
  8. Buccheri, S.; Franchina, G.; Romano, S.; Puglisi, S.; Venuti, G.; D’Arrigo, P.; Francaviglia, B.; Scalia, M.; Condorelli, A.; Barbanti, M.; et al. Clinical Outcomes Following Intravascular Imaging-Guided Versus Coronary Angiography–Guided Percutaneous Coronary Intervention with Stent Implantation: A Systematic Review and Bayesian Network Meta-Analysis of 31 Studies and 17,882 Patients. JACC Cardiovasc. Interv. 2017, 10, 2488–2498. [Google Scholar] [CrossRef]
  9. De Korte, C.L.; Pasterkamp, G.; van der Steen, A.F.; Woutman, H.A.; Bom, N. Characterization of plaque components with intravascular ultrasound elastography in human femoral and coronary arteries in vitro. Circulation 2000, 102, 617–623. [Google Scholar] [CrossRef] [Green Version]
  10. Waksman, R.; Legutk, J.; Singh, J.; Orlando, Q.; Marso, S.; Schloss, T.; Tugaoen, J.; DeVries, J.; Palmer, N.; Haude, M.; et al. Erratum: FIRST: Fractional Flow Reserve and Intravascular Ultrasound Relationship Study (Journal of the American College of Cardiology (2013) 61(917–23)). J. Am. Coll. Cardiol. 2015, 66, 335. [Google Scholar] [CrossRef]
  11. Park, S.J.; Ahn, J.M.; Kang, S.J.; Yoon, S.H.; Koo, B.K.; Lee, J.Y.; Kim, W.J.; Park, D.W.; Lee, S.W.; Kim, Y.H.; et al. Intravascular ultrasound-derived minimal lumen area criteria for functionally significant left main coronary artery stenosis. JACC Cardiovasc. Interv. 2014, 7, 868–874. [Google Scholar] [CrossRef] [Green Version]
  12. Usui, E.; Yonetsu, T.; Kanaji, Y.; Hoshino, M.; Yamaguchi, M.; Hada, M.; Hamaya, R.; Kanno, Y.; Murai, T.; Lee, T.; et al. Efficacy of optical coherence tomography-derived morphometric assessment in predicting the physiological significance of coronary stenosis: Head-to-head comparison with intravascular ultrasound. EuroIntervention 2018, 13, e2210–e2218. [Google Scholar] [CrossRef]
  13. Erlinge, D.; Maehara, A.; Ben-Yehuda, O.; Bøtker, H.E.; Maeng, M.; Kjøller-Hansen, L.; Engstrøm, T.; Matsumura, M.; Crowley, A.; Dressler, O.; et al. Identification of vulnerable plaques and patients by intracoronary near-infrared spectroscopy and ultrasound (PROSPECT II): A prospective natural history study. Lancet 2021, 397, 985–995. [Google Scholar] [CrossRef]
  14. Roleder, T.; Kovacic, J.C.; Ali, Z.; Sharma, R.; Cristea, E.; Moreno, P.; Sharma, S.K.; Narula, J.; Kini, A.S. Combined NIRS and IVUS imaging detects vulnerable plaque using a single catheter system: A head-to-head comparison with OCT. EuroIntervention 2014, 10, 303–311. [Google Scholar] [CrossRef]
  15. Goldstein, J.A.; Maini, B.; Dixon, S.R.; Brilakis, E.S.; Grines, C.L.; Rizik, D.G.; Powers, E.R.; Steinberg, D.H.; Shunk, K.A.; Weisz, G.; et al. Detection of lipid-core plaques by intracoronary near-infrared spectroscopy identifies high risk of periprocedural myocardial infarction. Circ. Cardiovasc. Interv. 2011, 4, 429–437. [Google Scholar] [CrossRef] [Green Version]
  16. Sakhuja, R.; Suh, W.M.; Jaffer, F.A.; Jang, I.K. Residual thrombogenic substrate after rupture of a lipid-rich plaque: Possible mechanism of acute stent thrombosis?: A near-infrared spectroscopy study. Circulation 2010, 122, 2349–2350. [Google Scholar] [CrossRef] [Green Version]
  17. Tu, S.; Reiber, J.H.C.; Li, Y. Method and Device for Determining Deviation in Pressure in a Blood Vessel. U.S. Patent US9891044B2, 13 February 2018. [Google Scholar]
  18. Choi, H.; Choe, S. Therapeutic Effect Enhancement by Dual-Bias High-Voltage Circuit of Transmit Amplifier for Immersion Ultrasound Transducer Applications. Sensors 2018, 18, 4210. [Google Scholar] [CrossRef] [Green Version]
  19. Mirmiran, P.; Esmaillzadeh, A.; Azizi, F. Detection of cardiovascular risk factors by anthropometric measures in Tehranian adults: Receiver operating characteristic (ROC) curve analysis. Eur. J. Clin. Nutr. 2004, 58, 1110–1118. [Google Scholar] [CrossRef] [Green Version]
  20. Echavarría-Pinto, M.; Gonzalo, N.; Ibañez, B.; Petraco, R.; Jimenez-Quevedo, P.; Sen, S.; Nijjer, S.; Tarkin, J.; Alfonso, F.; Núñez-Gil, I.J.; et al. Low coronary microcirculatory resistance associated with profound hypotension during intravenous adenosine infusion implications for the functional assessment of coronary stenoses. Circ. Cardiovasc. Interv. 2014. [Google Scholar] [CrossRef] [Green Version]
  21. Mejía-Rentería, H.; Lauri, F.M.; Lee, J.M.; McInerney, A.; van der Hoeven, N.W.; de Waard, G.A.; Fernández-Ortiz, A.; Macaya, C.; Knaapen, P.; van Royen, N.; et al. Interindividual Variations in the Adenosine-Induced Hemodynamics During Fractional Flow Reserve Evaluation: Implications for the Use of Quantitative Flow Ratio in Assessing Intermediate Coronary Stenoses. J. Am. Heart Assoc. 2019. [Google Scholar] [CrossRef]
  22. Wilson, R.F.; Wyche, K.; Christensen, B.V.; Zimmer, S.; Laxson, D.D. Effects of adenosine on human coronary arterial circulation. Circulation 1990. [Google Scholar] [CrossRef] [Green Version]
  23. Westra, J.; Andersen, B.K.; Campo, G.; Matsuo, H.; Koltowski, L.; Eftekhari, A.; Liu, T.; Di Serafino, L.; Di Girolamo, D.; Escaned, J.; et al. Diagnostic performance of in-procedure angiography-derived quantitative flow reserve compared to pressure-derived fractional flow reserve: The FAVOR II Europe-Japan study. J. Am. Heart Assoc. 2018, 7. [Google Scholar] [CrossRef] [Green Version]
  24. Hwang, D.; Choi, K.H.; Lee, J.M.; Mejía-Rentería, H.; Kim, J.; Park, J.; Rhee, T.M.; Jeon, K.H.; Lee, H.J.; Kim, H.K.; et al. Diagnostic Agreement of Quantitative Flow Ratio with Fractional Flow Reserve and Instantaneous Wave-Free Ratio. J. Am. Heart Assoc. 2019. [Google Scholar] [CrossRef] [Green Version]
  25. Westra, J.; Tu, S.; Winther, S.; Nissen, L.; Vestergaard, M.B.; Andersen, B.K.; Holck, E.N.; Maule, C.F.; Johansen, J.K.; Andreasen, L.N.; et al. Evaluation of Coronary Artery Stenosis by Quantitative Flow Ratio during Invasive Coronary Angiography: The WIFI II Study (Wire-Free Functional Imaging II). Circ. Cardiovasc. Imaging 2018. [Google Scholar] [CrossRef]
  26. Tanigaki, T.; Emori, H.; Kawase, Y.; Kubo, T.; Omori, H.; Shiono, Y.; Sobue, Y.; Shimamura, K.; Hirata, T.; Matsuo, Y.; et al. QFR Versus FFR Derived from Computed Tomography for Functional Assessment of Coronary Artery Stenosis. JACC Cardiovasc. Interv. 2019. [Google Scholar] [CrossRef]
  27. Zuo, W.; Yang, M.; Chen, Y.; Xie, A.; Chen, L.; Ma, G. Meta-Analysis of Diagnostic Performance of Instantaneous Wave-Free Ratio versus Quantitative Flow Ratio for Detecting the Functional Significance of Coronary Stenosis. Biomed Res. Int. 2019, 2019, 5828931. [Google Scholar] [CrossRef]
  28. Kleczyński, P.; Dziewierz, A.; Rzeszutko, Ł.; Dudek, D.; Legutko, J. Borderline coronary lesion assessment with quantitative flow ratio and its relation to the instantaneous wave-free ratio. Adv. Med. Sci. 2021, 66, 1–5. [Google Scholar] [CrossRef]
  29. Masdjedi, K.; van Zandvoort, L.J.C.; Balbi, M.M.; Gijsen, F.J.H.; Ligthart, J.M.R.; Rutten, M.C.M.; Lemmert, M.E.; Wilschut, J.; Diletti, R.; De Jaegere, P.; et al. Validation of 3-Dimensional Quantitative Coronary Angiography based software to calculate Fractional Flow Reserve: Fast Assessment of STenosis severity (FAST)-study. EuroIntervention 2019. [Google Scholar] [CrossRef]
  30. Abizaid, A.S.; Mintz, G.S.; Mehran, R.; Abizaid, A.; Lansky, A.J.; Pichard, A.D.; Satler, L.F.; Wu, H.; Pappas, C.; Kent, K.M.; et al. Long-term follow-up after percutaneous transluminal coronary angioplasty was not performed based on intravascular ultrasound findings: Importance of lumen dimensions. Circulation 1999. [Google Scholar] [CrossRef] [Green Version]
  31. Okabe, T.; Mintz, G.S.; Buch, A.N.; Roy, P.; Hong, Y.J.; Smith, K.A.; Torguson, R.; Gevorkian, N.; Xue, Z.; Satler, L.F.; et al. Intravascular Ultrasound Parameters Associated with Stent Thrombosis After Drug-Eluting Stent Deployment. Am. J. Cardiol. 2007. [Google Scholar] [CrossRef]
  32. Voros, S.; Rinehart, S.; Vazquez-Figueroa, J.G.; Kalynych, A.; Karmpaliotis, D.; Qian, Z.; Joshi, P.H.; Anderson, H.; Murrieta, L.; Wilmer, C.; et al. Prospective, head-to-head comparison of quantitative coronary angiography, quantitative computed tomography angiography, and intravascular ultrasound for the prediction of hemodynamic significance in intermediate and severe lesions, using fractional flow. Am. J. Cardiol. 2014. [Google Scholar] [CrossRef] [PubMed] [Green Version]
  33. Kang, S.J.; Lee, J.Y.; Ahn, J.M.; Mintz, G.S.; Kim, W.J.; Park, D.W.; Yun, S.C.; Lee, S.W.; Kim, Y.H.; Lee, C.W.; et al. Validation of intravascular ultrasound-derived parameters with fractional flow reserve for assessment of coronary stenosis severity. Circ. Cardiovasc. Interv. 2011. [Google Scholar] [CrossRef] [PubMed] [Green Version]
  34. D’Ascenzo, F.; Barbero, U.; Cerrato, E.; Lipinski, M.J.; Omedè, P.; Montefusco, A.; Taha, S.; Naganuma, T.; Reith, S.; Voros, S.; et al. Accuracy of intravascular ultrasound and optical coherence tomography in identifying functionally significant coronary stenosis according to vessel diameter: A meta-analysis of 2581 patients and 2807 lesions. Am. Heart J. 2015. [Google Scholar] [CrossRef] [PubMed]
  35. Gonzalo, N.; Escaned, J.; Alfonso, F.; Nolte, C.; Rodriguez, V.; Jimenez-Quevedo, P.; Bañuelos, C.; Fernández-Ortiz, A.; Garcia, E.; Hernandez-Antolin, R.; et al. Morphometric Assessment of Coronary Stenosis Relevance With Optical Coherence Tomography. J. Am. Coll. Cardiol. 2012. [Google Scholar] [CrossRef] [Green Version]
  36. Waxman, S.; Dixon, S.R.; L’Allier, P.; Moses, J.W.; Petersen, J.L.; Cutlip, D.; Tardif, J.C.; Nesto, R.W.; Muller, J.E.; Hendricks, M.J.; et al. In Vivo Validation of a Catheter-Based Near-Infrared Spectroscopy System for Detection of Lipid Core Coronary Plaques. Initial Results of the SPECTACL Study. JACC Cardiovasc. Imaging 2009, 2, 858–868. [Google Scholar] [CrossRef] [Green Version]
  37. Gardner, C.M.; Tan, H.; Hull, E.L.; Lisauskas, J.B.; Sum, S.T.; Meese, T.M.; Jiang, C.; Madden, S.P.; Caplan, J.D.; Burke, A.P.; et al. Detection of Lipid Core Coronary Plaques in Autopsy Specimens with a Novel Catheter-Based Near-Infrared Spectroscopy System. JACC Cardiovasc. Imaging 2008, 1, 638–648. [Google Scholar] [CrossRef] [Green Version]
  38. Farb, A.; Burke, A.P.; Kolodgie, F.D.; Virmani, R. Pathological mechanisms of fatal late coronary stent thrombosis in humans. Circulation 2003, 108, 1701–1706. [Google Scholar] [CrossRef] [Green Version]
  39. Schuurman, A.S.; Vroegindewey, M.; Kardys, I.; Oemrawsingh, R.M.; Cheng, J.M.; De Boer, S.; Garcia-Garcia, H.M.; Van Geuns, R.J.; Regar, E.S.; Daemen, J.; et al. Near-infrared spectroscopy-derived lipid core burden index predicts adverse cardiovascular outcome in patients with coronary artery disease during long-term follow-up. Eur. Heart J. 2018, 39, 295–301. [Google Scholar] [CrossRef] [Green Version]
  40. Oemrawsingh, R.M.; Cheng, J.M.; García-García, H.M.; Van Geuns, R.J.; De Boer, S.P.M.; Simsek, C.; Kardys, I.; Lenzen, M.J.; Van Domburg, R.T.; Regar, E.; et al. Near-infrared spectroscopy predicts cardiovascular outcome in patients with coronary artery disease. J. Am. Coll. Cardiol. 2014, 64, 2510–2518. [Google Scholar] [CrossRef]
Figure 1. Flowchart of patient selection.
Diagnostics 11 01148 g001
Figure 2. Representative of QFR-NIRS-IVUS imaging before stent implantation: (a) baseline angiography, (b) QFR, (c) IVUS and (d) NIRS analysis of a patient with stenosis of the LAD.
Diagnostics 11 01148 g002
Figure 3. ROC curves of anatomical parameters predicting QFR ≤ 0.8. (a) The ROC curve for percent diameter stenosis derived from angiography. Best cut-off 59.5%; (b) The ROC curve for MLD derived from IVUS. Best cut-off 1.6 mm; (c) The ROC curve for MLA derived from IVUS. Best cut-off 2.4 mm2.
Diagnostics 11 01148 g003aDiagnostics 11 01148 g003b
Table 1. Patient characteristics.
QFR-Positive
n = 37
QFR-Negative
n = 29
p
Clinical Demographics
Age (years)63.3 ± 10.3462.8 ± 10.90.767
Body mass index kg/m221.89 ± 12.8718.7 ± 12.30.538
Prior MI n%4 (10.8)7 (24.1)0.833
Prior PCI n%4 (10.8)10 (34.5)0.016
Prior CABG n%0 (0)0 (0.0)
Dyslipidemia n%13 (35.1)18 (62.0)0.114
Hypertension n%16 (43.2)23 (79.3)0.246
Diabetes mellitus n%8 (21.6)6 (20.7)0.925
TCH154.3 ± 36.9128.0 ± 45.00.093
LDL71.8 ± 38.480.0 ± 28.70.511
HDL41.46 ± 13.5231.4 ± 19.90.120
TG124.5 (77.75, 145.25)76 (48.0, 136.0)0.656
GFR61.6 ± 23.1557.8 ± 27.470.681
Table 1: Variables are displayed as mean ± SD when a normal distribution is present, or as median (1st–3rd quartile) when a normal distribution is not present. For each variable, the percentage of patients involved (n%) is given.
Table 2. NIRS, IVUS and QFR characteristics.
QFR-PositiveQFR-Negativep
Indication for Coronary Angiography
ACS10 (27.0)6 (20.7)0.771
Lesion Location
LAD19 (51.3)12 (41.4)
Cx11 (29.7)7 (24.1)
RCA7 (19.0)10 (34.5)
QFR Analysis
Diameter stenosis71.98 ± 8.6749.42 ± 12.130.000
Vessel QFR contrast0.67 ± 0.140.9 ± 0.060.000
IVUS Analysis
Stenosis length27.7 ± 10.7422.91 ± 11.020.480
Lumen volume126.97 ± 68.51133.93 ± 81.560.737
EEM volume353.74 ± 207.49327.2 ± 222.50.658
EEM area at MLA10.59 ± 3.413.04 ± 5.50.048
Plaque volume226.16 ± 155.57193.27 ± 149.160.252
Plaque burden77.2 ± 7.8275.01 ± 7.430.286
Minimal lumen area2.2 ± 0.423.12 ± 1.440.007
Minimal lumen diameter1.5 (1.5, 1.6)1.7 (1.5, 1.9)0.001
Total plaque area8.3 (5.45, 10.55)8.4 (7.5, 10.85)0.347
RI1.02 (0.8, 1.27)1.00 (0.84, 1.44)0.690
MLA < 2.4 mm228 (75.67)9 (31.0)0.000
NIRS Analysis
maxLCBI4mm450.12 ± 251.0329.47 ± 191.140.046
TCFA lesions22 (59.45)21 (72.41)0.276
Table 2: Variables are displayed as mean ± SD when a normal distribution is present or as median (1st–3rd quartile) when there a normal distribution is not present. For each variable, the percentage of patients involved (n%) is given. ACS—acute coronary syndrome; Cx—circumflex coronary artery; EEM—external elastic membrane; LAD—left anterior descending; maxLCBI4mm—maximal lipid core burden index in 4 mm; MLA—minimal lumen area; RI—remodeling index; RCA—right coronary artery; TCFA—predicted thin cap fibrous atheroma by NIRS.
Table 3. The correlations between MLA, PB, MaxLCBI4mm, PV, MLD and vessel contrast QFR.
QFR-Positive QFR-Negative
Vessel QFR (r)pVessel QFR (r)p
MLA0.1510.7210.1510.435
PB−0.2270.176−0.1770.358
maxLCBI4mm−0.1980.239−0.0330.866
PV−0.2290.173−0.2120.271
MLD0.0640.7220.3880.082
Table 3: maxLCBI4mm—maximal lipid core burden index in 4 mm; MLA—minimal lumen area; MLD—minimal lumen diameter; PB—plaque burden; PV—plaque volume.
Publisher’s Note: MDPI stays neutral with regard to jurisdictional claims in published maps and institutional affiliations.

