
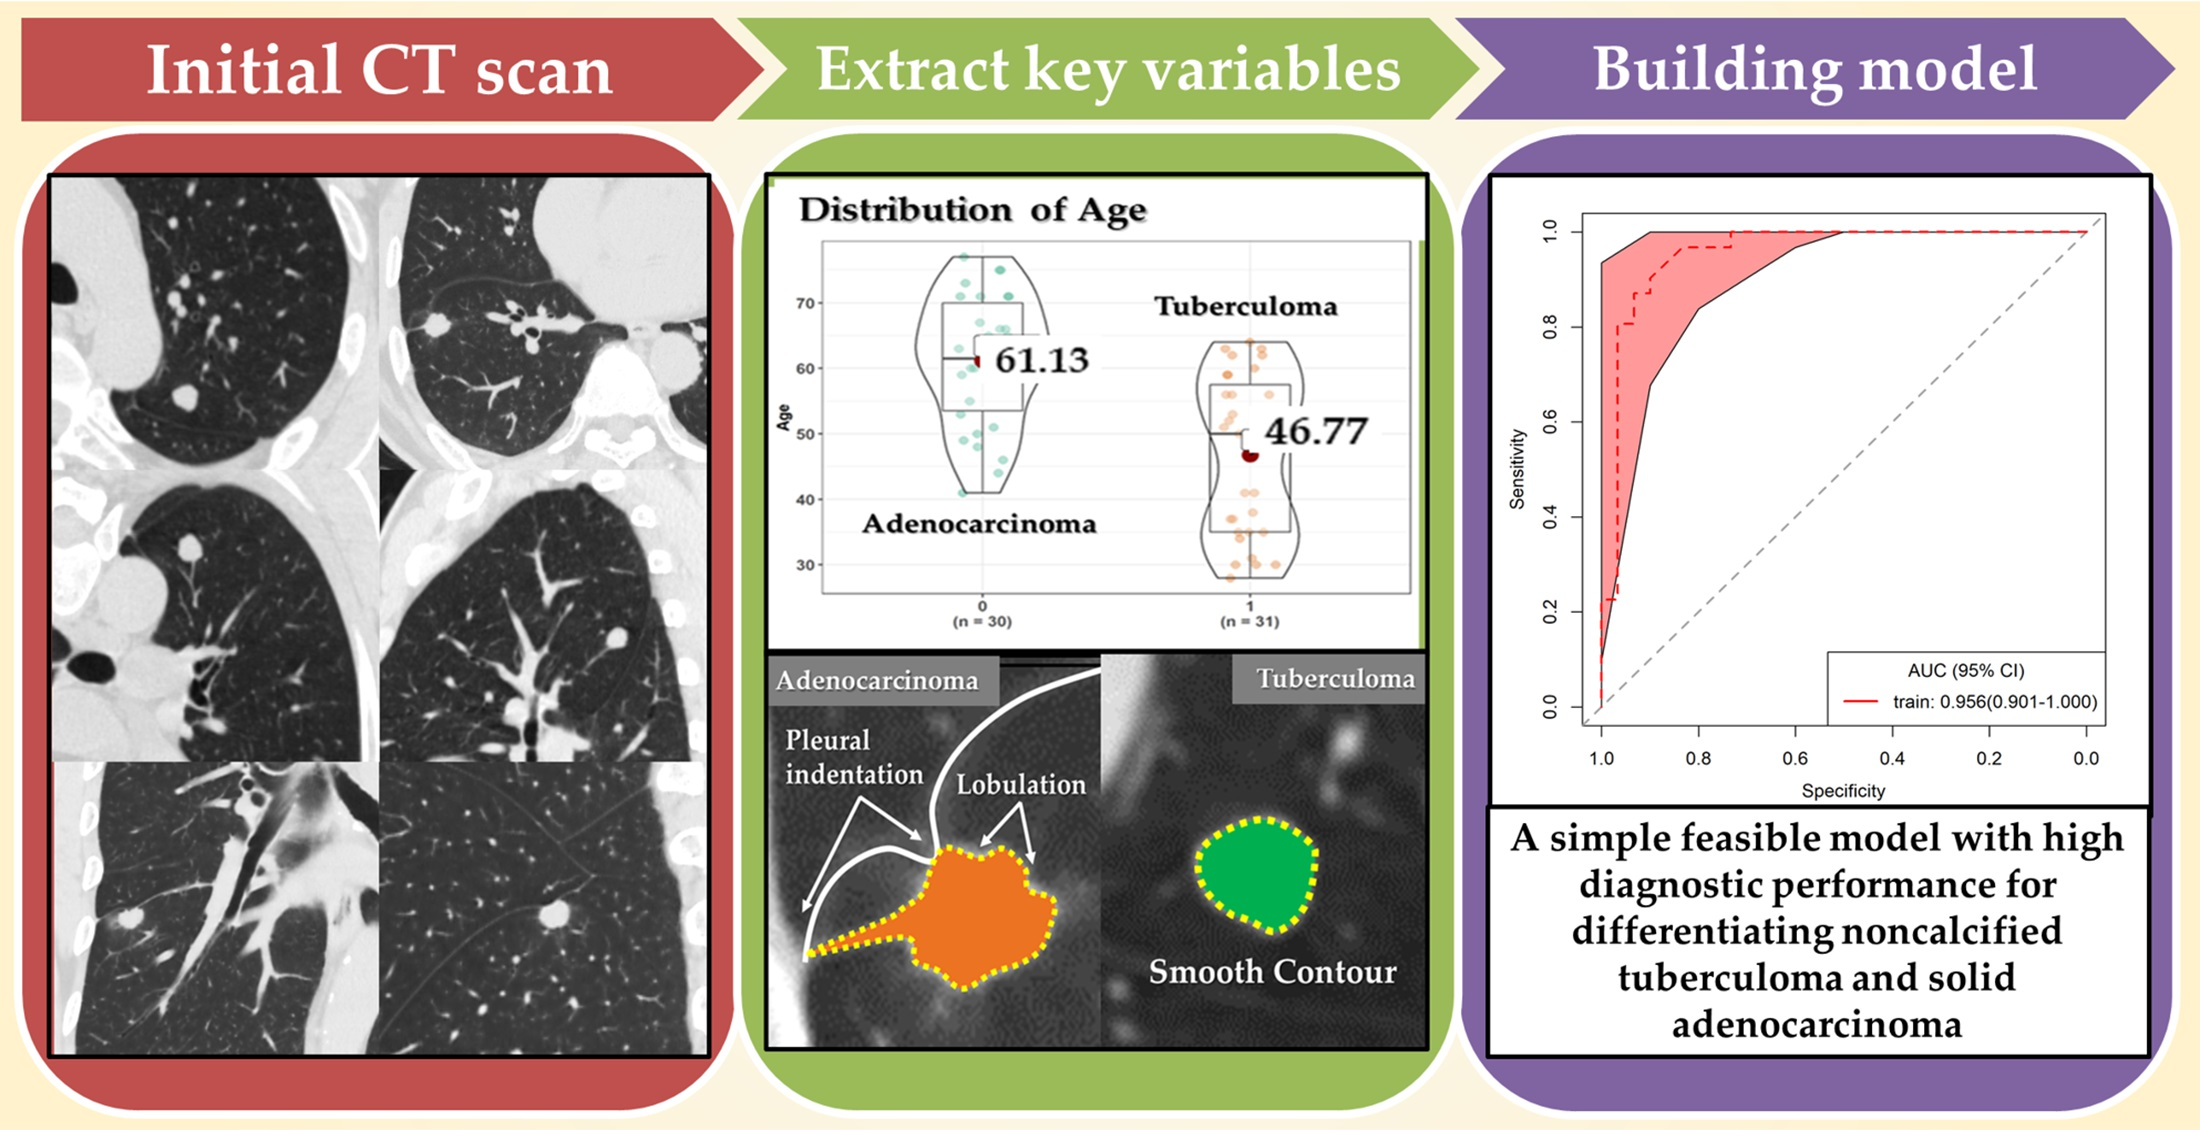
Discriminating Small-Sized (2 cm or Less), Noncalcified, Solitary Pulmonary Tuberculoma and Solid Lung Adenocarcinoma in Tuberculosis-Endemic Areas

 ,
,  , , and
Abstract

1. Introduction
2. Materials and Methods
2.1. Subjects
2.2. CT Imaging
2.3. Statistical Analysis
3. Results
3.1. Clinical Characteristics and Tumor Markers
3.2. CT Morphological Features
4. Discussion
5. Limitation and Future Work
6. Conclusions
Author Contributions
Funding
Institutional Review Board Statement
Informed Consent Statement
Data Availability Statement
Conflicts of Interest
References
- Global Tuberculosis Report 2019; World Health Organization: Geneva, Switzerland, 2019; Available online: https://www.who.int/ (accessed on 16 December 2019).
- Cardinale, L.; Parlatano, D.; Boccuzzi, F.; Onoscuri, M.; Volpicelli, G.; Veltri, A. The imaging spectrum of pulmonary tuberculosis. Acta Radiol. 2015, 56, 557–564. [Google Scholar] [CrossRef] [PubMed]
- Skoura, E.; Zumla, A.; Bomanji, J. Imaging in tuberculosis. Int. J. Infect. Dis. 2015, 32, 87–93. [Google Scholar] [CrossRef]
- Niyonkuru, A.; Chen, X.; Bakari, K.H.; Wimalarathne, D.N.; Bouhari, A.; Arnous, M.; Lan, X. Evaluation of the diagnostic efficacy of 18 F-Fluorine-2-Deoxy-D-Glucose PET/CT for lung cancer and pulmonary tuberculosis in a Tuberculosis-endemic Country. Cancer Med. 2020, 9, 931–942. [Google Scholar] [CrossRef]
- Patel, V.K.; Naik, S.K.; Naidich, D.P.; Travis, W.D.; Weingarten, J.A.; Lazzaro, R.; Gutterman, D.D.; Wentowski, C.; Grosu, H.B.; Raoof, S. A practical algorithmic approach to the diagnosis and management of solitary pulmonary nodules: Part 1: Radiologic characteristics and imaging modalities. Chest 2013, 143, 825–839. [Google Scholar] [CrossRef]
- De Groot, P.; Munden, R.F. Lung cancer epidemiology, risk factors, and prevention. Radiol. Clin. North. Am. 2012, 50, 863–876. [Google Scholar] [CrossRef]
- Ito, K.; Morooka, M.; Minamimoto, R.; Miyata, Y.; Okasaki, M.; Kubota, K. Imaging spectrum and pitfalls of ¹⁸F-fluorodeoxyglucose positron emission tomography/computed tomography in patients with tuberculosis. Jpn. J. Radiol. 2013, 31, 511–520. [Google Scholar] [CrossRef] [PubMed]
- Feng, M.; Yang, X.; Ma, Q.; He, Y. Retrospective analysis for the false positive diagnosis of PET-CT scan in lung cancer patients. Medicine 2017, 96, e7415. [Google Scholar] [CrossRef] [PubMed]
- Li, C.R.; Li, Y.Z.; Li, Y.M.; Zheng, Y.S. Dynamic and contrast enhanced CT imaging of lung carcinoma, pulmonary tuberculoma, and inflammatory pseudotumor. Eur. Rev. Med. Pharmacol. Sci. 2017, 21, 1588–1592. [Google Scholar] [PubMed]
- Tateishi, U.; Kusumoto, M.; Akiyama, Y.; Kishi, F.; Nishimura, M.; Moriyama, N. Role of contrast-enhanced dynamic CT in the diagnosis of active tuberculoma. Chest 2002, 122, 1280–1284. [Google Scholar] [CrossRef]
- Wood, D.E.; Kazerooni, E.A.; Baum, S.L.; Eapen, G.A.; Ettinger, D.S.; Hou, L.; Jackman, D.M.; Klippenstein, D.; Kumar, R.; Lackner, R.P.; et al. Lung Cancer Screening, Version 3.2018, NCCN Clinical Practice Guidelines in Oncology. J. Natl. Compr. Canc. Netw. 2018, 16, 412–441. [Google Scholar] [CrossRef]
- Hansell, D.M.; Bankier, A.A.; MacMahon, H.; McLoud, T.C.; Müller, N.L.; Remy, J. Fleischner Society: Glossary of terms for thoracic imaging. Radiology 2008, 246, 697–722. [Google Scholar] [CrossRef] [PubMed]
- MacMahon, H.; Naidich, D.P.; Goo, J.M.; Lee, K.S.; Leung, A.; Mayo, J.R.; Mehta, A.C.; Ohno, Y.; Powell, C.A.; Prokop, M.; et al. Guidelines for Management of Incidental Pulmonary Nodules Detected on CT Images: From the Fleischner Society 2017. Radiology 2017, 284, 228–243. [Google Scholar] [CrossRef]
- Feng, B.; Chen, X.; Chen, Y.; Lu, S.; Liu, K.; Li, K.; Liu, Z.; Hao, Y.; Li, Z.; Zhu, Z.; et al. Solitary solid pulmonary nodules: A CT-based deep learning nomogram helps differentiate tuberculosis granulomas from lung adenocarcinomas. Eur. Radiol. 2020, 30, 6497–6507. [Google Scholar] [CrossRef] [PubMed]
- Beig, N.; Khorrami, M.; Alilou, M.; Prasanna, P.; Braman, N.; Orooji, M.; Rakshit, S.; Bera, K.; Rajiah, P.; Ginsberg, J.; et al. Perinodular and Intranodular Radiomic Features on Lung CT Images Distinguish Adenocarcinomas from Granulomas. Radiology 2019, 290, 783–792. [Google Scholar] [CrossRef] [PubMed]
- Kim, H.; Kang, S.J.; Suh, G.Y.; Chung, M.P.; Kwon, O.J.; Rhee, C.H.; Jung, K.J.; Kim, T.S.; Lee, K.S. Predictors for benign solitary pulmonary nodule in tuberculosis-endemic area. Korean J. Intern. Med. 2001, 16, 236–241. [Google Scholar] [CrossRef]
- Lang, S.; Sun, J.; Wang, X.; Xiao, Y.; Wang, J.; Zhang, M.; Ao, T.; Wang, J. Asymptomatic pulmonary tuberculosis mimicking lung cancer on imaging: A retrospective study. Exp. Ther. Med. 2017, 14, 2180–2188. [Google Scholar] [CrossRef]
- McWilliams, A.; Tammemagi, M.C.; Mayo, J.R.; Roberts, H.; Liu, G.; Soghrati, K.; Yasufuku, K.; Martel, S.; Laberge, F.; Gingras, M.; et al. Probability of cancer in pulmonary nodules detected on first screening CT. N. Engl. J. Med. 2013, 369, 910–919. [Google Scholar] [CrossRef] [PubMed]
- Al-Rifai, R.H.; Pearson, F.; Critchley, J.A.; Abu-Raddad, L.J. Association between diabetes mellitus and active tuberculosis: A systematic review and meta-analysis. PLoS ONE 2017, 12, e0187967. [Google Scholar] [CrossRef]
- Hayashi, S.; Chandramohan, D. Risk of active tuberculosis among people with diabetes mellitus: Systematic review and meta-analysis. Trop. Med. Int. Health. 2018, 23, 1058–1070. [Google Scholar] [CrossRef]
- Hsieh, T.C.; Huang, W.W.; Lai, C.L.; Tsao, S.M.; Su, C.C. Diagnostic value of tumor markers in lung adenocarcinoma-associated cytologically negative pleural effusions. Cancer Cytopathol. 2013, 121, 483–488. [Google Scholar] [CrossRef]
- Li, X.; Asmitananda, T.; Gao, L.; Gai, D.; Song, Z.; Zhang, Y.; Ren, H.; Yang, T.; Chen, T.; Chen, M. Biomarkers in the lung cancer diagnosis: A clinical perspective. Neoplasma 2012, 59, 500–507. [Google Scholar] [CrossRef] [PubMed]
- Ma, J.; Yang, Y.L.; Wang, Y.; Zhang, X.W.; Gu, X.S.; Wang, Z.C. Relationship between computed tomography morphology and prognosis of patients with stage I non-small cell lung cancer. Onco. Targets Ther. 2017, 10, 2249–2256. [Google Scholar] [CrossRef] [PubMed]
- Kim, S.K.; Kim, T.J.; Chung, M.J.; Kim, T.S.; Lee, K.S.; Zo, J.I.; Shim, Y.M. Lung Adenocarcinoma: CT Features Associated with Spread through Air Spaces. Radiology 2018, 289, 831–840. [Google Scholar] [CrossRef] [PubMed]
- Im, J.G.; Itoh, H.; Shim, Y.S.; Lee, J.H.; Ahn, J.; Han, M.C.; Noma, S. Pulmonary tuberculosis: CT findings--early active disease and sequential change with antituberculous therapy. Radiology 1993, 186, 653–660. [Google Scholar] [CrossRef] [PubMed]
- Rossi, S.E.; Franquet, T.; Volpacchio, M.; Giménez, A.; Aguilar, G. Tree-in-bud pattern at thin-section CT of the lungs: Radiologic-pathologic overview. Radiographics 2005, 25, 789–801. [Google Scholar] [CrossRef] [PubMed]
- Im, J.G.; Itoh, H. Tree-in-Bud Pattern of Pulmonary Tuberculosis on Thin-Section CT: Pathological Implications. Korean J. Radiol. 2018, 19, 859–865. [Google Scholar] [CrossRef]
- Snoeckx, A.; Reyntiens, P.; Desbuquoit, D.; Spinhoven, M.J.; Van Schil, P.E.; van Meerbeeck, J.P.; Parizel, P.M. Evaluation of the solitary pulmonary nodule: Size matters, but do not ignore the power of morphology. Insights Imaging 2018, 9, 73–86. [Google Scholar] [CrossRef]
- Zwirewich, C.V.; Vedal, S.; Miller, R.R.; Müller, N.L. Solitary pulmonary nodule: High-resolution CT and radiologic-pathologic correlation. Radiology 1991, 179, 469–476. [Google Scholar] [CrossRef]
- Xu, D.M.; van Klaveren, R.J.; de Bock, G.H.; Leusveld, A.; Zhao, Y.; Wang, Y.; Vliegenthart, R.; de Koning, H.J.; Scholten, E.T.; Verschakelen, J.; et al. Limited value of shape, margin and CT density in the discrimination between benign and malignant screen detected solid pulmonary nodules of the NELSON trial. Eur. J. Radiol. 2008, 68, 347–352. [Google Scholar] [CrossRef]
- Miao, Y.; Zhang, J.; Zou, J.; Zhu, Q.; Lv, T.; Song, Y. Correlation in histological subtypes with high resolution computed tomography signatures of early stage lung adenocarcinoma. Transl. Lung Cancer Res. 2017, 6, 14–22. [Google Scholar] [CrossRef]
- Seki, N.; Fujita, Y.; Shibakuki, R.; Seto, T.; Uematsu, K.; Eguchi, K. Easier understanding of pleural indentation on computed tomography. Intern. Med. 2007, 46, 2029–2030. [Google Scholar] [CrossRef] [PubMed][Green Version]
- Travis, W.D.; Brambilla, E.; Rami-Porta, R.; Vallières, E.; Tsuboi, M.; Rusch, V.; Goldstraw, P. International Staging Committee. Visceral pleural invasion: Pathologic criteria and use of elastic stains: Proposal for the 7th edition of the TNM classification for lung cancer. J. Thorac. Oncol. 2008, 3, 1384–1390. [Google Scholar] [CrossRef] [PubMed]
- Kim, H.J.; Cho, J.Y.; Lee, Y.J.; Park, J.S.; Cho, Y.J.; Yoon, H.I.; Chung, J.H.; Cho, S.; Kim, K.; Lee, K.W.; et al. Clinical Significance of Pleural Attachment and Indentation of Subsolid Nodule Lung Cancer. Cancer Res. Treat. 2019, 51, 1540–1548. [Google Scholar] [CrossRef] [PubMed]
- Zhao, L.L.; Xie, H.K.; Zhang, L.P.; Zha, J.Y.; Zhou, F.Y.; Jiang, G.N.; Chen, C. Visceral pleural invasion in lung adenocarcinoma ≤ 3 cm with ground-glass opacity: A clinical, pathological and radiological study. J. Thorac. Dis. 2016, 8, 1788–1797. [Google Scholar] [CrossRef]
- Harders, S.W.; Madsen, H.H.; Rasmussen, T.R.; Hager, H.; Rasmussen, F. High-resolution spiral CT for determining the malignant potential of solitary pulmonary nodules: Refining and testing the test. Acta Radiol. 2011, 52, 401–409. [Google Scholar] [CrossRef] [PubMed]


| Characteristics | Tuberculoma no. (%) | Adenocarcinoma no. (%) | Total no. (%) | p-Value |
|---|---|---|---|---|
| No. | 31 | 30 | 61 | |
| Sex | 0.527 1 | |||
| Female | 13 (41.9%) | 15 (50.0%) | 28 (45.9%) | |
| Male | 18 (58.1%) | 15 (50.0%) | 33 (54.1%) | |
| Age | <0.001 2 | |||
| Mean (SD) | 46.8 (12.3) | 61.1 (9.9) | 53.8 (13.2) | |
| Median [Q1, Q3] | 50.0 [35.0, 57.5] | 61.5 [53.5, 70.0] | 56.0 [44.0, 63.0] | |
| Range | 28.0–64.0 | 41.0–77.0 | 28.0–77.0 | |
| Smoker | 11 (35.5%) | 12 (40.0%) | 23 (37.7%) | 0.716 1 |
| Smoking index | 0.545 2 | |||
| Mean (SD) | 166.13 (285.59) | 349.67 (789.56) | 256.39 (592.16) | |
| Median [Q1, Q3] | 0.00 [0.00, 175.00] | 0.00 [0.00, 425.00] | 0.00 [0.00, 200.00] | |
| Range | 0.00–900.00 | 0.00–4000.00 | 0.00–4000.00 | |
| Underlying disease | ||||
| Emphysema | 6 (19.4%) | 10 (33.3%) | 16 (26.2%) | 0.215 1 |
| Diabetes | 5 (16.1%) | 5 (16.7%) | 10 (16.4%) | 0.955 1 |
| Tumor marker | ||||
| CA125, >35 U/mL | 0.063 2 | |||
| N-Miss | 21 | 13 | 34 | |
| Median [Q1, Q3] | 7.80 [4.73, 11.70] | 12.10 [10.10, 17.20] | 10.70 [7.80, 16.20] | |
| CEA, >5 ng/mL | 0.057 2 | |||
| N-Miss | 16 | 8 | 24 | |
| Median [Q1, Q3] | 1.63 [1.25, 2.26] | 2.21 [1.72, 4.72] | 1.97 [1.57, 3.65] | |
| CT Features | Tuberculoma no. (%) | Adenocarcinoma no. (%) | Total no. (%) | p-Value |
|---|---|---|---|---|
| No. | 31 | 30 | 61 | |
| Maximum diameter | 0.756 2 | |||
| Median [Q1, Q3] | 1.45 [1.23, 1.86] | 1.57 [1.38, 1.83] | 1.520 [1.29, 1.8] | |
| Irregular shape | 17 (54.8%) | 21 (70.0%) | 38 (62.3%) | 0.222 1 |
| Clear margin | 27 (87.1%) | 30 (100.0%) | 57 (93.4%) | 0.042 1 |
| Lobulation | 9 (29.0%) | 28 (93.3%) | 37 (60.7%) | <0.001 1 |
| Spiculation | 26 (83.9%) | 29 (96.7%) | 55 (90.2%) | 0.093 1 |
| Perilesional GGO | 7 (22.6%) | 7 (23.3%) | 14 (23.0%) | 0.944 1 |
| Pleural indentation | 10 (32.3%) | 25 (83.3%) | 35 (57.4%) | <0.001 1 |
| Satellite lesions | 9 (29.0%) | 1 (3.3%) | 10 (16.4%) | 0.007 1 |
| Cavity | 3 (9.7%) | 3 (10.0%) | 6 (9.8%) | 0.966 1 |
| Vacuole | 4 (12.9%) | 1 (3.3%) | 5 (8.2%) | 0.173 1 |
| Air bronchogram | 3 (9.7%) | 2 (6.7%) | 5 (8.2%) | 0.668 1 |
| Vessel convergence | 22 (71.0%) | 30 (100.0%) | 52 (85.2%) | 0.001 1 |
| Perilesional tree-in-bud pattern | 8 (25.8%) | 0 (0.0%) | 8 (13.1%) | <0.001 1 |
| Lymphadenopathy | 1 (3.2%) | 2 (6.7%) | 3 (4.9%) | 0.534 1 |
| Location | 0.389 1 | |||
| LUL | 7 (22.6%) | 6 (20.0%) | 13 (21.3%) | |
| LLL | 7 (22.6%) | 6 (20.0%) | 13 (21.3%) | |
| RUL | 13 (41.9%) | 8 (26.7%) | 21 (34.4%) | |
| RLL | 3 (9.7%) | 6 (20.0%) | 9 (14.8%) | |
| RML | 1 (3.2%) | 4 (13.3%) | 5 (8.2%) | |
Publisher’s Note: MDPI stays neutral with regard to jurisdictional claims in published maps and institutional affiliations. |
© 2021 by the authors. Licensee MDPI, Basel, Switzerland. This article is an open access article distributed under the terms and conditions of the Creative Commons Attribution (CC BY) license (https://creativecommons.org/licenses/by/4.0/).
Share and Cite
Zhang, J.; Han, T.; Ren, J.; Jin, C.; Zhang, M.; Guo, Y. Discriminating Small-Sized (2 cm or Less), Noncalcified, Solitary Pulmonary Tuberculoma and Solid Lung Adenocarcinoma in Tuberculosis-Endemic Areas. Diagnostics 2021, 11, 930. https://doi.org/10.3390/diagnostics11060930
Zhang J, Han T, Ren J, Jin C, Zhang M, Guo Y. Discriminating Small-Sized (2 cm or Less), Noncalcified, Solitary Pulmonary Tuberculoma and Solid Lung Adenocarcinoma in Tuberculosis-Endemic Areas. Diagnostics. 2021; 11(6):930. https://doi.org/10.3390/diagnostics11060930
Chicago/Turabian StyleZhang, Jingping, Tingting Han, Jialiang Ren, Chenwang Jin, Ming Zhang, and Youmin Guo. 2021. "Discriminating Small-Sized (2 cm or Less), Noncalcified, Solitary Pulmonary Tuberculoma and Solid Lung Adenocarcinoma in Tuberculosis-Endemic Areas" Diagnostics 11, no. 6: 930. https://doi.org/10.3390/diagnostics11060930
APA StyleZhang, J., Han, T., Ren, J., Jin, C., Zhang, M., & Guo, Y. (2021). Discriminating Small-Sized (2 cm or Less), Noncalcified, Solitary Pulmonary Tuberculoma and Solid Lung Adenocarcinoma in Tuberculosis-Endemic Areas. Diagnostics, 11(6), 930. https://doi.org/10.3390/diagnostics11060930