
Association of Early Renal Dysfunction with Lipid Profile Parameters among Hypertensives in Kazakhstan

 ,
, 
Abstract
1. Introduction
2. Materials and Methods
2.1. Sampling
2.2. Variables
2.3. Data Sources/Measurements
2.3.1. Data Collection
2.3.2. Anthropometry Data and Blood Pressure Measurements
2.3.3. Laboratory Data
2.4. Diagnostic Criteria
2.4.1. Hypertension
2.4.2. Chronic Kidney Disease
2.4.3. eGFR Calculation
2.4.4. Metabolic Syndrome
2.4.5. Obesity
2.5. Biases
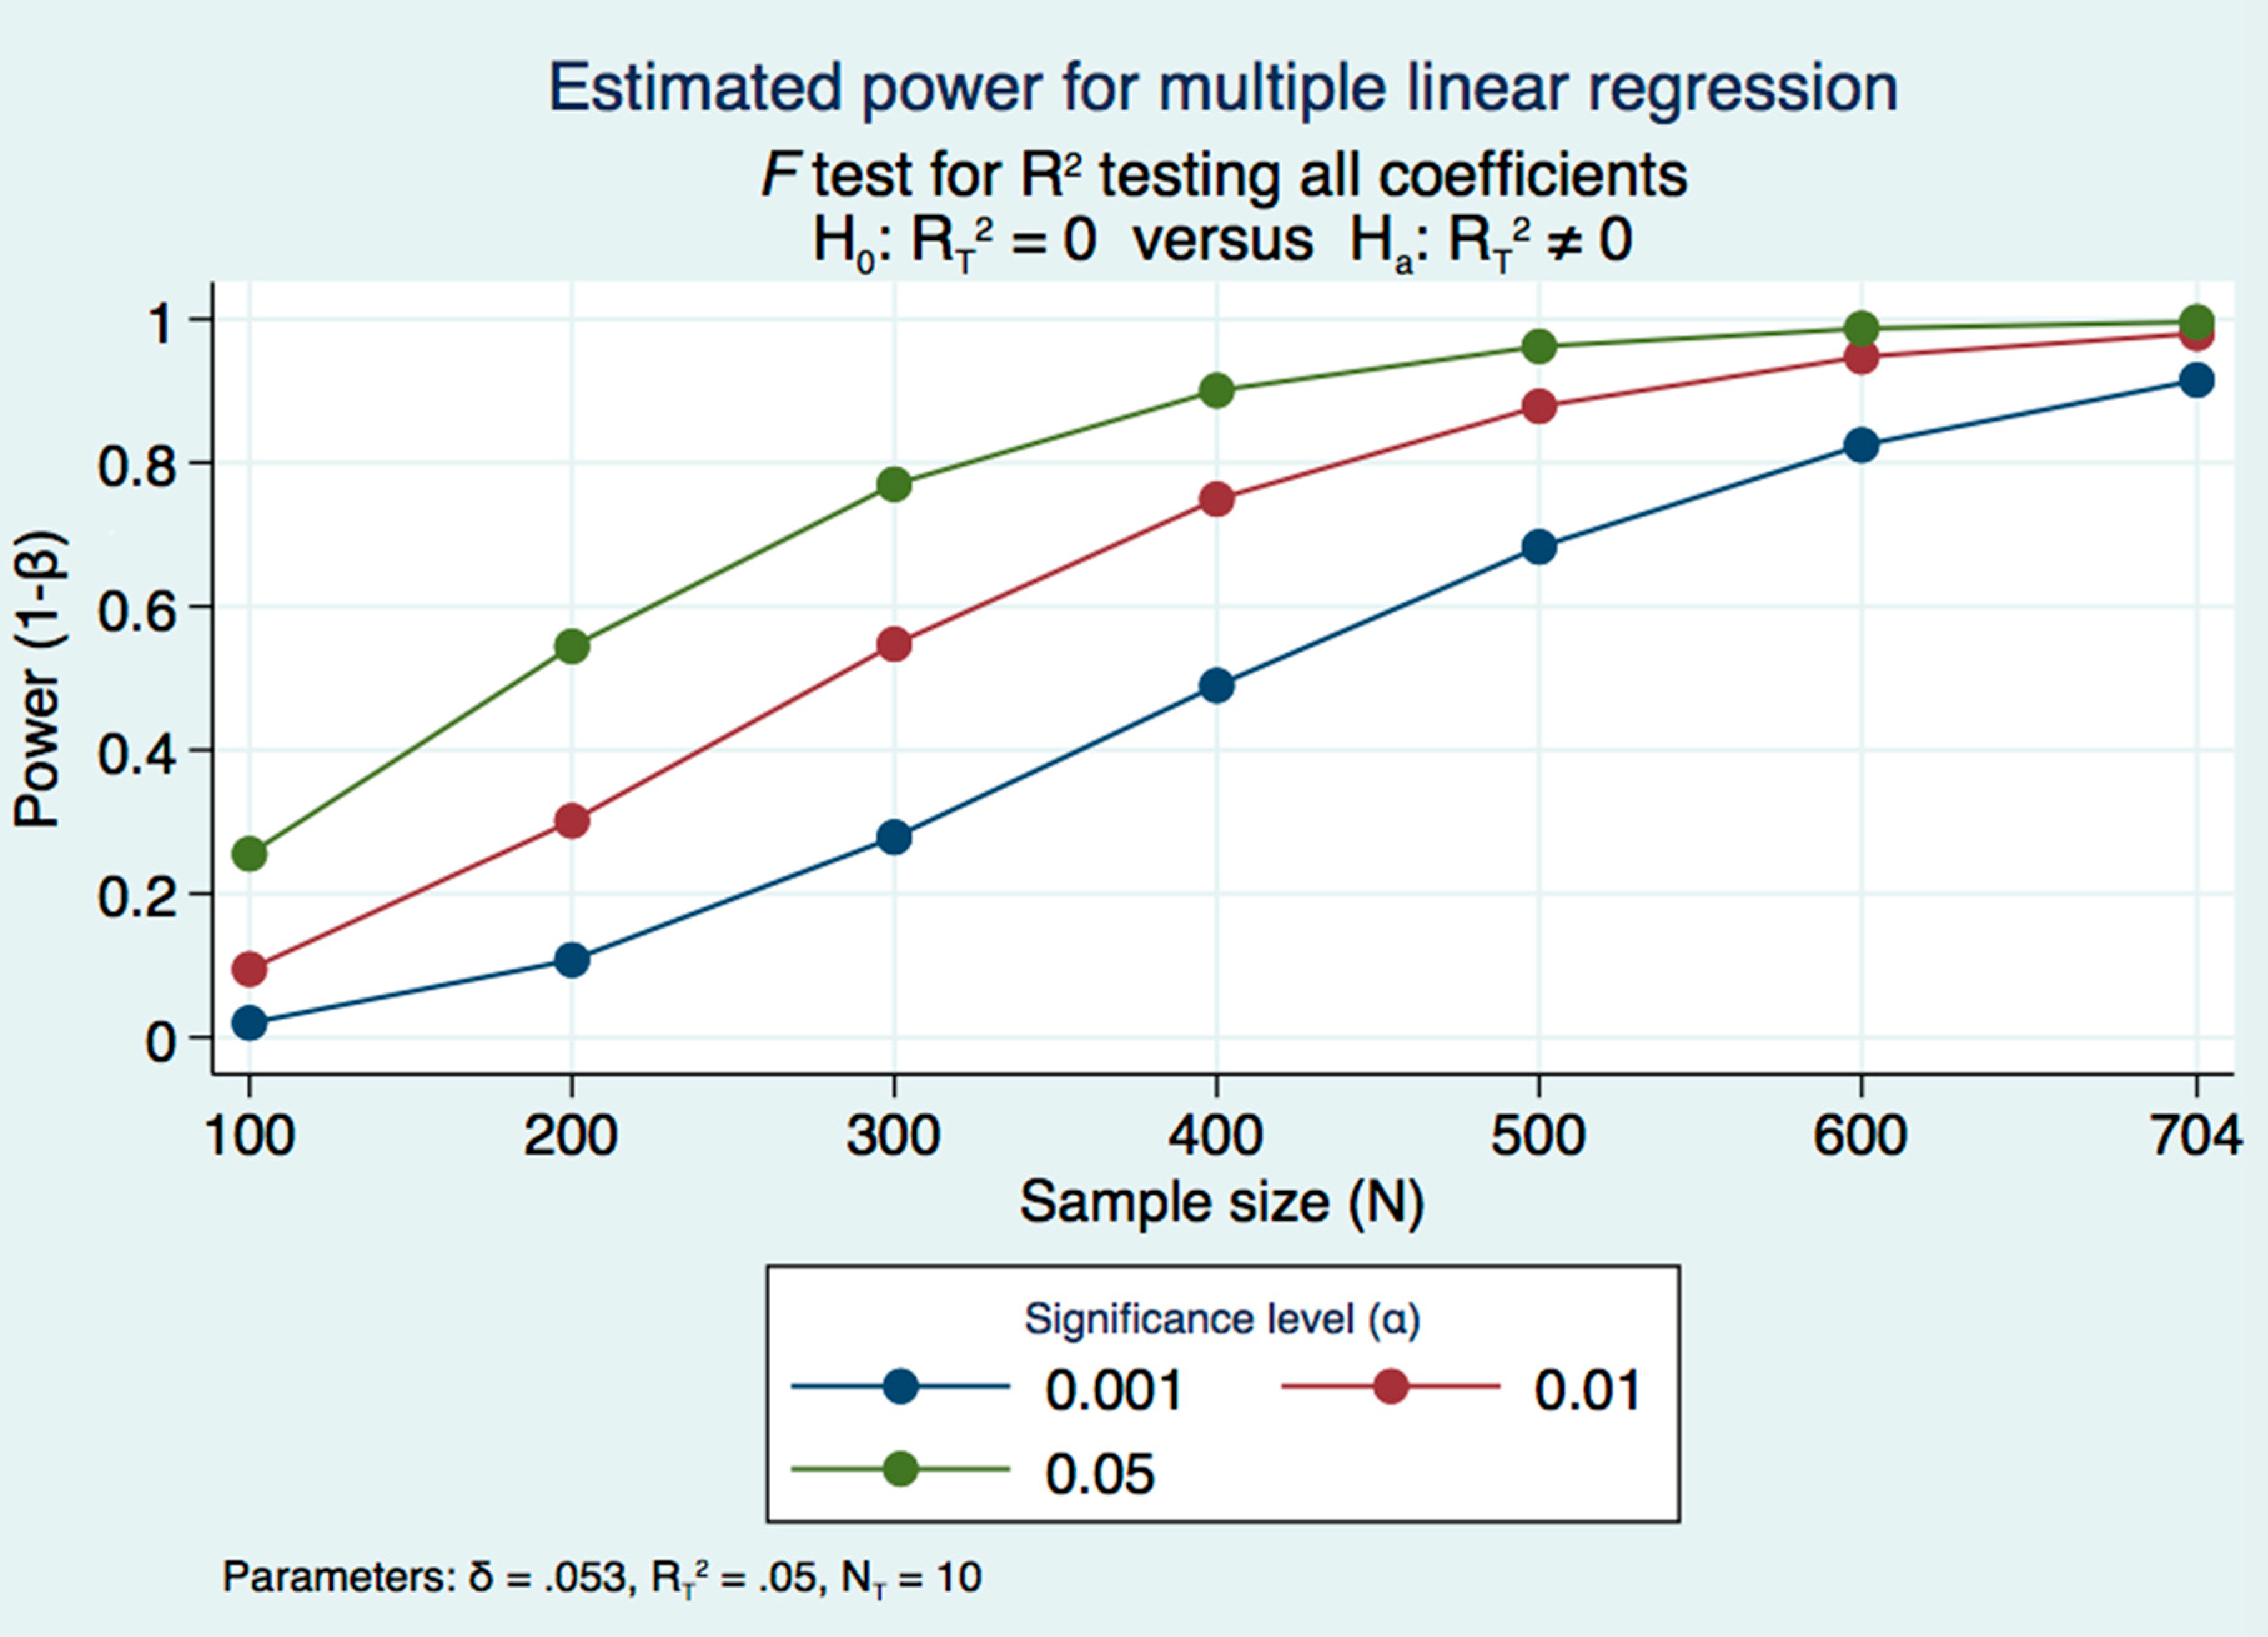
Study Size
2.6. Quantitative Variables
2.7. Statistical Methods
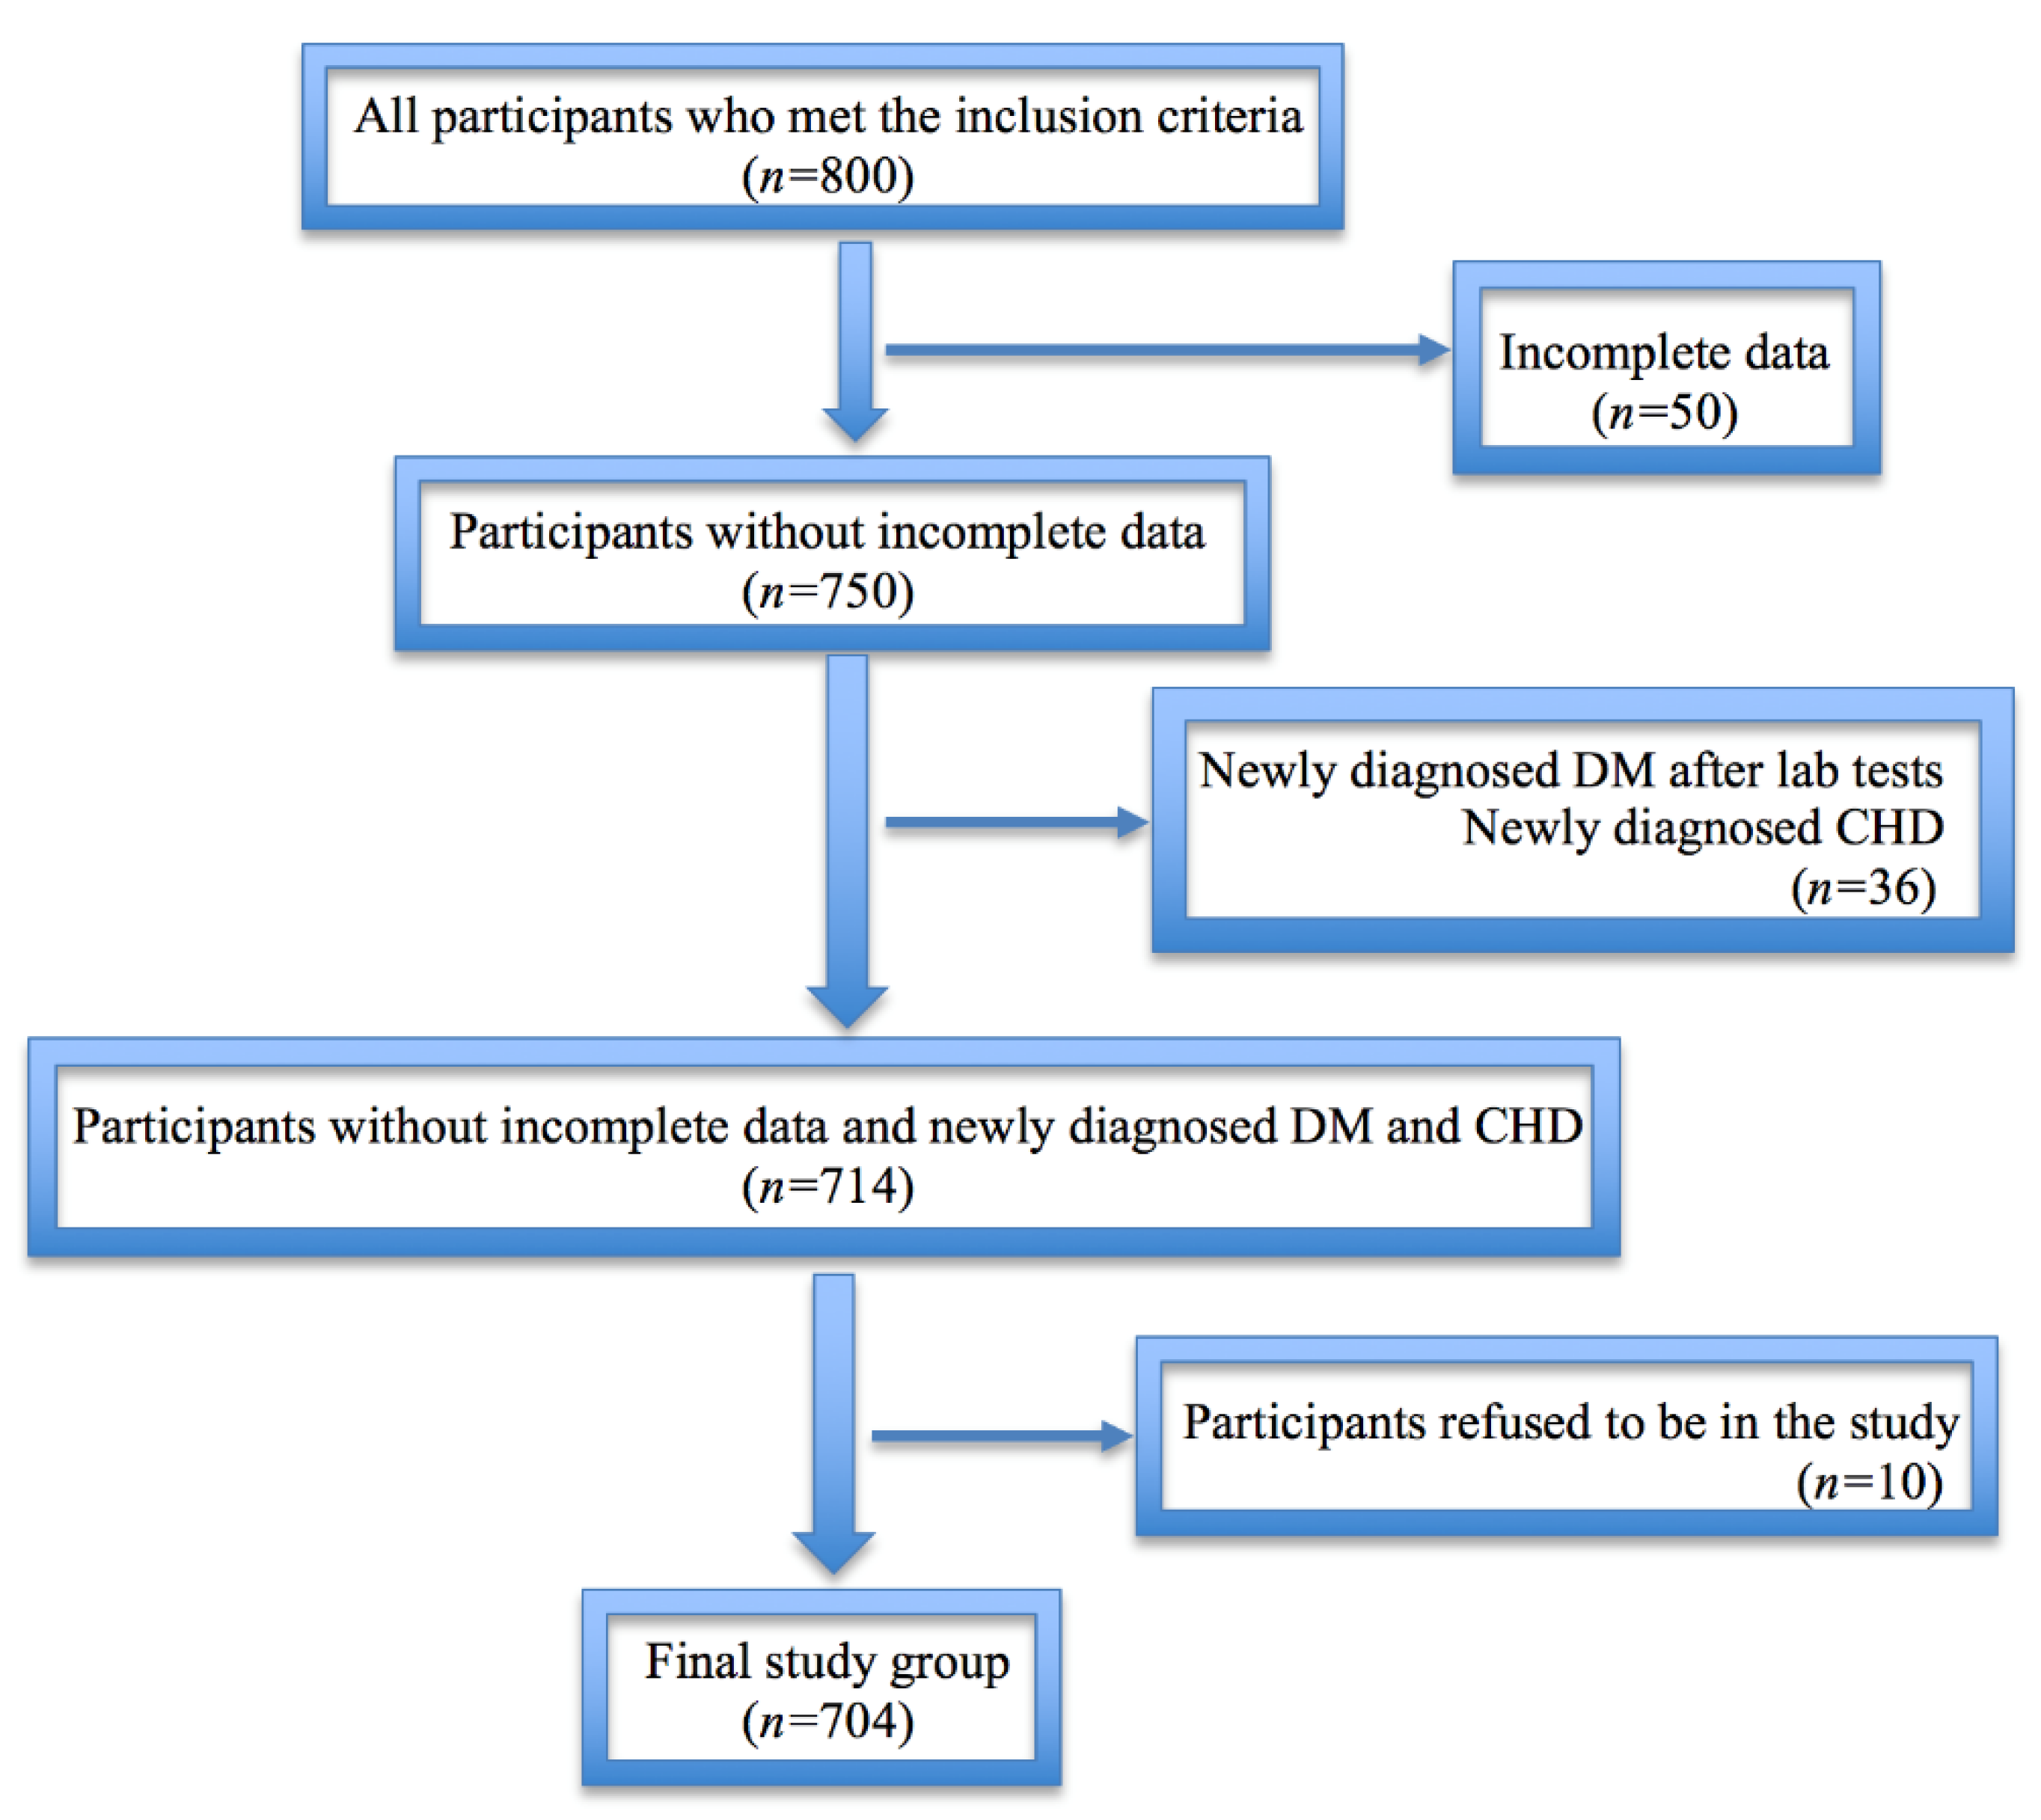
2.8. Participants
3. Results
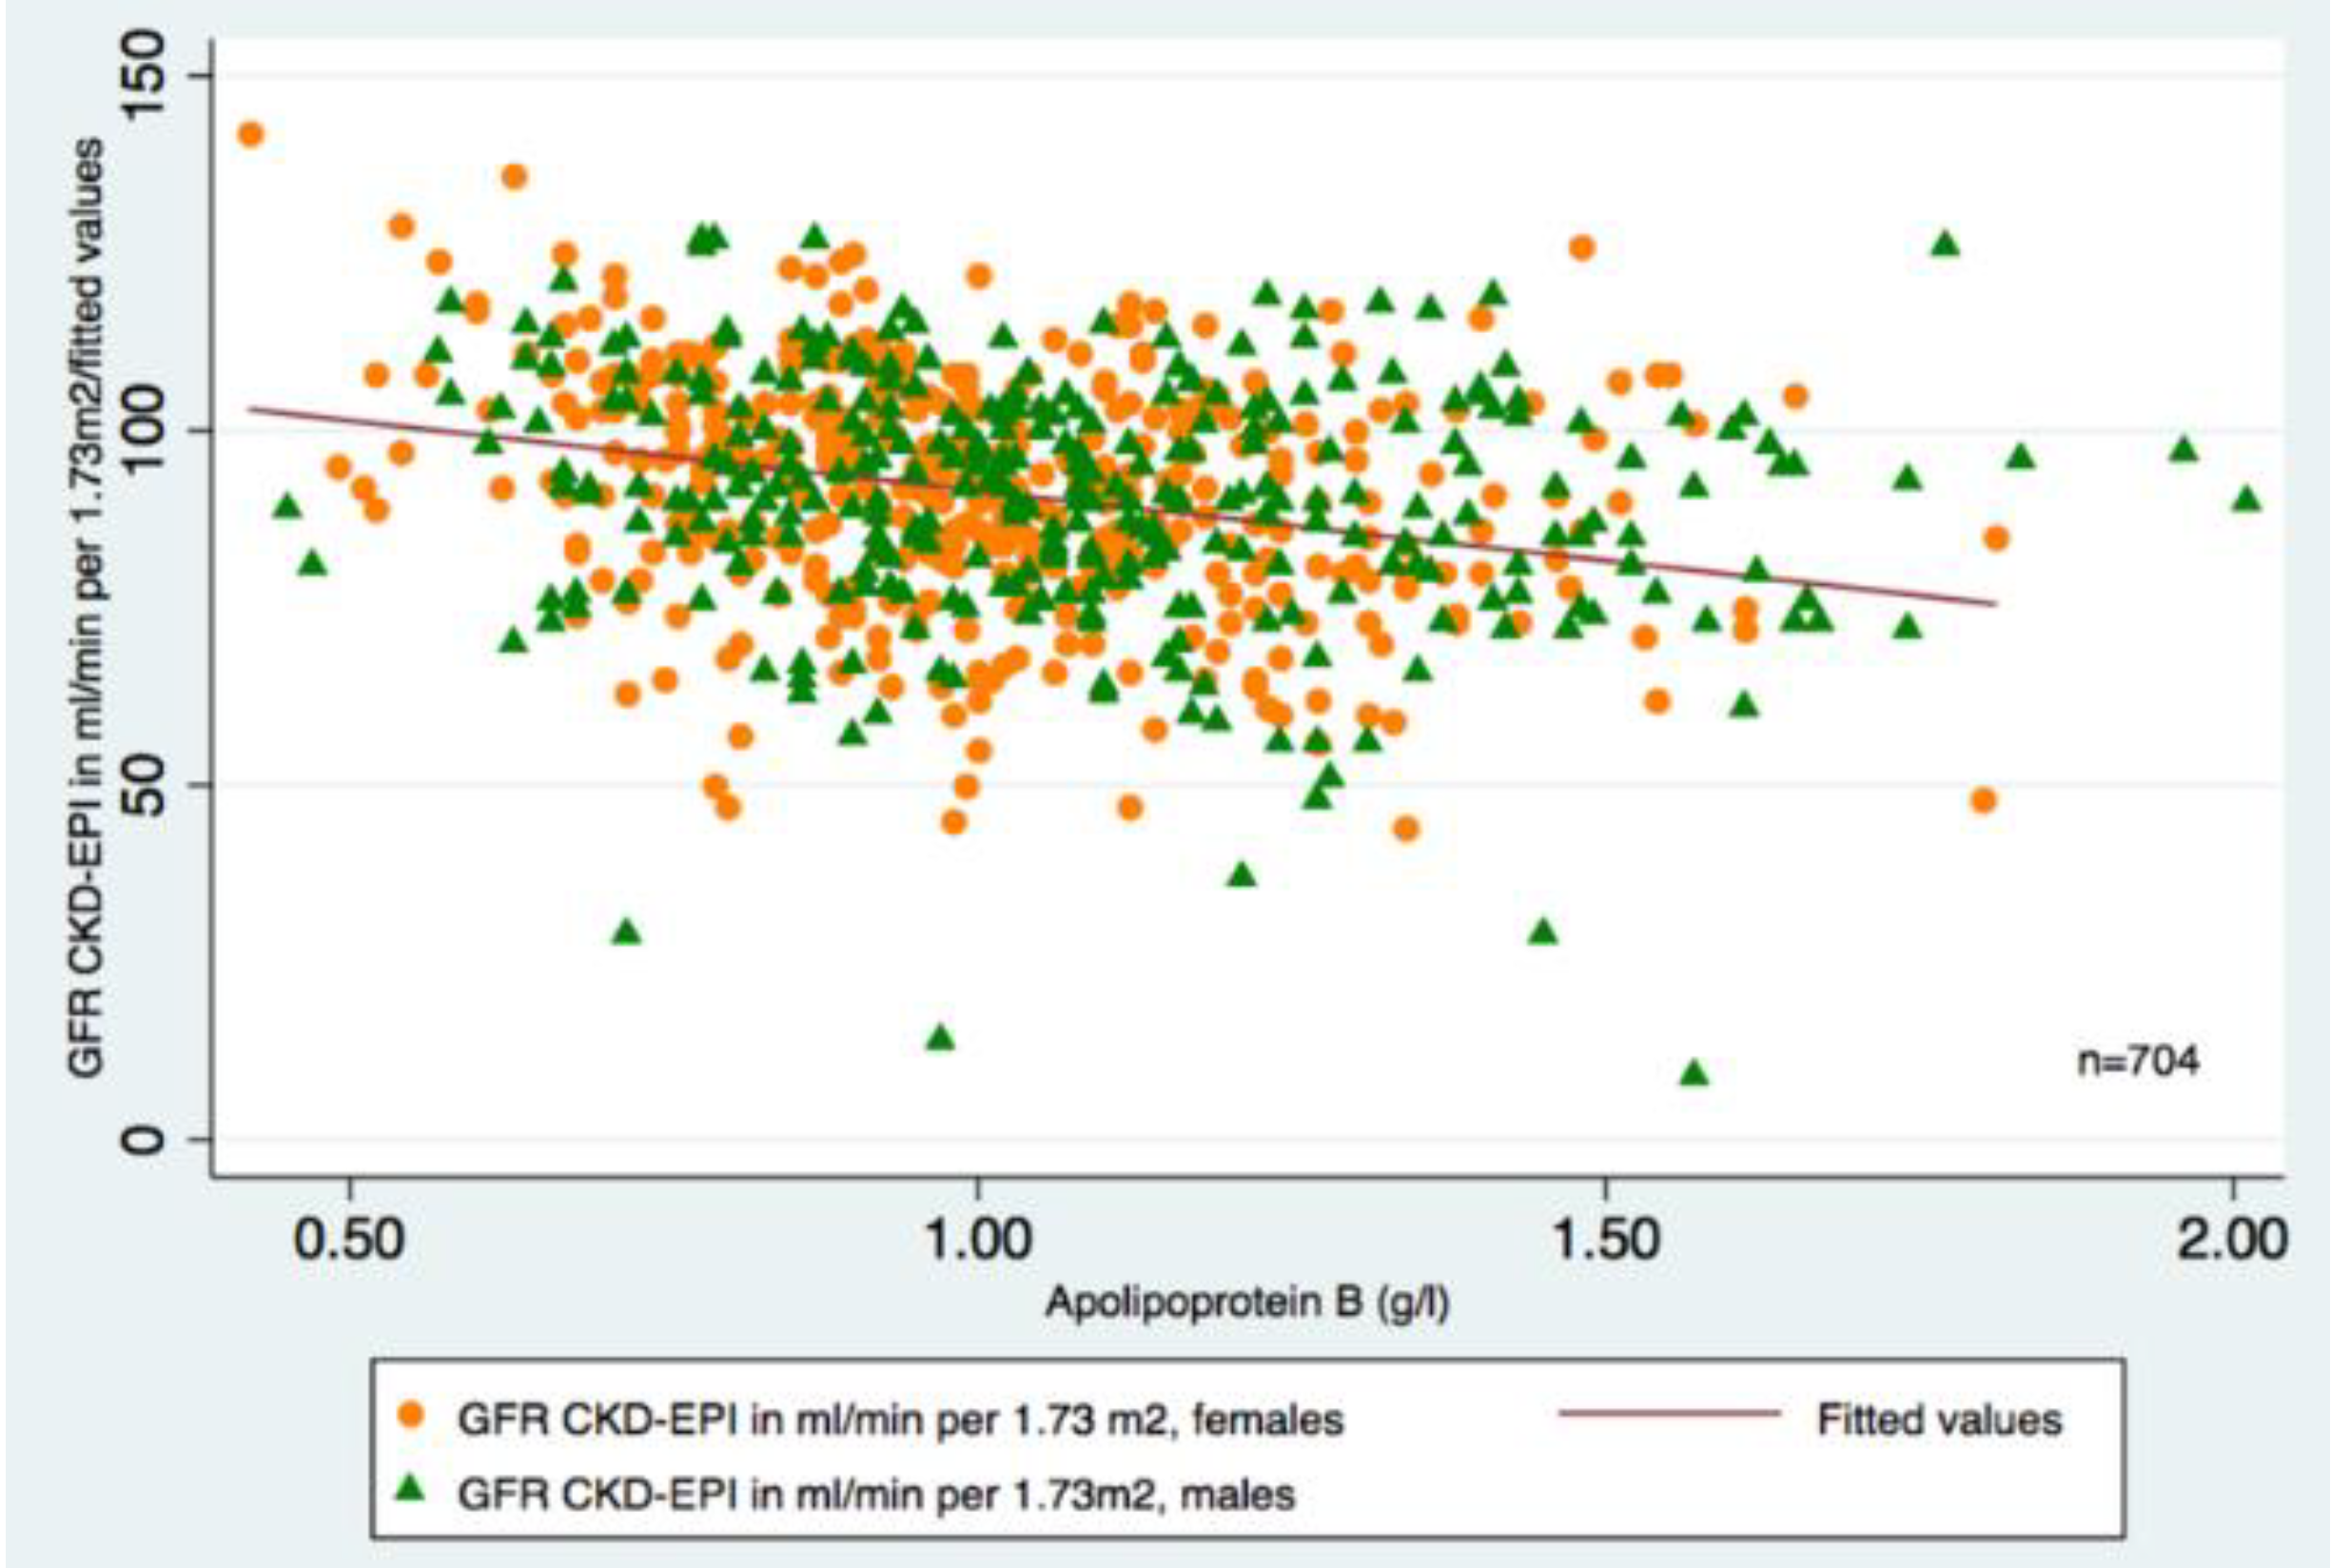
3.1. Descriptive Data
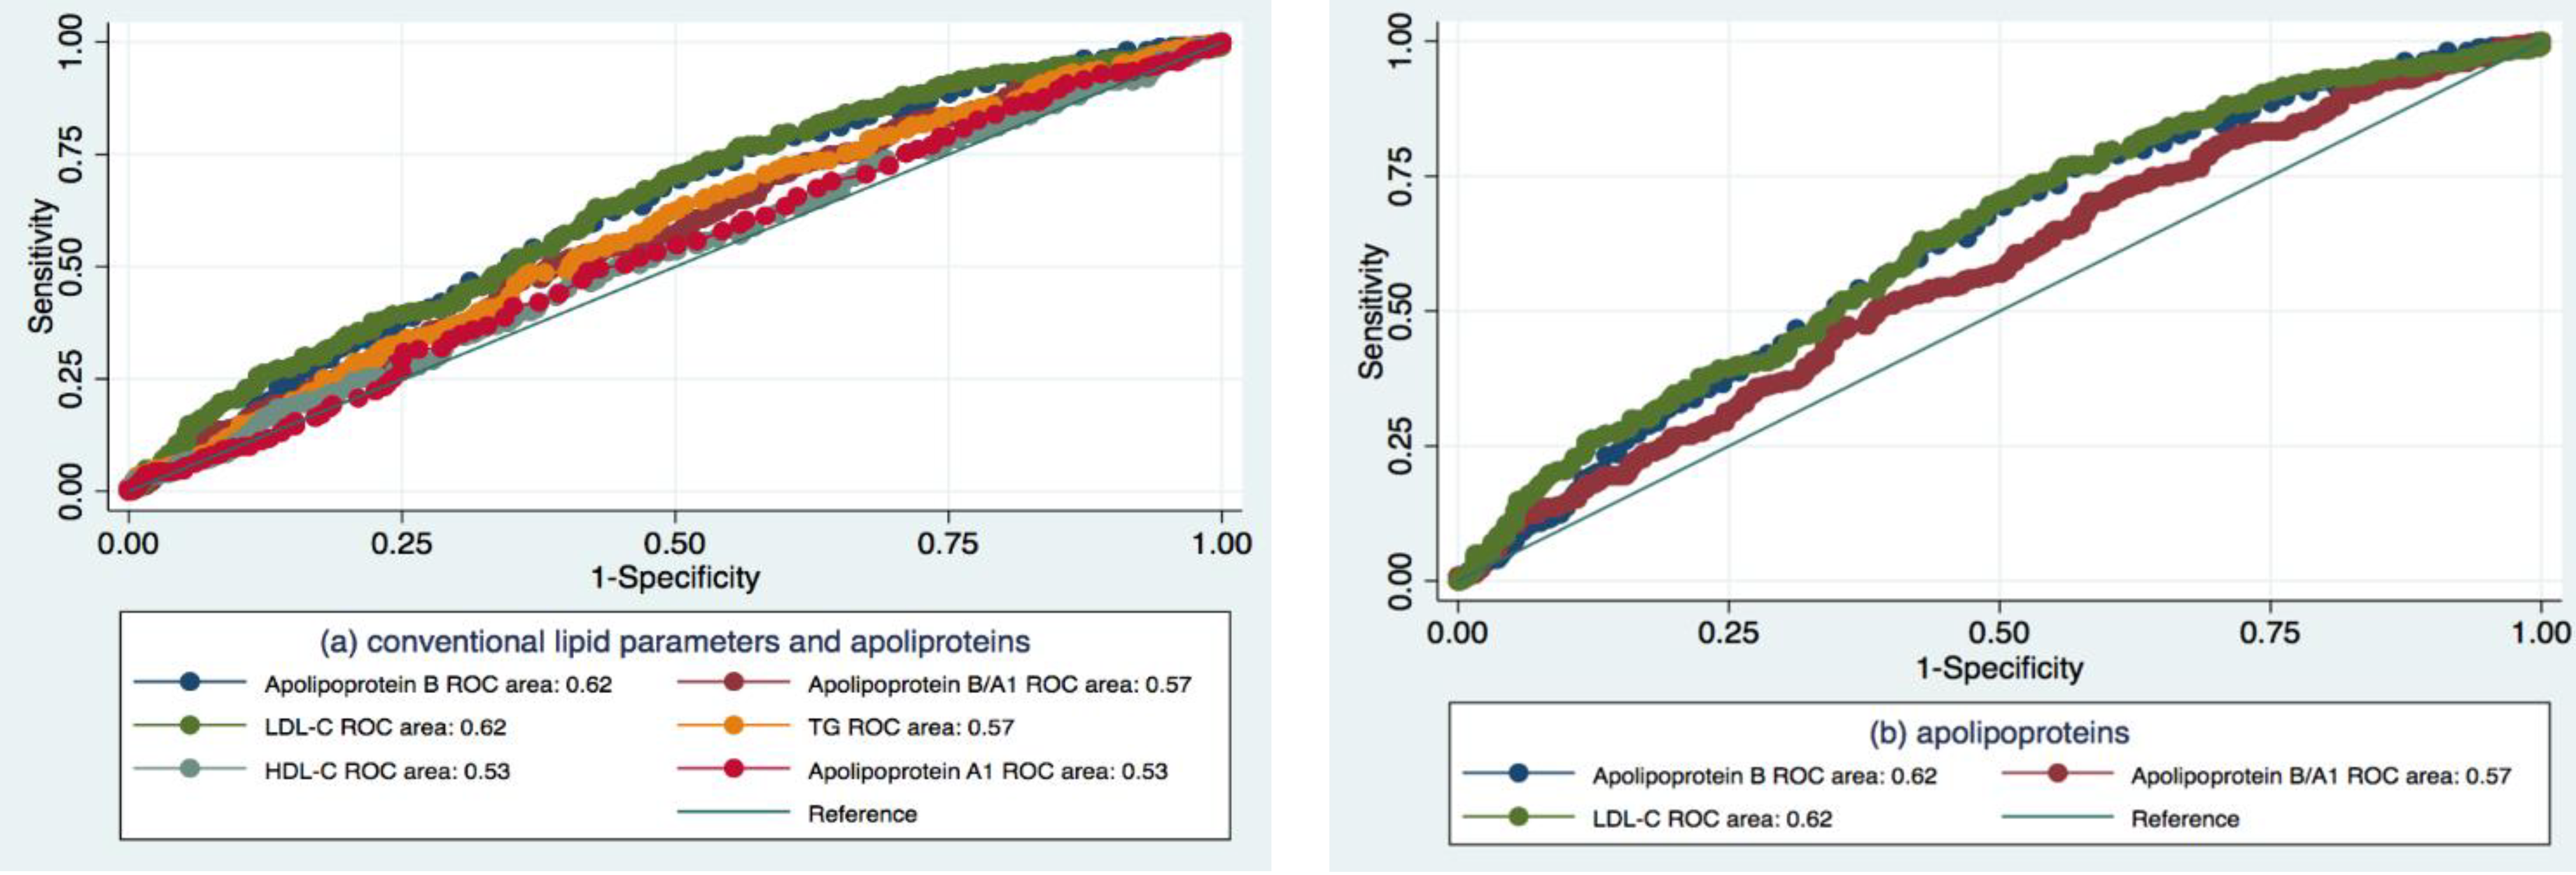
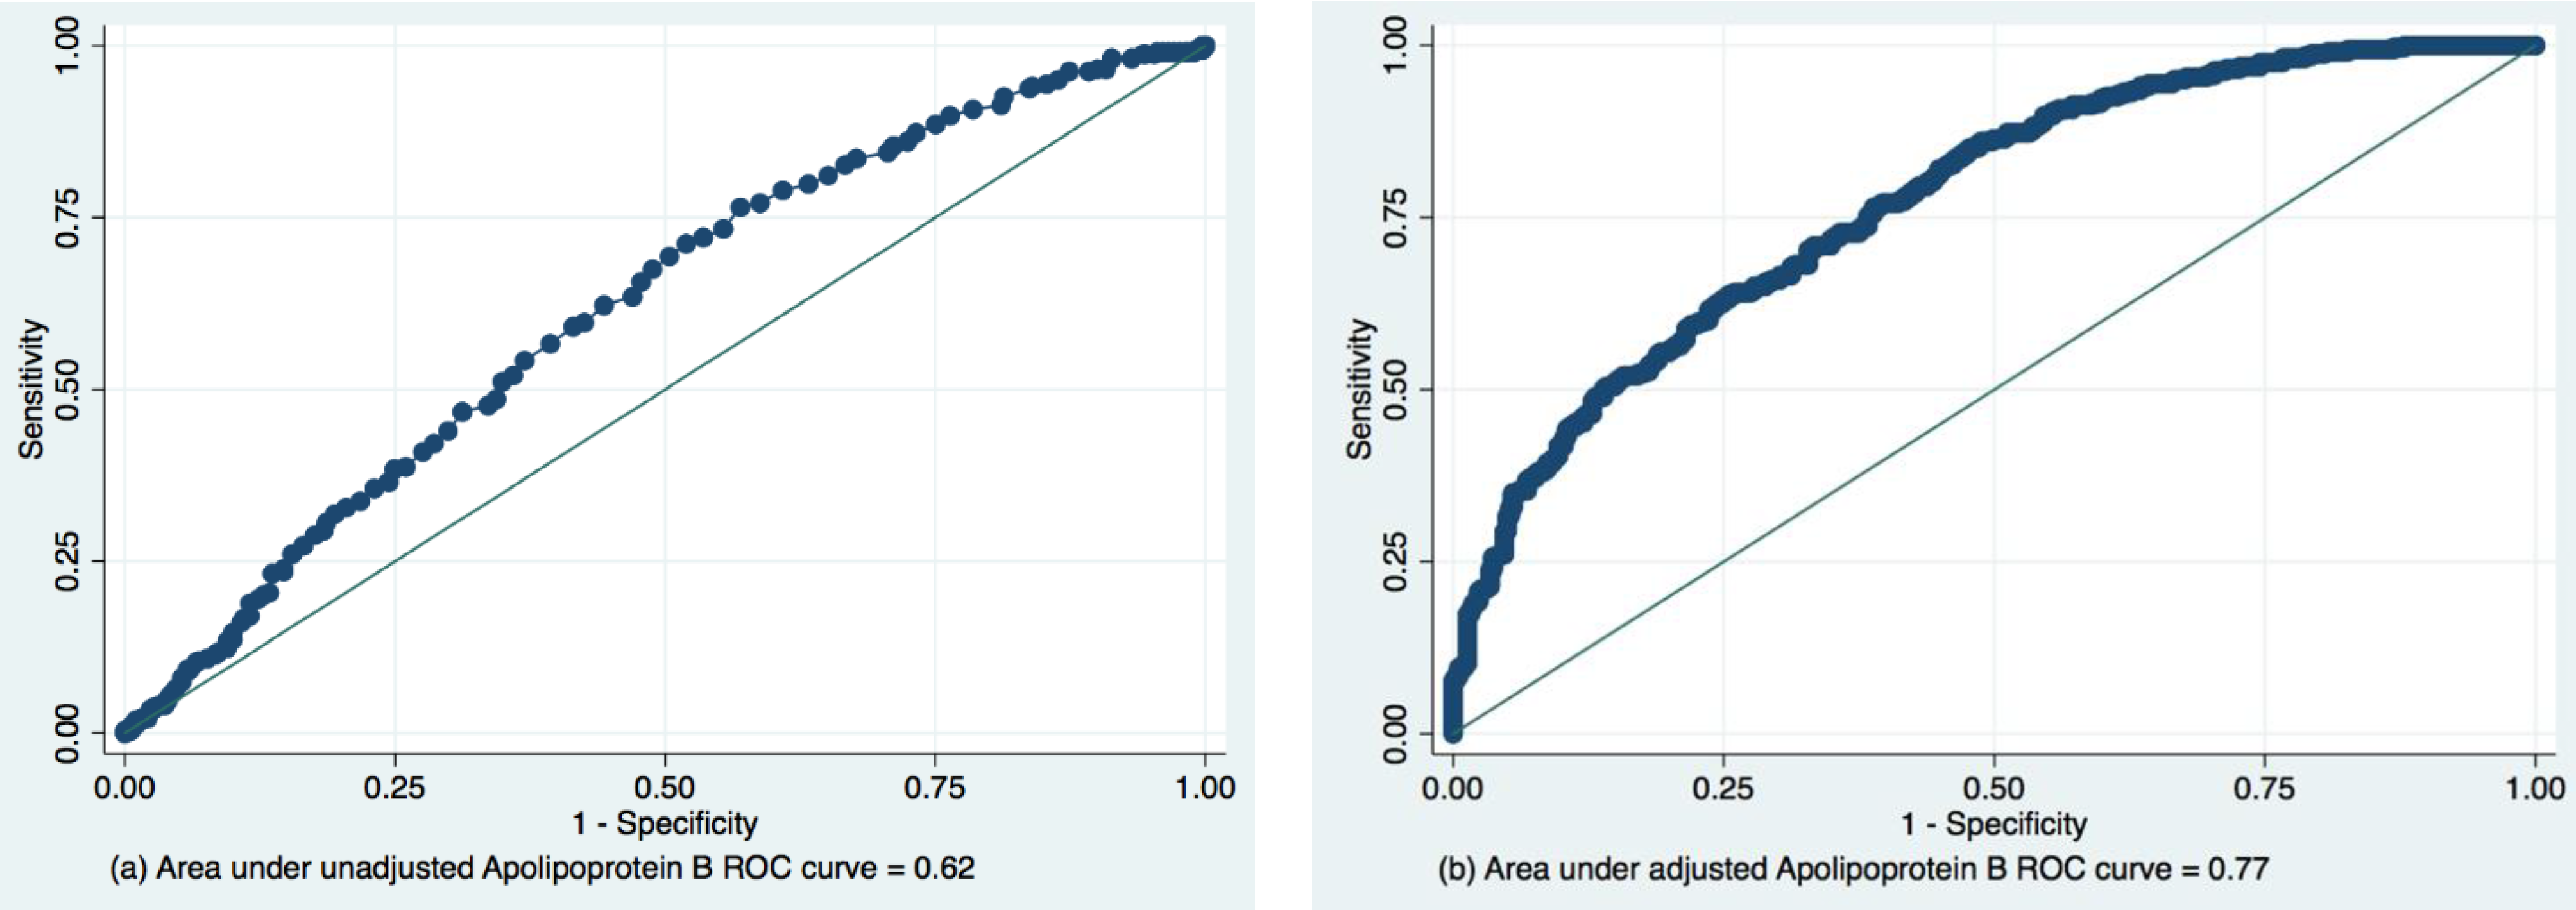
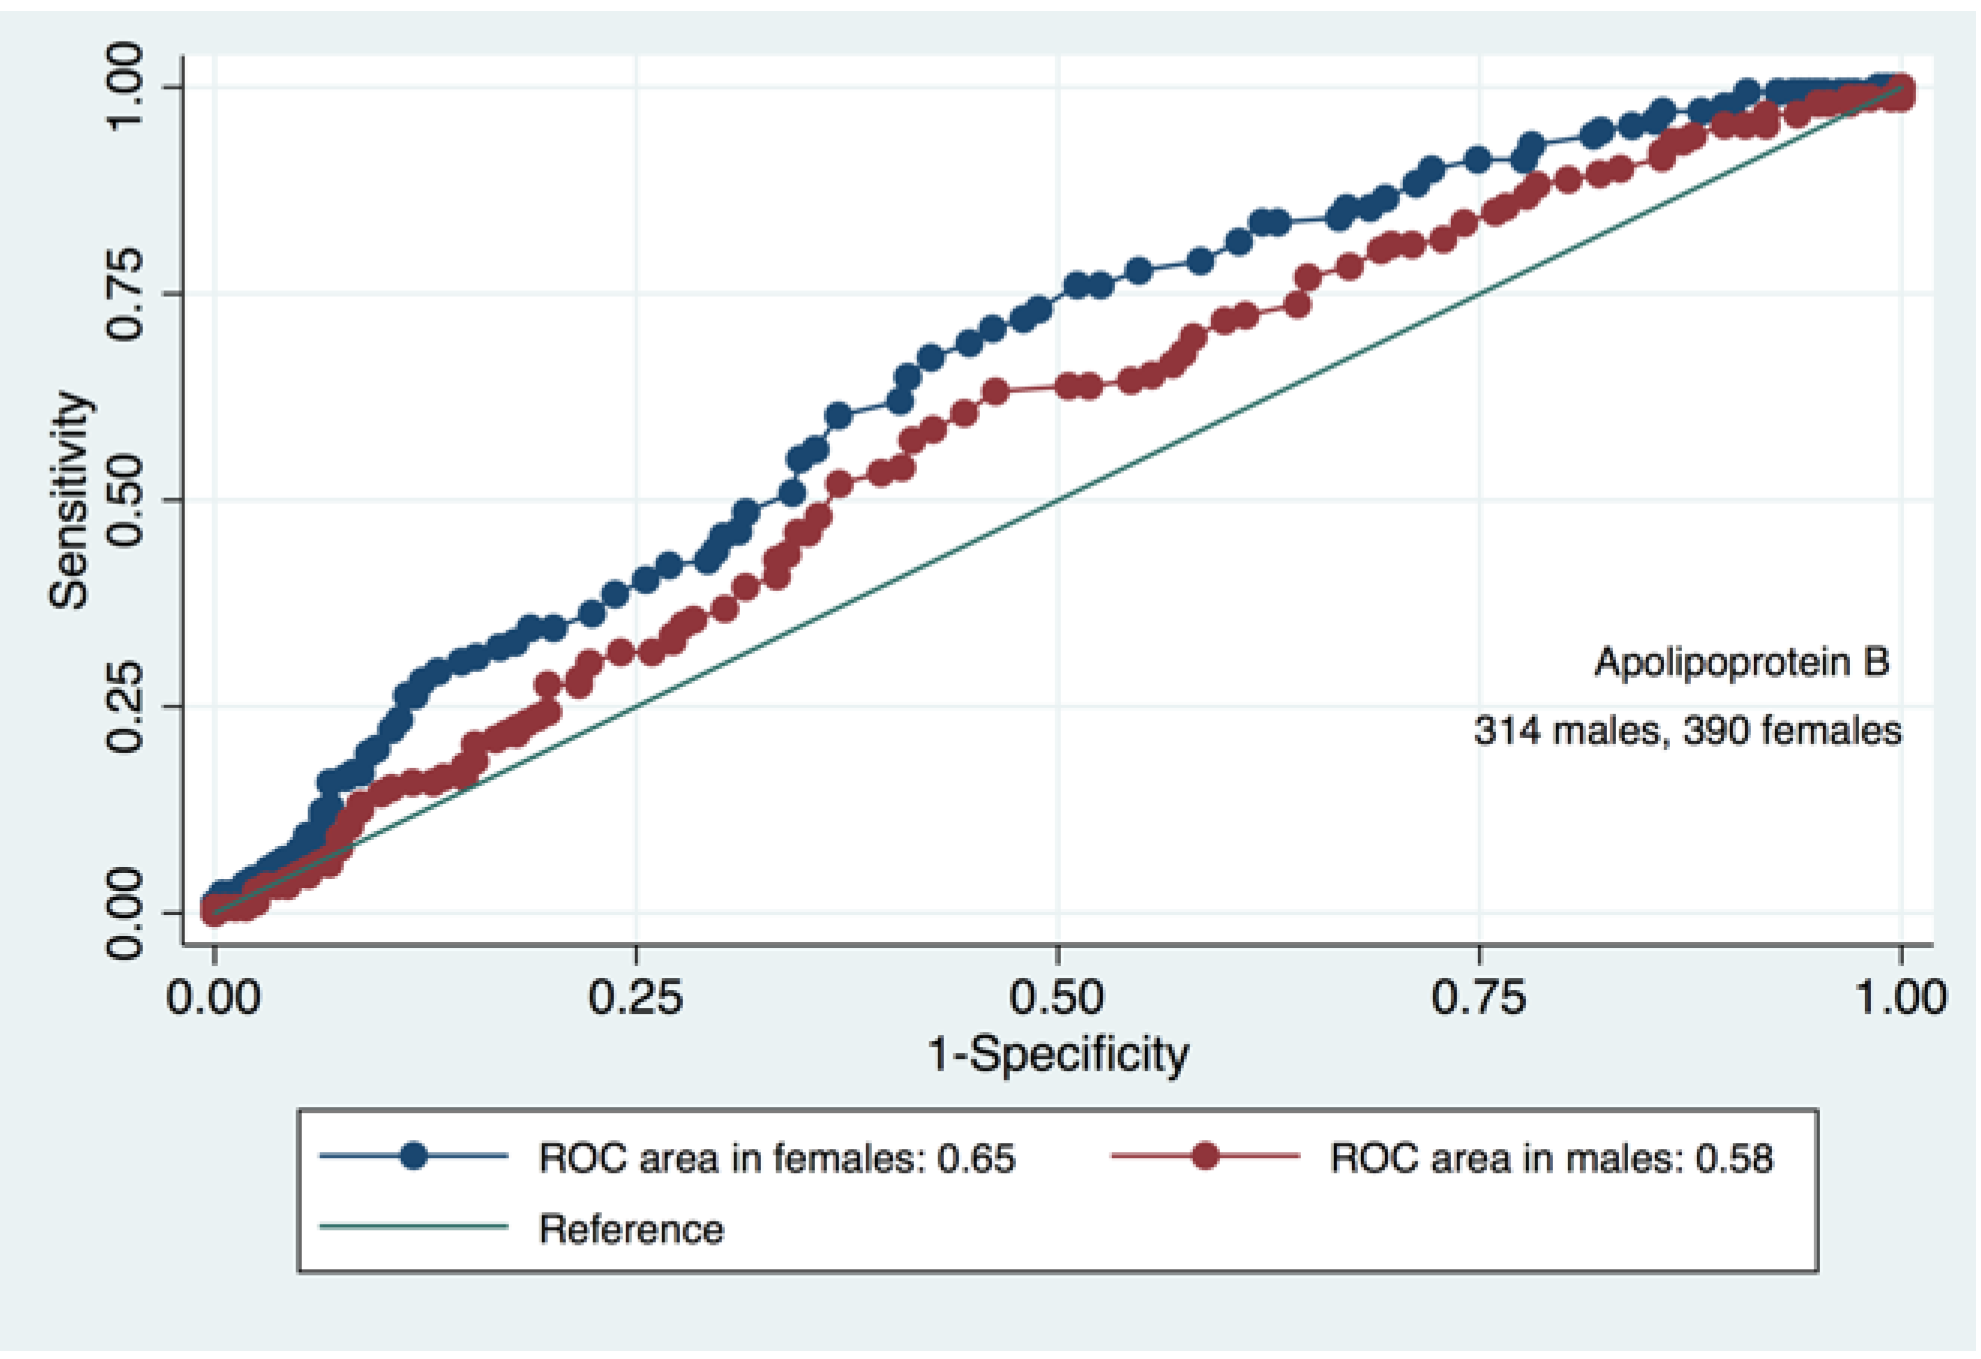
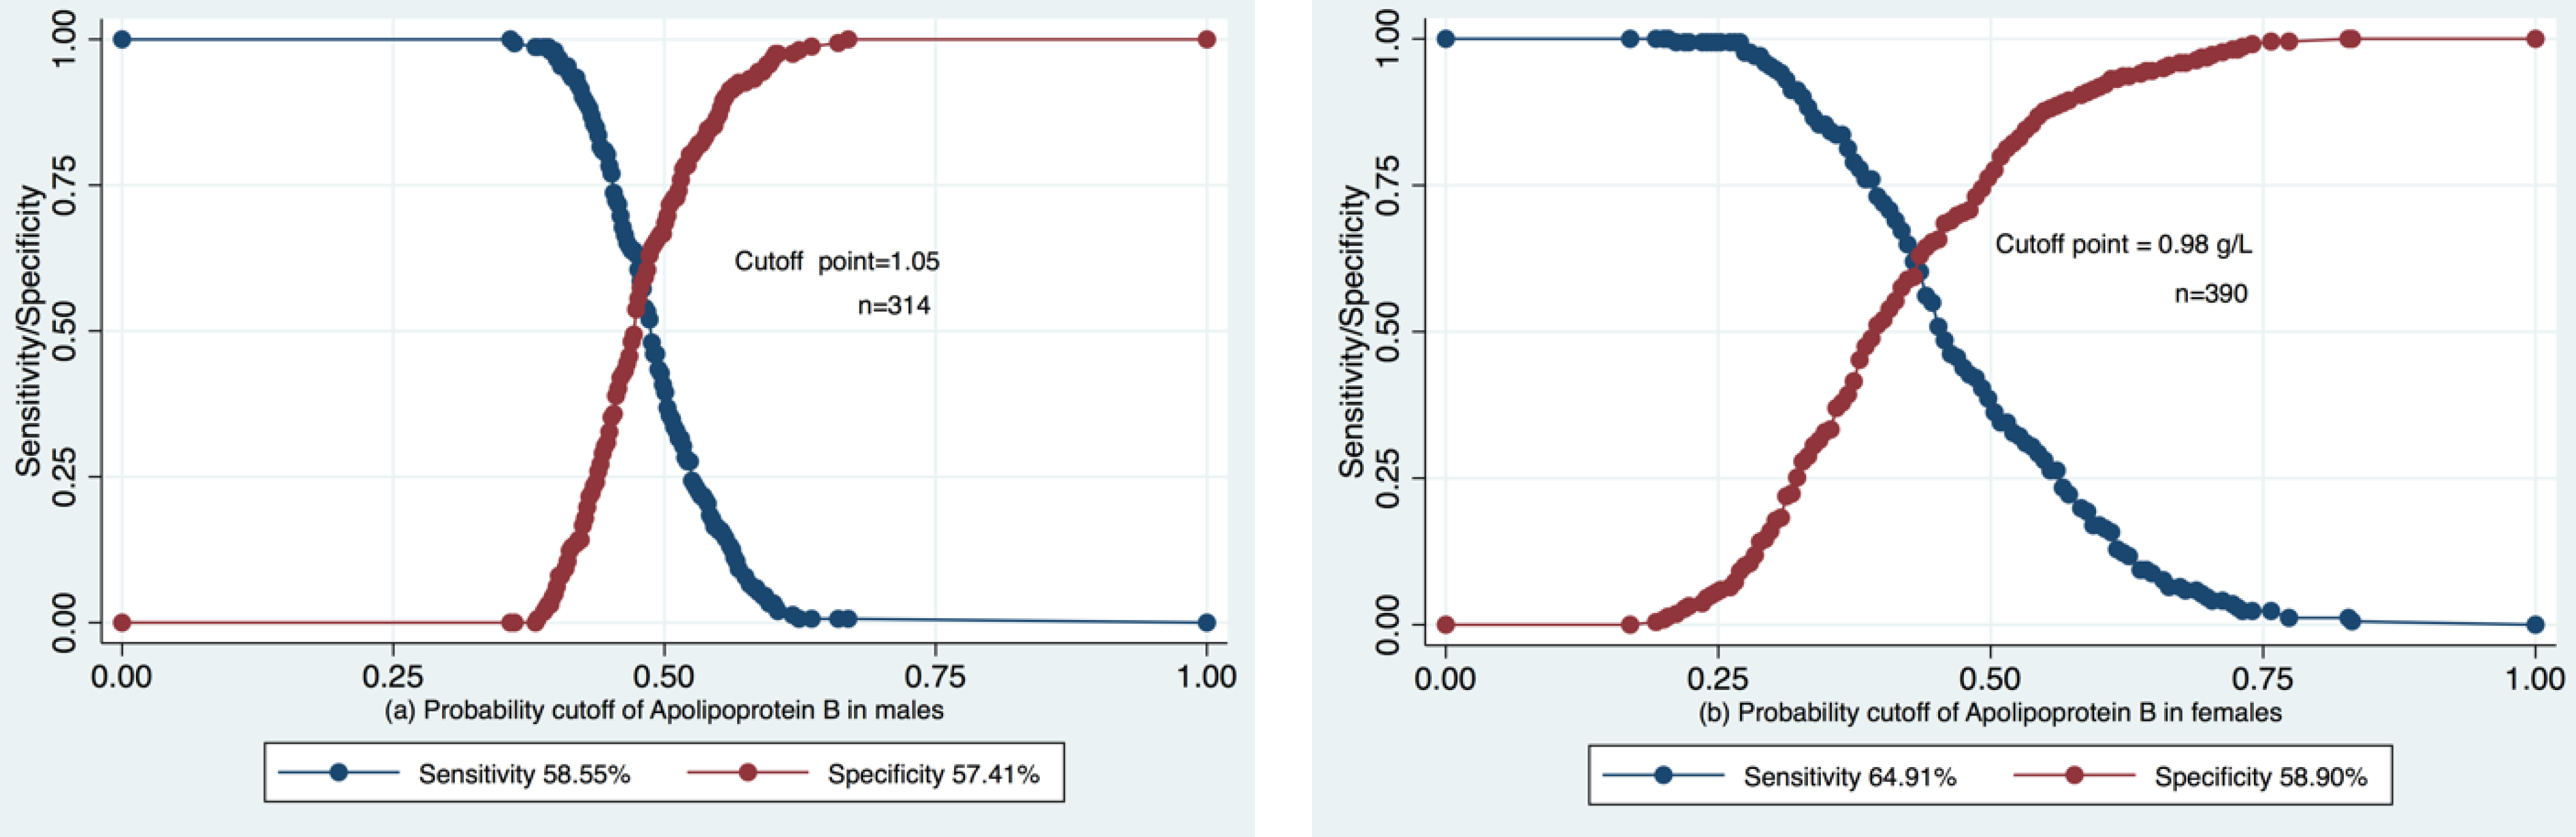
3.2. ROC Analysis of the Predictive Value of Apolipoprotein B in Pre-CKD eGFR Decrease
4. Discussion
Limitations
5. Conclusions
Author Contributions
Funding
Institutional Review Board Statement
Informed Consent Statement
Data Availability Statement
Acknowledgments
Conflicts of Interest
References
- Muntner, P.; He, J.; Astor, B.C.; Folsom, A.R.; Coresh, J. Traditional and nontraditional risk factors predict coronary heart disease in chronic kidney disease: Results from the atherosclerosis risk in communities study. J. Am. Soc. Nephrol. 2005, 16, 529–538. [Google Scholar] [CrossRef] [PubMed]
- Xie, Y.; Bowe, B.; Mokdad, A.H.; Xian, H.; Yan, Y.; Li, T.; Maddukuri, G.; Tsai, C.Y.; Floyd, T.; Al-Aly, Z. Analysis of the Global Burden of Disease study highlights the global, regional, and national trends of chronic kidney disease epidemiology from 1990 to 2016. Kidney Int. 2018, 94, 567–581. [Google Scholar] [CrossRef] [PubMed]
- Garofalo, C.; Borrelli, S.; Pacilio, M.; Minutolo, R.; Chiodini, P.; De Nicola, L.; Conte, G. Hypertension and Prehypertension and Prediction of Development of Decreased Estimated GFR in the General Population: A Meta-analysis of Cohort Studies. Am. J Kidney Dis 2016, 67, 89–97. [Google Scholar] [CrossRef]
- Garofalo, C.; Borrelli, S.; Minutolo, R.; Chiodini, P.; De Nicola, L.; Conte, G. A systematic review and meta-analysis suggests obesity predicts the onset of chronic kidney disease in the general population. Kidney Int. 2017, 91, 1224–1235. [Google Scholar] [CrossRef]
- Harper, C.R.; Jacobson, T.A. Managing dyslipidemia in chronic kidney disease. J. Am. Coll. Cardiol. 2008, 51, 2375–2384. [Google Scholar] [CrossRef] [PubMed]
- Ikewaki, K.; Schaefer, J.R.; Frischmann, M.E.; Okubo, K.; Hosoya, T.; Mochizuki, S.; Dieplinger, B.; Trenkwalder, E.; Schweer, H.; Kronenberg, F.; et al. Delayed in vivo catabolism of intermediate-density lipoprotein and low-density lipoprotein in hemodialysis patients as potential cause of premature atherosclerosis. Arter. Thromb. Vasc. Biol. 2005, 25, 2615–2622. [Google Scholar] [CrossRef] [PubMed]
- Renee Ruhaak, L.; van der Laarse, A.; Cobbaert, C.M. Apolipoprotein profiling as a personalized approach to the diagnosis and treatment of dyslipidaemia. Ann. Clin. Biochem. 2019, 56, 338–356. [Google Scholar] [CrossRef] [PubMed]
- Hager, M.R.; Narla, A.D.; Tannock, L.R. Dyslipidemia in patients with chronic kidney disease. Rev. Endocr. Metab. Disord. 2017, 18, 29–40. [Google Scholar] [CrossRef]
- Liu, Y.; Coresh, J.; Eustace, J.A.; Longenecker, J.C.; Jaar, B.; Fink, N.E.; Tracy, R.P.; Powe, N.R.; Klag, M.J. Association between cholesterol level and mortality in dialysis patients: Role of infl ammation and malnutrition. JAMA 2004, 291, 451–459. [Google Scholar] [CrossRef]
- Goek, O.N.; Köttgen, A.; Hoogeveen, R.C.; Ballantyne, C.M.; Coresh, J.; Astor, B.C. Association of apolipoprotein A1 and B with kidney function and chronic kidney disease in two multiethnic population samples. Nephrol. Dial. Transplant. 2012, 27, 2839–2847. [Google Scholar] [CrossRef]
- Zhao, W.; Li, J.; Zhang, X.; Zhou, X.; Xu, J.; Liu, X.; Liu, Z. Apolipoprotein B and renal function: Across-sectional study from the China health and nutrition survey. Lipids Health Dis. 2020, 19, 110. [Google Scholar] [CrossRef] [PubMed]
- Nurtazina, A.; Kozhakhmetova, D.; Dautov, D.; Shakhanova, A.; Chattu, V.K. Apolipoprotein B/A1 Ratio as a Diagnostic Alternative to Triglycerides and HDL-Cholesterol for the Prediction of Metabolic Syndrome among Hypertensives in Kazakhstan. Diagnostics 2020, 10, 510. [Google Scholar] [CrossRef] [PubMed]
- Mancia, G.; Fagard, R.; Narkiewicz, K.; Redon, J.; Zanchetti, A.; Böhm, M.; Christiaens, T.; Cifkova, R.; De Backer, G.; Dominiczak, A.; et al. Wood DA 2013 ESH/ESC guidelines for the management of arterial hypertension: The Task Force for the Management of Arterial Hypertension of the European Society of Hypertension (ESH) and of the European Society of Cardiology (ESC). Eur. Heart J. 2013, 34, 2159–2219. [Google Scholar] [CrossRef]
- Toft, U.; Kristoffersen, L.H.; Lau, C.; Borch-Johnsen, K.; Jørgensen, T. The Dietary Quality Score: Validation and association with cardiovascular risk factors: The Inter99 study. Eur. J. Clin. Nutr. 2007, 61, 270–278. [Google Scholar] [CrossRef] [PubMed]
- Kidney Disease: Improving Global Outcomes (KDIGO) CKD Work Group. KDIGO 2012 Clinical Practice Guideline for the Evaluation and Management of Chronic Kidney Disease. Kidney Int. Suppl. 2013, 3, 1–150. [Google Scholar]
- Levey, A.S.; Stevens, L.A.; Schmid, C.H.; Zhang, Y.L.; Castro, A.F., III.; Feldman, H.I.; Kusek, J.W.; Eggers, P.; Van Lente, F.; CKD-EPI (Chronic Kidney Disease Epidemiology Collaboration); et al. A new equation to estimate glomerular filtration rate. Ann. Intern. Med. 2009, 150, 604–612, Erratum. Ann. Intern. Med.2011, 155, 408. [Google Scholar] [CrossRef] [PubMed]
- Earley, A.; Miskulin, D.; Lamb, E.J.; Levey, A.S.; Uhlig, K. Estimating equations for glomerular filtration rate in the era of creatinine standardization: A systematic review. Ann. Intern. Med. 2012, 156, 785–795. [Google Scholar] [CrossRef] [PubMed]
- Miller, W.G.; Jones, G.R.D. Estimated Glomerular Filtration Rate; Laboratory Implementation and Current Global Status. Adv. Chronic Kidney Dis. 2018, 25, 7–13. [Google Scholar] [CrossRef]
- Alberti, K.G.; Zimmet, P.; Shaw, J. Metabolic syndrome—A new world-wide definition. A Consensus Statement from the International Diabetes Federation. Diabet Med. 2006, 23, 469–480. [Google Scholar] [CrossRef]
- WHO. World Health Organization. Body Mass Index. Available online: https://www.euro.who.int/en/health-topics/disease-prevention/nutrition/a-healthy-lifestyle/body-mass-index-bmi (accessed on 24 May 2020).
- Prospective Studies Collaboration; Lewington, S.; Whitlock, G.; Clarke, R.; Sherliker, P.; Emberson, J.; Halsey, J. Blood cholesterol and vascular mortality by age, sex, and blood pressure: A meta-analysis of individual data from 61 prospective studies with 55,000 vascular deaths. Lancet 2007, 370, 1829–1839. [Google Scholar]
- Silverman, M.G.; Ference, B.A.; Im, K.; Wiviott, S.D.; Giugliano, R.P.; Grundy, S.M.; Braunwald, E.; Sabatine, M.S. Association Between Lowering LDL-C and Cardiovascular Risk Reduction Among Different Therapeutic Interventions: A Systematic Review and Meta-analysis. JAMA 2016, 316, 1289–1297. [Google Scholar] [CrossRef] [PubMed]
- Panayiotou, A.; Griffin, M.; Georgiou, N.; Bond, D.; Tyllis, T.; Tziakouri-Shiakalli, C.; Fessas, C.; Nicolaides, A. ApoB/ApoA1 ratio and subclinical atherosclerosis. Int. Angiol. 2008, 27, 74–80. [Google Scholar] [PubMed]
- Raitakari, O.T.; Mäkinen, V.P.; McQueen, M.J.; Niemi, J.; Juonala, M.; Jauhiainen, M.; Salomaa, V.; Hannuksela, M.L.; Savolainen, M.J.; Kesäniemi, Y.A.; et al. Computationally estimated apolipoproteins B and A1 in predicting cardiovascular risk. Atherosclerosis 2013, 226, 245–251. [Google Scholar] [CrossRef]
- Skålén, K.; Gustafsson, M.; Rydberg, E.K.; Hultén, L.M.; Wiklund, O.; Innerarity, T.L.; Borén, J. Subendothelial retention of atherogenic lipoproteins in early atherosclerosis. Nature 2002, 417, 750–754. [Google Scholar] [CrossRef]
- Barter, P.J.; Ballantyne, C.M.; Carmena, R.; Castro Cabezas, M.; Chapman, M.J.; Couture, P.; de Graaf, J.; Durrington, P.N.; Faergeman, O.; Frohlich, J.; et al. Apo B versus cholesterol in estimating cardiovascular risk and in guiding therapy: Report of the thirty-person/ten-country panel. J. Intern. Med. 2006, 259, 247–258. [Google Scholar] [CrossRef] [PubMed]
- Sierra-Johnson, J.; Somers, V.K.; Kuniyoshi, F.H.; Garza, C.A.; Isley, W.L.; Gami, A.S.; Lopez-Jimenez, F. Comparison of apolipoprotein-B/apolipoprotein-AI in subjects with versus without the metabolic syndrome. Am. J. Cardiol 2006, 98, 1369–1373. [Google Scholar] [CrossRef] [PubMed]
- Mach, F.; Baigent, C.; Catapano, A.L.; Koskinas, K.C.; Casula, M.; Badimon, L.; Chapman, M.J.; De Backer, G.G.; Delgado, V.; ESC Scientific Document Group; et al. 2019 ESC/EAS Guidelines for the management of dyslipidaemias: Lipid modification to reduce cardiovascular risk. Eur. Heart J. 2020, 41, 111–188. [Google Scholar] [CrossRef] [PubMed]
- Lincoff, A.M. Evacetrapib Cardiovascular Outcomes in High-Risk Vascular Disease. N. Engl. J. Med. 2017, 376, 1933–1942. [Google Scholar] [CrossRef]
- Wilson, P.W.; Abbott, R.D.; Castelli, W.P. High density lipoprotein cholesterol and mortality. Fram. Heart Study Arterioscler. 1988, 8, 737–741. [Google Scholar] [CrossRef]
- Gordon, D.J.; Probsfield, J.L.; Garrison, R.J.; Neaton, J.D.; Castelli, W.P.; Knoke, J.D.; Jacobs, D.R., Jr.; Bangdiwala, S.; Tyroler, H.A. High density lipoprotein cholesterol and cardiovascular disease. Four Prospect. Am. Studies. Curculation 1989, 79, 8–15. [Google Scholar]
- Emerging Risk Factors Collaboration; Di Angelantonio, E.; Sarwar, N.; Perry, P.; Kaptogae, S.; Ray, K.K.; Thompson, A.; Wood, A.M.; Lewington, S.; Sattar, N.; et al. Major lipids, apolipoproteins, and risk of vascular diases. JAMA 2009, 302, 1993–2000. [Google Scholar]
- Manjunath, G.; Tighiouart, H.; Coresh, J.; Macleod, B.; Salem, D.N.; Griffith, J.L.; Levey, A.S.; Sarnak, M.J. Level of kidney function as a risk factor for cardiovascular outcomes in the elderly. Kidney Int. 2003, 63, 1121–1129. [Google Scholar] [CrossRef] [PubMed]
- Shoji, T.; Abe, T.; Matsuo, H.; Egusa, G.; Yamasaki, Y.; Kashihara, N.; Shirai, K.; Kashiwagi, A.; Committee of Renal and Peripheral Arteries, Japan Atherosclerosis Society. Chronic kidney disease, dyslipidemia, and atherosclerosis. J. Atheroscler. Thromb. 2012, 19, 299–315. [Google Scholar] [CrossRef] [PubMed]
- Said, S.; Hernandez, G.T. The link between chronic kidney disease and cardiovascular disease. J. Nephropathol. 2014, 3, 99–104. [Google Scholar] [CrossRef]
- Sarnak, M.J.; Amann, K.; Bangalore, S.; Cavalcante, J.L.; Charytan, D.M.; Craig, J.C.; Gill, J.S.; Hlatky, M.A.; Jardine, A.G.; Conference Participants; et al. Chronic Kidney Disease and Coronary Artery Disease: JACC State-of-the-Art Review. J. Am. Coll. Cardiol. 2019, 74, 1823–1838. [Google Scholar] [CrossRef]
- Edmonston, D.L.; Pun, P.H. Coronary artery disease in chronic kidney disease: Highlights from a Kidney Disease: Improving Global Outcomes (KDIGO) Controversies Conference. Kidney Int. 2020, 97, 642–644. [Google Scholar] [CrossRef] [PubMed]
- Henry, R.M.; Kostense, P.J.; Bos, G.; Dekker, J.M.; Nijpels, G.; Heine, R.J.; Bouter, L.M.; Stehouwer, C.D. Mild renal insufficiency is associated with increased cardiovascular mortality: The Hoorn Study. Kidney Int. 2002, 62, 1402–1407. [Google Scholar] [CrossRef]
- Pascual, V.; Serrano, A.; Pedro-Botet, J.; Ascaso, J.; Barrios, V.; Millán, J.; Pintó, X.; Cases, A. Enfermedad renal crónica y dislipidemia [Chronic kidney disease and dyslipidaemia]. Clin. Investig. Arter. 2017, 29, 22–35. (In Spanish) [Google Scholar] [CrossRef]
- Mulec, H.; Johnson, S.A.; Björck, S. Relation between serum cholesterol and diabetic nephropathy. Lancet 1990, 335, 1537–1538. [Google Scholar] [CrossRef]
- Hovind, P.; Rossing, P.; Tarnow, L.; Smidt, U.M.; Parving, H.H. Remission and regression in the nephropathy of type 1 diabetes when blood pressure is controlled aggressively. Kidney Int. 2001, 60, 277–283. [Google Scholar] [CrossRef] [PubMed]
- Appel, G.B.; Radhakrishnan, J.; Avram, M.M.; DeFronzo, R.A.; Escobar-Jimenez, F.; Campos, M.M.; Burgess, E.; Hille, D.A.; Dickson, T.Z.; RENAAL Study; et al. Analysis of metabolic parameters as predictors of risk in the RENAAL study. Diabetes Care 2003, 26, 1402–1407. [Google Scholar] [CrossRef] [PubMed]
- Hirano, T. Abnormal lipoprotein metabolism in diabetic nephropathy. Clin. Exp. Nephrol. 2014, 18, 206–209. [Google Scholar] [CrossRef] [PubMed]
- Hayashi, T.; Hirano, T.; Taira, T.; Tokuno, A.; Mori, Y.; Koba, S.; Adachi, M. Remarkable increase of apolipoprotein B48 level in diabetic patients with end-stage renal disease. Atherosclerosis 2008, 197, 154–158. [Google Scholar] [CrossRef] [PubMed]
- Kashiwazaki, K.; Hirano, T.; Yoshino, G.; Kurokawa, M.; Tajima, H.; Adachi, M. Decreased release of lipoprotein lipase is associated with vascular endothelial damage in NIDDM patients with microalbuminuria. Diabetes Care 1998, 21, 2016–2020. [Google Scholar] [CrossRef] [PubMed]
- Iseki, K. Epidemiology of dyslipidemia in chronic kidney disease. Clin. Exp. Nephrol. 2014, 18, 185–188. [Google Scholar] [CrossRef] [PubMed]
- Yamagata, K.; Ishida, K.; Sairenchi, T.; Takahashi, H.; Ohba, S.; Shiigai, T.; Narita, M.; Koyama, A. Risk factors for chronic kidney disease in a community-based population: A 10-year follow-up study. Kidney Int. 2007, 71, 159–166. [Google Scholar] [CrossRef] [PubMed]
- Tozawa, M.; Iseki, K.; Iseki, C.; Oshiro, S.; Ikemiya, Y.; Takishita, S. Triglyceride, but not total cholesterol or low-density lipoprotein cholesterol levels, predict development of proteinuria. Kidney Int. 2002, 62, 1743–1749. [Google Scholar] [CrossRef]
- Russo, G.T.; Cosmo, S.; Viazzi, F.; Pacilli, A.; Ceriello, A.; Genovese, S.; Guida, P.; Giorda, C.; Cucinotta, D.; Pontremolli, R.; et al. AMD-Annals Study Group. Plasma triglycerides and HDL-C levels predict the development of diabetic kidney disease in subjects with type 2 diabetes. Diabetes Care 2016, 39, 2278–2287. [Google Scholar] [CrossRef]
- Zhang, H.; Shi, S.; Zhao, X.J.; Wang, J.K.; Liu, Z.W.; Liu, F.Q.; Zhu, L.; Zhu, S.M.; Zhang, Y.; Pan, S. Association Between the Lipid Profile and Renal Dysfunction in the Heart Failure Patients. Kidney Blood Press Res. 2019, 44, 52–61. [Google Scholar] [CrossRef]
- Kim, S.H.; Oh, D.; Jung, K.S.; Lee, J.E.; Kim, H.; Kim, H.J.; Kim, B.S.; Park, H.C.; Lee, B.K.; Choi, H.Y. The association between the apolipoprotein B/A-I ratio and coronary calcification may differ depending on kidney function in a healthy population. PLoS ONE 2017, 12, e0185522. [Google Scholar] [CrossRef]
- Mänttäri, M.; Tiula, E.; Alikoski, T.; Manninen, V. Effects of hypertension and dyslipidemia on the decline in renal function. Hypertension 1995, 26, 670–675. [Google Scholar] [CrossRef] [PubMed]
- Schaeffner, E.S.; Kurth, T.; Curhan, G.C.; Glynn, R.J.; Rexrode, K.M.; Baigent, C.; Buring, J.E.; Gaziano, J.M. Cholesterol and the risk of renal dysfunction in apparently healthy men. J. Am. Soc. Nephrol. 2003, 14, 2084–2091. [Google Scholar] [CrossRef] [PubMed]
- Covic, A.; Kanbay, M.; Lerma, E.V. (Eds.) Dyslipidemias in Kidney Disease; Springer: New York, NY, USA; Dordrecht, The Ntherlands; London, UK, 2014; 978-1-4939-0515-7 (eBook). [Google Scholar] [CrossRef]


| Variables | Absolute Number | Proportion or Mean/SD * |
|---|---|---|
| n of the study population | 704 | 100% |
| Gender, male | 314 | 44.6 |
| Age (y): | 52.4/10.6 | |
| <39 | 71 | 10.1 |
| 40–49 | 216 | 30.7 |
| 50–59 | 232 | 33.0 |
| 60–69 | 154 | 21.9 |
| >70 | 31 | 4.4 |
| MS | 384 | 54.6 |
| Education, university or higher | 219 | 31.1 |
| Income, KZT/capita/month: | ||
| <50,000 | 329 | 46.7 |
| 50,000–100,000 | 351 | 49.9 |
| >100,000 | 24 | 3.4 |
| Smoking, current | 132 | 18.8 |
| Alcohol consumption, current | 293 | 41.6 |
| Gym class | 73 | 10.4 |
| Hereditary for hypertension | 408 | 58.3 |
| Hereditary for CHD | 158 | 22.4 |
| GTT, abnormal | 120 | 22.2 |
| DQS less than 7 | 126 | 17.9 |
| eGFR by CKD-EPI, mL/min per 1.73 m2, mean | 704 | 91.01/16.86 |
| Apolipoprotein B, g/L | 704 | 1.04/0.26 |
| Apolipoprotein A1, g/L | 704 | 1.46/0.25 |
| Apolipoprotein B/A1 ratio | 704 | 0.73/0.22 |
| HDL-C, mmol/L | 704 | 1.44/0.42 |
| LDL-C, mmol/L | 704 | 3.48/0.90 |
| Triglycerides, mmol/L | 704 | 1.53/3.9 |
| Total cholesterol, mmol/L | 704 | 5.03/0.94 |
| Parameters | Quartiles | p-Value | Barlett’s Test | |||
|---|---|---|---|---|---|---|
| Q1 | Q2 | Q3 | Q4 | |||
| Apolipoprotein B/A1 | <0.56 | 0.57–0.70 | 0.71–0.84 | >0.84 | ||
| eGFR, mL/min per 1.73 m2 | 95.11 | 90.47 | 90.14 | 88.33 | 0.0013 0.003 * | 0.56 |
| Apolipoprotein B | <0.85 | 0.86–1.0 | 1.01–1.18 | >1.18 | ||
| eGFR, mL/min per 1.73 m2 | 96.89 | 91.08 | 89.75 | 86.16 | 0.001 0.001 * | 0.001 |
| Apolipoprotein A1 | <1.28 | 1.29–1.43 | 1.44–1.62 | >1.62 | ||
| eGFR, mL/min per 1.73 m2 | 92.45 | 91.73 | 90.39 | 89.54 | 0.36 0.22 * | 0.67 |
| LDL-C | <2.84 | 2.85–3.42 | 3.43–4.08 | >4.08 | ||
| eGFR, mL/min per 1.73 m2 | 98.82 | 90.90 | 88.90 | 85.63 | 0.001 0.001 * | 0.068 |
| HDL-C | <1.14 | 1.15–1.38 | 1.39–1.67 | >1.67 | ||
| eGFR, mL/min per 1.73 m2 | 91.52 | 92.24 | 90.17 | 90.11 | 0.57 0.22 * | 0.54 |
| TG | <0.85 | 0.85–1.13 | 1.14–1.69 | >1.69 | ||
| eGFR, mL/min per 1.73 m2 | 95.20 | 90.51 | 89.86 | 88.59 | 0.0015 0.002 * | 0.045 |
| TC | <4.32 | 4.33–4.94 | 4.95–5.62 | >5.62 | ||
| eGFR, mL/min per 1.73 m2 | 97.67 | 89.99 | 89.02 | 87.45 | 0.001 0.001 * | 0.018 |
| Means of eGFR (mL/min per 1.73 m2) Across Quartiles of Apolipoprotein B (g/L) | Adjusted for: | Models | Number of Observations | |||
|---|---|---|---|---|---|---|
| Q1 (<0.85) | Q2 (0.86/1.0) | Q3 (1.01/1.18) | Q4 (>1.18) | |||
| Baseline | −5.81 ψ (−9.24; −2.39) p = 0.001 | −7.14 ψ (−10.57; −3.71) | −10.73 ψ,α (−14.21; −7.26) | Crude | 1 | 704 |
| Baseline | −3.79 ξ (−6.67; −0.92) | −3.69 ξ (−6.58; −0.80) | −7.53 ψ (−10.46; −4.61) | Age | 2 | 704 |
| Baseline | −3.94 φ (−6.81; −1.07) | −3.84 γ (−6.74; −0.95) | −7.46 ψ (−10.38; −4.54) | Age + DQS | 3 | 704 |
| Baseline | −4.18 η (−7.04; −1.31) | −3.91 ε (−6.80; −1.02) | −7.44 ψ (−10.35; −4.52) | Age + DQS + income | 4 | 704 |
Publisher’s Note: MDPI stays neutral with regard to jurisdictional claims in published maps and institutional affiliations. |
© 2021 by the authors. Licensee MDPI, Basel, Switzerland. This article is an open access article distributed under the terms and conditions of the Creative Commons Attribution (CC BY) license (https://creativecommons.org/licenses/by/4.0/).
Share and Cite
Nurtazina, A.; Kozhakhmetova, D.; Dautov, D.; Khaidarova, N.; Chattu, V.K. Association of Early Renal Dysfunction with Lipid Profile Parameters among Hypertensives in Kazakhstan. Diagnostics 2021, 11, 871. https://doi.org/10.3390/diagnostics11050871
Nurtazina A, Kozhakhmetova D, Dautov D, Khaidarova N, Chattu VK. Association of Early Renal Dysfunction with Lipid Profile Parameters among Hypertensives in Kazakhstan. Diagnostics. 2021; 11(5):871. https://doi.org/10.3390/diagnostics11050871
Chicago/Turabian StyleNurtazina, Alma, Dana Kozhakhmetova, Daulet Dautov, Nurzhanat Khaidarova, and Vijay Kumar Chattu. 2021. "Association of Early Renal Dysfunction with Lipid Profile Parameters among Hypertensives in Kazakhstan" Diagnostics 11, no. 5: 871. https://doi.org/10.3390/diagnostics11050871
APA StyleNurtazina, A., Kozhakhmetova, D., Dautov, D., Khaidarova, N., & Chattu, V. K. (2021). Association of Early Renal Dysfunction with Lipid Profile Parameters among Hypertensives in Kazakhstan. Diagnostics, 11(5), 871. https://doi.org/10.3390/diagnostics11050871