
Assessing Baveno VI Criteria Using Liver Stiffness Measured with a 2D-Shear Wave Elastography Technique


Abstract
1. Introduction
2. Materials and Methods
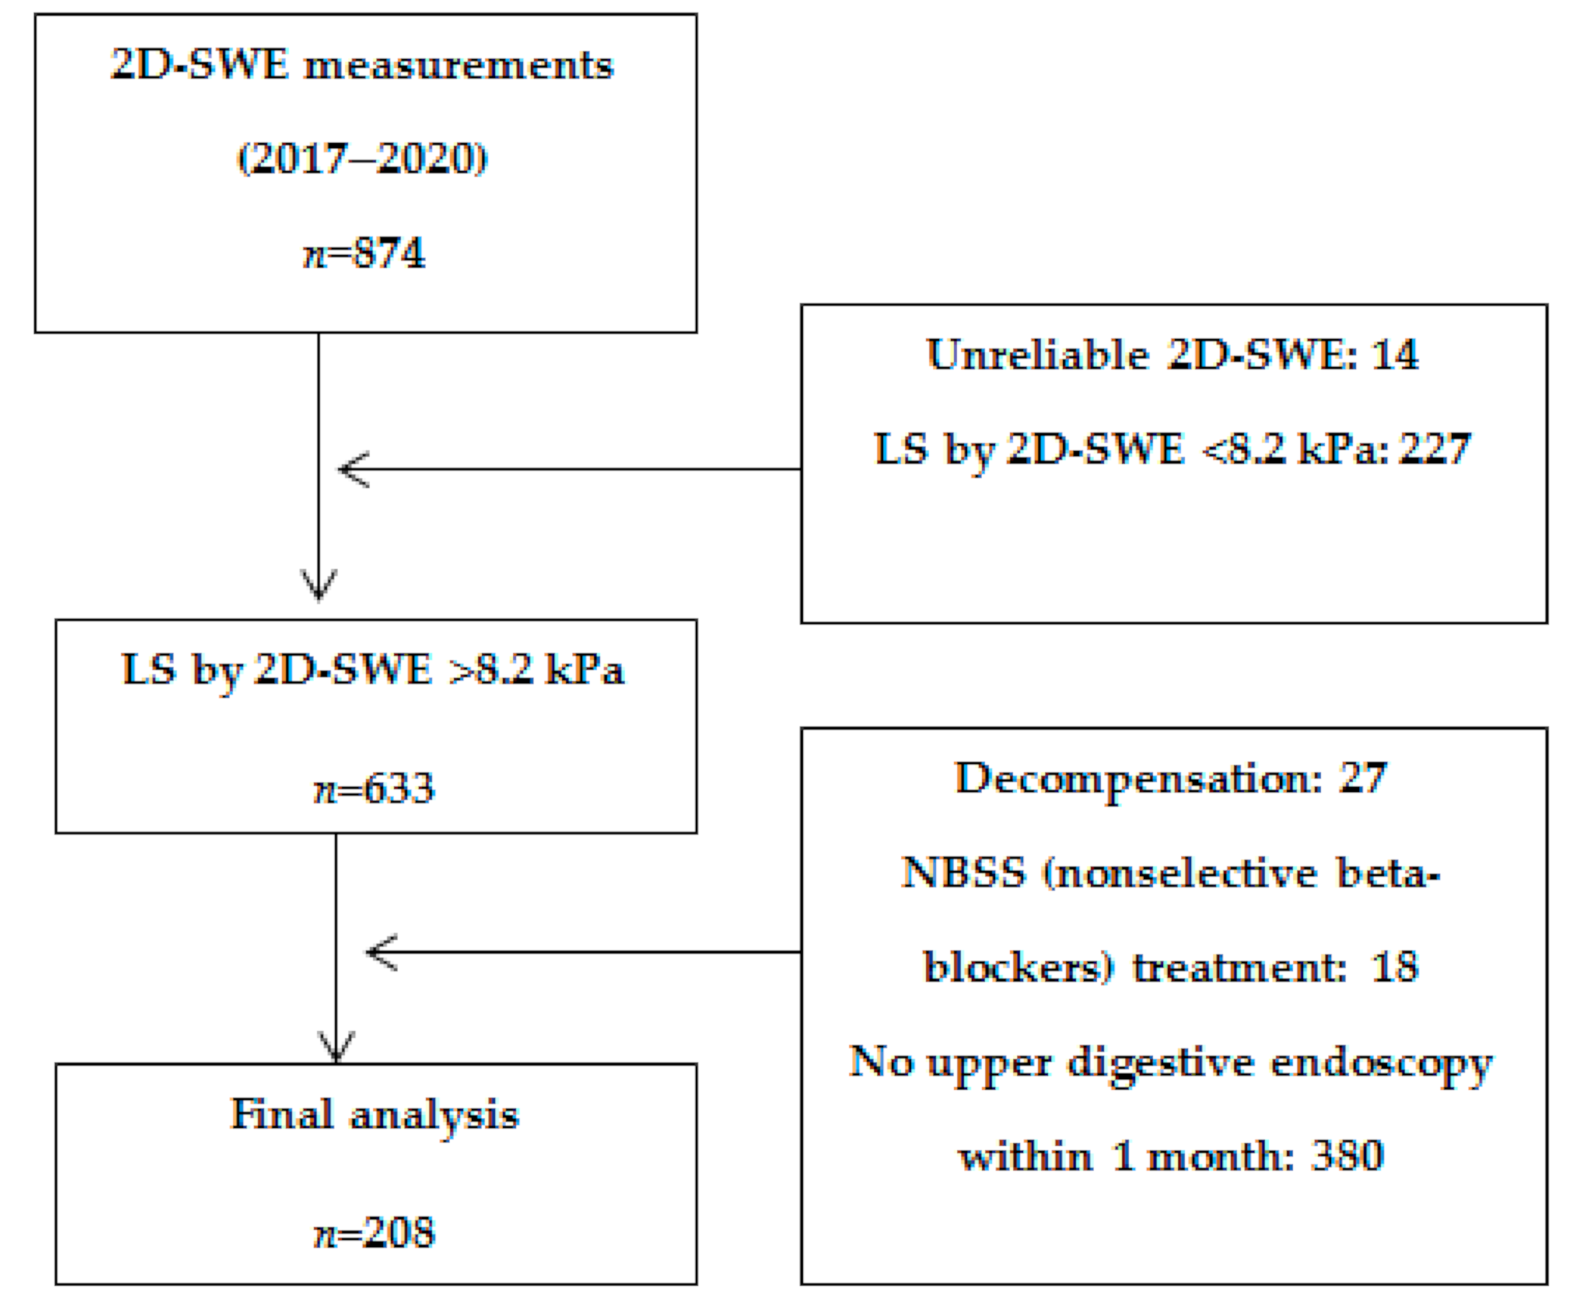
2.1. Subjects
2.2. 2D-SWE Evaluation
2.3. Upper Digestive Endoscopy
2.4. Statistical Analysis
3. Results
4. Discussion
Author Contributions
Funding
Institutional Review Board Statement
Informed Consent Statement
Data Availability Statement
Acknowledgments
Conflicts of Interest
References
- Stefanescu, H.; Procopet, B. Noninvasive assessment of portal hypertension in cirrhosis: Liver stiffness and beyond. World J. Gastroenterol. 2014, 20, 16811–16819. [Google Scholar] [CrossRef]
- Stefanescu, H.; Grigorescu, M.; Lupsor, M.; Procopet, B.; Maniu, A.; Badea, R. Spleen stiffness measurement using Fibroscan for the noninvasive assessment of esophageal varices in liver cirrhosis patients. J. Gastroenterol. Hepatol. 2011, 26, 164–170. [Google Scholar] [CrossRef]
- Ravaioli, F.; Montagnani, M.; Lisotti, A.; Festi, D.; Mazzella, G.; Azzaroli, F. Noninvasive Assessment of Portal Hypertension in Advanced Chronic Liver Disease: An Update. Gastroenterol. Res. Pract. 2018, 2018, 4202091. [Google Scholar] [CrossRef]
- De Franchis, R.; Faculty, B.V. Expanding consensus in portal hypertension: Report of the Baveno VI consensus workshop: Stratifying risk and individualizing care for portal hypertension. J. Hepatol. 2015, 63, 743–752. [Google Scholar] [CrossRef]
- Shi, K.-Q.; Fan, Y.-C.; Pan, Z.-Z.; Lin, X.-F.; Liu, W.-Y.; Chen, Y.-P.; Zheng, M.-H. Transient elastography: A meta-analysis of diagnostic accuracy in evaluation of portal hypertension in chronic liver disease. Liver Int. 2013, 33, 62–71. [Google Scholar] [CrossRef] [PubMed]
- Li, T.; Qu, Y.; Yang, B.; Xue, Y.; Wang, L. Evaluation of large esophageal varices in cirrhotic patients by transient elastography: A meta-analysis. Rev. Esp. Enferm. Dig. 2016, 108, 464–472. [Google Scholar] [CrossRef]
- Cheng, F.; Cao, H.; Liu, J.; Jiang, L.; Han, H.; Zhang, Y.; Guo, D. Meta-analysis of the accuracy of transient elastography in measuring liver stiffness to diagnose esophageal varices in cirrhosis. Medicine 2018, 97, e11368. [Google Scholar] [CrossRef]
- Yu, J.-B.; Xiong, H.; Yuan, X.-C.; Zhou, A.-Y. Liver Stiffness Detected by Shear Wave Elastography Predicts Esophageal Varices in Cirrhotic Patients. Ultrasound Q. 2019. Online ahead of print. [Google Scholar] [CrossRef]
- Procopet, B.; Berzigotti, A.; Abraldes, J.G.; Turon, F.; Hernandez-Gea, V.; García-Pagán, J.C.; Bosch, J. Real-time shear-wave elastography: Applicability, reliability and accuracy for clinically significant portal hypertension. J. Hepatol. 2015, 62, 1068–1075. [Google Scholar] [CrossRef]
- Elkrief, L.; Rautou, P.-E.; Ronot, M.; Lambert, S.; Burgio, M.D.; Francoz, C.; Plessier, A.; Durand, F.; Valla, D.; Lebrec, D.; et al. Prospective comparison of spleen and liver stiffness by using shear-wave and transient elastography for detection of portal hypertension in cirrhosis. Radiology 2015, 275, 589–598. [Google Scholar] [CrossRef]
- Kim, T.Y.; Jeong, W.K.; Sohn, J.H.; Kim, J.; Kim, M.Y.; Kim, Y. Evaluation of portal hypertension by real-time shear wave elastography in cirrhotic patients. Liver Int. 2015, 35, 2416–2424. [Google Scholar] [CrossRef]
- Stefanescu, H.; Rusu, C.; Lupsor-Platon, M.; Farcau, O.N.; Fischer, P.; Grigoras, C.; Horhat, A.; Stancu, O.; Ardelean, A.; Tantau, M.; et al. Liver Stiffness Assessed by Ultrasound Shear Wave Elastography from General Electric Accurately Predicts Clinically Significant Portal Hypertension in Patients with Advanced Chronic Liver Disease. Lebersteifigkeit mittels Ultraschall-Scherwellenelastografie von General Electric zur treffsicheren Vorhersage einer klinisch signifikanten portalen Hypertonie bei Patienten mit fortgeschrittener chronischer Lebererkrankung. Ultraschall Med. 2019, 41, 526–533. [Google Scholar] [CrossRef]
- Berzigotti, A.; Seijo, S.; Arena, U.; Abraldes, J.G.; Vizzutti, F.; García-Pagán, J.C.; Pinzani, M.; Bosch, J. Elastography, spleen size, and platelet count identify portal hypertension in patients with compensated cirrhosis. Gastroenterology 2013, 144, 102–111.e1. [Google Scholar] [CrossRef]
- Kim, B.K.; Han, K.H.; Park, J.Y.; Ahn, S.H.; Kim, J.K.; Paik, Y.H.; Lee, K.S.; Chon, C.Y.; Kim, D.Y. A liver stiffness measurement-based, noninvasive prediction model for high-risk esophageal varices in B-viral liver cirrhosis. Am. J. Gastroenterol. 2010, 105, 1382–1390. [Google Scholar] [CrossRef]
- Ding, N.S.; Nguyen, T.; Iser, D.M.; Hong, T.; Flanagan, E.; Wong, A.; Luiz, L.; Tan, J.Y.; Fulforth, J.; Holmes, J.; et al. Liver stiffness plus platelet count can be used to exclude high-risk oesophageal varices. Liver Int. 2016, 36, 240–245. [Google Scholar] [CrossRef] [PubMed]
- Qi, X.; Li, Y.; Wang, R.; Lin, L.; Li, J.; Wang, L.; Zheng, S.; Sun, Y.; Zhao, L.; Fu, X.; et al. Liaoning Score for Prediction of Esophageal Varices in Cirrhotic Patients Who Had Never Undergone Endoscopy: A Multicenter Cross-Sectional Study in Liaoning Province, China. Adv. Ther. 2019, 36, 2167–2178. [Google Scholar] [CrossRef] [PubMed]
- Colecchia, A.; Montrone, L.; Scaioli, E.; Bacchi-Reggiani, M.L.; Colli, A.; Casazza, G.; Schiumerini, R.; Turco, L.; Di Biase, A.R.; Mazzella, G.; et al. Measurement of spleen stiffness to evaluate portal hypertension and the presence of esophageal varices in patients with HCV-related cirrhosis. Gastroenterology 2012, 143, 646–654. [Google Scholar] [CrossRef] [PubMed]
- Jansen, C.; Bogs, C.; Verlinden, W.; Thiele, M.; Möller, P.; Görtzen, J.; Lehmann, J.; Vanwolleghem, T.; Vonghia, L.; Praktiknjo, M.; et al. Shear-wave elastography of the liver and spleen identifies clinically significant portal hypertension: A prospective multicentre study. Liver Int. 2016, 37, 396–405. [Google Scholar] [CrossRef]
- Takuma, Y.; Nouso, K.; Morimoto, Y.; Tomokuni, J.; Sahara, A.; Toshikuni, N.; Takabatake, H.; Shimomura, H.; Doi, A.; Sakakibara, I.; et al. Measurement of spleen stiffness by acoustic radiation force impulse imaging identifies cirrhotic patients with esophageal varices. Gastroenterology 2013, 144, 92–101. [Google Scholar] [CrossRef]
- Bende, F.; Sporea, I.; Șirli, R.; Popescu, A.; Mare, R.; Miuțescu, B.; Lupușoru, R.; Moga, T.; Pienar, C. Performance of 2D-SWE.GE for predicting different stages of liver fibrosis using Transient Elastography as the reference method. Med. Ultrason. 2017, 19, 143–149. [Google Scholar] [CrossRef]
- Fofiu, R.; Bende, F.; Popescu, A.; Şirli, R.; Lupușoru, R.; Ghiuchici, A.M.; Sporea, I. Spleen and Liver Stiffness for Predicting High-Risk Varices in Patients with Compensated Liver Cirrhosis. Ultrasound Med. Biol. 2021, 47, 76–83. [Google Scholar] [CrossRef] [PubMed]
- Dietrich, C.F.; Bamber, J.; Berzigotti, A.; Bota, S.; Cantisani, V.; Castera, L.; Cosgrove, D.; Ferraioli, G.; Friedrich-Rust, M.; Gilja, O.H.; et al. EFSUMB Guidelines and Recommendations on the Clinical Use of Liver Ultrasound Elastography, Update 2017 (Long Version). Ultraschall Med. 2017, 38, e48. [Google Scholar] [PubMed]
- Ferraioli, G.; Filice, C.; Castera, L.; Choi, B.I.; Sporea, I.; Wilson, S.R.; Cosgrove, D.; Dietrich, C.F.; Amy, D.; Bamber, J.C.; et al. WFUMB guidelines and recommendations for clinical use of ultrasound elastography: Part 3: Liver. Ultrasound Med. Biol. 2015, 41, 1161–1179. [Google Scholar] [CrossRef] [PubMed]
- Stefanescu, H.; Grigorescu, M.; Lupsor, M.; Maniu, A.; Crisan, D.; Procopet, B.; Feier, D.; Badea, R. A new and simple algorithm for the noninvasive assessment of esophageal varices in cirrhotic patients using serum fibrosis markers and transient elastography. J. Gastrointestin. Liver Dis. 2011, 20, 57–64. [Google Scholar]
- Gracia-Sancho, J.; Lavina, B.; Rodriguez-Vilarrupla, A.; Garcia-Caldero, H.; Bosch, J.; Garcia-Pagan, J.C. Enhanced vasoconstrictor prostanoid production by sinusoidal endothelial cells increases portal perfusion pressure in cirrhotic rat livers. J. Hepatol. 2007, 47, 220–227. [Google Scholar] [CrossRef]
- Fernandez, M.; Mejias, M.; Angermayr, B.; Garcia-Pagan, J.C.; Rodes, J.; Bosch, J. Inhibition of VEGF receptor-2 decreases the development of hyperdynamic splanchnic circulation and portal-systemic collateral vessels in portal hypertensive rats. J. Hepatol. 2005, 43, 98–103. [Google Scholar] [CrossRef]
- Augustin, S.; Pons, M.; Maurice, J.B.; Bureau, C.; Stefanescu, H.; Ney, M.; Blasco, H.; Procopet, B.; Tsochatzis, E.; Westbrook, R.H.; et al. Expanding the Baveno VI criteria for the screening of varices in patients with compensated advanced chronic liver disease. Hepatology 2017, 66, 1980–1988. [Google Scholar] [CrossRef]
- Moga, T.V.; Stepan, A.M.; Pienar, C.; Bende, F.; Popescu, A.; Șirli, R.; Dănilă, M.; Sporea, I. Intra- and inter-observer reproducibility of a 2-D shear wave Elastography technique and the impact of ultrasound experience in achieving reliable data. Ultrasound Med. Biol. 2018, 44, 1627–1637. [Google Scholar] [CrossRef]
- Kim, T.Y.; Kim, T.Y.; Kim, Y.; Lim, S.; Jeong, W.K.; Sohn, J.H. Diagnostic performance of shear wave elastography for predicting esophageal varices in patients with compensated liver cirrhosis. J. Ultrasound Med. 2016, 35, 1373–1381. [Google Scholar] [CrossRef]
- Garcovich, M.; Di Stasio, E.; Zocco, M.A.; Riccardi, L.; Ainora, M.E.; Annicchiarico, B.E.; Gibiino, G.; Santopaolo, F.; Gasbarrini, A.; Pompili, M. Assessing Baveno VI criteria with liver stiffness measured using a new point-shear wave elastography technique (BAVElastPQ study). Liver Int. 2020, 40, 1952–1960. [Google Scholar] [CrossRef]


| Parameter | All Subjects (n = 208) | no HRV n = 134 (64.4%) | HRV n = 74 (35.6%) | p Value |
|---|---|---|---|---|
| Age (years) | 58.2 ± 10.4 | 58.7 ± 10.3 | 57.2 ± 10.7 | p = 0.322 |
| Gender | ||||
| Female | 58.2% (121/208) | 68% (91) | 40.5% (30) | p = 0.0002 |
| Male | 41.8% (87/208) | 32% (43) | 59.5% (44) | p = 0.0002 |
| Etiology | ||||
| HCV | 73% (152/208) | 82% (110) | 56.8% (42) | p = 0.0002 |
| HBV | 5.8% (12/208) | 4.5% (6) | 8.1% (6) | p = 0.450 |
| ALD | 16.9% (35/208) | 10.5% (14) | 28.4% (21/74) | p = 0.0019 |
| NAFLD | 2.4% (5/208) | 1.5% (2) | 4% (3/74) | p = 0.511 |
| PBC | 1.9% (4/208) | 1.5% (2) | 2.7% (2/74) | p = 0.939 |
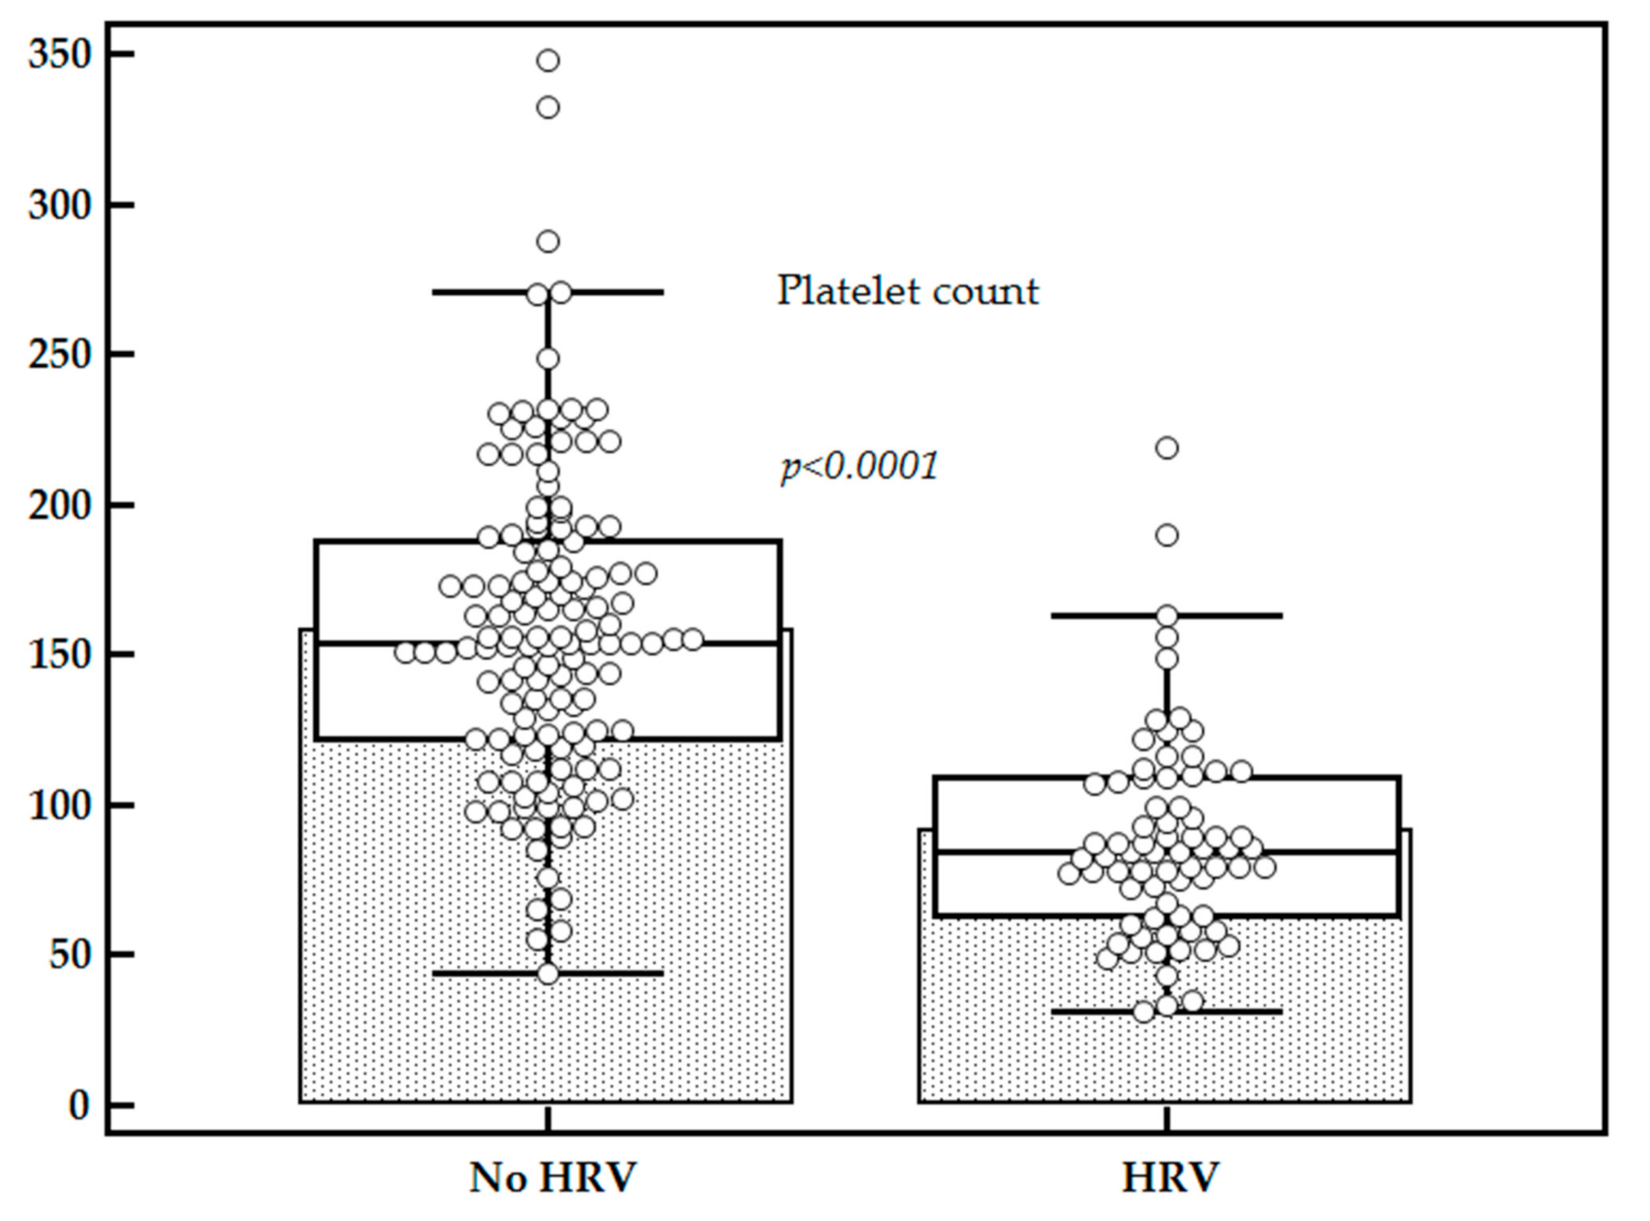
| Platelet count (×109/L) | 134.40 ± 58.66 | 158.19 ± 52.15 | 91.33 ± 43.38 | p < 0.0001 |
| LS by 2D-SWE (kPa) | 12.70 ± 2.56 | 11.89 ± 2.39 | 14.25 ± 2.12 | p < 0.0001 |
| Without EV | No HRV (Gr 1 EV) | HRV | |
|---|---|---|---|
| All subjects | 82/208 (39.4%) | 52/208 (25%) | 74/208 (35.6%) |
| LS < 12 kPa (n = 85) | 59/85 (69.4%) | 22/85 (25.9%) | 4/85 (4.7%) |
| LS > 12 kPa (n = 123) | 23/123 (18.7%) | 30/123 (24.4%) | 70/123 (56.9%) |
| Platelets > 150 000/mm3 (n = 84) | 64/84 (76.2%) | 15/84 (17.9%) | 5/84 (5.9%) |
| Platelets < 150 000/mm3 (n = 124) | 18/124 (14.5%) | 37/124 (29.8%) | 69/124 (55.7%) |
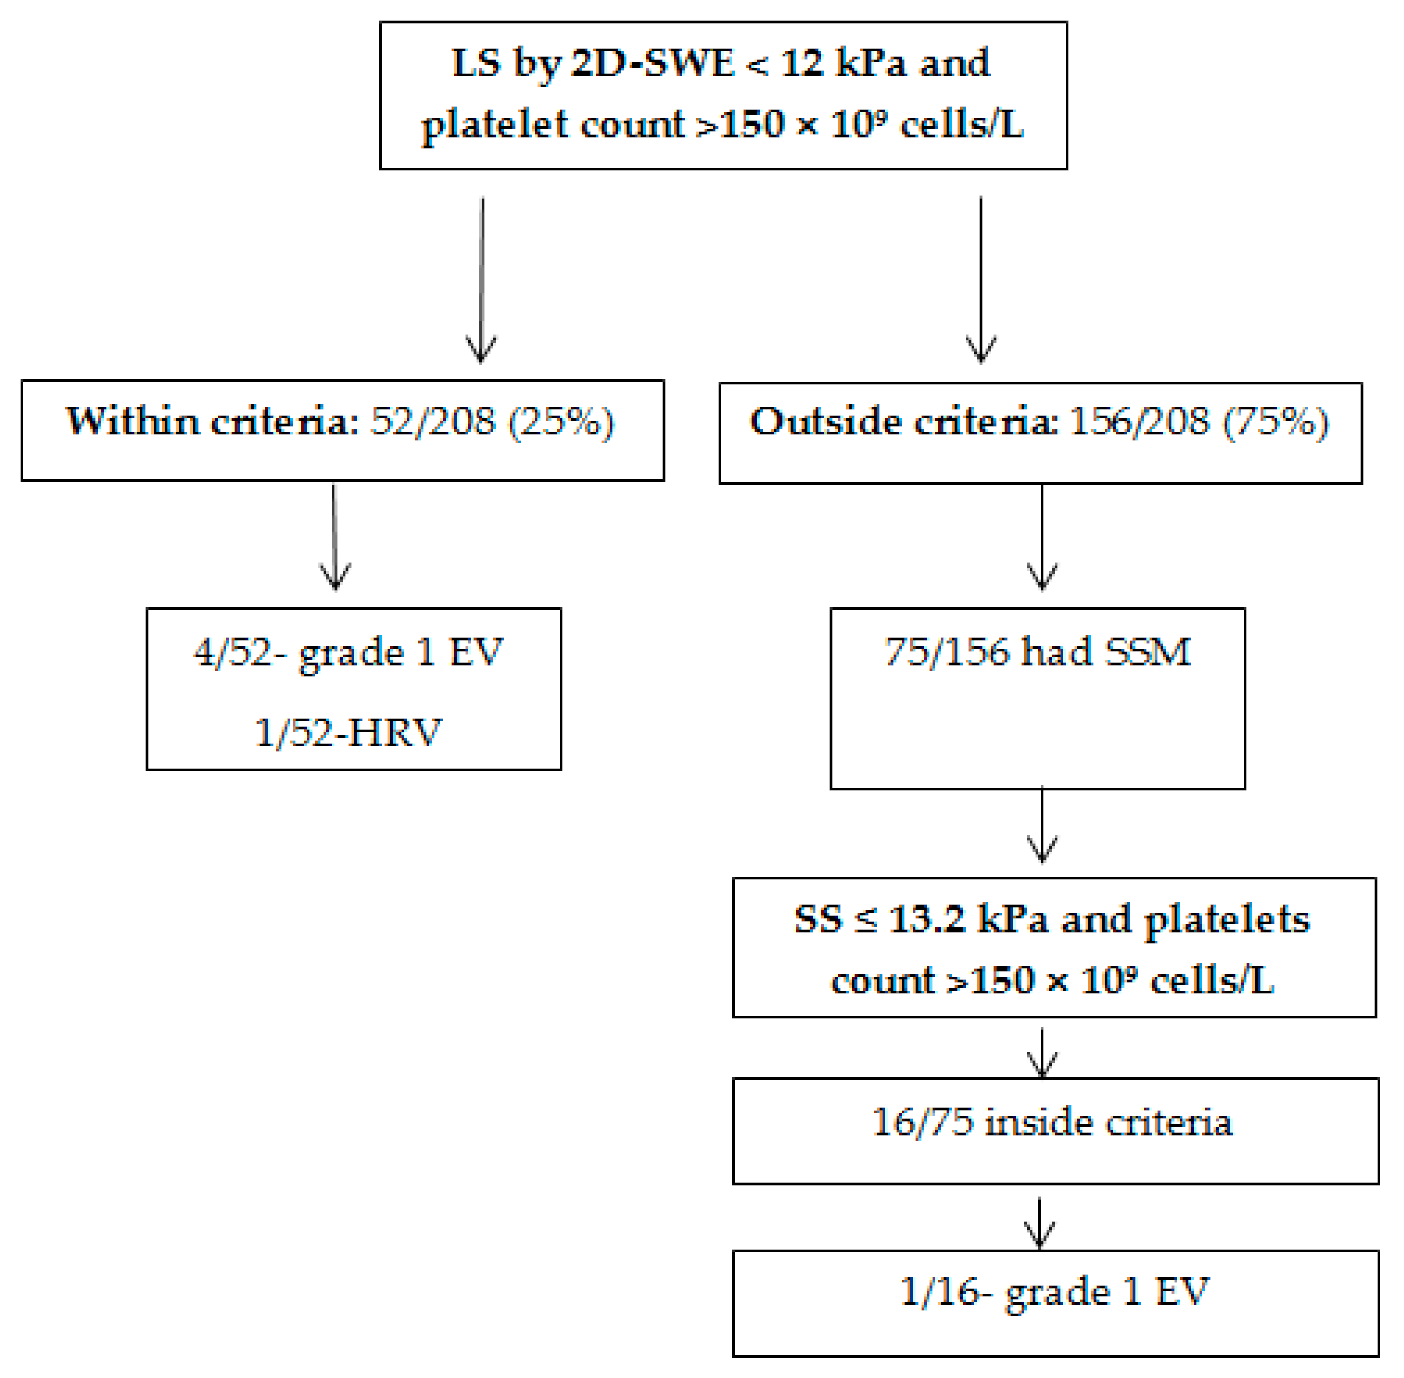
| Within 2D-SWE Baveno criteria (n = 52) | 47/52 (90.4%) | 4/52 (7.7%) | 1/52 (1.9%) |
| Outside 2D-SWE Baveno criteria (n = 156) | 36/156 (23.1%) | 47/156 (30.1%) | 73/156 (46.8%) |
| Parameter | LS by 2D-SWE | Platelet Count | 2D-SWE Baveno Criteria |
|---|---|---|---|
| Se (%) (95% CI) | 94.5 [86.7–98.5] | 93.2 [84.9–97.8] | 98.6 [92.7–100.0] |
| Sp (%) (95% CI) | 60.5 [51.6–68.8] | 58.9 [50.1–67.4] | 38.0 [29.8–46.8] |
| PPV (%) (95% CI) | 56.9 [47.7–65.8] | 55.6 [46.5–64.6] | 46.8 [38.8–54.9] |
| NPV (%) (95% CI) | 95.3 [88.3–98.7] | 94.0 [86.7–98.0] | 98.1 [89.6–100.0] |
| LR+ (95% CI) | 2.4 [1.9–3.0] | 2.2 [1.8–2.8] | 1. 6 [1.4–1.8] |
| LR− (95% CI) | 0.08 [0.03–0.2] | 0.11 [0.05–0.3] | 0.036 [0.005–0.3] |
Publisher’s Note: MDPI stays neutral with regard to jurisdictional claims in published maps and institutional affiliations. |
© 2021 by the authors. Licensee MDPI, Basel, Switzerland. This article is an open access article distributed under the terms and conditions of the Creative Commons Attribution (CC BY) license (https://creativecommons.org/licenses/by/4.0/).
Share and Cite
Fofiu, R.; Bende, F.; Popescu, A.; Șirli, R.; Miuţescu, B.; Sporea, I. Assessing Baveno VI Criteria Using Liver Stiffness Measured with a 2D-Shear Wave Elastography Technique. Diagnostics 2021, 11, 737. https://doi.org/10.3390/diagnostics11050737
Fofiu R, Bende F, Popescu A, Șirli R, Miuţescu B, Sporea I. Assessing Baveno VI Criteria Using Liver Stiffness Measured with a 2D-Shear Wave Elastography Technique. Diagnostics. 2021; 11(5):737. https://doi.org/10.3390/diagnostics11050737
Chicago/Turabian StyleFofiu, Renata, Felix Bende, Alina Popescu, Roxana Șirli, Bogdan Miuţescu, and Ioan Sporea. 2021. "Assessing Baveno VI Criteria Using Liver Stiffness Measured with a 2D-Shear Wave Elastography Technique" Diagnostics 11, no. 5: 737. https://doi.org/10.3390/diagnostics11050737
APA StyleFofiu, R., Bende, F., Popescu, A., Șirli, R., Miuţescu, B., & Sporea, I. (2021). Assessing Baveno VI Criteria Using Liver Stiffness Measured with a 2D-Shear Wave Elastography Technique. Diagnostics, 11(5), 737. https://doi.org/10.3390/diagnostics11050737