
Comparison of [18F]FDG PET/CT and MRI for Treatment Response Assessment in Multiple Myeloma: A Meta-Analysis


Abstract
1. Introduction
2. Materials and Methods
2.1. Data Sources Eligibility
2.2. Data Extraction
2.3. Statistical Analysis
3. Results
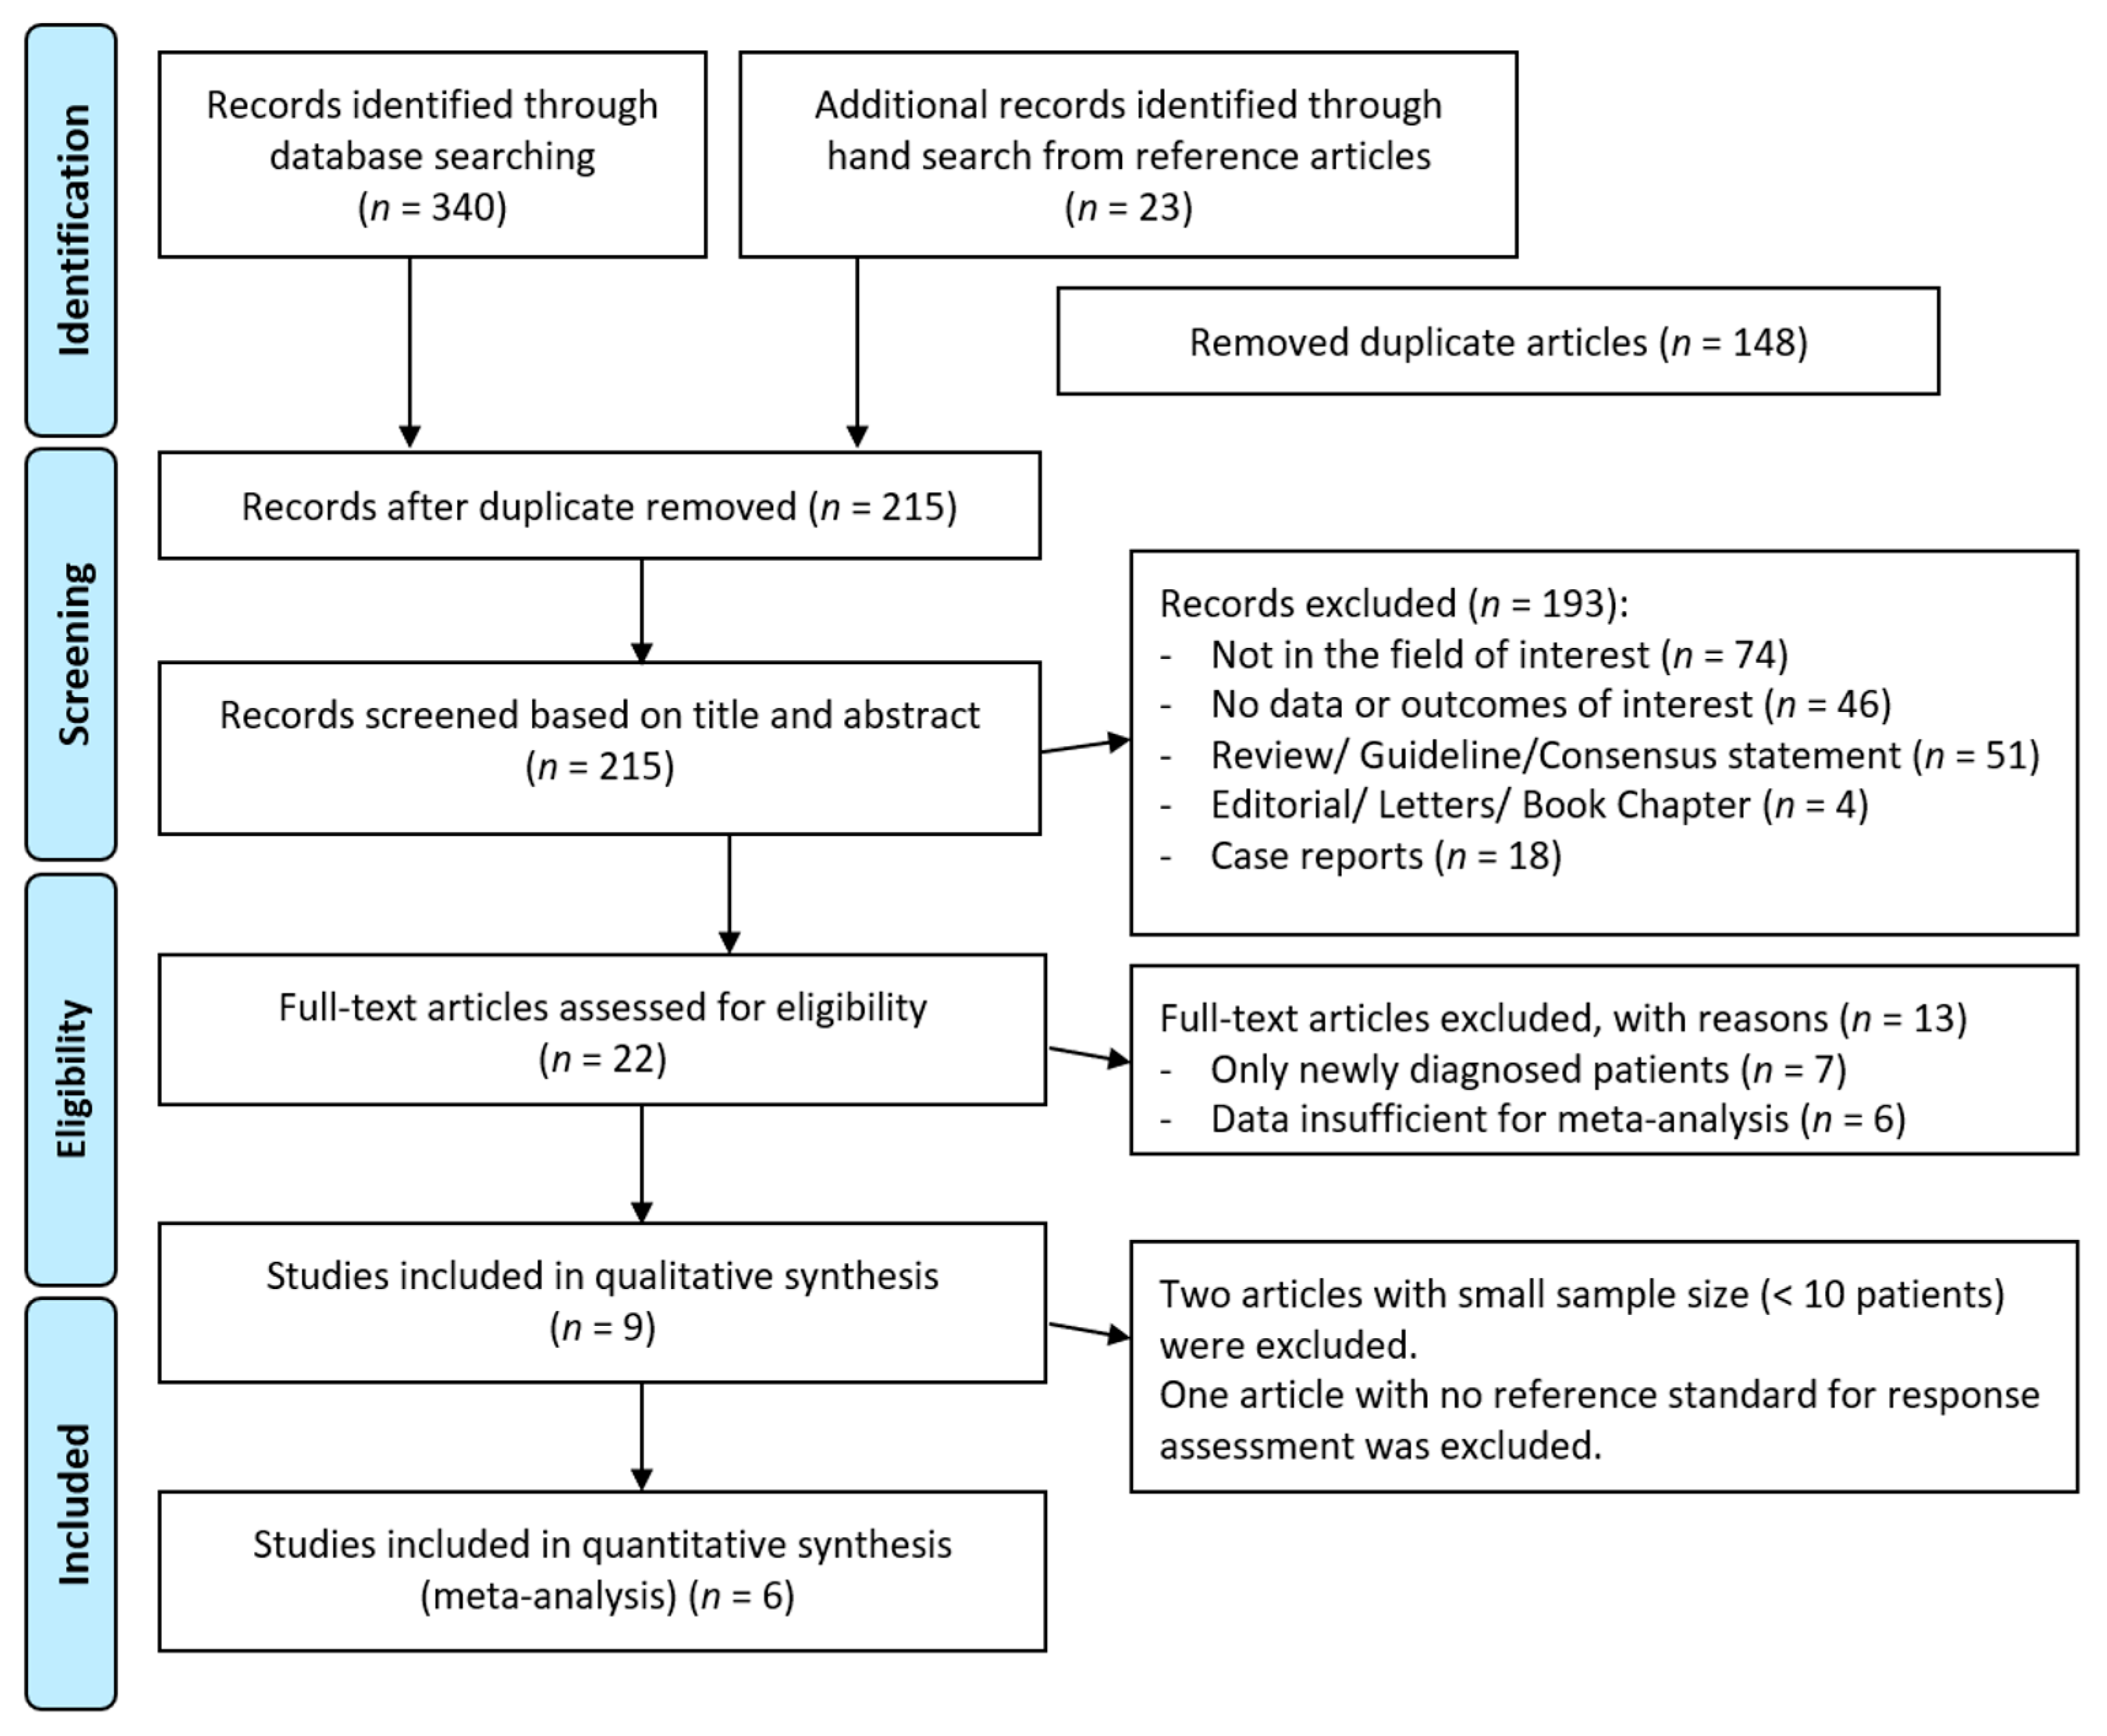
3.1. Article Search
3.2. Pooled Diagnostic Performance (Meta-Analysis)
- -
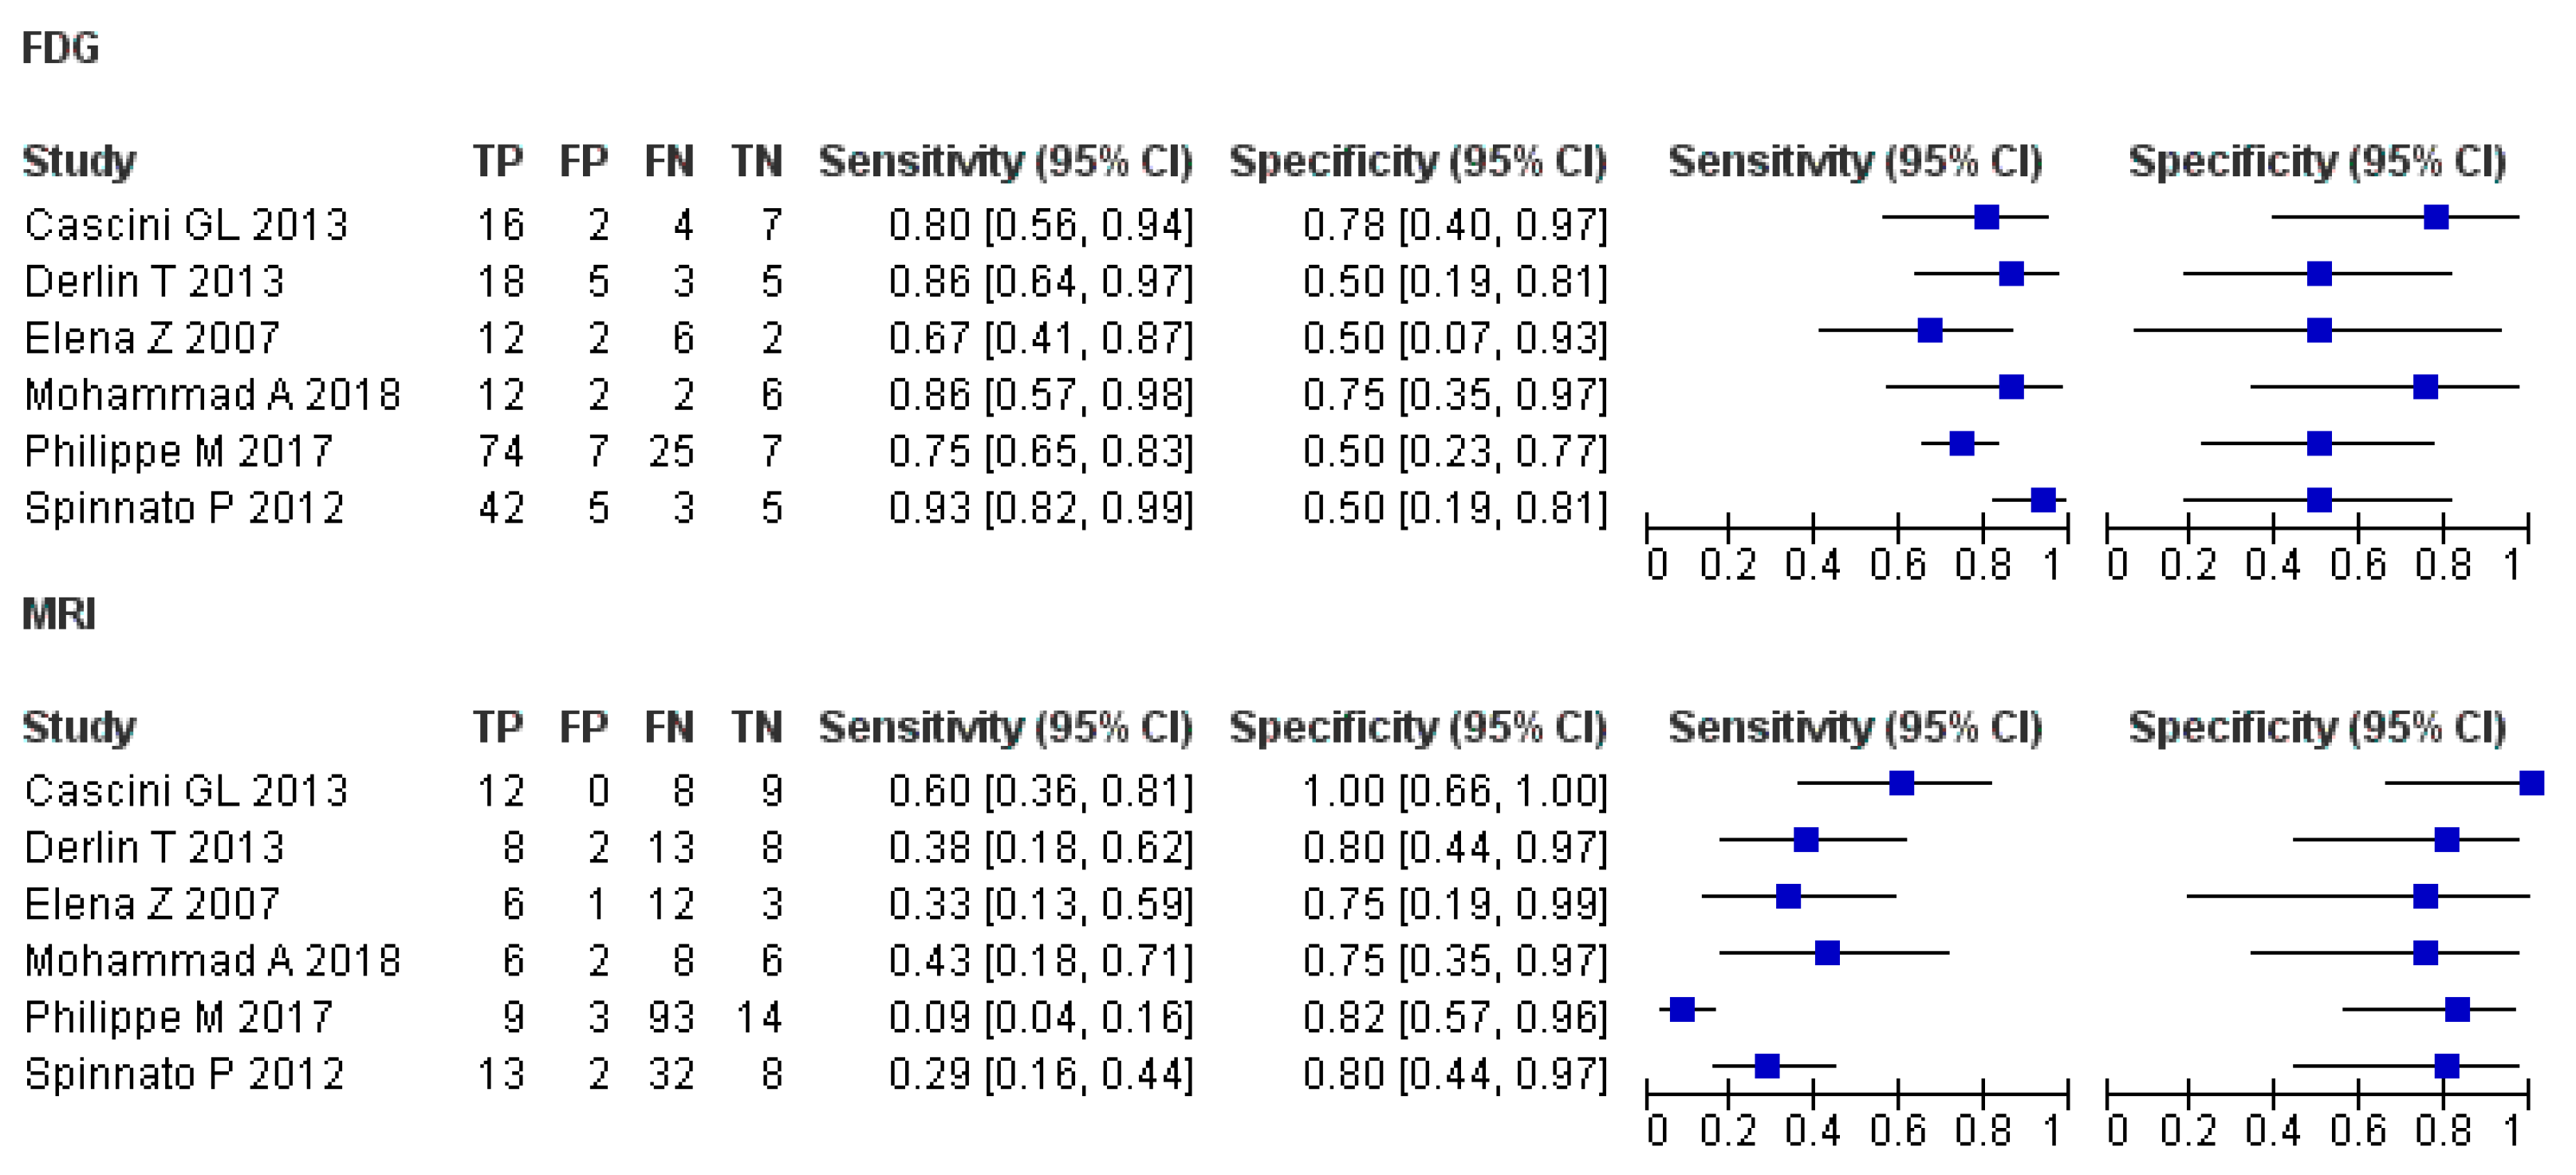
- [18F]FDG PET or PET/CT
- -
- MRI
- -
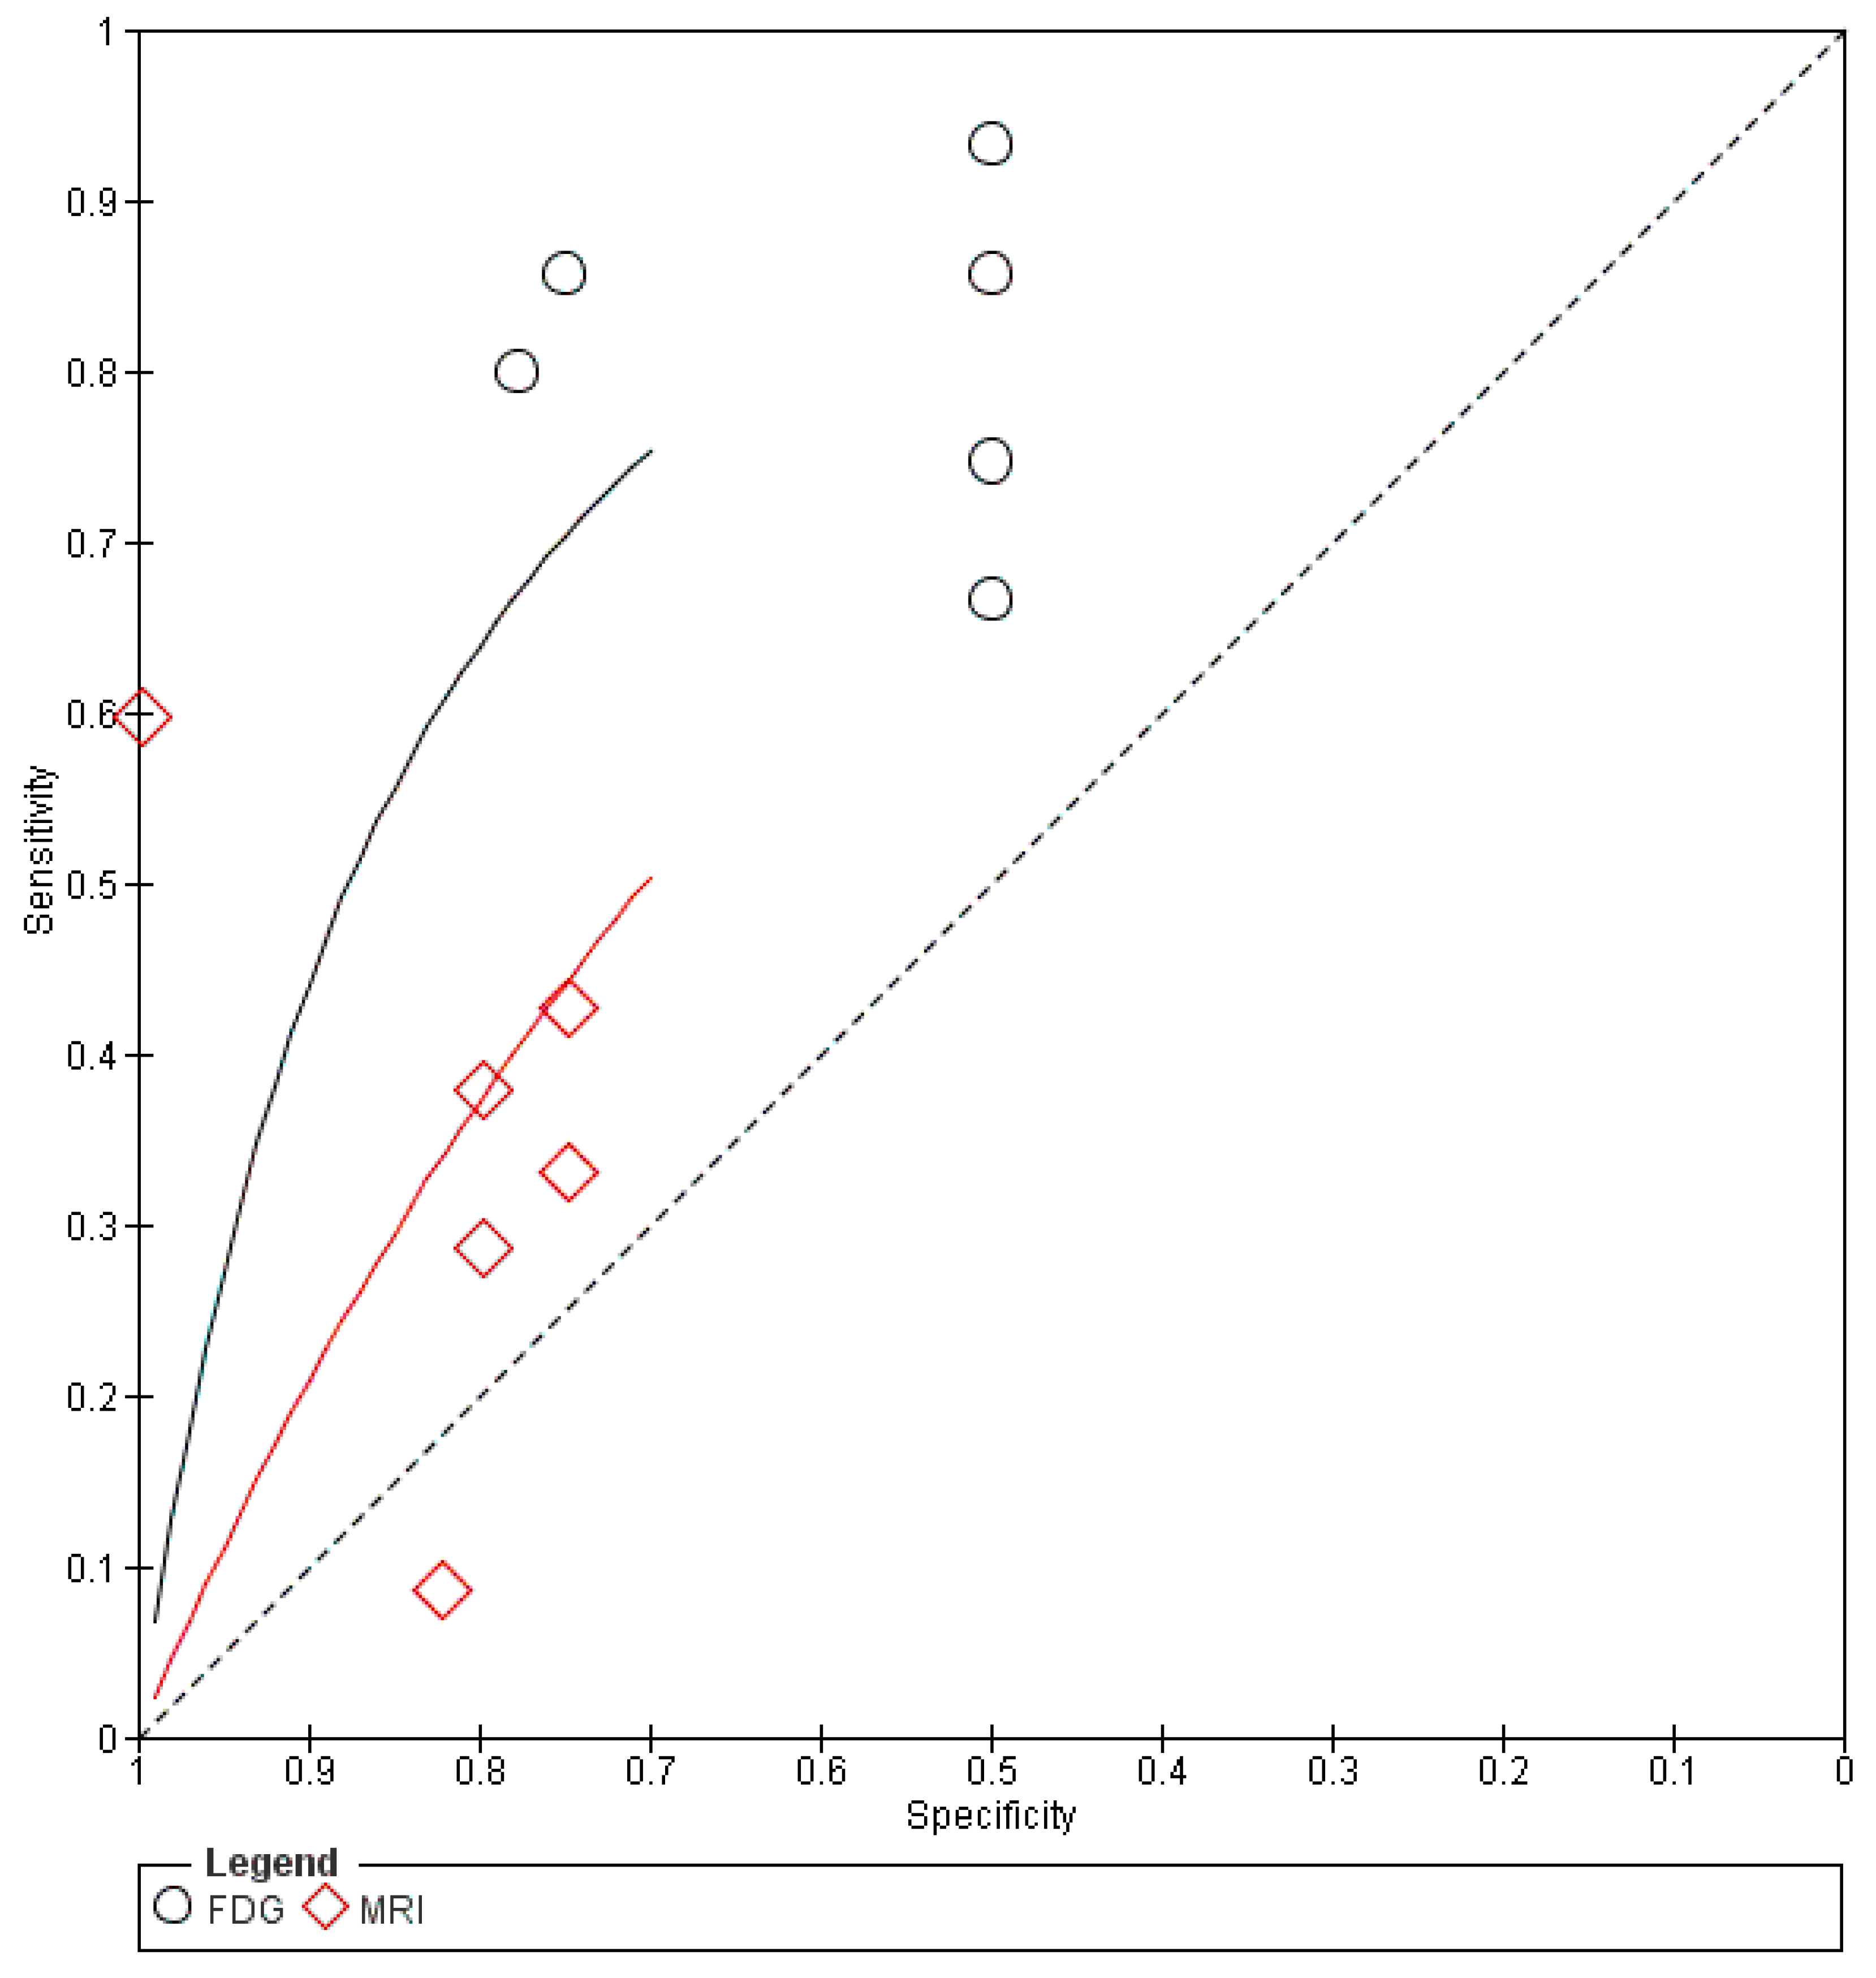
- Comparison of imaging modalities
4. Discussion
Supplementary Materials
Author Contributions
Funding
Informed Consent Statement
Data Availability Statement
Acknowledgments
Conflicts of Interest
References
- Rajkumar, S.V.; Dimopoulos, M.A.; Palumbo, A.; Blade, J.; Merlini, G.; Mateos, M.-V.; Kumar, S.; Hillengass, J.; Kastritis, E.; Richardson, P.; et al. International Myeloma Working Group updated criteria for the diagnosis of multiple myeloma. Lancet Oncol. 2014, 15, e538–e548. [Google Scholar] [CrossRef]
- Rajkumar, S.V. Multiple myeloma: 2014 Update on diagnosis, risk-stratification, and management. Am. J. Hematol. 2014, 89, 998–1009. [Google Scholar] [CrossRef] [PubMed]
- Sager, S.; Ergül, N.; Ciftci, H.; Cetin, G.; Güner, S.I.; Cermik, T.F. The value of FDG PET/CT in the initial staging and bone marrow involvement of patients with multiple myeloma. Skelet. Radiol. 2011, 40, 843–847. [Google Scholar] [CrossRef] [PubMed]
- Zaidi, H.; Montandon, M.-L.; Alavi, A. The Clinical Role of Fusion Imaging Using PET, CT, and MR Imaging. Magn. Reson. Imaging Clin. N. Am. 2010, 18, 133–149. [Google Scholar] [CrossRef]
- Hillengass, J.; Usmani, S.; Rajkumar, S.V.; Durie, B.G.M.; Mateos, M.-V.; Lonial, S.; Joao, C.; Anderson, K.C.; García-Sanz, R.; Riva, E.; et al. International myeloma working group consensus recommendations on imaging in monoclonal plasma cell disorders. Lancet Oncol. 2019, 20, e302–e312. [Google Scholar] [CrossRef]
- Fonti, R.; Salvatore, B.; Quarantelli, M.; Sirignano, C.; Segreto, S.; Petruzziello, F.; Catalano, L.; Liuzzi, R.; Rotoli, B.; Del Vecchio, S.; et al. 18F-FDG PET/CT, 99mTc-MIBI, and MRI in Evaluation of Patients with Multiple Myeloma. J. Nucl. Med. 2008, 49, 195–200. [Google Scholar] [CrossRef] [PubMed]
- Derlin, T.; Peldschus, K.; Münster, S.; Bannas, P.; Herrmann, J.; Stübig, T.; Habermann, C.R.; Adam, G.; Kröger, N.; Weber, C. Comparative diagnostic performance of 18F-FDG PET/CT versus whole-body MRI for determination of remission status in multiple myeloma after stem cell transplantation. Eur. Radiol. 2012, 23, 570–578. [Google Scholar] [CrossRef] [PubMed]
- Durie, B.G.M.; Waxman, A.D.; D’Agnolo, A.; Williams, C.M. Whole-body (18)F-FDG PET identifies high-risk myeloma. J. Nucl. Med. 2002, 43. [Google Scholar]
- Nanni, C.; Zamagni, E.; Farsad, M.; Castellucci, P.; Tosi, P.; Cangini, D.; Salizzoni, E.; Canini, R.; Cavo, M.; Fanti, S. Role of 18F-FDG PET/CT in the assessment of bone involvement in newly diagnosed multiple myeloma: Preliminary results. Eur. J. Nucl. Med. Mol. Imaging 2006, 33, 525–531. [Google Scholar] [CrossRef] [PubMed]
- Bartel, T.B.; Haessler, J.; Brown, T.L.Y.; Shaughnessy, J.J.D.; Van Rhee, F.; Anaissie, E.; Alpe, T.; Angtuaco, E.; Walker, R.; Epstein, J.; et al. F18-fluorodeoxyglucose positron emission tomography in the context of other imaging techniques and prognostic factors in multiple myeloma. Blood 2009, 114, 2068–2076. [Google Scholar] [CrossRef] [PubMed]
- Zamagni, E.; Patriarca, F.; Nanni, C.; Zannetti, B.; Englaro, E.; Pezzi, A.; Tacchetti, P.; Buttignol, S.; Perrone, G.; Brioli, A.; et al. Prognostic relevance of 18-F FDG PET/CT in newly diagnosed multiple myeloma patients treated with up-front autologous transplantation. Blood 2011, 118, 5989–5995. [Google Scholar] [CrossRef] [PubMed]
- Hillengass, J.; Landgren, O. Challenges and opportunities of novel imaging techniques in monoclonal plasma cell disorders: Imaging “early myeloma”. Leuk. Lymphoma 2013, 54, 1355–1363. [Google Scholar] [CrossRef] [PubMed]
- Zamagni, E.; Nanni, C.; Patriarca, F.; Englaro, E.; Castellucci, P.; Geatti, O.; Tosi, P.; Tacchetti, P.; Cangini, D.; Perrone, G.; et al. A prospective comparison of 18F-fluorodeoxyglucose positron emission tomography-computed tomography, magnetic resonance imaging and whole-body planar radiographs in the assessment of bone disease in newly diagnosed multiple myeloma. Haematologica 2007, 92, 50–55. [Google Scholar] [CrossRef] [PubMed]
- Gariani, J.; Westerland, O.; Natas, S.; Verma, H.; Cook, G.; Goh, V. Comparison of whole body magnetic resonance imaging (WBMRI) to whole body computed tomography (WBCT) or 18 F-fluorodeoxyglucose positron emission tomography/CT (18 F-FDG PET/CT) in patients with myeloma: Systematic review of diagnostic performance. Crit. Rev. Oncol. 2018, 124, 66–72. [Google Scholar] [CrossRef]
- The National Institute for Health and Care Excellence. Myeloma: Diagnosis and Management 2016. Available online: https://www.nice.org.uk/guidance/ng35 (accessed on 8 December 2020).
- Messiou, C.; Hillengass, J.; Delorme, S.; Lecouvet, F.E.; Moulopoulos, L.A.; Collins, D.J.; Blackledge, M.D.; Abildgaard, N.; Østergaard, B.; Schlemmer, H.-P.; et al. Guidelines for Acquisition, Interpretation, and Reporting of Whole-Body MRI in Myeloma: Myeloma Response Assessment and Diagnosis System (MY-RADS). Radiology 2019, 291, 5–13. [Google Scholar] [CrossRef]
- Spinnato, P.; Bazzocchi, A.; Brioli, A.; Nanni, C.; Zamagni, E.; Albisinni, U.; Cavo, M.; Fanti, S.; Battista, G.; Salizzoni, E. Contrast enhanced MRI and 18F-FDG PET-CT in the assessment of multiple myeloma: A comparison of results in different phases of the disease. Eur. J. Radiol. 2012, 81, 4013–4018. [Google Scholar] [CrossRef]
- Basha, M.A.A.; Hamed, M.A.G.; Refaat, R.; AlAzzazy, M.Z.; Bessar, M.A.; Mohamed, E.M.; Ahmed, A.F.; Tantawy, H.F.; Altaher, K.M.; Obaya, A.A.; et al. Diagnostic performance of 18F-FDG PET/CT and whole-body MRI before and early after treatment of multiple myeloma: A prospective comparative study. Jpn. J. Radiol. 2018, 36, 382–393. [Google Scholar] [CrossRef]
- Moreau, P.; Attal, M.; Caillot, D.; Macro, M.; Karlin, L.; Garderet, L.; Facon, T.; Benboubker, L.; Escoffre-Barbe, M.; Stoppa, A.-M.; et al. Prospective Evaluation of Magnetic Resonance Imaging and [18F]Fluorodeoxyglucose Positron Emission Tomography-Computed Tomography at Diagnosis and Before Maintenance Therapy in Symptomatic Patients With Multiple Myeloma Included in the IFM/DFCI 2009 Trial: Results of the IMAJEM Study. J. Clin. Oncol. 2017, 35, 2911–2918. [Google Scholar] [CrossRef]
- Lu, Y.-Y.; Chen, J.-H.; Lin, W.-Y.; Liang, J.-A.; Wang, H.-Y.; Tsai, S.-C.; Kao, C.-H. FDG PET or PET/CT for Detecting Intramedullary and Extramedullary Lesions in Multiple Myeloma. Clin. Nucl. Med. 2012, 37, 833–837. [Google Scholar] [CrossRef]
- Moher, D.; Liberati, A.; Tetzlaff, J.; Altman, D.G.; For the PRISMA Group. Preferred reporting items for systematic reviews and meta-analyses: The PRISMA statement. BMJ 2009, 339, b2535. [Google Scholar] [CrossRef]
- Whiting, P.F.; Rutjes, A.W.; Westwood, M.E.; Mallett, S.; Deeks, J.J.; Reitsma, J.B.; Leeflang, M.M.; Sterne, J.A.; Bossuyt, P.M.M.; The QUADAS-2 Group. QUADAS-2: A Revised Tool for the Quality Assessment of Diagnostic Accuracy Studies. Ann. Intern. Med. 2011, 155, 529–536. [Google Scholar] [CrossRef]
- Zamora, J.; Abraira, V.; Muriel, A.; Khan, K.; Coomarasamy, A. Meta-DiSc: A software for meta-analysis of test accuracy data. BMC Med. Res. Methodol. 2006, 6, 31. [Google Scholar] [CrossRef] [PubMed]
- Higgins, J.P.T.; Thompson, S.G. Quantifying heterogeneity in a meta-analysis. Stat. Med. 2002, 21, 1539–1558. [Google Scholar] [CrossRef] [PubMed]
- Cascini, G.L.; Falcone, C.; Console, D.; Restuccia, A.; Rossi, M.; Parlati, A.; Tamburrini, O. Whole-body MRI and PET/CT in multiple myeloma patients during staging and after treatment: Personal experience in a longitudinal study. La Radiol. Med. 2013, 118, 930–948. [Google Scholar] [CrossRef] [PubMed]
- Bladé, J.; Samson, D.; Reece, D.; Apperley, J.; Björkstrand, B.; Gahrton, G.; Gertz, M.; Giralt, S.; Jagannath, S.; Vesole, D. Criteria for Evaluating Disease Response and Progression in Patients with Multiple Myeloma Treated by High-Dose Therapy and Haemopoietic Stem Cell Transplantation. Br. J. Haematol. 1998, 102, 1115–1123. [Google Scholar] [CrossRef]
- Durie, B.G.M.; Harousseau, J.-L.; Miguel, J.S.; Bladé, J.; Barlogie, B.; Anderson, K.; Gertz, M.; Dimopoulos, M.; Westin, J.; Sonneveld, P.; et al. International uniform response criteria for multiple myeloma. Leukemia 2006, 20, 1467–1473. [Google Scholar] [CrossRef] [PubMed]
- Gallamini, A.; Zwarthoed, C.; Borra, A. Positron Emission Tomography (PET) in Oncology. Cancers 2014, 6, 1821–1889. [Google Scholar] [CrossRef]
- Ben-Haim, S.; Ell, P. 18F-FDG PET and PET/CT in the Evaluation of Cancer Treatment Response. J. Nucl. Med. 2008, 50, 88–99. [Google Scholar] [CrossRef]
- Usmani, S.Z.; Mitchell, A.; Waheed, S.; Crowley, J.; Hoering, A.; Petty, N.; Brown, T.; Bartel, T.; Anaissie, E.; Van Rhee, F.; et al. Prognostic implications of serial 18-fluoro-deoxyglucose emission tomography in multiple myeloma treated with total therapy. Blood 2013, 121, 1819–1823. [Google Scholar] [CrossRef]
- Caers, J.; Garderet, L.; Kortüm, K.M.; O’Dwyer, M.E.; Van De Donk, N.W.; Binder, M.; Dold, S.M.; Gay, F.; Corre, J.; Beguin, Y.; et al. European Myeloma Network recommendations on tools for the diagnosis and monitoring of multiple myeloma: What to use and when. Haematologica 2018, 103, 1772–1784. [Google Scholar] [CrossRef]
- Pawlyn, C.; Fowkes, L.; Otero, S.; Jones, J.R.; Boyd, K.D.; Davies, F.E.; Morgan, G.J.; Collins, D.J.; Sharma, B.; Riddell, A.; et al. Whole-body diffusion-weighted MRI: A new gold standard for assessing disease burden in patients with multiple myeloma? Leukemia 2016, 30, 1446–1448. [Google Scholar] [CrossRef]
- Horger, M.; Weisel, K.; Horger, W.; Mroue, A.; Fenchel, M.; Lichy, M. Whole-Body Diffusion-Weighted MRI With Apparent Diffusion Coefficient Mapping for Early Response Monitoring in Multiple Myeloma: Preliminary Results. Am. J. Roentgenol. 2011, 196, W790–W795. [Google Scholar] [CrossRef]
- Mulé, S.; Reizine, E.; Blanc-Durand, P.; Baranes, L.; Zerbib, P.; Burns, R.; Nouri, R.; Itti, E.; Luciani, A. Whole-Body Functional MRI and PET/MRI in Multiple Myeloma. Cancers 2020, 12, 3155. [Google Scholar] [CrossRef] [PubMed]
- Sachpekidis, C.; Hillengass, J.; Goldschmidt, H.; Mosebach, J.; Pan, L.; Schlemmer, H.-P.; Haberkorn, U.; Dimitrakopoulou-Strauss, A. Comparison of 18F-FDG PET/CT and PET/MRI in patients with multiple myeloma. Am. J. Nucl. Med. Mol. Imaging 2015, 5, 469–478. [Google Scholar]
- Messiou, C.; Kaiser, M. Whole body diffusion weighted MRI—A new view of myeloma. Br. J. Haematol. 2015, 171, 29–37. [Google Scholar] [CrossRef]
- Pearce, T.; Philip, S.; Brown, J.; Koh, D.M.; Burn, P.R. Bone metastases from prostate, breast and multiple myeloma: Differences in lesion conspicuity at short-tau inversion recovery and diffusion-weighted MRI. Br. J. Radiol. 2012, 85, 1102–1106. [Google Scholar] [CrossRef] [PubMed]
- Sachpekidis, C.; Mosebach, J.; Freitag, M.T.; Wilhelm, T.; Mai, E.K.; Goldschmidt, H.; Haberkorn, U.; Schlemmer, H.-P.; Delorme, S.; Dimitrakopoulou-Strauss, A. Application of 18F-FDG PET and diffusion weighted imaging (DWI) in multiple myeloma: Comparison of functional imaging modalities. Am. J. Nucl. Med. Mol. Imaging 2015, 5, 479–492. [Google Scholar] [PubMed]
- León, N.G.; Bueno, B.A.; Pérez, M.H.; Ramírez, L.F.L.; Alegre, A.; Colletti, P.M.; Rubello, D.; Carreras, J.L.; Bolton, R.C.D. Agreement Between 18F-FDG PET/CT and Whole-Body Magnetic Resonance Compared with Skeletal Survey for Initial Staging and Response at End-of-Treatment Evaluation of Patients with Multiple Myeloma. Clin. Nucl. Med. 2021, 46, 310–322. [Google Scholar] [CrossRef]
- Westerland, O.; Amlani, A.; Kelly-Morland, C.; Fraczek, M.; Bailey, K.; Gleeson, M.; El-Najjar, I.; Streetly, M.; Bassett, P.; Cook, G.J.R.; et al. Comparison of the diagnostic performance and impact on management of 18F-FDG PET/CT and whole-body MRI in multiple myeloma. Eur. J. Nucl. Med. Mol. Imaging 2021, 1–8. [Google Scholar] [CrossRef]
- Zhang, Y.; Xiong, X.; Fu, Z.; Dai, H.; Yao, F.; Liu, D.; Deng, S.; Hu, C. Whole-body diffusion-weighted MRI for evaluation of response in multiple myeloma patients following bortezomib-based therapy: A large single-center cohort study. Eur. J. Radiol. 2019, 120, 108695. [Google Scholar] [CrossRef]
- Chen, J.; Li, C.; Tian, Y.; Xiao, Q.; Deng, M.; Hu, H.; Wen, B.; He, Y. Comparison of Whole-Body DWI and 18F-FDG PET/CT for Detecting Intramedullary and Extramedullary Lesions in Multiple Myeloma. Am. J. Roentgenol. 2019, 213, 514–523. [Google Scholar] [CrossRef] [PubMed]
- Mesguich, C.; Hulin, C.; Latrabe, V.; Lascaux, A.; Bordenave, L.; Hindié, E.; Marit, G. Prospective comparison of 18-FDG PET/CT and whole-body diffusion-weighted MRI in the assessment of multiple myeloma. Ann. Hematol. 2020, 99, 2869–2880. [Google Scholar] [CrossRef] [PubMed]
- Takasu, M.; Kondo, S.; Akiyama, Y.; Takahashi, Y.; Maeda, S.; Baba, Y.; Kawase, T.; Ichinohe, T.; Awai, K. Assessment of early treatment response on MRI in multiple myeloma: Comparative study of whole-body diffusion-weighted and lumbar spinal MRI. PLoS ONE 2020, 15, e0229607. [Google Scholar] [CrossRef] [PubMed]


| Author | Year | Ref. | Country | N | Mean Age (Range) | Design | Treatment Protocol | Modality | FDG Dose | Time Interval | Fasting Time | No. of Assessors | Reference Standard | Duration |
|---|---|---|---|---|---|---|---|---|---|---|---|---|---|---|
| Cascini GL, et al. | 2013 | [25] | Italy | 22 | NR (44–83) | P | C or SCT | PET/CT, 1.5T MRI | 360 MBq | 60 min | 6 h | NR | IMWG criteria [27] | 2006.7–2010.3 |
| Derlin T, et al. | 2013 | [7] | Germany | 31 | 55 (38–73) | R | SCT | PET/CT, 1.5T MRI | 350 MBq | 60 min | 4 h | 2 | IMWG criteria [27] | 2008.7–2009.3 |
| Elena Z, et al. | 2007 | [13] | Italy | 22 | 55 (42–65) | P | SCT | PET/CT, MRI | 5.3 MBq/kg | 60–80 min | 6 h | 2 | EBMT criteria [26] | 2003.3–2004.12 |
| Mohammad A, et al. | 2018 | [18] | Egypt | 22 | 62 (41–78) | P | 18: C, 3: Ra, 1: SCT | PET/CT, 3T MRI | 370 MBq | 60 min | 6 h | 3 | BM aspiration and biopsy | 2015.8–2017.12 |
| Philippe M, et al. | 2017 | [19] | France | 119 | 59 (37–65) | P | C or SCT | PET/CT, MRI | 3-7 MBq/kg | 60–80 min | 4 h | 2 | IMWG criteria [27] | 2010.11–2012.11 |
| Spinnato P, et al. | 2012 | [17] | Italy | 55 | 62 (33–81) | R | C or SCT | PET/CT, 1.5T MRI | NR | NR | NA | 2 | biopsy, L/D, MRI, PET/CT | 2009–2012.3 |
Publisher’s Note: MDPI stays neutral with regard to jurisdictional claims in published maps and institutional affiliations. |
© 2021 by the authors. Licensee MDPI, Basel, Switzerland. This article is an open access article distributed under the terms and conditions of the Creative Commons Attribution (CC BY) license (https://creativecommons.org/licenses/by/4.0/).
Share and Cite
Yokoyama, K.; Tsuchiya, J.; Tateishi, U. Comparison of [18F]FDG PET/CT and MRI for Treatment Response Assessment in Multiple Myeloma: A Meta-Analysis. Diagnostics 2021, 11, 706. https://doi.org/10.3390/diagnostics11040706
Yokoyama K, Tsuchiya J, Tateishi U. Comparison of [18F]FDG PET/CT and MRI for Treatment Response Assessment in Multiple Myeloma: A Meta-Analysis. Diagnostics. 2021; 11(4):706. https://doi.org/10.3390/diagnostics11040706
Chicago/Turabian StyleYokoyama, Kota, Junichi Tsuchiya, and Ukihide Tateishi. 2021. "Comparison of [18F]FDG PET/CT and MRI for Treatment Response Assessment in Multiple Myeloma: A Meta-Analysis" Diagnostics 11, no. 4: 706. https://doi.org/10.3390/diagnostics11040706
APA StyleYokoyama, K., Tsuchiya, J., & Tateishi, U. (2021). Comparison of [18F]FDG PET/CT and MRI for Treatment Response Assessment in Multiple Myeloma: A Meta-Analysis. Diagnostics, 11(4), 706. https://doi.org/10.3390/diagnostics11040706