
Oral Diagnostic Methods for the Detection of Periodontal Disease

 , , ,
, , , 
Abstract
1. Introduction
2. Materials and Methods
2.1. Participants and Study Design
2.2. Clinical Evaluation
2.3. Sample Collection
2.4. Saliva Analysis
2.5. Alkaline Phosphatase and Lactoferrin Analysis of Saliva
2.6. Statistical Analysis
3. Results
3.1. Clinical Evaluation and Sample Collection
3.2. Salivary Analysis
4. Discussion
Author Contributions
Funding
Institutional Review Board Statement
Informed Consent Statement
Data Availability Statement
Acknowledgments
Conflicts of Interest
References
- Socransky, S.S.; Haffajee, A.D.; Cugini, M.A.; Smith, C.; Kent, R.L., Jr. Microbial complexes in subgingival plaque. J. Clin. Periodontol. 1998, 25, 134–144. [Google Scholar] [CrossRef] [PubMed]
- Tonetti, M.S.; Sanz, M. Implementation of the new classification of periodontal diseases: Decision-making algorithms for clinical practice and education. J. Clin. Periodontol. 2019, 46, 398–405. [Google Scholar] [CrossRef] [PubMed]
- Offenbacher, S. Periodontal diseases: Pathogenesis. Ann. Periodontol. 1996, 1, 821–878. [Google Scholar] [CrossRef] [PubMed]
- Tonetti, M.S.; Claffey, N.; European Workshop in Periodontology group, C. Advances in the progression of periodontitis and proposal of definitions of a periodontitis case and disease progression for use in risk factor research. Group C consensus report of the 5th European Workshop in Periodontology. J. Clin. Periodontol. 2005, 6, 210–213. [Google Scholar] [CrossRef] [PubMed]
- Lindhe, J.; Haffajee, A.D.; Socransky, S.S. Progression of periodontal disease in adult subjects in the absence of periodontal therapy. J. Clin. Periodontol. 1983, 10, 433–442. [Google Scholar] [CrossRef] [PubMed]
- Sahingur, S.E.; Cohen, R.E. Analysis of host responses and risk for disease progression. Periodontol. 2000 2004, 34, 57–83. [Google Scholar] [CrossRef] [PubMed]
- Srivastava, N.; Nayak, P.A.; Rana, S. Point of care—A novel approach to periodontal diagnosis—A review. J. Clin. Diagn. Res. 2017, 11, ZE01–ZE06. [Google Scholar] [CrossRef]
- Kinane, D.F.; Stathopoulou, P.G.; Papapanou, P.N. Periodontal diseases. Nat. Rev. Dis. Primers 2017, 3, 17038. [Google Scholar] [CrossRef] [PubMed]
- Giannobile, W.V. Salivary diagnostics for periodontal diseases. J. Am. Dent. Assoc. 2012, 143, 6S–11S. [Google Scholar] [CrossRef] [PubMed]
- Belibasakis, G.N.; Schmidlin, P.R.; Sahrmann, P. Molecular microbiological evaluation of subgingival biofilm sampling by paper point and curette. Apmis 2014, 122, 347–352. [Google Scholar] [CrossRef]
- Giannobile, W.V.; Beikler, T.; Kinney, J.S.; Ramseier, C.A.; Morelli, T.; Wong, D.T. Saliva as a diagnostic tool for periodontal disease: Current state and future directions. Periodontol. 2000 2009, 50, 52–64. [Google Scholar] [CrossRef]
- Islas-Granillo, H.; Borges-Yanez, S.A.; Medina-Solis, C.E.; Galan-Vidal, C.A.; Navarrete-Hernandez, J.J.; Escoffie-Ramirez, M.; Maupomé, G. Salivary Parameters (Salivary Flow, pH and Buffering Capacity) in Stimulated Saliva of Mexican Elders 60 Years Old and Older. West. Indian Med. J. 2014, 63, 758–765. [Google Scholar]
- Priyanka, N.; Kalra, N.; Shanbhag, N.; Kumar, K.; Seema Brijet, B.; Avani, P.R. Recent approaches in saliva as a credible periodontal diagnostic and prognostic marker. AOSR 2012, 2, 40–46. [Google Scholar]
- Giannobile, W.V.; McDevitt, J.T.; Niedbala, R.S.; Malamud, D. Translational and clinical applications of salivary diagnostics. Adv. Dent. Res. 2011, 23, 375–380. [Google Scholar] [CrossRef] [PubMed]
- Spielmann, N.; Wong, D.T. Saliva: Diagnostics and therapeutic perspectives. Oral Dis. 2011, 17, 345–354. [Google Scholar] [CrossRef] [PubMed]
- Paqué, P.N.; Herz, C.; Jenzer, J.S.; Wiedemeier, D.B.; Attin, T.; Bostanci, N.; Belibasakis, G.N.; Bao, K.; Körner, P.; Fritz, T.; et al. Microbial analysis of saliva to identify oral diseases using a point-of-care compatible qPCR assay. J. Clin. Med. 2020, 9, 2945. [Google Scholar] [CrossRef]
- Papapanou, P.N.; Sanz, M.; Buduneli, N.; Dietrich, T.; Feres, M.; Fine, D.H.; Flemmig, T.F.; Garcia, R.; Giannobile, W.V.; Graziani, F.; et al. Periodontitis: Consensus report of workgroup 2 of the 2017 World Workshop on the Classification of Periodontal and Peri-Implant Diseases and Conditions. J. Periodontol. 2018, 89, 173–182. [Google Scholar] [CrossRef] [PubMed]
- Nesse, W.; Abbas, F.; van der Ploeg, I.; Spijkervet, F.K.; Dijkstra, P.U.; Vissink, A. Periodontal inflamed surface area: Quantifying inflammatory burden. J. Clin. Periodontol. 2008, 35, 668–673. [Google Scholar] [CrossRef] [PubMed]
- Navazesh, M. Methods for collecting saliva. Ann. N. Y. Acad. Sci. 1993, 694, 72–77. [Google Scholar] [CrossRef] [PubMed]
- Cosgarea, R.; Baumer, A.; Pretzl, B.; Zehaczek, S.; Kim, T.S. Comparison of two different microbiological test kits for detection of periodontal pathogens. Acta Odontol. Scand. 2010, 68, 115–121. [Google Scholar] [CrossRef]
- Shimizu, E.; Kobayashi, T.; Wakabayashi, H.; Yamauchi, K.; Iwatsuki, K.; Yoshie, H. Effects of orally administered lactoferrin and lactoperoxidase-containing tablets on clinical and bacteriological profiles in chronic periodontitis patients. Int. J. Dent. 2011, 2011, 405139. [Google Scholar] [CrossRef]
- Sorsa, T.; Alassiri, S.; Grigoriadis, A.; Räisänen, I.T.; Pärnänen, P.; Nwhator, S.O.; Gieselmann, D.R.; Sakellari, D. Active MMP-8 (aMMP-8) as a grading and staging biomarker in the periodontitis classification. Diagnostics 2020, 10, 61. [Google Scholar] [CrossRef]
- Sorsa, T.; Gursoy, U.K.; Nwhator, S.; Hernandez, M.; Tervahartiala, T.; Leppilahti, J.; Gursoy, M.; Könönen, E.; Emingil, G.; Pussinen, P.J.; et al. Analysis of matrix metalloproteinases, especially MMP-8, in gingival creviclular fluid, mouthrinse and saliva for monitoring periodontal diseases. Periodontol. 2000 2016, 70, 142–163. [Google Scholar] [CrossRef]
- Rathnayake, N.; Gieselmann, D.-R.; Heikkinen, A.M.; Tervahartiala, T.; Sorsa, T. Salivary Diagnostics—Point-of-Care diagnostics of MMP-8 in dentistry and medicine. Diagnostics 2017, 7, 7. [Google Scholar] [CrossRef]
- Lähteenmäki, H.; Umeizudike, K.A.; Heikkinen, A.M.; Räisänen, I.T.; Rathnayake, N.; Johannsen, G.; Tervahartiala, T.; Nwhator, S.O.; Sorsa, T. aMMP-8 point-of-care/chairside oral fluid technology as a rapid, non-invasive tool for periodontitis and peri-implantitis screening in a medical care setting. Diagnostics 2020, 10, 562. [Google Scholar] [CrossRef]
- Sam, R.; Sahani, M.; Ulozas, E.; Leehey, D.J.; Ing, T.S.; Gandhi, V.C. Utility of a peritoneal dialysis leukocyte test strip in the diagnosis of peritonitis. Artif. Organs 2002, 26, 546–548. [Google Scholar] [CrossRef] [PubMed]
- Moosa, A.A.; Quortum, H.A.; Ibrahim, M.D. Rapid diagnosis of bacterial meningitis with reagent strips. Lancet 1995, 345, 1290–1291. [Google Scholar] [CrossRef]
- DeLozier, J.S.; Auerbach, P.S. The leukocyte esterase test for detection of cerebrospinal fluid leukocytosis and bacterial meningitis. Ann. Emerg. Med. 1989, 18, 1191–1198. [Google Scholar] [CrossRef]
- Smalley, D.L.; Doyle, V.R.; Duckworth, J.K. Correlation of leukocyte esterase detection and the presence of leukocytes in body fluids. Am. J. Med. Technol. 1982, 48, 135–137. [Google Scholar]
- Castellote, J.; Lopez, C.; Gornals, J.; Tremosa, G.; Fariña, E.R.; Baliellas, C.; Domingo, A.; Xiol, X. Rapid diagnosis of spontaneous bacterial peritonitis by use of reagent strip. Hepatology 2003, 37, 745–747. [Google Scholar] [CrossRef]
- Cropper, E.; Coleclough, S.; Griffiths, S.; Saunders, S.; Williams, J.; Rutherford, P.A. Rapid diagnosis of peritonitis in peritoneal dialysis patients. J. Nephrol. 2003, 379–383. [Google Scholar]
- Githaiga, J.W.; Adwok, J.A. Diagnostic peritoneal lavage in the evaluation of abdominal trauma using the dipstick. East. Afr. Med. J. 2002, 79, 457–460. [Google Scholar]
- Matsuda, M.; Noda, Y.; Takemori, Y. Novel diagnostic method of testing for Helicobacter pylori infection using the rapid leukocyte strip test, Leukostix. J. Gastroenterol. Hepatol. 2003, 18, 1196–1201. [Google Scholar] [CrossRef] [PubMed]
- Ravaud, P.; Hudry, C.; Giraudeau, B.; Weill, B.; Dougados, M. Rapid diagnosis of inflammatory synovial fluid with reagent strips. Rheumatology 2002, 41, 815–818. [Google Scholar] [CrossRef] [PubMed]
- Mardh, P.A.; Novikova, N.; Niklasson, O.; Bekassy, Z.; Skude, L. Leukocyte esterase activity in vaginal fluid of pregnant and non-pregnant women with vaginitis/vaginosis and in controls. Infect. Dis. Obstet. Gynecol. 2003, 11, 19–26. [Google Scholar] [CrossRef] [PubMed]
- Rijkschroeff, P.; Jansen, I.D.; van der Weijden, F.A.; Keijser, B.J.; Loos, B.G.; Nicu, E.A. Oral polymorphonuclear neutrophil characteristics in relation to oral health: A cross-sectional, observational clinical study. Int. J. Oral Sci. 2016, 8, 191–198. [Google Scholar] [CrossRef]
- Tayman, M.A.; Önder, C.; Kurgan, Ş.; Serdar, M.A.; Günhan, M. Endocan (ESM-1) levels in gingival crevicular fluid correlate with ICAM-1 and LFA-1 in periodontitis. Braz. Oral Res. 2020, 35, e005. [Google Scholar] [CrossRef] [PubMed]
- Landzberg, M.; Doering, H.; Aboodi, G.M.; Tenenbaum, H.C.; Glogauer, M. Quantifying oral inflammatory load: Oral neutrophil counts in periodontal health and disease. J. Periodont. Res. 2015, 50, 330–336. [Google Scholar] [CrossRef]
- Bhadbhade, S.J.; Acharya, A.B.; Thakur, S. Correlation between probing pocket depth and neutrophil counts in dental plaque, saliva, and gingival crevicular fluid. Quintessence Int. 2012, 43, 111–117. [Google Scholar] [PubMed]
- Romano, F.; Castiblanco, A.; Spadotto, F.; Di Scipio, F.; Malandrino, M.; Berta, G.N.; Aimetti, M. ICP-Mass-Spectrometry Ionic Profile of Whole Saliva in Patients with Untreated and Treated Periodontitis. Biomedicines 2020, 8, 354. [Google Scholar] [CrossRef]
- Nomura, Y.; Okada, A.; Tamaki, Y.; Miura, H. Salivary levels of hemoglobin for screening periodontal disease: A systematic review. Int. J. Dent. 2018, 2018, 2541204. [Google Scholar] [CrossRef]
- Nam, S.H.; Jung, H.I.; Kang, S.M.; Inaba, D.; Kwon, H.K.; Kim, B.I. Validity of screening methods for periodontitis using salivary hemoglobin level and self-report questionnaires in people with disabilities. J. Periodontol. 2015, 86, 536–545. [Google Scholar] [CrossRef]
- Maeng, Y.J.; Kim, B.R.; Jung, H.I.; Jung, U.W.; Kim, H.E.; Kim, B.I. Diagnostic accuracy of a combination of salivary hemoglobin levels, self-report questionnaires, and age in periodontitis screening. J. Periodontal Implant Sci. 2016, 46, 10–21. [Google Scholar] [CrossRef] [PubMed]
- Koss, M.A.; Castro, C.E.; Guarnieri, S.M.; Hermosilla, D. Determination of Salivary Alkaline Phosphatase and β Glucuronidase in Treated Periodontal Disease Patients. EC Dental Sci. 2019, 18, 1225–1231. [Google Scholar]
- Patel, R.M.; Varma, S.; Suragimath, G.; Zope, S. Estimation and comparison of salivary calcium, phosphorous, alkaline phosphatase and pH levels in periodontal health and disease: A cross-sectional biochemical study. J. Clin. Diagn. Res. 2016, 10, ZC58–ZC61. [Google Scholar] [CrossRef] [PubMed]
- Dabra, S.; Singh, P. Evaluating the levels of salivary alkaline and acid phosphatase activities as biochemical markers for periodontal disease: A case series. Dent. Res. J. 2012, 9, 41–45. [Google Scholar] [CrossRef]
- Ferreira, S.M.; Goncalves, L.S.; Torres, S.R.; Nogueira, S.A.; Meiller, T.F. Lactoferrin levels in gingival crevicular fluid and saliva of HIV-infected patients with chronic periodontitis. J. Investig. Clin. Dent. 2015, 6, 16–24. [Google Scholar] [CrossRef]
- Fine, D.H.; Furgang, D.; Beydouin, F. Lactoferrin iron levels are reduced in saliva of patients with localized aggressive periodontitis. J. Periodontol. 2002, 73, 624–630. [Google Scholar] [CrossRef] [PubMed]
- Hong, I.; Pae, H.C.; Song, Y.W.; Cha, J.K.; Lee, J.S.; Paik, J.W.; Choi, S.H. Oral Fluid Biomarkers for Diagnosing Gingivitis in Human: A Cross-Sectional Study. J. Clin. Med. 2020, 9, 1720. [Google Scholar] [CrossRef]
- Groenink, J.; Walgreen-Weterings, E.; Nazmi, K.; Bolscher, J.G.M.; Veerman, E.C.I.; Van Winkelhoff, A.J.; Nieuw Amerongen, A.V. Salivary lactoferrin and low-Mr mucin MG2 in Actinobacillus actinomycetemcomitans-associated periodontitis. J. Clin. Periodontol. 1999, 26, 269–275. [Google Scholar] [CrossRef] [PubMed]
- Yamauchi, K.; Tomita, M.; Giehl, T.J.; Ellison, R.T. Antibacterial activity of lactoferrin and a pepsin-derived lactoferrin peptide fragment. Infec. Immun. 1993, 61, 719–728. [Google Scholar] [CrossRef] [PubMed]
- Gul, S.S.; Abdulkareem, A.A.; Sha, A.M.; Rawlinson, A. Diagnostic Accuracy of Oral Fluids Biomarker Profile to Determine the Current and Future Status of Periodontal and Peri-Implant Diseases. Diagnostics 2020, 10, 838. [Google Scholar] [CrossRef] [PubMed]
- Nomura, Y.; Okada, A.; Kakuta, E.; Gunji, T.; Kajiura, S.; Hanada, N. A new screening method for periodontitis: An alternative to the community periodontal index. BMC Oral Health 2016, 16, 64. [Google Scholar] [CrossRef] [PubMed]
- Eke, P.I.; Dye, B. Assessment of self-report measures for predicting population prevalence of periodontitis. J. Periodontol. 2009, 80, 1371–1379. [Google Scholar] [CrossRef]


| Patient Characteristics | Healthy | Periodontitis Stage III Grade B |
|---|---|---|
| Age (mean ± SD) | 50.47 ± 11.27 | 51.16 ± 12.35 |
| Gender (m/f) | 9/11 | 15/5 |
| Smoking (yes/no) | 5/15 | 12/8 |
| Clinical parameters | ||
| CALa (mean ± SD) | 1.86 ± 0.23 | 3.45 ± 1.12 |
| PPD b (mean ± SD) | 2.01 ± 0.31 | 4.24 ± 1.35 |
| BOP c (mean ± SD) | 26.73 ± 22.96 | 28.59 ± 23.29 |
| Inflammation values | ||
| BOP c (%) | 10 (9) e | 41 (28) e |
| PISA d (mm2) | 1010 (366) e | 2796 (2112) e |
| Unstimulated Saliva | Stimulated Saliva | Comparison | Comparison | |||
|---|---|---|---|---|---|---|
| Healthy (A) | Periodontitis Stage III Grade B (B) | Healthy (C) | Periodontitis Stage III Grade B (D) | (A) vs. (B) (p-Value) a | (C) vs. (D) (p-Value) a | |
| Sample volume (g) | 5.7 (7.7) | 2.2 (5.1) | 5.2 (7.8) | 4.7 (8.2) | 0.003 | 0.7 |
| Salivary flow rate b (mL/min) | 0.51 (0.38) | 0.34 (0.16) | 1.67 (0.98) | 1.64 (0.94) | 0.002 | 0.6 |
| Alkaline phosphatase (mU/mL) | 0.97 (0.68) | 2.46 (3.94) | 0.64 (0.95) | 0.90 (2.21) | 0.03 | 0.2 |
| Buffer capacity (mL 0.1 M HCl) | 0.070 (0.022) | 0.066 (0.053) | 0.120 (0.061) | 0.114 (0.064) | 0.6 | 0.5 |
| Calcium (mmol/L) | 1.36 (0.30) | 1.51 (0.68) | 1.10 (0.19) | 1.07 (0.20) | 0.2 | 0.3 |
| Density (g/cm3) | 1 (0.00045) | 1 (0.00015) | 1 (0.00018) | 1 (0.00090) | 0.3 | 0.7 |
| Dynamic viscosity (mPa·s) | 1.276 (0.251) | 1.117 (0.065) | 1.107 (0.251) | 1.085 (0.067) | 0.1 | 0.3 |
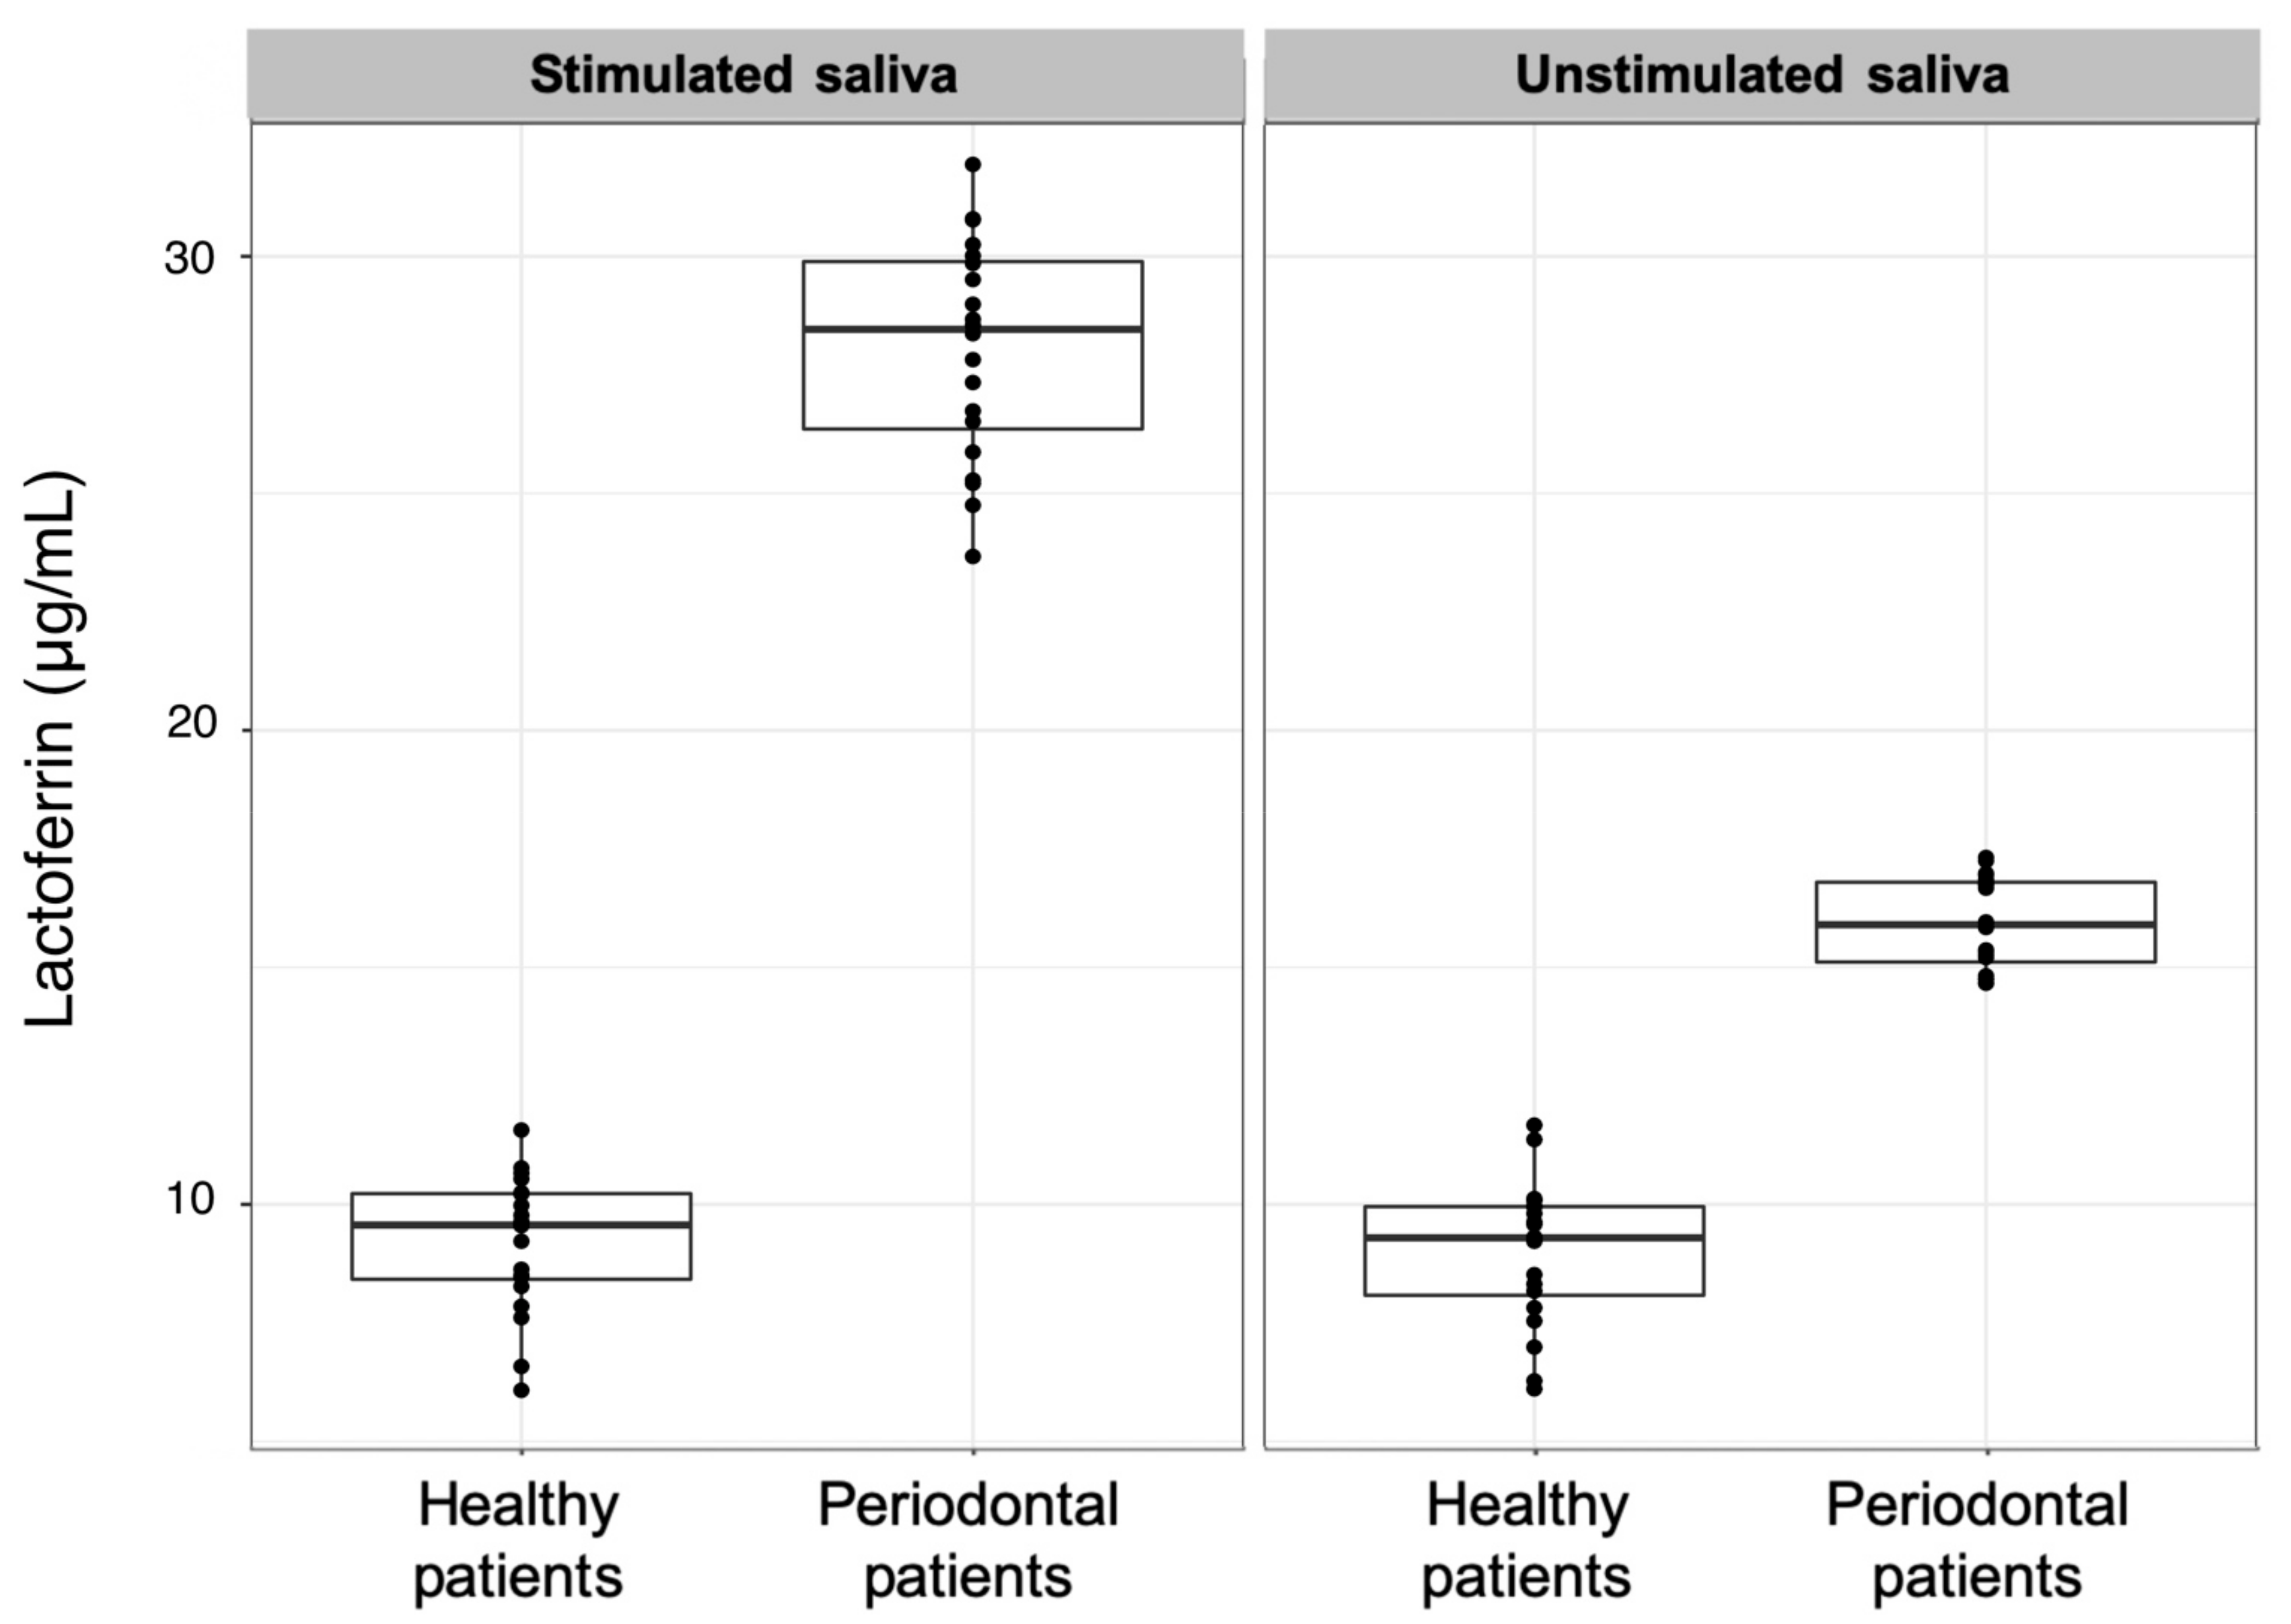
| Lactoferrin (µg/mL) | 9.3 (1.9) | 15.9 (1.7) | 9.6 (1.8) | 28.5 (3.5) | <0.001 | <0.001 |
| Osmolarity (mOsm/L) | 66 (17) | 98 (38) | 71 (10) | 76 (13) | <0.001 | 0.006 |
| pH | 7.43 (0.77) | 7.19 (0.57) | 7.97 (0.29) | 7.95 (0.75) | 0.1 | 0.4 |
| Phosphate (mmol/L) | 5.3 (3.1) | 6.2 (3.2) | 4.0 (1.3) | 4.2 (1.5) | 0.07 | 0.3 |
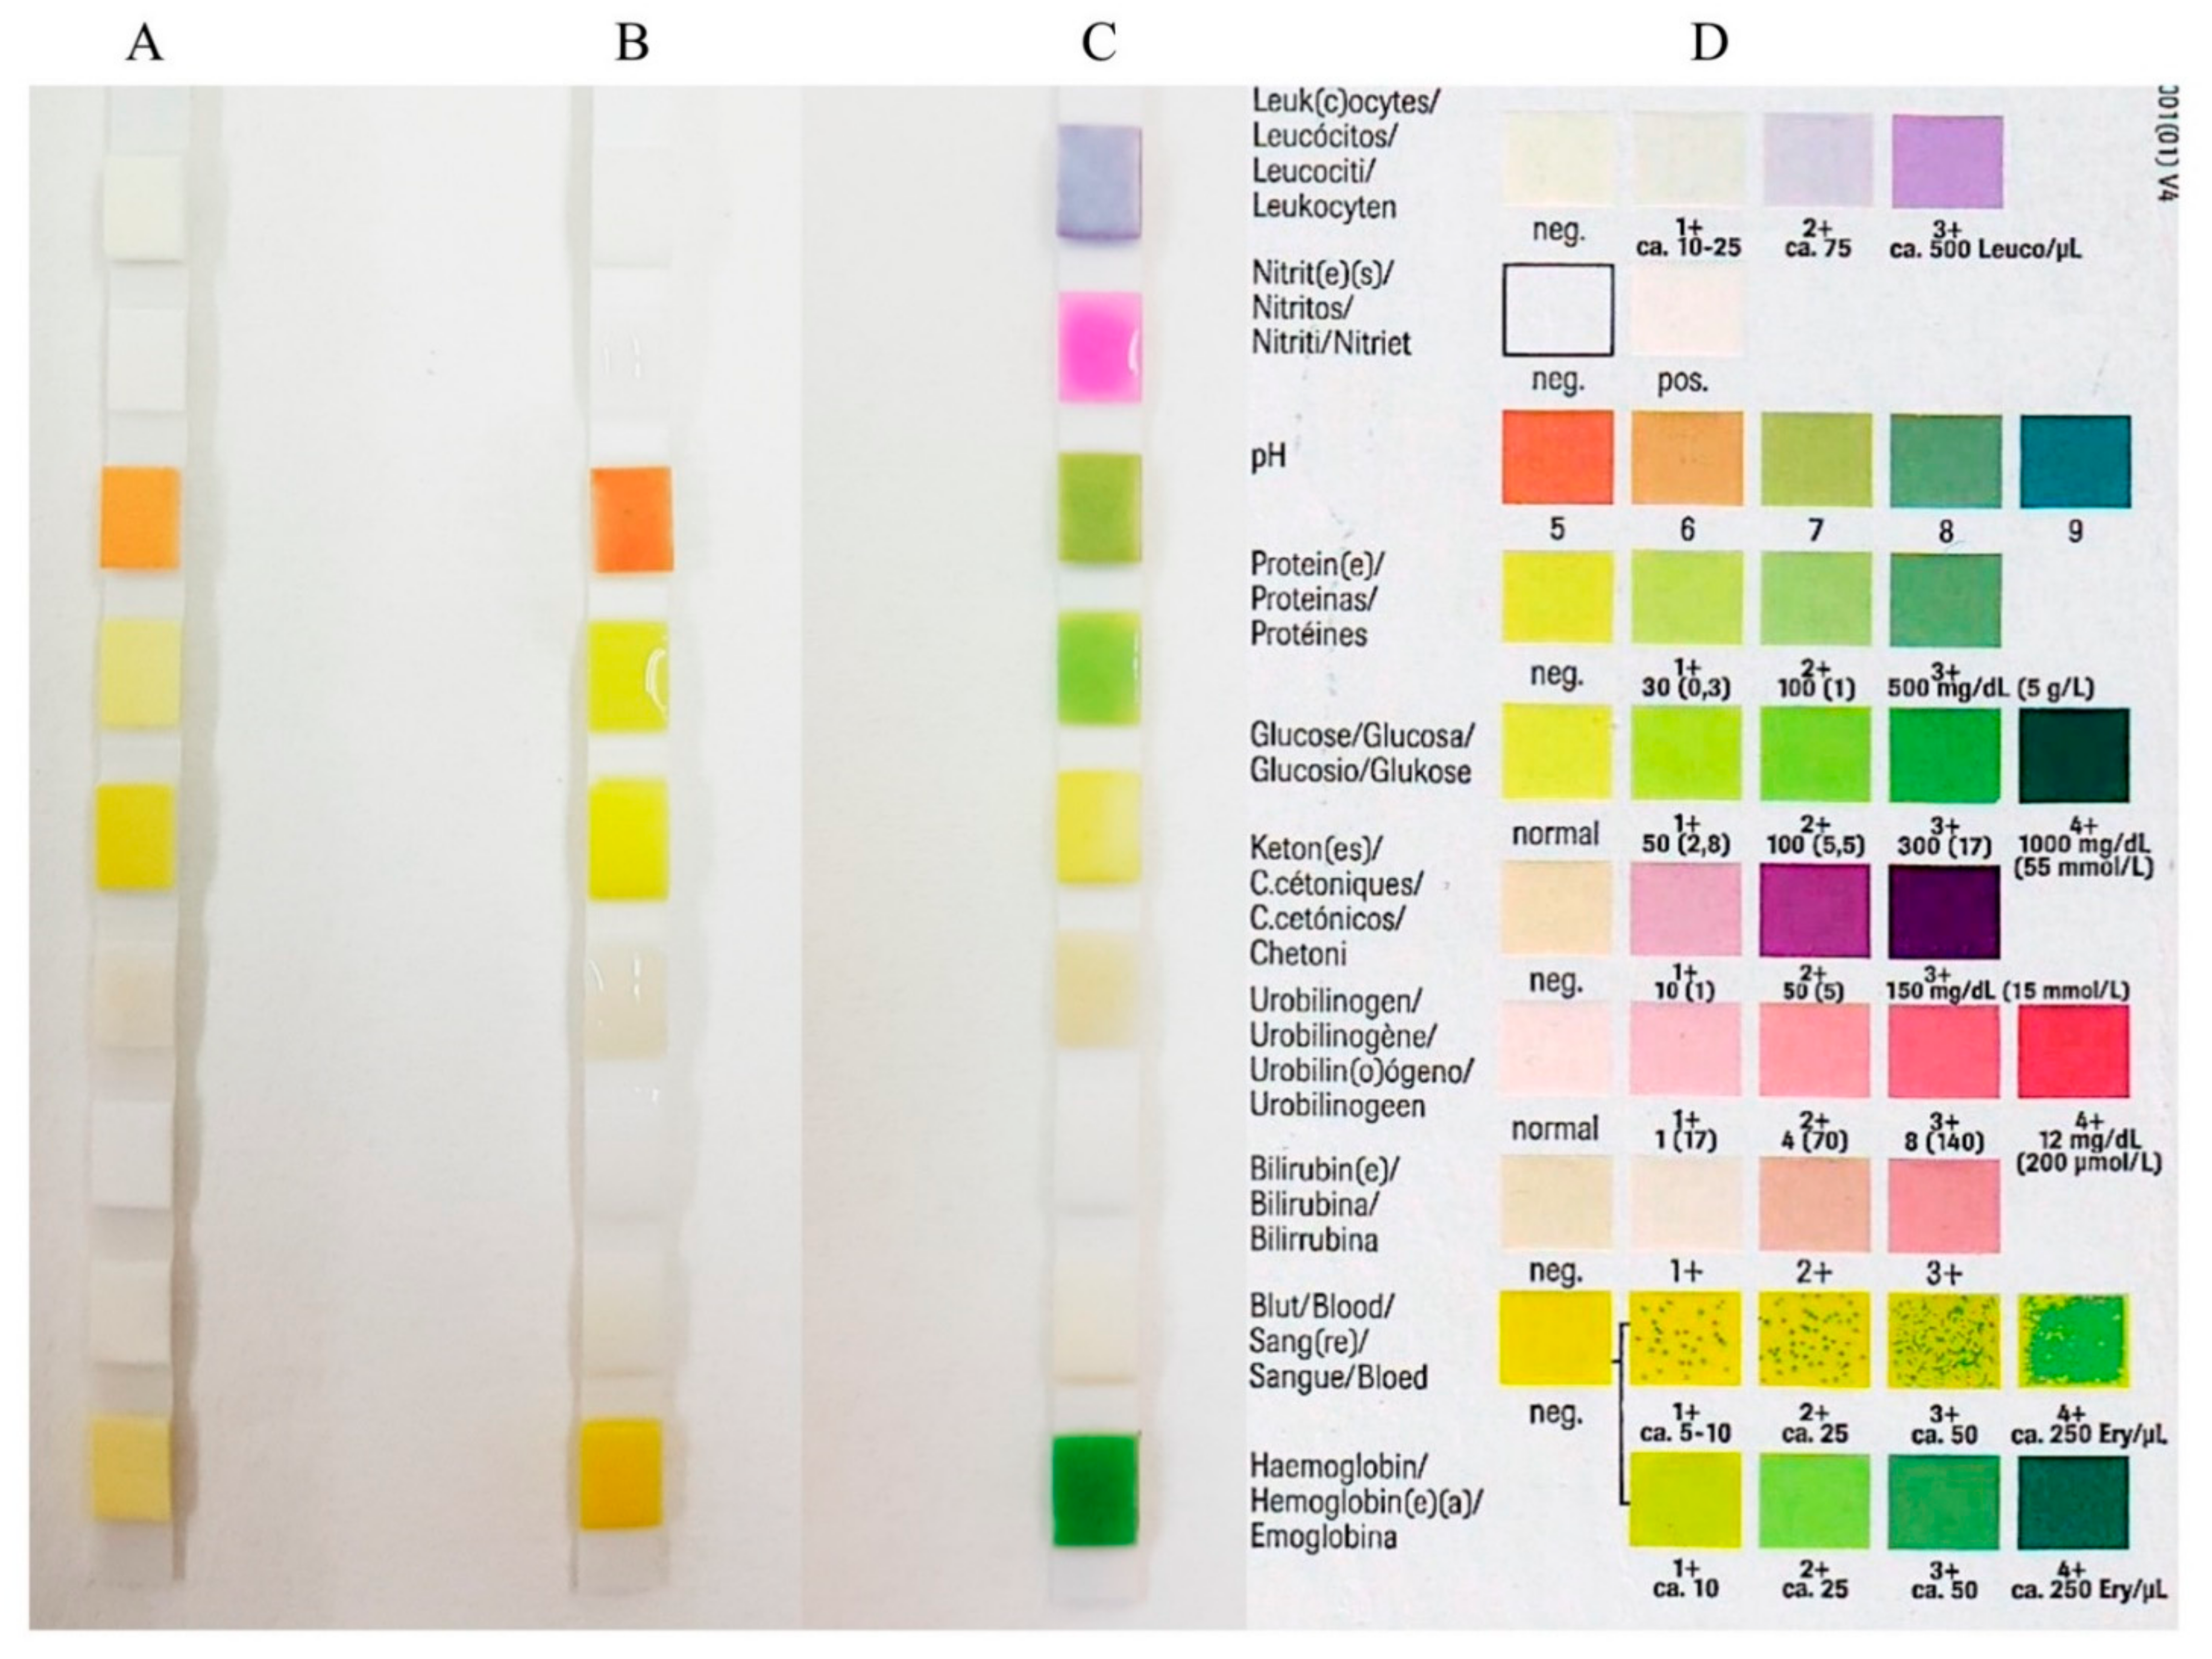
| Unstimulated Saliva | Stimulated Saliva | Comparison | Comparison | |||
|---|---|---|---|---|---|---|
| Healthy (A) | Periodontitis Stage III Grade B (B) | Healthy (C) | Periodontitis Stage III Grade B (D) | (A) vs. (B) (p-Value) b | (C) vs. (D) (p-Value) b | |
| Bilirubin (pos./neg.) | 0 (0) | 0 (0) | 0 (0) | 0 (0) | NA | NA |
| Glucose (mg/dL) | 0 (0) | 0 (0) | 0 (0) | 0 (0) | NA | NA |
| Hemoglobin (Ery/mL) | 10 (25) | 50 (225) | 18 (25) | 50 (225) | 0.0007 | 0.006 |
| Ketones (mg/dL) | 0 (0) | 0 (0) | 0 (0) | 0 (0) | NA | NA |
| Leukocytes (Leu/µL) | 75 (0) | 500 (425) | 75 (425) | 500 (0) | 0.002 | 0.002 |
| Nitrite a (pos./neg.) | (−)1/(+)19 | (−)1/(+)19 | (−)1/(+)19 | (−)2/(+)18 | NA | NA |
| pH | 7 (1) | 7 (1) | 8 (0) | 8 (0) | 0.01 | 0.2 |
| Protein (mg/dL) | 65 (70) | 65 (70) | 30 (70) | 30 (70) | 0.9 | 0.3 |
| Urobilinogen (mg/dL) | 0 (0) | 0 (0) | 0 (0) | 0 (0) | NA | NA |
Publisher’s Note: MDPI stays neutral with regard to jurisdictional claims in published maps and institutional affiliations. |
© 2021 by the authors. Licensee MDPI, Basel, Switzerland. This article is an open access article distributed under the terms and conditions of the Creative Commons Attribution (CC BY) license (http://creativecommons.org/licenses/by/4.0/).
Share and Cite
Ramenzoni, L.L.; Lehner, M.P.; Kaufmann, M.E.; Wiedemeier, D.; Attin, T.; Schmidlin, P.R. Oral Diagnostic Methods for the Detection of Periodontal Disease. Diagnostics 2021, 11, 571. https://doi.org/10.3390/diagnostics11030571
Ramenzoni LL, Lehner MP, Kaufmann ME, Wiedemeier D, Attin T, Schmidlin PR. Oral Diagnostic Methods for the Detection of Periodontal Disease. Diagnostics. 2021; 11(3):571. https://doi.org/10.3390/diagnostics11030571
Chicago/Turabian StyleRamenzoni, Liza L., Marc P. Lehner, Manuela E. Kaufmann, Daniel Wiedemeier, Thomas Attin, and Patrick R. Schmidlin. 2021. "Oral Diagnostic Methods for the Detection of Periodontal Disease" Diagnostics 11, no. 3: 571. https://doi.org/10.3390/diagnostics11030571
APA StyleRamenzoni, L. L., Lehner, M. P., Kaufmann, M. E., Wiedemeier, D., Attin, T., & Schmidlin, P. R. (2021). Oral Diagnostic Methods for the Detection of Periodontal Disease. Diagnostics, 11(3), 571. https://doi.org/10.3390/diagnostics11030571