
Cardio-Ankle Vascular Index in the Persons with Pre-Diabetes and Diabetes Mellitus in the Population Sample of the Russian Federation


Abstract
1. Introduction
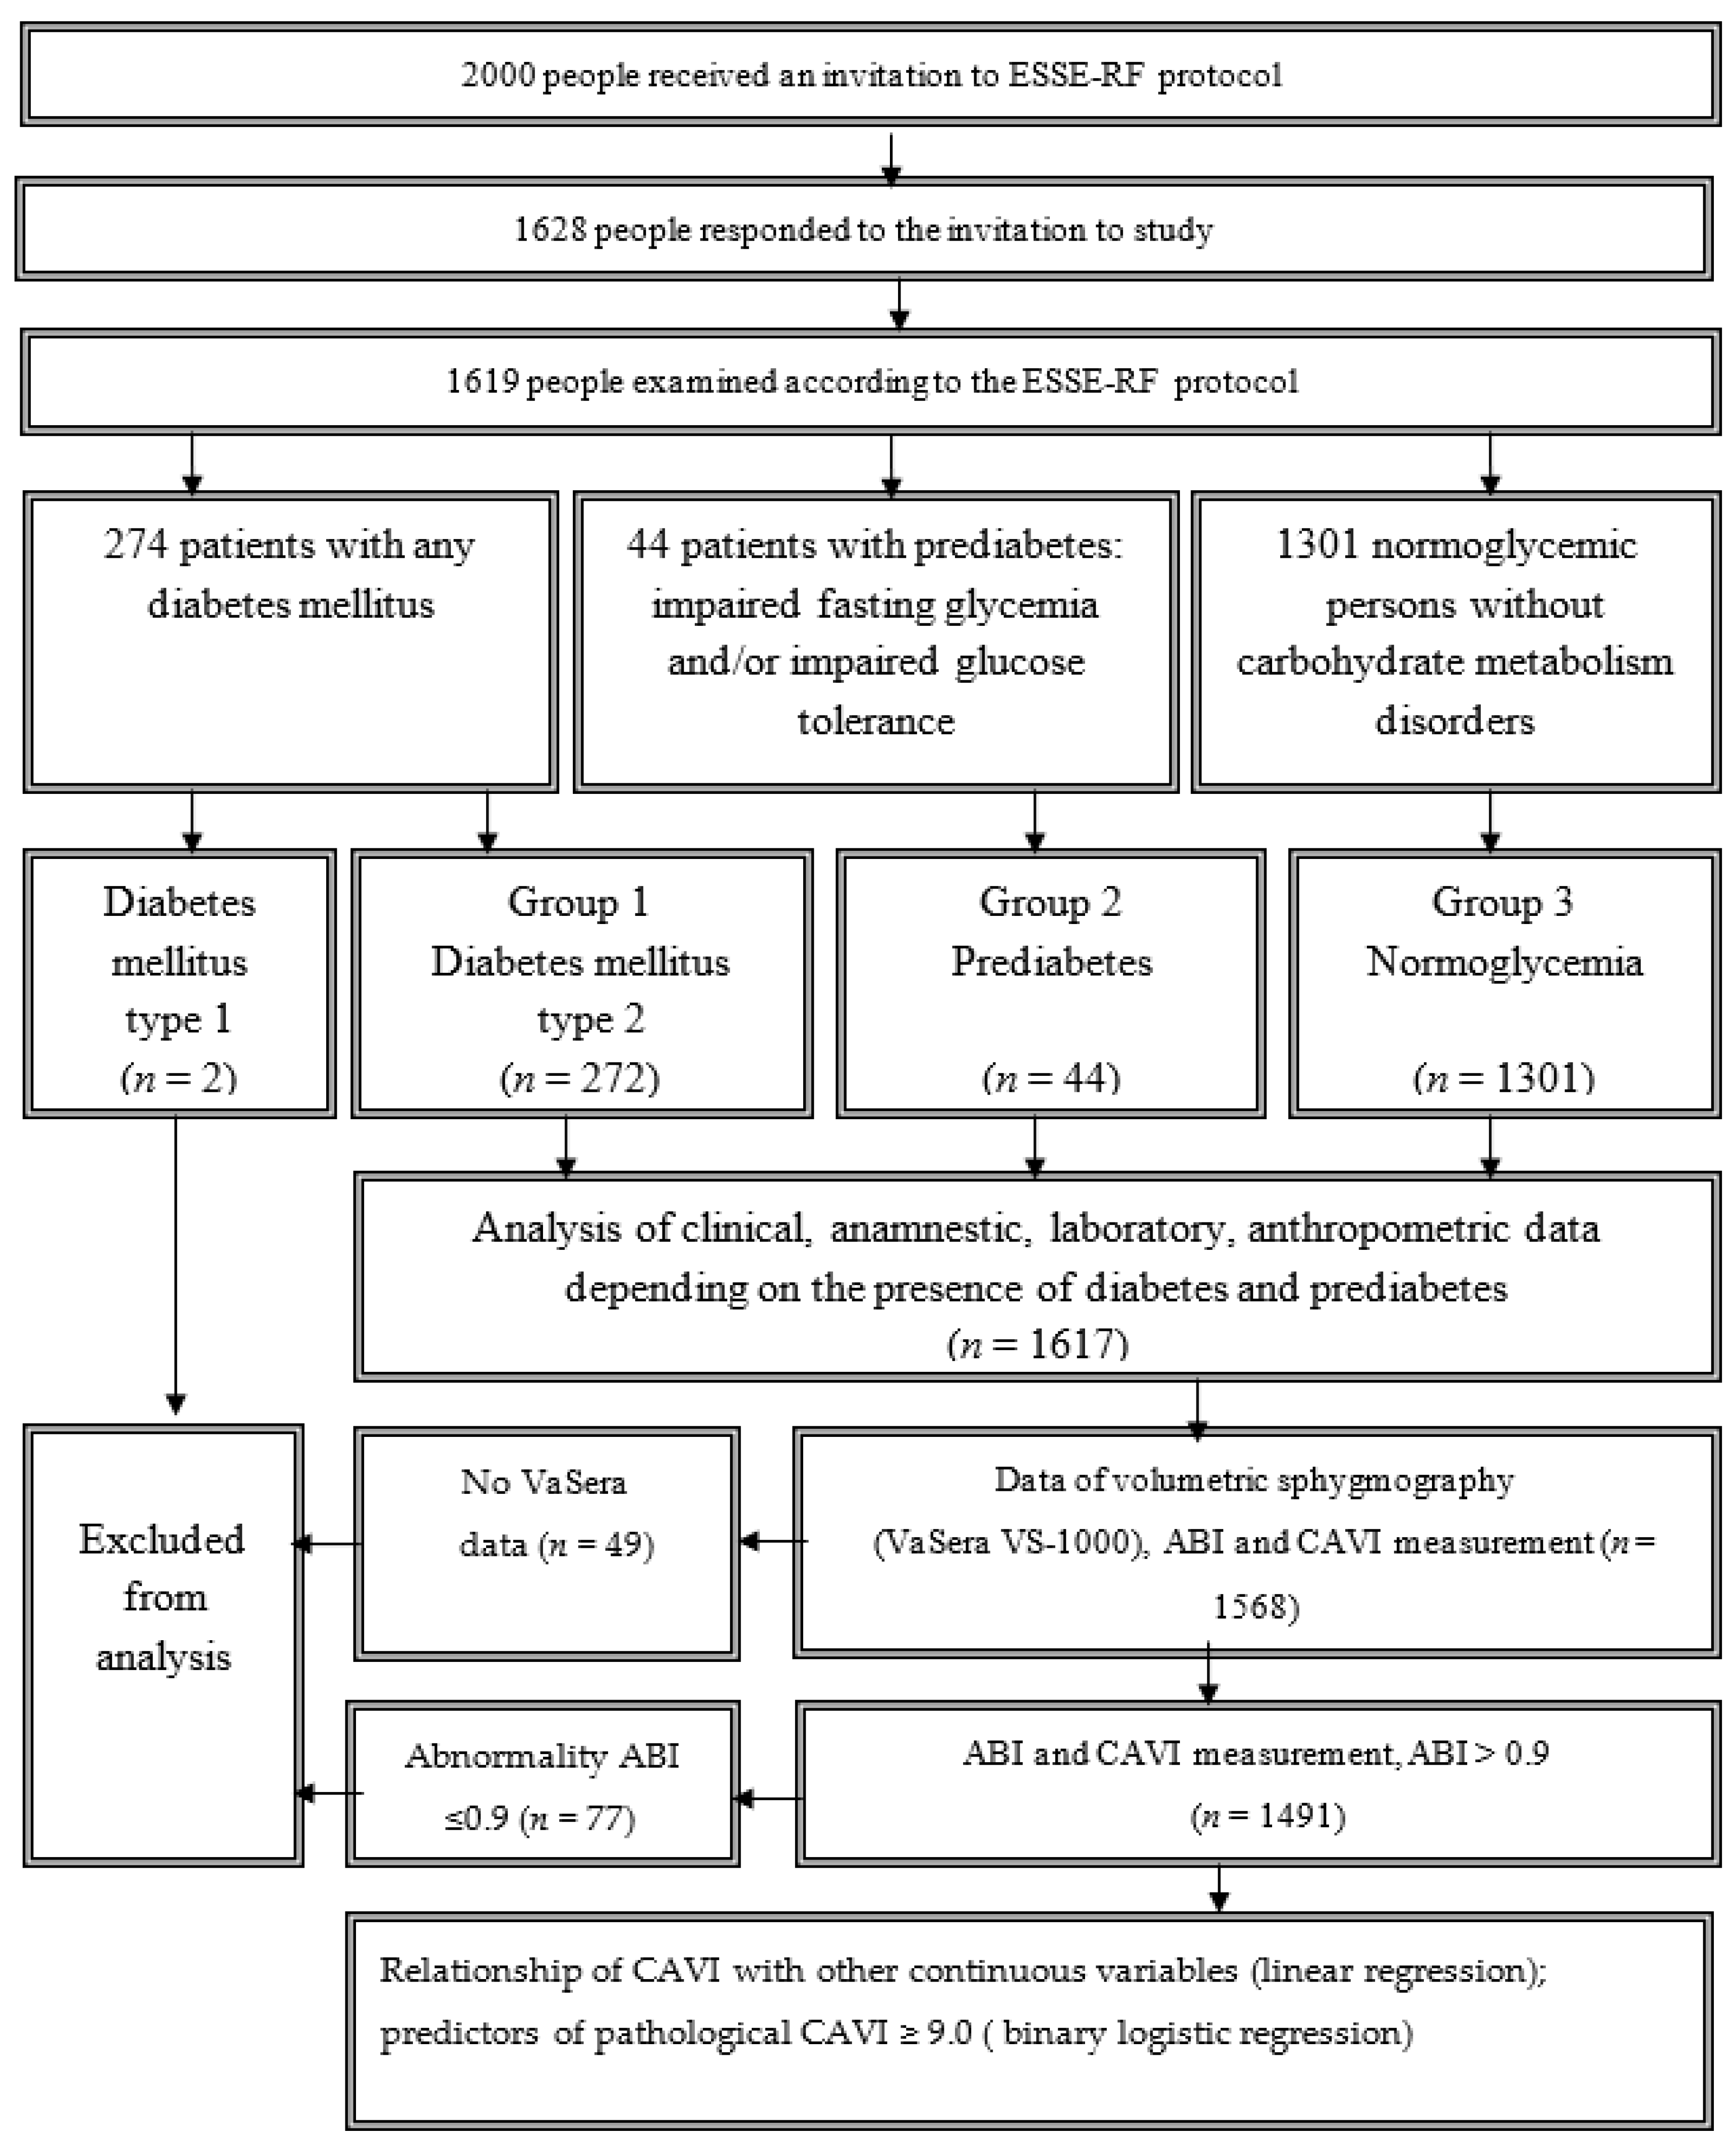
2. Subjects, Materials and Methods
2.1. Clinical and Biochemical Data Collection
2.2. Measurement of CAVI
2.3. Diagnosis of Diabetes Mellitus and Other Glycemic Disorders
2.4. Ethics Statement
2.5. Statistical Analysis
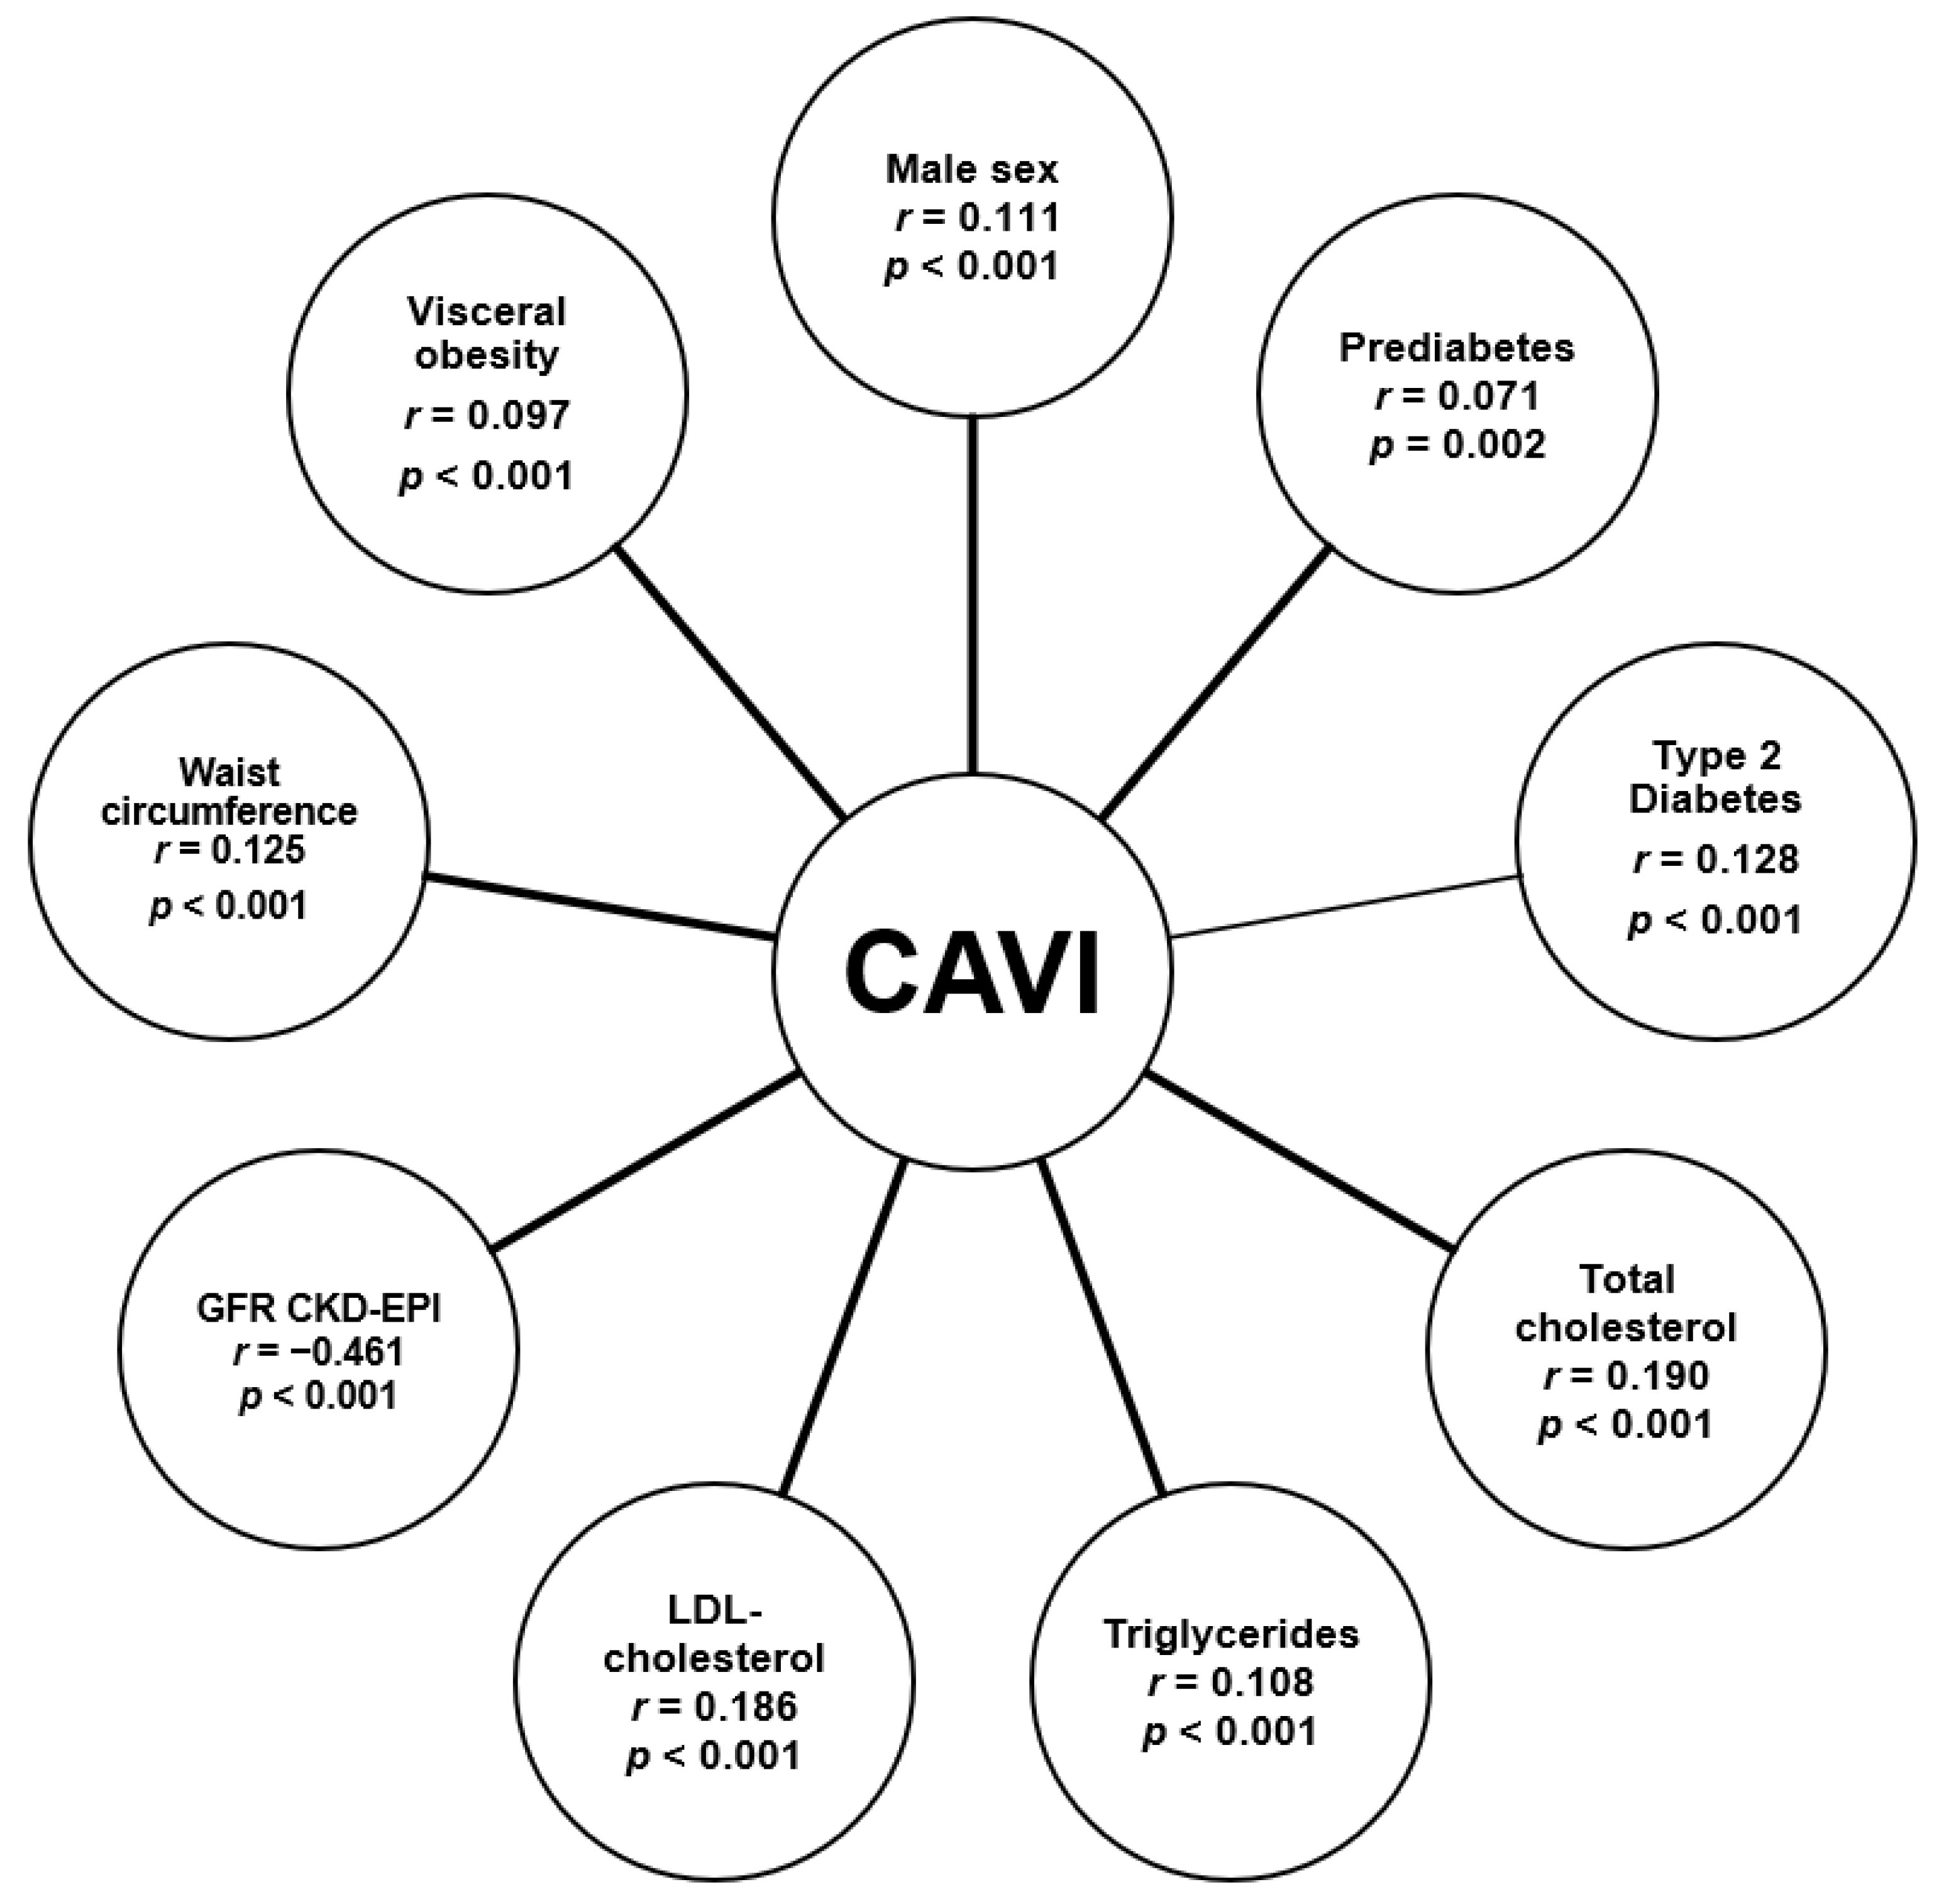
3. Results
4. Discussion
5. Conclusions
Author Contributions
Funding
Institutional Review Board Statement
Informed Consent Statement
Data Availability Statement
Acknowledgments
Conflicts of Interest
References
- Barnett, K.N.; Ogston, S.A.; McMurdo, M.E.; Morris, A.D.; Evans, J.M.M. A 12-Year Follow-Up Study of All-Cause and Cardiovascular Mortality Among 10,532 People Newly Diagnosed with Type 2 Diabetes in Tayside, Scotland. Diabet. Med. 2010, 27, 1124–1129. [Google Scholar] [CrossRef]
- Sharma, A.; Green, J.B.; Dunning, A.; Lokhnygina, Y.; Al-Khatib, S.M.; Lopes, R.D.; Buse, J.B.; Lachin, J.M.; Van de Werf, F.; Armstrong, P.W.; et al. TECOS Study Group. Causes of Death in a Contemporary Cohort of Patients with Type 2 Diabetes and Atherosclerotic Cardiovascular Disease: Insights from the TECOS Trial. Diabetes Care 2017, 40, 1763–1770. [Google Scholar] [CrossRef] [PubMed]
- Brannick, B.; Wynn, A.; Dagogo-Jack, S. Prediabetes as a Toxic Environment for the Initiation of Microvascular and Macrovascular Complications. Exp. Biol. Med. 2016, 241, 1323–1331. [Google Scholar] [CrossRef]
- Huang, Y.; Cai, X.; Mai, W.; Li, M.; Hu, Y. Association between Prediabetes and Risk of Cardiovascular Disease and all Cause Mortality: Systematic Review and Meta-Analysis. BMJ 2016, 355, 5953. [Google Scholar] [CrossRef]
- Li, C.H.; Lu, F.H.; Yang, Y.C.; Wu, J.S.; Chang, C.J. Increased Arterial Stiffness in Prediabetic Subjects Recognized by Hemoglobin A1c with Postprandial Glucose but Not Fasting Glucose Levels. J. Clin. Med. 2019, 8, 603. [Google Scholar] [CrossRef]
- Lou, Y.M.; Liao, M.Q.; Wang, C.Y.; Chen, H.E.; Peng, X.L.; Zhao, D.; Gao, X.P.; Xu, S.; Wang, L.; Ma, J.P.; et al. Association between Brachial-Ankle Pulse Wave Velocity and Risk of Type 2 Diabetes Mellitus: Results from a Cohort Study. BMJ Open Diabetes Res. Care 2020, 8, 1317. [Google Scholar] [CrossRef]
- Townsend, R.R.; Wilkinson, I.B.; Schiffrin, E.L.; Avolio, A.P.; Chirinos, J.A.; Cockcroft, J.R.; Heffernan, K.S.; Lakatta, E.G.; McEniery, C.M.; Mitchell, G.F.; et al. Recommendations for Improving and Standardizing Vascular Research on Arterial Stiffness: A Scientific Statement from the American Heart Association. Hypertens 2015, 66, 698–722. [Google Scholar] [CrossRef]
- Shirai, K.; Utino, J.; Otsuka, K.; Takata, M. A Novel Blood Pressure-Independent Arterial Wall Stiffness Parameter: Cardio-ankle Vascular Index (CAVI). J. Atheroscler. Thromb. 2006, 13, 101–107. [Google Scholar] [CrossRef]
- Saiki, A.; Sato, Y.; Watanabe, R.; Watanabe, Y.; Imamura, H.; Yamaguchi, T.; Ban, N.; Kawana, H.; Nagumo, A.; Nagayama, D.; et al. The Role of a Novel Arterial Stiffness Parameter, Cardio-Ankle Vascular Index (CAVI), as a Surrogate Marker for Cardiovascular Diseases. J. Atheroscler. Thromb. 2016, 23, 155–168. [Google Scholar] [CrossRef]
- Shirai, K.; Hiruta, N.; Song, M.; Kurosu, T.; Suzuki, J.; Tomaru, T.; Miyashita, Y.; Saiki, A.; Takahashi, M.; Suzuki, K.; et al. Cardio-Ankle Vascular Index (CAVI) as a Novel Indicator of Arterial Stiffness: Theory, Evidence and Perspectives. J. Atheroscler. Thromb. 2011, 18, 924–938. [Google Scholar] [CrossRef] [PubMed]
- Matsushita, K.; Ding, N.; Kim, E.D.; Budoff, M.; Chirinos, J.A.; Fernhall, B.; Hamburg, N.M.; Kario, K.; Miyoshi, T.; Tanaka, H.; et al. Cardio-Ankle Vascular Index and Cardiovascular Disease: Systematic Review and Meta-Analysis of Prospective and Cross-Sectional Studies. J. Clin. Hypertens. 2019, 21, 16–24. [Google Scholar] [CrossRef] [PubMed]
- Takahashi, K.; Yamamoto, T.; Tsuda, S.; Maruyama, M.; Shirai, K. The Background of Calculating CAVI: Lesson from the Discrepancy Between CAVI and CAVI0. Vasc. Health Risk Manag. 2020, 16, 193–201. [Google Scholar] [CrossRef]
- Saiki, A.; Ohira, M.; Yamaguchi, T.; Nagayama, D.; Shimizu, N.; Shirai, K.; Tatsuno, I. New Horizons of Arterial Stiffness Developed Using Cardio-Ankle Vascular Index (CAVI). J. Atheroscler. Thromb. 2020, 27, 732–748. [Google Scholar] [CrossRef] [PubMed]
- Park, H.E.; Choi, S.Y.; Kim, M.K.; Oh, B.H. Cardio-Ankle Vascular Index Reflects Coronary Atherosclerosis in Patients with Abnormal Glucose Metabolism: Assessment with 256 Slice Multi-Detector Computed Tomography. J. Cardiol. 2012, 60, 372–376. [Google Scholar] [CrossRef] [PubMed]
- Shimizu, Y.; Nakazato, M.; Sekita, T.; Kadota, K.; Yamasaki, H.; Takamura, N.; Aoyagi, K.; Maeda, T. Association of Arterial Stiffness and Diabetes with Triglycerides-to-HDL Cholesterol Ratio for Japanese Men: The Nagasaki Islands Study. Atherosclerosis 2013, 228, 491–495. [Google Scholar] [CrossRef]
- Mineoka, Y.; Fukui, M.; Tanaka, M.; Tomiyasu, K.; Akabame, S.; Nakano, K.; Yamazaki, M.; Hasegawa, G.; Oda, Y.; Nakamura, N. Relationship Between Cardio-Ankle Vascular Index (CAVI) and Coronary Artery Calcification (CAC) in Patients with Type 2 Diabetes Mellitus. Heart Vessel. 2012, 27, 160–165. [Google Scholar] [CrossRef]
- Lamacchia, O.; Sorrentino, M.R.; Picca, G.; Paradiso, M.; Maiellaro, P.; De Cosmo, S. Cardio-Ankle Vascular Index is Associated with Diabetic Retinopathy in Younger than 70 Years Patients with Type 2 Diabetes Mellitus. Diabetes Res. Clin. Pract. 2019, 155, 107793. [Google Scholar] [CrossRef]
- Zhang, C.; Wang, S.; Li, M.; Wu, Y. Association between Atherosclerosis and Diabetic Retinopathy in Chinese Patients with Type 2 Diabetes Mellitus. Diabetes Metab. Syndr. Obes. 2020, 8, 1911–1920. [Google Scholar] [CrossRef]
- Chung, S.L.; Yang, C.C.; Chen, C.C.; Hsu, Y.C.; Lei, M.H. Coronary Artery Calcium Score Compared with Cardio-Ankle Vascular Index in the Prediction of Cardiovascular Events in Asymptomatic Patients with Type 2 Diabetes. J. Atheroscler. Thromb. 2015, 22, 1255–1265. [Google Scholar] [CrossRef]
- Li, C.H.; Wu, J.S.; Yang, Y.C.; Shih, C.C.; Lu, F.H.; Chang, C.J. Increased arterial stiffness in subjects with impaired glucose tolerance and newly diagnosed diabetes but not isolated impaired fasting glucose. J Clin Endocrinol Metab. 2012, 97, E658–E662. [Google Scholar] [CrossRef] [PubMed]
- Shen, L.; Zhang, Y.G.; Liu, M.; Qiang, D.C.; Sun, X.L.; Liu, L.; Jiang, Y.Y. Increased Arterial Stiffness in Subjects with Pre-Diabetes Among Middle Aged Population in Beijing, China. Biomed. Environ. Sci. 2013, 26, 717–725. [Google Scholar] [CrossRef]
- Chirinos, J.A.; Segers, P.; Gillebert, T.C.; De Buyzere, M.L.; Van Daele, C.M.; Khan, Z.A.; Khawar, U.; De Bacquer, D.; Rietzschel, E.R. Central Pulse Pressure and its Hemodynamic Determinants in Middle-Aged Adults with Impaired Fasting Glucose and Diabetes: The Asklepios Study. Diabetes Care 2013, 36, 2359–2365. [Google Scholar] [CrossRef]
- Tsuboi, A.; Ito, C.; Fujikawa, R.; Yamamoto, H.; Kihara, Y. Association Between the Postprandial Glucose Levels and Arterial Stiffness Measured According to the Cardio-Ankle Vascular Index in Non-diabetic Subjects. Intern. Med. 2015, 54, 1961–1969. [Google Scholar] [CrossRef]
- Gomez-Sanchez, L.; Garcia-Ortiz, L.; Patino-Alonso, M.C.; Recio-Rodriguez, J.I.; Feuerbach, N.; Marti, R.; Agudo-Conde, C.; Rodriguez-Sanchez, E.; Maderuelo-Fernandez, J.A.; Ramos, R. MARK Group. Glycemic Markers and Relation with Arterial Stiffness in Caucasian Subjects of the MARK Study. PLoS ONE 2017, 12, e0175982. [Google Scholar] [CrossRef] [PubMed]
- Boitsov, S.A.; Chazov, E.I.; Shlyakhto, E.V.; Shalnova, S.A.; Konradi, A.O.; Karpov, Y.A.; Muromtseva, G.A.; Zhernakova, Y.V.; Oshepkova, E.V.; Rotar, O.P.; et al. Epidemiology of Cardiovascular Diseases in Different Regions of Russia (ESSE-RF). The Rationale for and Design of the Study. Russ. J. Prev. Med. 2013, 16, 25–34. [Google Scholar]
- World Health Organization. Definition and Diagnosis of Diabetes Mellitus and Intermediate Hyperglycaemia: Report of a WHO/IDF Consulation; WHO: Geneva, Switzerland, 2006. [Google Scholar]
- Namekata, T.; Shirai, K.; Tanabe, N.; Miyanishi, K.; Nakata, M.; Suzuki, K.; Arai, C.; Ishizuka, N. Estimating the Extent of Subclinical Arteriosclerosis of Persons with Prediabetes and Diabetes Mellitus Among Japanese Urban Workers and Their Families: A Cross-Sectional Study. BMC Cardiovasc. Disord. 2016, 24, 16–52. [Google Scholar] [CrossRef]
- Liang, J.; Zhou, N.; Teng, F.; Zou, C.; Xue, Y.; Yang, M.; Song, H.; Qi, L. Hemoglobin A1c Levels and Aortic Arterial Stiffness: The Cardiometabolic Risk in Chinese (CRC) Study. PLoS ONE 2012, 7, e38485. [Google Scholar] [CrossRef]
- Gafarov, V.V.; Panov, D.O.; Gromova, E.A.; Gagulin, I.V.; Gafarova, A.V. Risk of Myocardial Infarction and Stroke in Female Population Aged 25–64 Years with Low Social Support in Novosibirsk. Complex Issues Cardiovasc. Dis. 2014, 3, 5–11. [Google Scholar]
- Ohnishi, H.; Saitoh, S.; Takagi, S.; Ohata, J.; Isobe, T.; Kikuchi, Y.; Takeuchi, H.; Shimamoto, K. Pulse Wave Velocity as an Indicator of Atherosclerosis in Impaired Fasting Glucose: The Tanno and Sobetsu Study. Diabetes Care 2003, 26, 437–440. [Google Scholar] [CrossRef] [PubMed]
- Sumin, A.N.; Bezdenezhnykh, N.A.; Bezdenezhnykh, A.V.; Osokina, A.V.; Kuzmina, A.A.; Gruzdeva, O.V.; Barbarash, O.L. Pre-Surgery Status and in-Hospital Complications of Coronary Bypass Grafting in Prediabetes and Type 2 Diabetes Patients. Russ. J. Cardiol. 2018, 23, 40–48. [Google Scholar] [CrossRef]
- Yu, E.S.; Hong, K.; Chun, B.C. Incidence and Risk Factors of Vascular Complications in People with Impaired Fasting Glucose: A National Cohort Study in Korea. Sci. Rep. 2020, 10, 19504. [Google Scholar] [CrossRef] [PubMed]
- Zhao, Y.; Guo, M.; Shi, G. Prediabetes Predicts Adverse Cardiovascular Outcomes After Percutaneous Coronary Intervention: A Meta-Analysis. Biosci. Rep. 2020, 31, 40. [Google Scholar] [CrossRef] [PubMed]
- Otsuka, K.; Fukuda, S.; Shimada, K.; Suzuki, K.; Nakanishi, K.; Yoshiyama, M.; Yoshikawa, J. Serial Assessment of Arterial Stiffness by Cardio-Ankle Vascular Index for Prediction of Future Cardiovascular Events in Patients with Coronary Artery Disease. Hypertens. Res. 2014, 37, 1014–1020. [Google Scholar] [CrossRef] [PubMed]
- Kario, K.; Kabutoya, T.; Fujiwara, T.; Negishi, K.; Nishizawa, M.; Yamamoto, M.; Yamagiwa, K.; Kawashima, A.; Yoshida, T.; Nakazato, J.; et al. Rationale, Design, and Bseline Characteristics of the Cardiovascular Prognostic COUPLING Study in Japan (the COUPLING Registry). J. Clin. Hypertens. 2020, 22, 465–474. [Google Scholar] [CrossRef] [PubMed]
- Sakuma, K.; Shimoda, A.; Shiratori, H.; Komatsu, T.; Watanabe, K.; Chiba, T.; Aimoto, M.; Nagasawa, Y.; Hori, Y.; Shirai, K.; et al. Angiotensin II Acutely Increases Arterial Stiffness as Monitored by Cardio-Ankle Vascular Index (CAVI) in Anesthetized Rabbits. J. Pharmacol. Sci. 2019, 140, 205–209. [Google Scholar] [CrossRef]


| Variables | Group 1 Type 2 Diabetes n = 272 | Group 2 Prediabetes n = 44 | Group 3 Normoglycemia n = 1301 | p Value a |
|---|---|---|---|---|
| Age, years | 55.0 (48.0;59;0) | 52.5 (46.5;59.0) # | 46.0 (35.0;55.0) $ | <0.001 |
| Male sex (n, %) | 90 (33.1) * | 23 (52.3) | 584 (44.9) $ | 0.002 |
| Weight (kg) | 88.1 (75.5;100.0) | 84.85 (71.95;92.1) # | 75.8 (64.1;88.2) $ | <0.001 |
| Height (cm) | 165.6 (158.5;171.0) | 167.6 (162.5;174.5) # | 168.0 (161.0;175.0) | 0.002 |
| Waist circumference (cm) | 103.0 (90.1;112.0) | 98.0 (91.0;107.5) # | 91.0 (81.0;101.0) $ | <0.001 |
| Hip circumference (cm) | 112.2 (103.0;120.0) * | 106.0 (100.5;113.0) # | 102.0 (95.0;109.0) $ | <0.001 |
| BMI (kg/m2) | 32.9 (25.6;37.0) | 30.1 (26.4;33.0) # | 26.7 (23.7;31.0) $ | <0.001 |
| Obesity (BMI ≥ 30 kg/m2) | 164 (60.3) | 22 (50.0) # | 378 (29.1) $ | <0.001 |
| Visceral obesity (waist circumference ≥ 80 cm in women and ≥94 cm in men) | 228 (84.1) | 35 (79.6) | 809 (62.2) $ | <0.001 |
| Lifestyle, Physical Activity and Nutrition | ||||
| Drinking alcohol more than once a week (n,%) | 14 (5.15) | 4 (9.1) | 91 (7.0) | 0. 346 |
| Physical activity: sedentary work (n,%) | 79 (29.0) | 15 (34.1) | 464 (35.7) | 0.041 |
| Time spent sitting in a day (hours, Me [LQ; UQ]) | 4.0 (3.0;7.0) | 5.0 (3.0;9.0) | 5.0 (3.0;8.0) $ | 0.005 |
| Total minutes of physical activity per day (minutes, Me [LQ; UQ]) | 240.0 (180.0;360.0) | 240.0 (180.0;360.0) | 300.0 (180.0;480.0) $ | 0.007 |
| Insufficient consumption of vegetables (n,%) | 78 (28.7) | 12 (27.3) | 443 (34.1) | 0.056 |
| Insufficient consumption of fish and seafood (n,%) | 48 (17.7) | 343 (26.4) | 9 (20.5) $ | 0.006 |
| Tobacco smoking (n,%) | 64 (23.5) | 10 (22.7) # | 419 (32.2) $ | 0.006 |
| Smoking experience (years) | 36.5 (25.0;41.5) | 33.0 (24.0;42.0) # | 24.0 (16.0;35.0) $ | <0.001 |
| Laboratory Data in Groups | ||||
| Employed (n, %) | 183 (67.3) | 29 (65.9) | 998 (76.7) $ | 0.003 |
| Arterial hypertension (n, %) | 155 (57.0) | 28 (63.6) # | 519 (39.9) $ | 0.001 |
| Ischemic heart disease (n, %) | 47 (17.3) | 5 (11.4) | 90 (6.9) $ | 0.001 |
| History of stroke (n, %) | 20 (1.5) | 0 (0) | 14 (5.15) $ | 0.002 |
| Kidney disease (n, %) | 94 (34.6) | 16 (36.4) | 300 (23.1) $ | 0.001 |
| Glucose (mmol/L) | 6.5 (5.0;7.0) * | 6.3 (6.1;6.5) # | 4.8 (4.4;5.2) $ | <0.001 |
| Total cholesterol (mmol/L) | 5.4 (4.7;6.2) | 5.7 (5.1;6.6) # | 5.1 (4.3;5.8) $ | <0.001 |
| HDL cholesterol (mmol/L) | 1.6 (1.3;1.9) | 1.6 (1.4;1.9) # | 1.7 (1.4;2.0) $ | 0.002 |
| LDL cholesterol (mmol/L) | 3.7 (3.0;4.2) | 3.7 (3.2;4.6) # | 3.4 (2.7;4.1) $ | <0.001 |
| Triglycerides (mmol/L) | 1.6 (0.9;1.9) | 1.6 (1.1;2.1) # | 1.2 (0.7;1.5) $ | <0.001 |
| Creatinine (μmol/l) | 69.4(63.5;76.9) * | 73.45 (69.55;82.1) # | 69.5 (63.3;77.2) | 0.003 |
| GFR CKD-EPI (mL/min/ 1.73 m2) | 88.8 (80.3;100.1) | 96.6 (91.9;102.8) # | 103.0 (96.1;111.2) $ | <0.001 |
| Uric acid (μmol/l) | 0.3 (0.3;0.4) | 0.4 (0.3;0.4) # | 0.3 (0.2;0.35) $ | <0.001 |
| Volume Sphygmography Data (VaSera VS-1000) n = 1586 | ||||
| n = 268 | n = 44 | n = 1274 | ||
| Heart rate (beats/min) | 76.8 (68.5;83.5) | 76.5 (69.8;83.8) # | 73.0 (67.3;79.5) $ | <0.001 |
| Systolic blood pressure-hand (mmHg) | 137.75 (125.3;154.3) | 134.75 (127.5;153.7) # | 128.5 (117.0;141.0) $ | <0.001 |
| Diastolic blood pressure-hand (mmHg) | 89.8 (82.0;96.0) | 92.5 (81.5;101.0) # | 83.5 (75.5;92.5) $ | <0.001 |
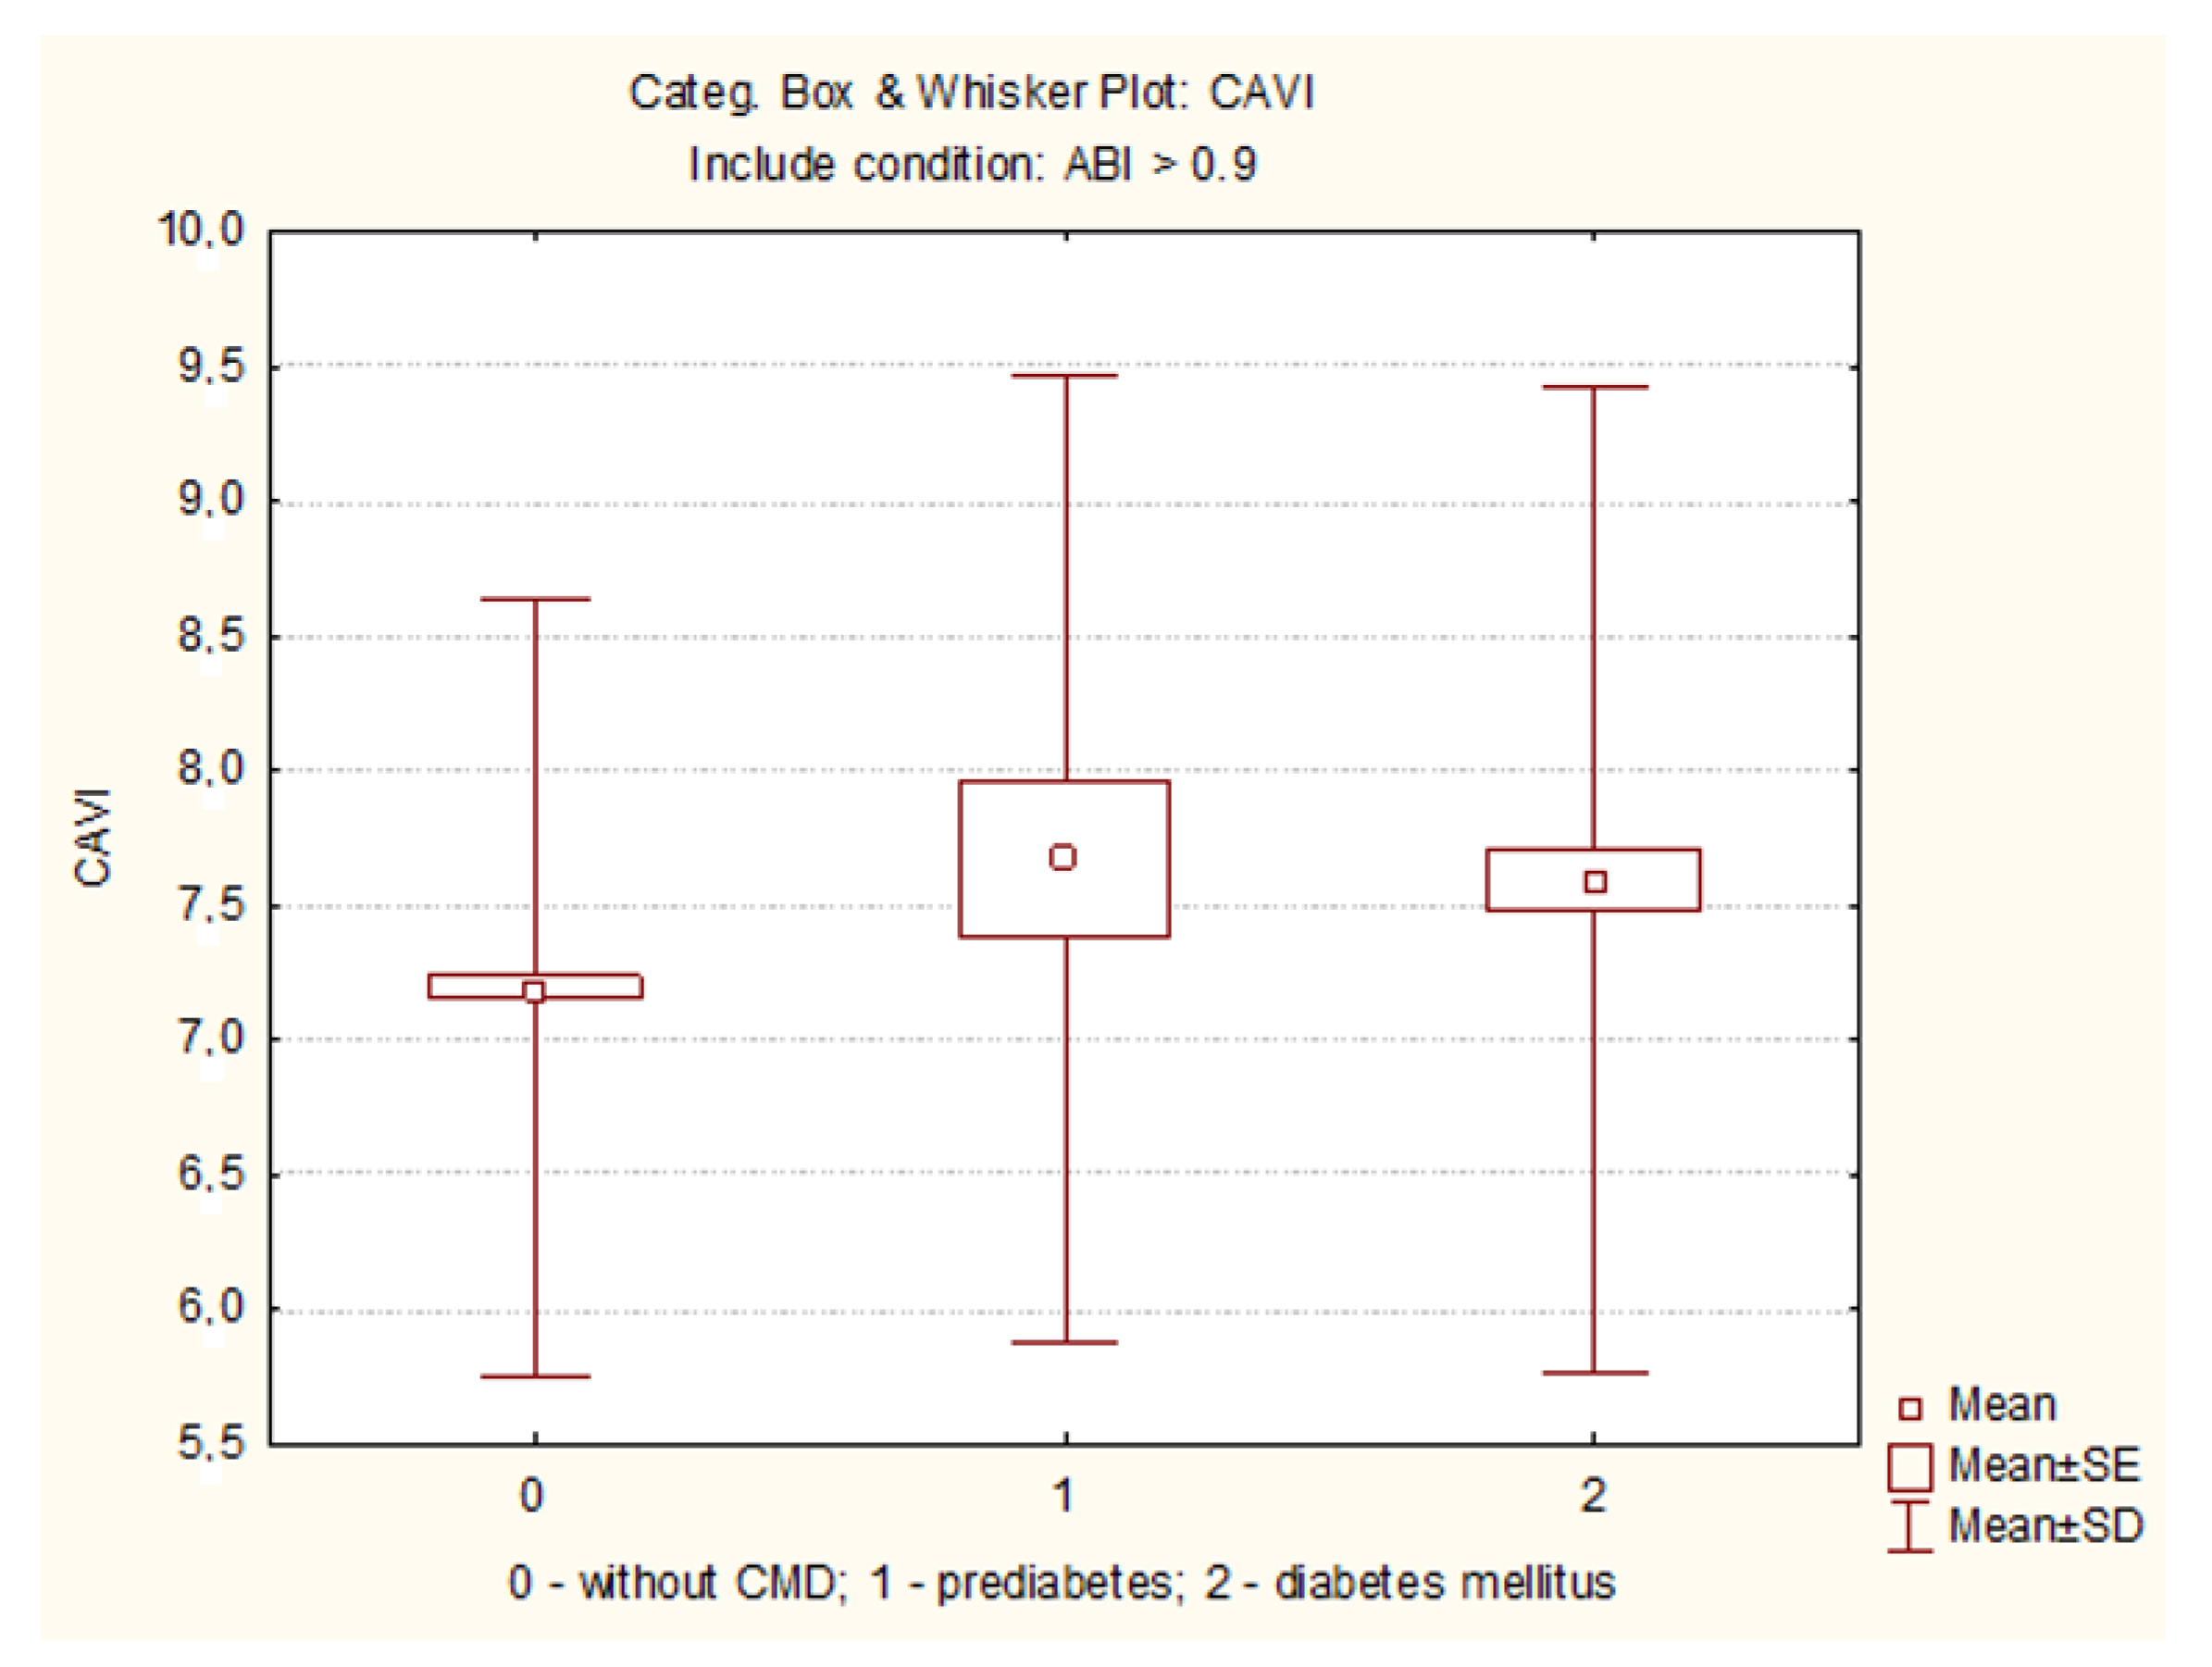
| CAVI | 7.5 (6.7;8.6) | 7.7 (6.7;8.4) # | 7.2 (6.3;7.9) $ | 0.007 |
| Pathological CAVI ≥ 9.0 | 45 (16.8) | 7 (15.9) | 114 (9.0) $ | <0.001 |
| Conditionally pathological CAVI ≥ 8 (n, %) | 108 (40.3) | 17 (38.6) | 297 (23.3) $ | <0.001 |
| Unstandardized Coefficients | Standardized Coefficients | t | Sig. p Value | 95.0% Confidence Interval for B | |||
|---|---|---|---|---|---|---|---|
| B | Std. Error | Beta | Lower Bound | Upper Bound | |||
| Total sample | |||||||
| (Constant) | 3.789 | 0.279 | 13.583 | 0.000 | 3.242 | 4.337 | |
| Age | 0.058 | 0.003 | 0.432 | 16.761 | 0.000 | 0.052 | 0.065 |
| BMI | −0.082 | 0.010 | −0.336 | −8.545 | 0.000 | −0.100 | −0.063 |
| SBP | 0.009 | 0.003 | 0.121 | 3.260 | 0.001 | 0.004 | 0.015 |
| WC | 0.011 | 0.004 | 0.106 | 2.575 | 0.010 | 0.003 | 0.020 |
| DBP | 0.009 | 0.004 | 0.080 | 2.204 | 0.028 | 0.001 | 0.018 |
| Normoglycemia | |||||||
| (Constant) | 4.689 | 0.375 | 12.517 | 0.000 | 3.954 | 5.424 | |
| Age | 0.056 | 0.004 | 0.440 | 15.778 | 0.000 | 0.049 | 0.063 |
| BMI | −0.077 | 0.011 | −0.312 | −7.322 | 0.000 | −0.098 | −0.056 |
| DBP | 0.019 | 0.003 | 0.174 | 5.762 | 0.000 | 0.013 | 0.026 |
| WC | 0.012 | 0.005 | 0.114 | 2.536 | 0.011 | 0.003 | 0.021 |
| HeartRate | −0.009 | 0.004 | −0.059 | −2.271 | 0.023 | −0.016 | −0.001 |
| Type 2 diabetes and prediabetes | |||||||
| (Constant) | 3.536 | 0.770 | 4.592 | 0.000 | 2.020 | 5.052 | |
| Age | 0.069 | 0.011 | 0.341 | 6.103 | 0.000 | 0.047 | 0.092 |
| BMI | −0.085 | 0.015 | −0.319 | −5.779 | 0.000 | −0.114 | −0.056 |
| SBP | 0.023 | 0.005 | 0.260 | 4.508 | 0.000 | 0.013 | 0.033 |
| B | S.E. | Wald | df | Sig. (p Value) | Exp(B) | ||
|---|---|---|---|---|---|---|---|
| Total sample | |||||||
| Step 1a | Age | 0.102 | 0.011 | 80.959 | 1 | 0.000 | 1.108 |
| Constant | −7.430 | 0.632 | 138.339 | 1 | 0.000 | 0.001 | |
| Step 2b | Age | 0.096 | 0.012 | 66.078 | 1 | 0.000 | 1.101 |
| DBP | 0.035 | 0.007 | 22.664 | 1 | 0.000 | 1.035 | |
| Constant | 10.221 | 0.910 | 126.109 | 1 | 0.000 | 0.000 | |
| Step 3c | Age | 0.101 | 0.012 | 70.339 | 1 | 0.000 | 1.106 |
| DBP | 0.039 | 0.008 | 26.733 | 1 | 0.000 | 1.040 | |
| BMI | −0.040 | 0.017 | 5.780 | 1 | 0.016 | 0.961 | |
| Constant | −9.705 | 0.929 | 109.144 | 1 | 0.000 | 0.000 | |
| Step 4d | Age | 0.099 | 0.012 | 68.207 | 1 | 0.000 | 1.104 |
| Stroke | 0.905 | 0.447 | 4.104 | 1 | 0.043 | 2.471 | |
| DBP | 0.039 | 0.008 | 26.108 | 1 | 0.000 | 1.040 | |
| BMI | −0.043 | 0.017 | 6.510 | 1 | 0.011 | 0.958 | |
| Constant | −10.450 | 0.998 | 109.621 | 1 | 0.000 | 0.000 | |
| Normoglycemia | |||||||
| Step 1a | Age | 0.102 | 0.013 | 64.998 | 1 | 0.000 | 1.107 |
| Constant | −7.385 | 0.689 | 114.952 | 1 | 0.000 | 0.001 | |
| Step 2b | Age | 0.095 | 0.013 | 52.678 | 1 | 0.000 | 1.100 |
| DBP | 0.033 | 0.008 | 15.986 | 1 | 0.000 | 1.034 | |
| Constant | −10.027 | 1.007 | 99.119 | 1 | 0.000 | 0.000 | |
| Step 3c | Age | 0.101 | 0.013 | 56.932 | 1 | 0.000 | 1.106 |
| DBP | 0.036 | 0.008 | 17.948 | 1 | 0.000 | 1.036 | |
| Cholesterol | −0.225 | 0.098 | 5.280 | 1 | 0.022 | 0.799 | |
| Constant | −9.344 | 1.041 | 80.604 | 1 | 0.000 | 0.000 | |
| Type 2 diabetes and prediabetes | |||||||
| Step 1a | SBP | 0.030 | 0.008 | 14.699 | 1 | 0.000 | 1.031 |
| Constant | −6.122 | 1.183 | 26.782 | 1 | 0.000 | 0.002 | |
| Step 2b | SBP | 0.023 | 0.008 | 7.944 | 1 | 0.005 | 1.023 |
| GFR_CKD-EPI | −0.077 | 0.027 | 8.203 | 1 | 0.004 | 0.926 | |
| Constant | 2.206 | 3.011 | 0.537 | 1 | 0.464 | 9.082 | |
| Step 3c | SBP | 0.029 | 0.009 | 10.786 | 1 | 0.001 | 1.029 |
| GFR_CKD-EPI | −0.080 | 0.028 | 8.339 | 1 | 0.004 | 0.923 | |
| Obesity | −0.834 | 0.388 | 4.623 | 1 | 0.032 | 0.435 | |
| Constant | 2.227 | 3.100 | 0.516 | 1 | 0.473 | 9.269 | |
| Step 4d | SBP | 0.030 | 0.009 | 11.218 | 1 | 0.001 | 1.030 |
| Visceral Obesity | 1.487 | 0.683 | 4.737 | 1 | 0.030 | 4.424 | |
| GFR_CKD-EPI | −0.075 | 0.029 | 6.871 | 1 | 0.009 | 0.927 | |
| Obesity | −1.264 | 0.421 | 9.038 | 1 | 0.003 | 0.282 | |
| Constant | 0.537 | 3.266 | 0.027 | 1 | 0.869 | 1.711 | |
Publisher’s Note: MDPI stays neutral with regard to jurisdictional claims in published maps and institutional affiliations. |
© 2021 by the authors. Licensee MDPI, Basel, Switzerland. This article is an open access article distributed under the terms and conditions of the Creative Commons Attribution (CC BY) license (http://creativecommons.org/licenses/by/4.0/).
Share and Cite
Sumin, A.N.; Bezdenezhnykh, N.A.; Bezdenezhnykh, A.V.; Artamonova, G.V. Cardio-Ankle Vascular Index in the Persons with Pre-Diabetes and Diabetes Mellitus in the Population Sample of the Russian Federation. Diagnostics 2021, 11, 474. https://doi.org/10.3390/diagnostics11030474
Sumin AN, Bezdenezhnykh NA, Bezdenezhnykh AV, Artamonova GV. Cardio-Ankle Vascular Index in the Persons with Pre-Diabetes and Diabetes Mellitus in the Population Sample of the Russian Federation. Diagnostics. 2021; 11(3):474. https://doi.org/10.3390/diagnostics11030474
Chicago/Turabian StyleSumin, Alexei N., Natalia A. Bezdenezhnykh, Andrey V. Bezdenezhnykh, and Galina V. Artamonova. 2021. "Cardio-Ankle Vascular Index in the Persons with Pre-Diabetes and Diabetes Mellitus in the Population Sample of the Russian Federation" Diagnostics 11, no. 3: 474. https://doi.org/10.3390/diagnostics11030474
APA StyleSumin, A. N., Bezdenezhnykh, N. A., Bezdenezhnykh, A. V., & Artamonova, G. V. (2021). Cardio-Ankle Vascular Index in the Persons with Pre-Diabetes and Diabetes Mellitus in the Population Sample of the Russian Federation. Diagnostics, 11(3), 474. https://doi.org/10.3390/diagnostics11030474