
Improved Influenza Diagnostics through Thermal Contrast Amplification

 , and
, and
Abstract
1. Introduction
2. Materials and Methods
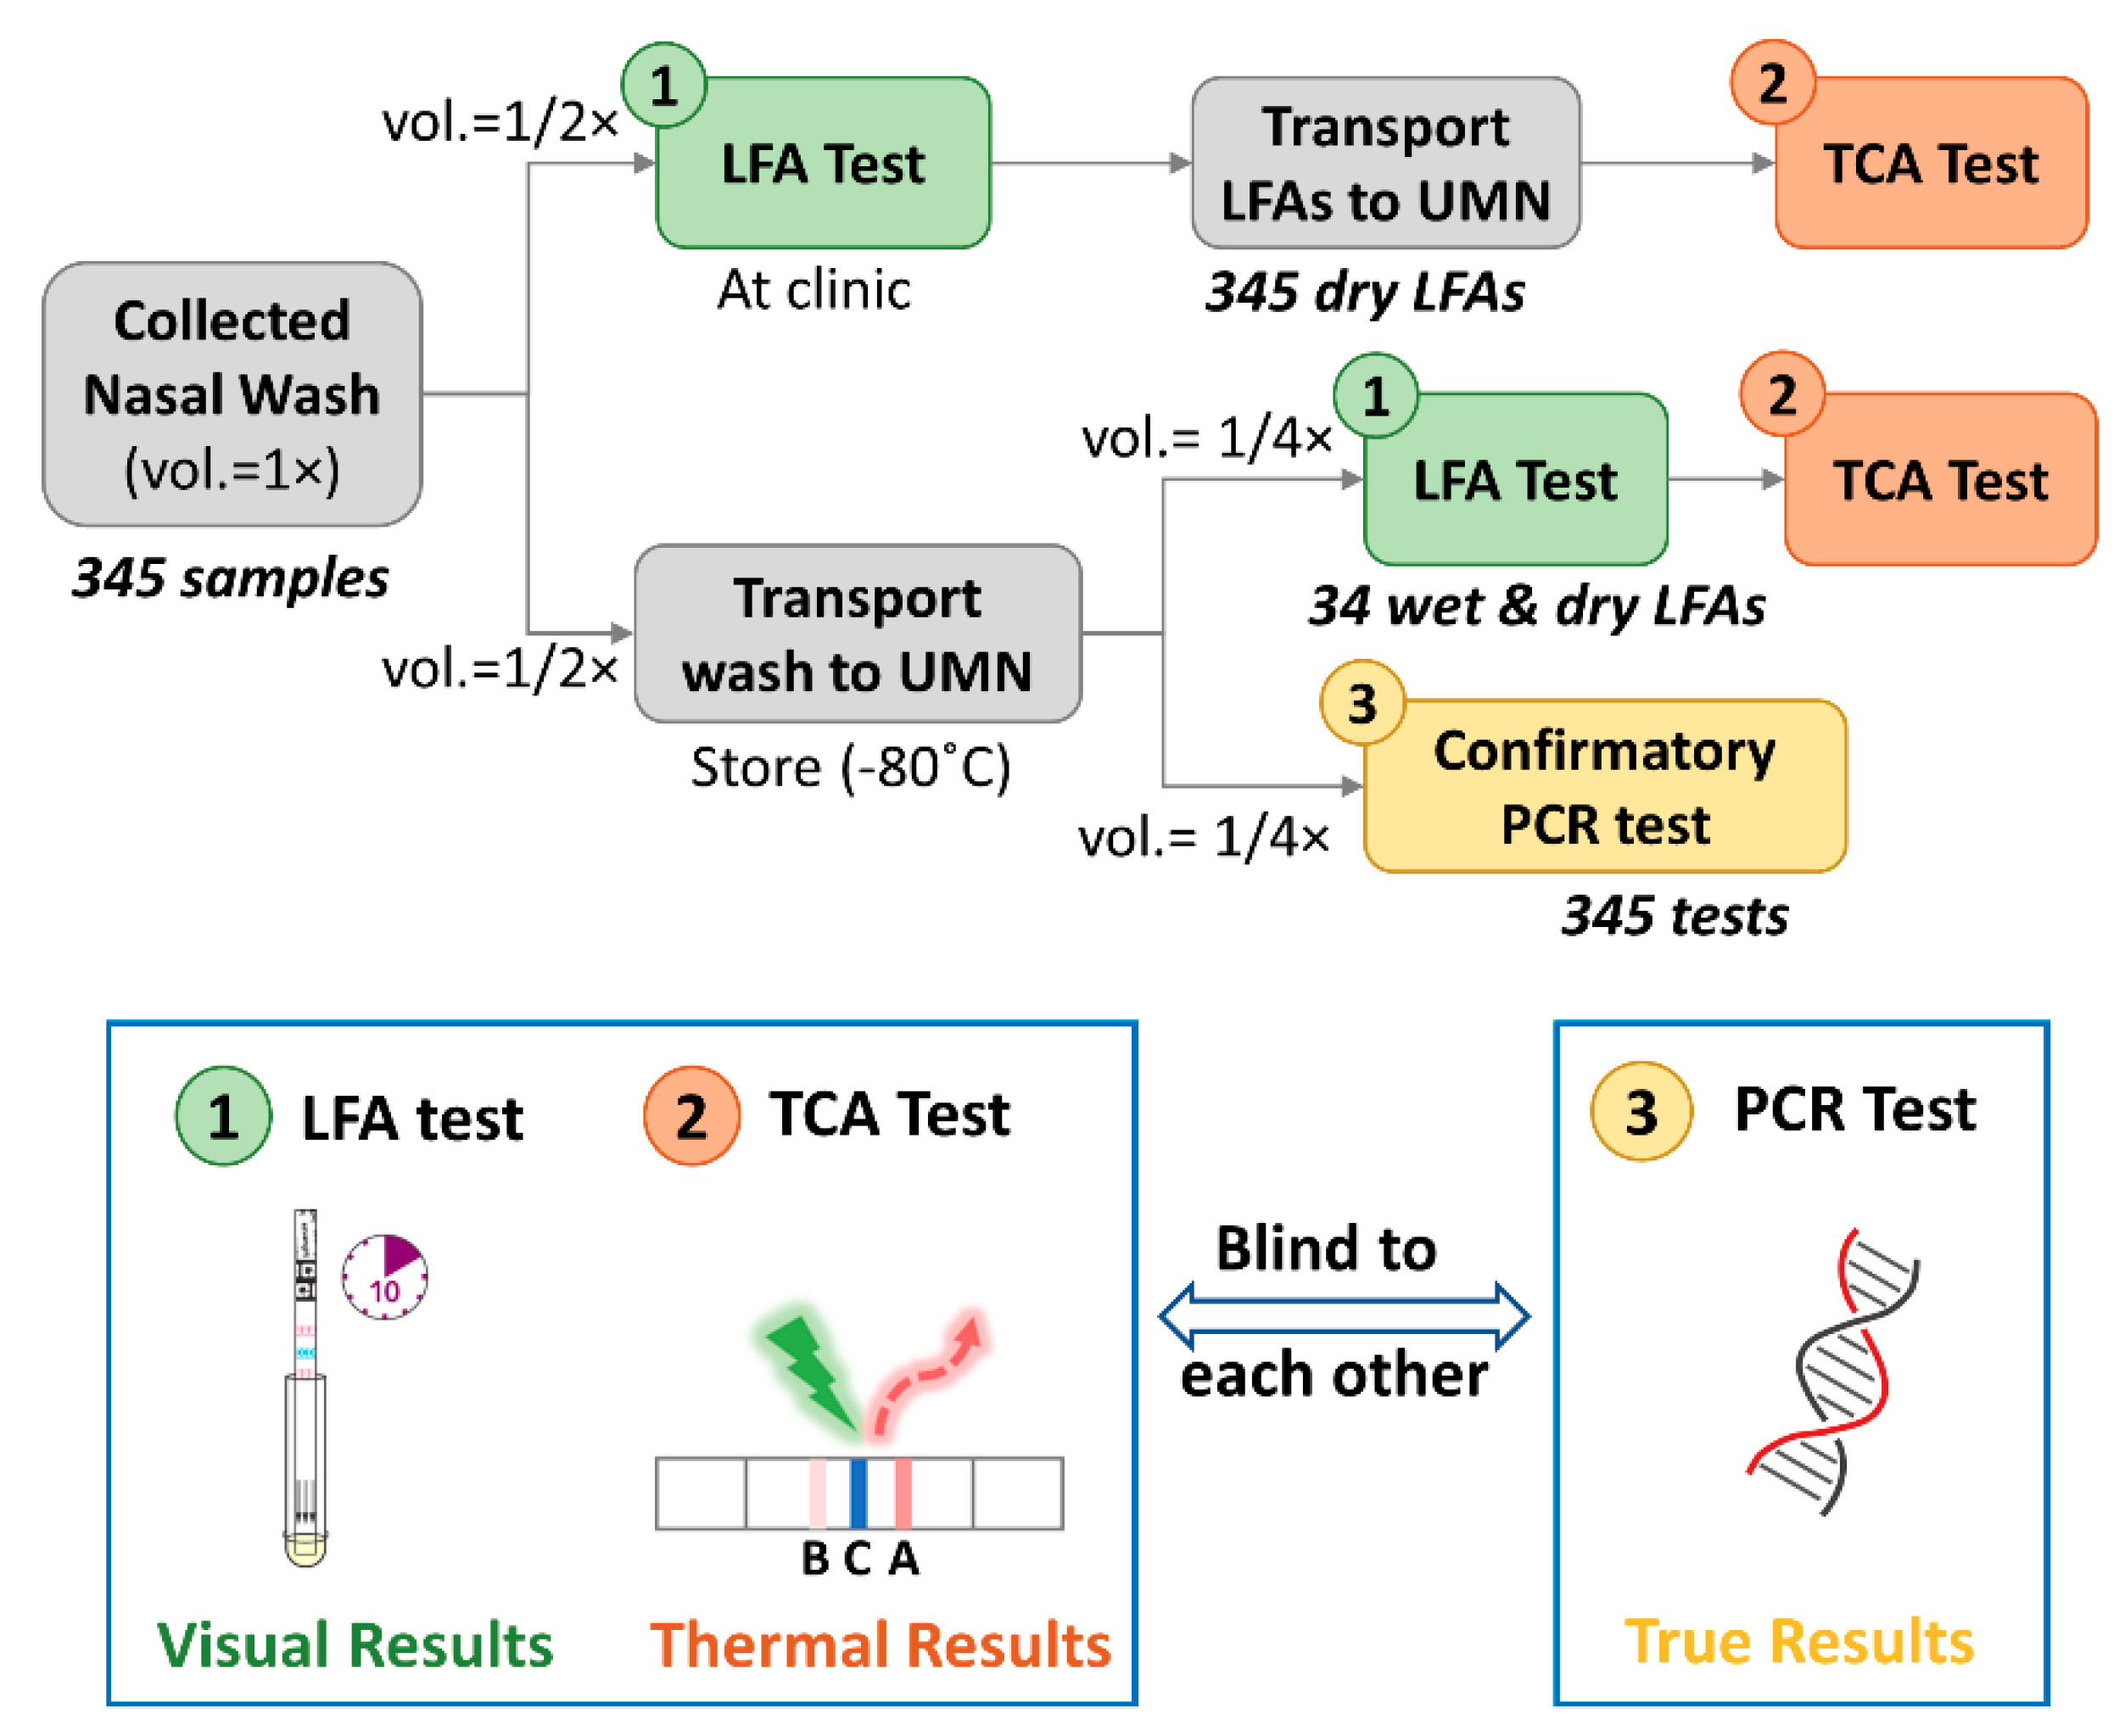
2.1. Clinical LFA Samples
2.2. Confirmatory and TCA Tests
2.2.1. Confirmatory Reference Standard Test
2.2.2. TCA Test
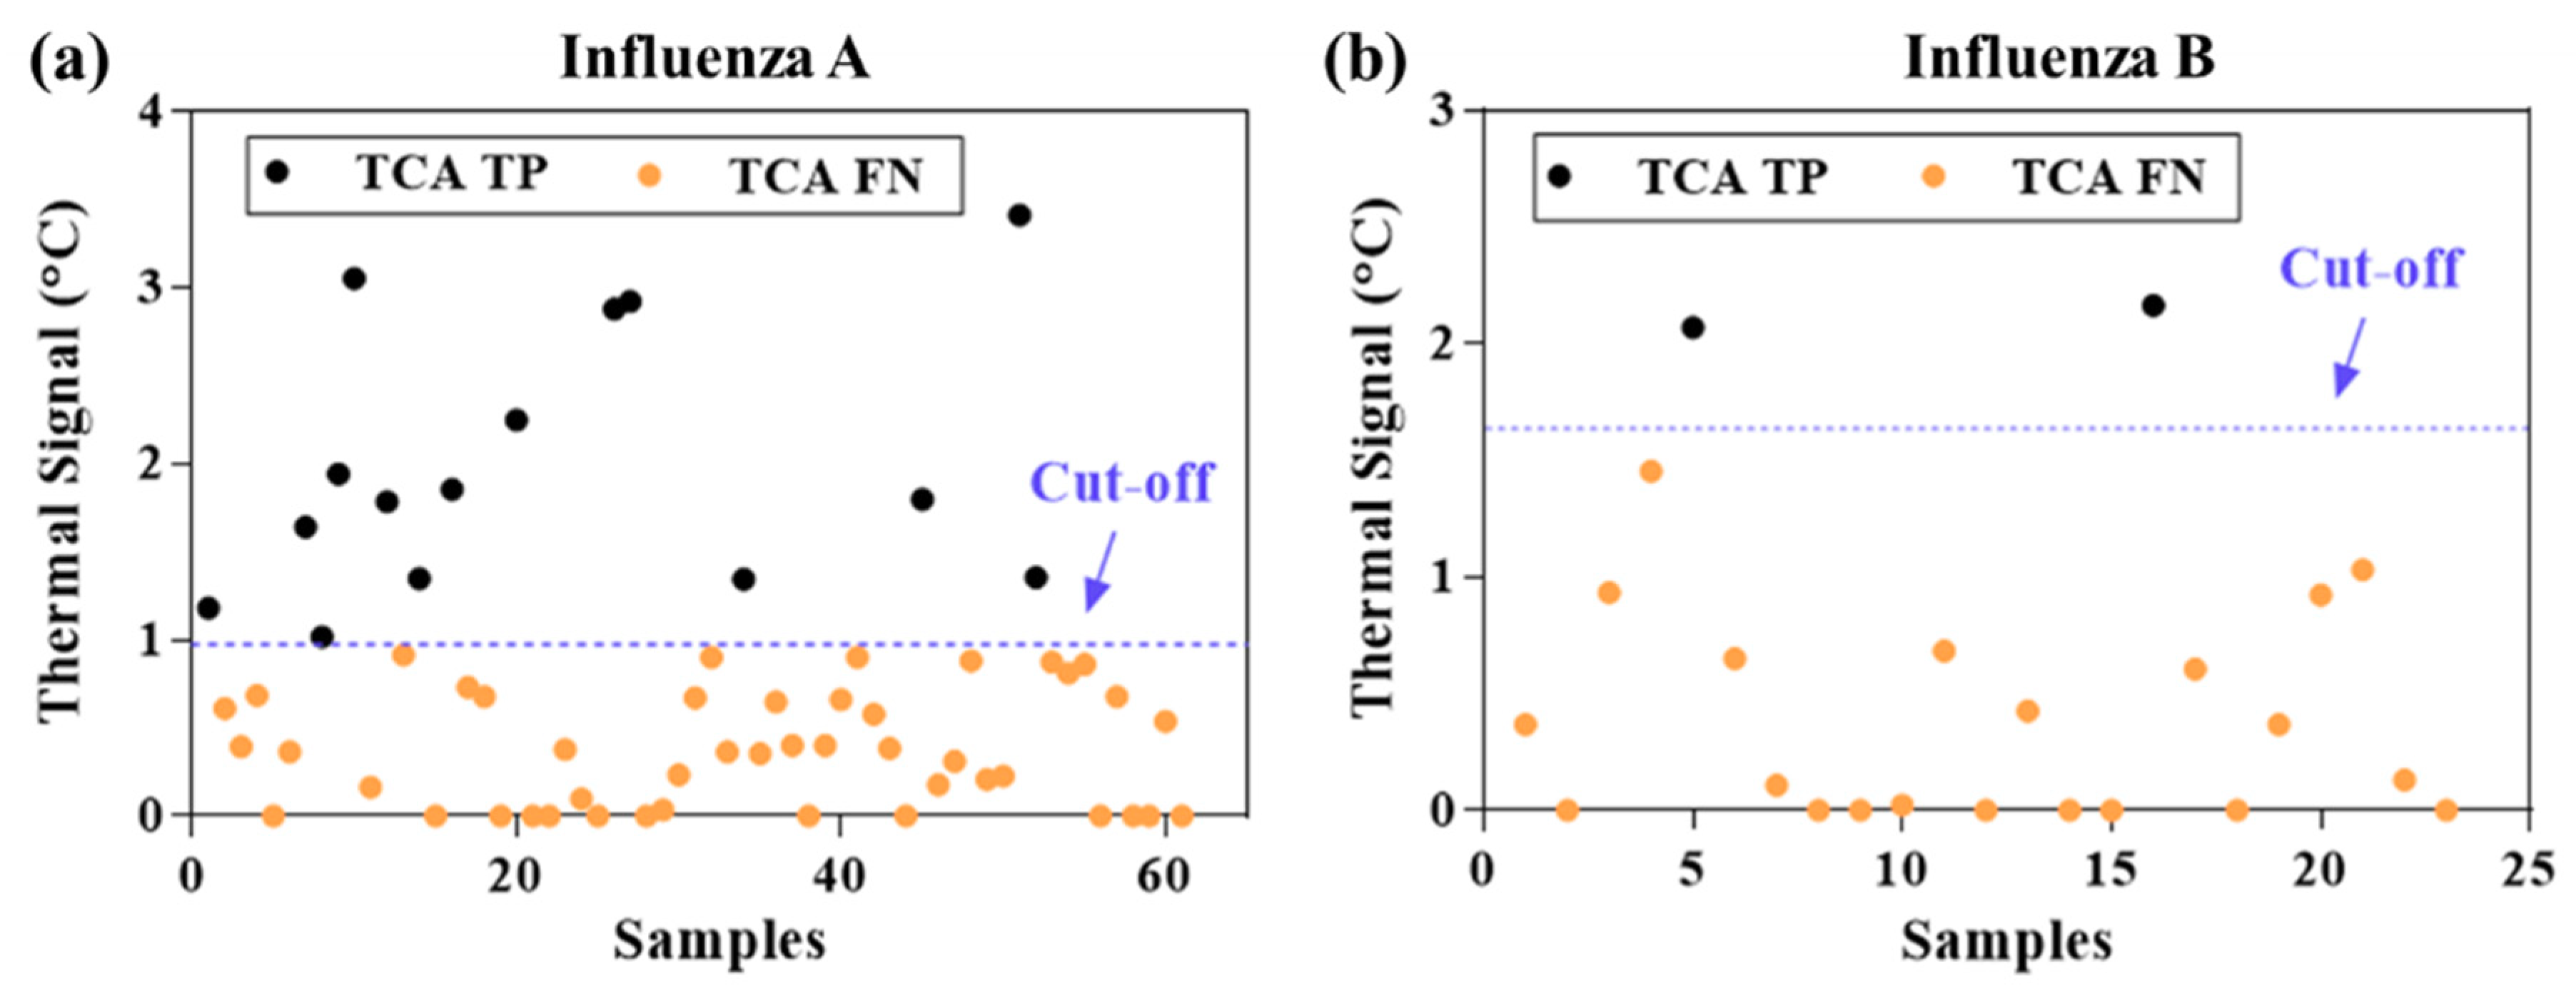
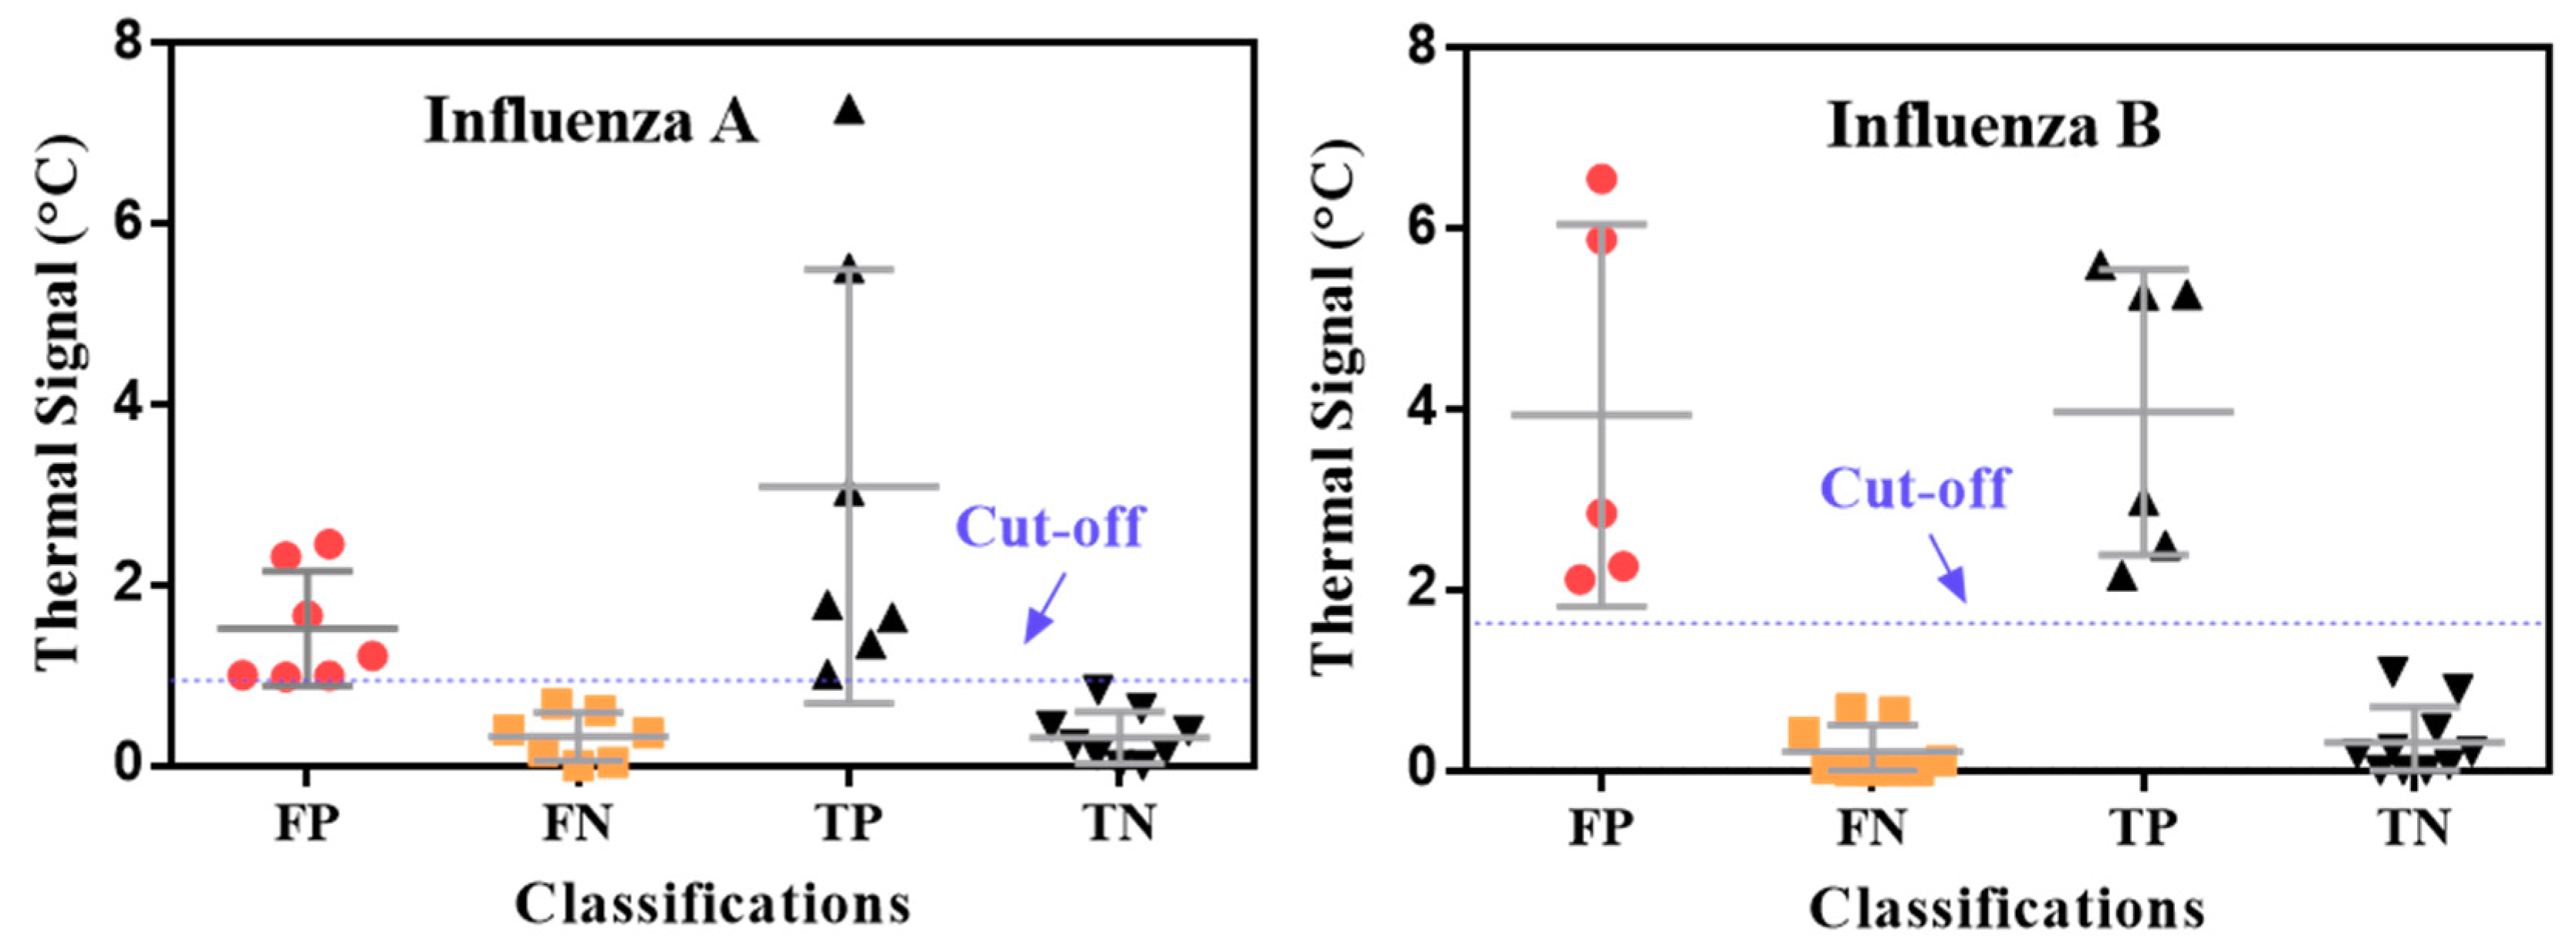
3. Results and Discussion
4. Conclusions
Supplementary Materials
Author Contributions
Funding
Informed Consent Statement
Acknowledgments
Conflicts of Interest
References
- World Health Organization. Up to 650,000 people die of respiratory diseases linked to seasonal flu each year. Saudi Med. J. 2018, 39, 109–110. [Google Scholar]
- Center for Disease Control and Prevention. Estimated Influenza Illnesses, Medical Visits, Hospitalizations, and Deaths in the United States—2018–2019 Influenza season. Available online: https://www.cdc.gov/flu/about/burden/2018-2019.html (accessed on 12 December 2020).
- Center for Disease Control and Prevention. Weekly, U.S. Influenza Surveillance Report; CDC: Atlanta, GA, USA, 2021. Available online: https://www.cdc.gov/flu/weekly/index.htm (accessed on 21 January 2021).
- World Health Organization. Influenza Update-382; WHO: Geneva, Switzerland, 2020. [Google Scholar]
- World Health Organization. Maintaining Surveillance of Influenza and Monitoring SARS-CoV-2 Adapting Global Influenza Surveillance and Response System (GISRS) and Sentinel Systems during the COVID-19 Pandemic: Interim Guidance, 8 November 2020; World Health Organization: Geneva, Switzerland, 2020. [Google Scholar]
- Federici, C.; Cavazza, M.; Costa, F.; Jommi, C. Health care costs of influenza-related episodes in high income countries: A systematic review. PLoS ONE 2018, 13, e0202787. [Google Scholar] [CrossRef]
- Molinari, N.-A.M.; Ortega-Sanchez, I.R.; Messonnier, M.L.; Thompson, W.W.; Wortley, P.M.; Weintraub, E.; Bridges, C.B. The annual impact of seasonal influenza in the US: Measuring disease burden and costs. Vaccine 2007, 25, 5086–5096. [Google Scholar] [CrossRef]
- Lai, P.L.; Panatto, D.; Ansaldi, F.; Canepa, P.; Amicizia, D.; Patria, A.G.; Gasparini, R. Burden of the 1999–2008 Seasonal Influenza epidemics in Italy: Comparison with the H1N1v (A/California/07/09) Pandemic. Hum. Vaccine 2011, 7 (Suppl. 1), 217–225. [Google Scholar] [CrossRef] [PubMed]
- McLean, H.Q.; Thompson, M.G.; Sundaram, M.E.; Kieke, B.A.; Gaglani, M.; Murthy, K.; Piedra, P.A.; Zimmerman, R.K.; Nowalk, M.P.; Raviotta, J.M.; et al. Influenza vaccine effectiveness in the united states during 2012–2013: Variable protection by age and virus type. J. Infect. Dis. 2015, 211, 1529–1540. [Google Scholar] [CrossRef]
- Aquino, T.L.; Brice, G.T.; Hayes, S.; Myers, C.A.; McDowell, J.; White, B.; Garten, R.; Johnston, D. Influenza outbreak in a vaccinated population—USS Ardent, February 2014. MMWR. Morb. Mortal. Wkly. Rep. 2014, 63, 947–949. [Google Scholar]
- Chan, P.K.S.; Lee, N.; Zaman, M.; Adisasmito, W.; Coker, R.; Hanshaoworakul, W.; Gasimov, V.; Oner, A.F.; Dogan, N.; Tsang, O.; et al. Determinants of Antiviral Effectiveness in Influenza Virus A Subtype H5N1. J. Infect. Dis. 2012, 206, 1359–1366. [Google Scholar] [CrossRef] [PubMed]
- Havers, F.; Thaker, S.; Clippard, J.R.; Jackson, M.; McLean, H.Q.; Gaglani, M.; Monto, A.S.; Zimmerman, R.K.; Jackson, L.; Petrie, J.G.; et al. Use of influenza antiviral agents by ambulatory care clinicians during the 2012–2013 influenza season. Clin. Infect. Dis. 2014, 59, 774–782. [Google Scholar] [CrossRef] [PubMed]
- Nicholson, K.G.; Abrams, K.R.; Batham, S.; Medina, M.J.; Warren, F.C.; Barer, M.; Bermingham, A.; Clark, T.W.; Latimer, N.; Fraser, M.; et al. Randomised controlled trial and health economic evaluation of the impact of diagnostic testing for influenza, respiratory syncytial virus and Streptococcus pneumoniae infection on the management of acute admissions in the elderly and high-risk 18- to 64-year-olds. Health Technol. Assess. 2014, 18, 1. [Google Scholar] [CrossRef] [PubMed]
- Vemula, S.V.; Zhao, J.; Liu, J.; Wang, X.; Biswas, S.; Hewlett, I. Current Approaches for Diagnosis of Influenza Virus Infections in Humans. Viruses 2016, 8, 96. [Google Scholar] [CrossRef]
- Benirschke, R.C.; McElvania, E.; Thomson, R.B.; Kaul, K.L.; Das, S. Clinical impact of rapid point-of-care PCR Influenza Testing in an urgent care setting: A single-center study. J. Clin. Microbiol. 2019. [Google Scholar] [CrossRef] [PubMed]
- Ruest, A.; Michaud, S.; Deslandes, S.; Frost, E.H. Comparison of the Directigen Flu A + B Test, the QuickVue Influenza Test, and Clinical Case definition to viral culture and reverse transcription-PCR for rapid diagnosis of influenza virus infection. J. Clin. Microbiol. 2003, 41, 3487–3493. [Google Scholar] [CrossRef] [PubMed]
- Borst, A.; Box, A.T.A.; Fluit, A.C. False-positive results and contamination in nucleic acid amplification assays: Suggestions for a prevent and destroy strategy. Eur. J. Clin. Microbiol. Infect. Dis. 2004, 4, 289–299. [Google Scholar] [CrossRef]
- Choi, J.R. development of point-of-care biosensors for COVID-19. Front. Chem. 2020, 8, 517. [Google Scholar] [CrossRef]
- Udugama, B.; Kadhiresan, P.; Kozlowski, H.N.; Malekjahani, A.; Osborne, M.; Li, V.Y.C.; Chen, H.; Mubareka, S.; Gubbay, J.B.; Chan, W.C.W. Diagnosing COVID-19: The disease and tools for detection. ACS Nano 2020, 14, 3822–3835. [Google Scholar] [CrossRef]
- Courtney, S.J.; Stromberg, Z.R.; Kubicek-Sutherland, J.Z. Nucleic acid-based sensing techniques for diagnostics and surveillance of influenza. Biosensensors 2021, 11, 47. [Google Scholar] [CrossRef]
- Azar, M.M.; Landry, M.L. Detection of Influenza A and B Viruses and Respiratory Syncytial Virus by Use of Clinical Laboratory Improvement Amendments of 1988 (CLIA)-Waived Point-of-Care Assays: A Paradigm Shift to Molecular Tests. J. Clin. Microbiol. 2018, 56, e00367-18. [Google Scholar] [CrossRef]
- Centers for Disease Control and Prevention (CDC). Evaluation of Rapid Influenza Diagnostic Tests for Detection of Novel Influenza A (H1N1) Virus—United States, 2009. Morb. Mortal. Wkly. Rep. 2009, 58, 826–829. [Google Scholar]
- Peterson, S.; Dugas, A.F.; Rothman, R.E. Evaluation of 11 Commercially Available Rapid Influenza Diagnostic Tests—United States, 2011–2012. Ann. Emerg. Med. 2013, 61, 573–576. [Google Scholar]
- Peci, A.; Winter, A.-L.; King, E.-C.; Blair, J.; Gubbay, J.B. Performance of rapid influenza diagnostic testing in outbreak settings. J. Clin. Microbiol. 2014, 52, 4309–4317. [Google Scholar] [CrossRef] [PubMed]
- Ye, H.; Liu, Y.; Zhan, L.; Liu, Y.; Qin, Z. Signal amplification and quantification on lateral flow assays by laser excitation of plasmonic nanomaterials. Theranostics 2020, 10, 4359–4373. [Google Scholar] [CrossRef] [PubMed]
- Liu, Y.; Zhan, L.; Qin, Z.; Sackrison, J.; Bischof, J.C. ultrasensitive and highly specific lateral flow assays for point-of-care diagnosis. ACS Nano 2021. [Google Scholar] [CrossRef]
- Yang, Q.; Gong, X.; Song, T.; Yang, J.; Zhu, S.; Li, Y.; Cui, Y.; Li, Y.; Zhang, B.; Chang, J. Quantum Dot-based immuno-chromatography test strip for rapid, quantitative and sensitive detection of alpha fetoprotein. Biosens. Bioelectron. 2011, 30, 145–150. [Google Scholar] [CrossRef] [PubMed]
- Boulware, D.R.; Rolfes, M.A.; Rajasingham, R.; Von Hohenberg, M.; Qin, Z.; Taseera, K.; Schutz, C.; Kwizera, R.; Butler, E.K.; Meintjes, G.; et al. Multisite Validation of cryptococcal antigen lateral flow assay and quantification by laser thermal contrast. Emerg. Infect. Dis. 2014, 20, 45–53. [Google Scholar] [CrossRef]
- Qin, Z.; Chan, W.C.W.; Boulware, D.R.; Akkin, T.; Butler, E.K.; Bischof, J.C. Significantly improved analytical sensitivity of lateral flow immunoassays by using thermal contrast. Angew. Chem. Int. Ed. 2012, 51, 4358–4361. [Google Scholar] [CrossRef]
- Zhan, L.; Guo, S.-Z.; Song, F.; Gong, Y.; Xu, F.; Boulware, D.R.; McAlpine, M.C.; Chan, W.C.W.; Bischof, J.C. The role of nanoparticle design in determining analytical performance of lateral flow immunoassays. Nano Lett. 2017, 17, 7207–7212. [Google Scholar] [CrossRef] [PubMed]
- Wang, Y.; Louwagie, E.; Larkin, D.; Sankey, S.; Boulware, D.R.; Bischof, J.C. Improved detection of group a streptococcus during thermal contrast amplification vs. visual reading of clinical rapid diagnostic tests. Anal. Methods 2019, 11, 2013–2017. [Google Scholar] [CrossRef]
- Qin, Z. Laser Induced Gold Nanoparticle Heating: Thermal Contrast in Lateral Flow Immunoassays. ProQuest Diss. Theses 2014. [Google Scholar]
- Wang, Y.; Qin, Z.; Boulware, D.R.; Pritt, B.S.; Sloan, L.M.; Gonzalez, I.J.; Bell, D.; Rees-channer, R.R.; Chiodini, P.; Chan, W.C.W.; et al. Thermal contrast amplification reader yielding 8-fold analytical improvement for disease detection with lateral flow assays. Anal. Chem. 2026, 23, 11774–11782. [Google Scholar] [CrossRef]
- Zhan, L.; Granade, T.; Liu, Y.; Wei, X.; Youngpairoj, A.; Sullivan, V.; Johnson, J.; Bischof, J. Development and optimization of thermal contrast amplification lateral flow immunoassays for ultrasensitive HIV p24 protein detection. Microsyst. Nanoeng. 2020, 6, 1–11. [Google Scholar] [CrossRef]
- Li, L.; Chen, Q.-Y.; Li, Y.-Y.; Wang, Y.-F.; Yang, Z.-F.; Zhong, N.-S. Comparison among nasopharyngeal swab, nasal wash, and oropharyngeal swab for respiratory virus detection in adults with acute pharyngitis. BMC Infect. Dis. 2013, 13, 281. [Google Scholar] [CrossRef] [PubMed]
- Gritzfeld, J.F.; Roberts, P.; Roche, L.; El Batrawy, S.; Gordon, S.B. Comparison between nasopharyngeal swab and nasal wash, using culture and PCR, in the detection of potential respiratory pathogens. BMC Res. Notes 2011, 4, 122. [Google Scholar] [CrossRef] [PubMed][Green Version]
- DeByle, C.; Bulkow, L.; Miernyk, K.; Chikoyak, L.; Hummel, K.B.; Hennessy, T.; Singleton, R. Comparison of Nasopharyngeal flocked swabs and nasopharyngeal wash collection methods for respiratory virus detection in hospitalized children using real-time polymerase chain reaction. J. Virol. Methods 2012, 185, 89–93. [Google Scholar] [CrossRef]
- Gan, N.; Li, T.H.; Lei, J.P.; Wang, L.Y.; Yang, X. Electrochemical immunosensor for human immunodeficiency virus p24 antigen based on Mercapto succinic acid hydrazide copper monolayer modified gold electrode. Fenxi Huaxue/Chinese J. Anal. Chem. 2008, 36, 1167–1171. [Google Scholar] [CrossRef]
- Quidel. Principle of the Test. Available online: https://www.quidel.com/sites/default/files/product/documents/EF1350313EN00_1.pdf (accessed on 15 December 2020).
- Fawcett, T. An introduction to ROC analysis. Pattern Recognit. Lett. 2006, 27, 861–874. [Google Scholar] [CrossRef]


| LFAs | Targets | Dilution Sample | Analytical Sensitivity (Improvement, Detection Limit) | Refs |
|---|---|---|---|---|
| Commercial LFAs | Cryptococcus | Single patient human serum | 32-fold | [28,29] |
| Human hCG | Control solution | 20-fold | [32] | |
| Malaria | Recombinant HRP2 protein and cultured pathogen | 4- to 16-fold | [33] | |
| Influenza A/B | Control swabs | 8-fold | ||
| C. difficile GDH | Control solution | 8-fold | ||
| Group A Streptococcus | Control solution | 4- to 8-fold | [31] | |
| Optimized LFAs | C-Reactive protein (CRP) | Standard human CRP | 256-fold, 0.1 ng/mL | [30] |
| HIV p24 antigen | Standard p24 | 8 pg/mL | [34] |
| Influenza A | Influenza B | ||||||||
|---|---|---|---|---|---|---|---|---|---|
| (a) Visual | (b) TCA | (c) Visual | (d) TCA | ||||||
| TP = 29 | FP = 2 | TP = 44 | FP = 26 | TP = 6 | FP = 3 | TP = 8 | FP = 7 | ||
| FN = 61 | TN = 253 | FN = 46 | TN = 229 | FN = 23 | TN = 313 | FN = 21 | TN = 309 | ||
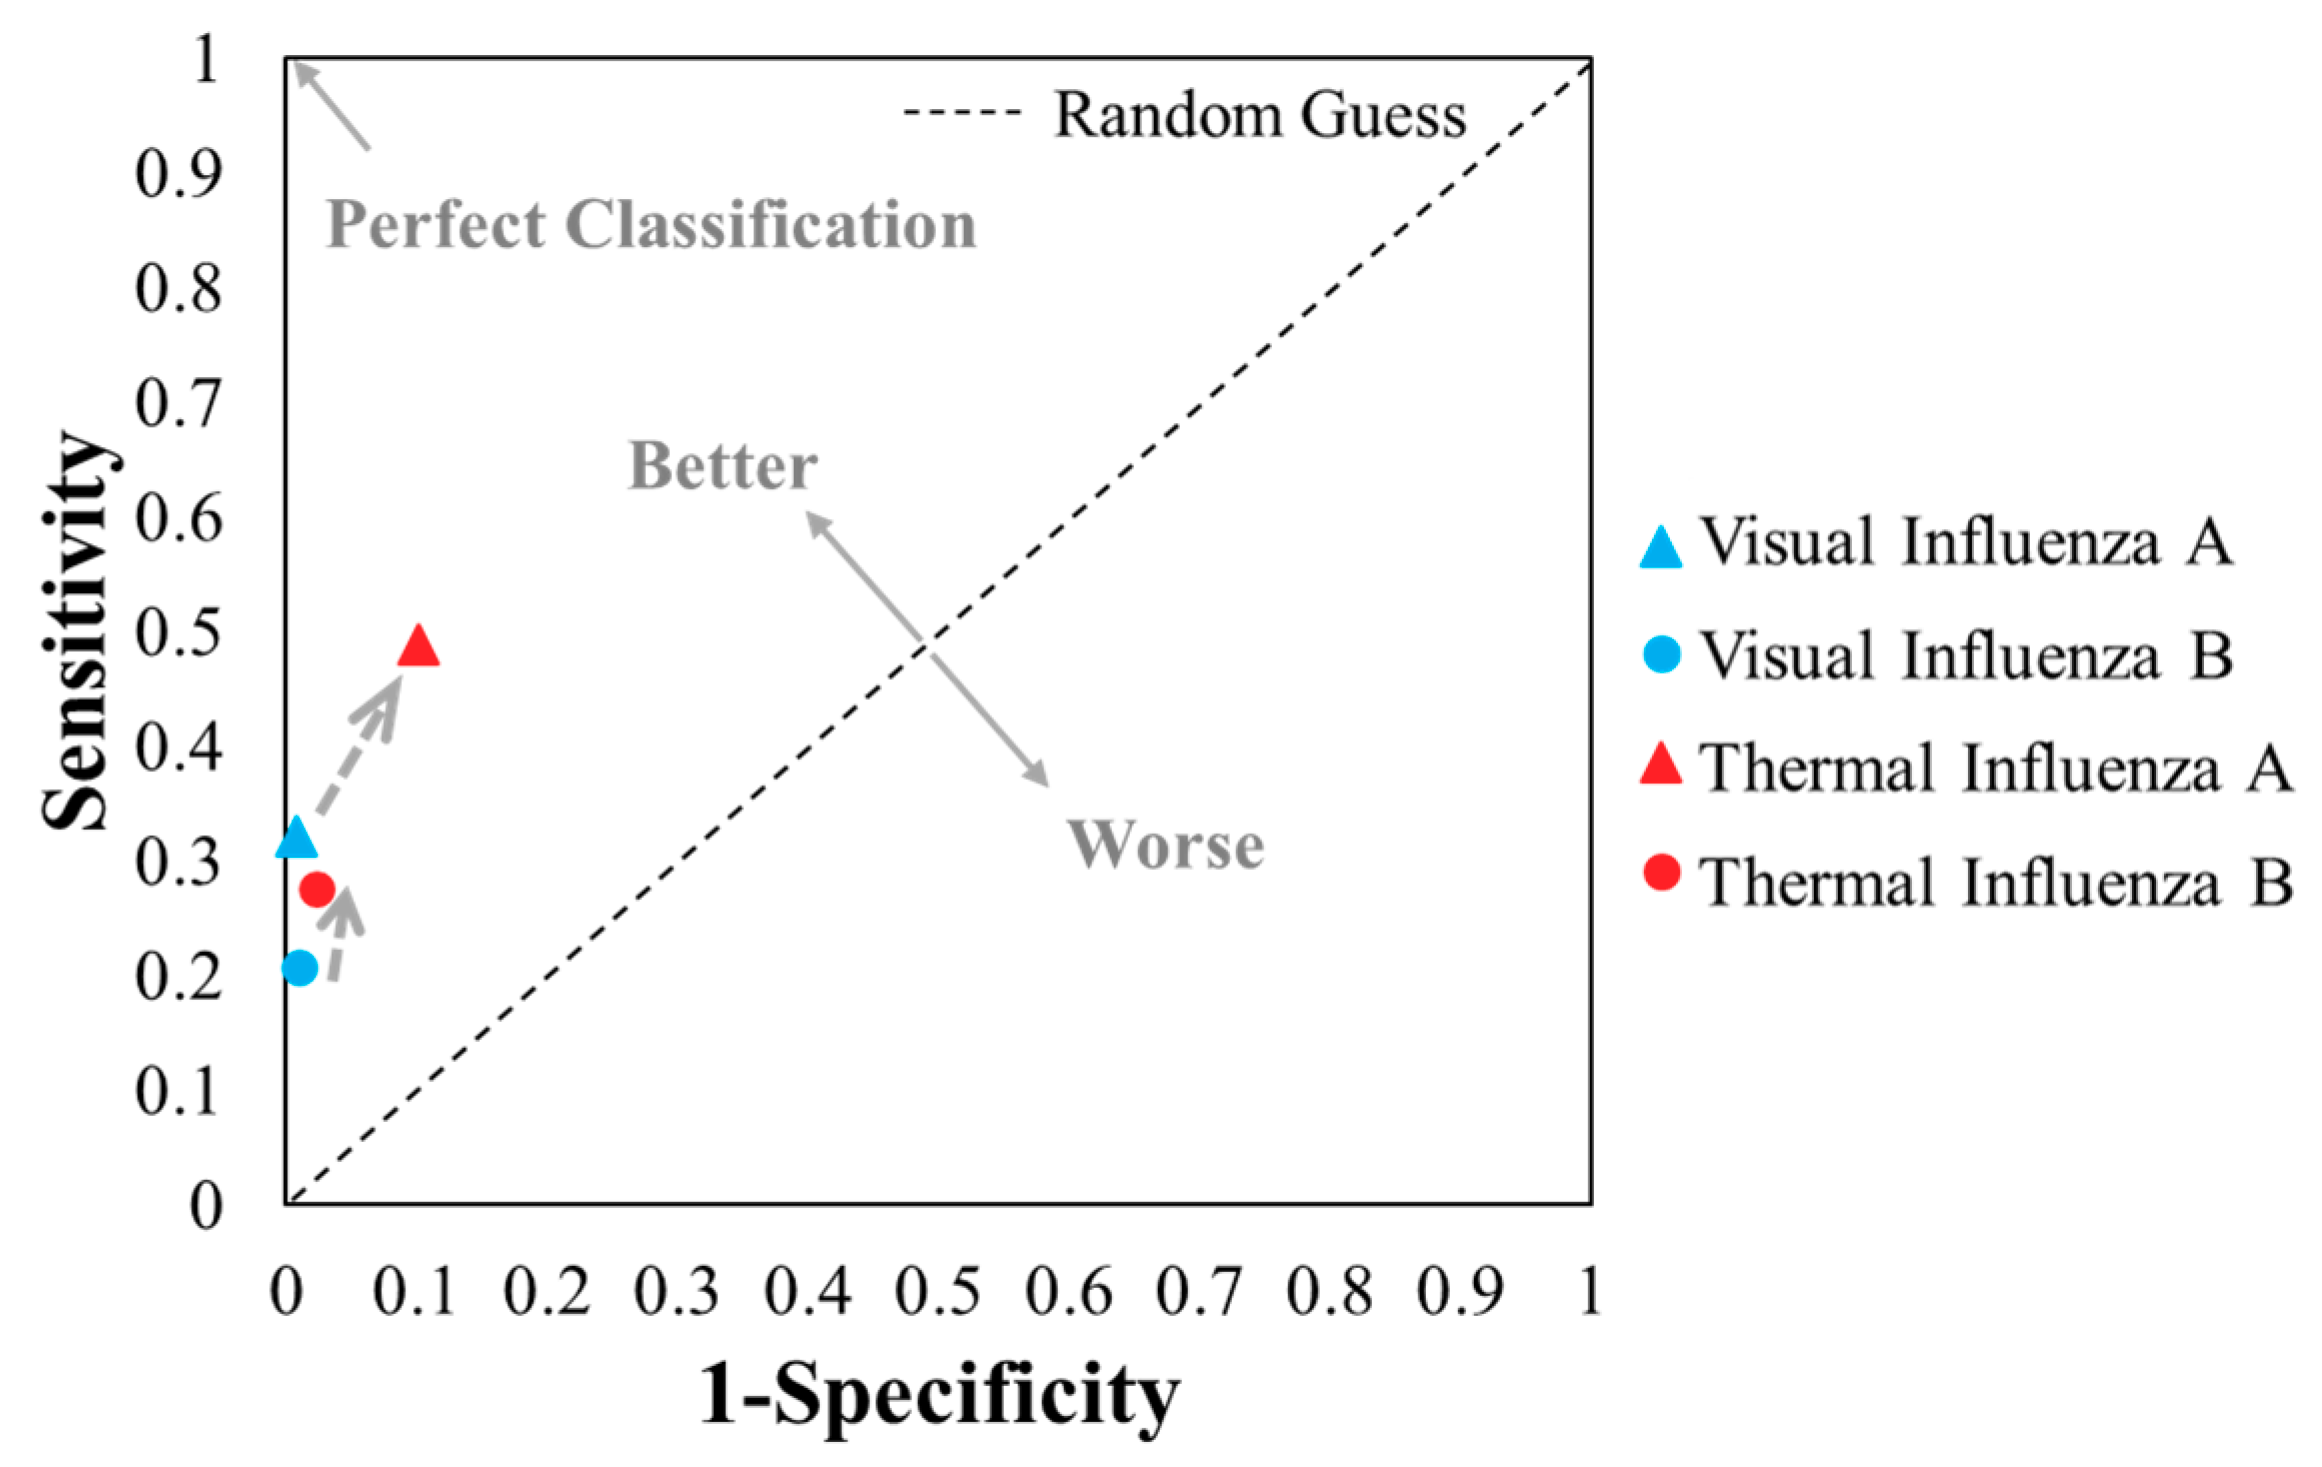
| Sensitivity; TPR | 0.32 | 0.49 | 0.21 | 0.28 | |||||
| Specificity | 0.99 | 0.90 | 0.99 | 0.98 | |||||
| FPR | 0.01 | 0.10 | 0.01 | 0.02 | |||||
| PPV | 0.94 | 0.63 | 0.67 | 0.53 | |||||
| ACC | 0.82 | 0.79 | 0.92 | 0.92 | |||||
| F1 score | 0.48 | 0.55 | 0.32 | 0.36 | |||||
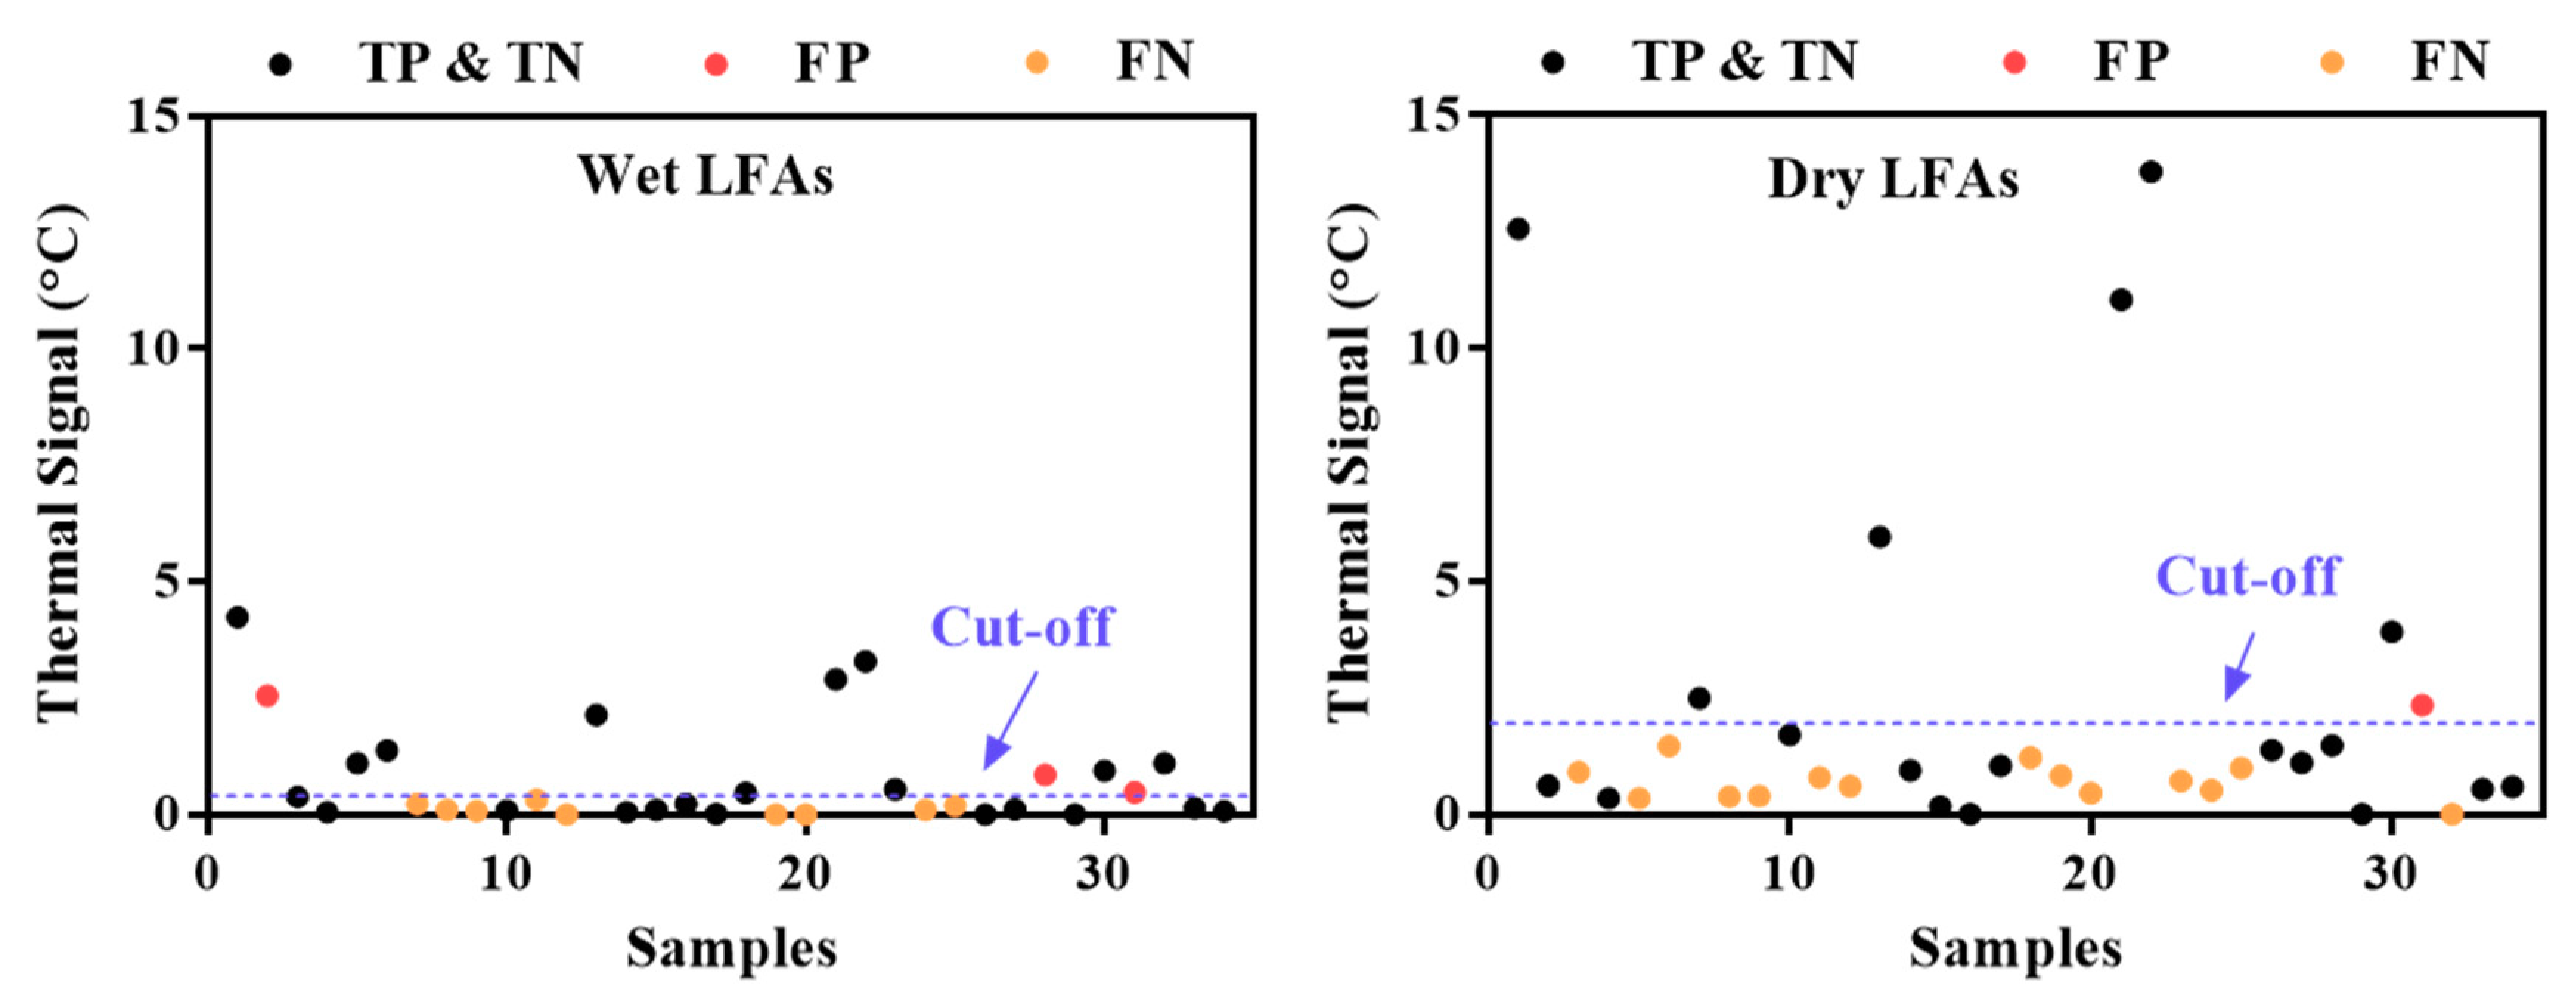
| (a) Wet LFAs | (b) Dry LFAs | ||||
|---|---|---|---|---|---|
| TP = 11 | FP = 3 | TP = 6 | FP = 1 | ||
| FN = 9 | TN = 11 | FN = 14 | TN = 13 | ||
| Sensitivity; TPR | 0.55 | 0.30 | |||
| FPR | 0.21 | 0.07 | |||
| PPV | 0.79 | 0.86 | |||
| ACC | 0.65 | 0.56 | |||
| F1 | 0.65 | 0.44 | |||
Publisher’s Note: MDPI stays neutral with regard to jurisdictional claims in published maps and institutional affiliations. |
© 2021 by the authors. Licensee MDPI, Basel, Switzerland. This article is an open access article distributed under the terms and conditions of the Creative Commons Attribution (CC BY) license (http://creativecommons.org/licenses/by/4.0/).
Share and Cite
Liu, Y.; Zhan, L.; Wang, Y.; Kangas, J.; Larkin, D.; Boulware, D.R.; Bischof, J.C. Improved Influenza Diagnostics through Thermal Contrast Amplification. Diagnostics 2021, 11, 462. https://doi.org/10.3390/diagnostics11030462
Liu Y, Zhan L, Wang Y, Kangas J, Larkin D, Boulware DR, Bischof JC. Improved Influenza Diagnostics through Thermal Contrast Amplification. Diagnostics. 2021; 11(3):462. https://doi.org/10.3390/diagnostics11030462
Chicago/Turabian StyleLiu, Yilin, Li Zhan, Yiru Wang, Joseph Kangas, Daniel Larkin, David R. Boulware, and John C. Bischof. 2021. "Improved Influenza Diagnostics through Thermal Contrast Amplification" Diagnostics 11, no. 3: 462. https://doi.org/10.3390/diagnostics11030462
APA StyleLiu, Y., Zhan, L., Wang, Y., Kangas, J., Larkin, D., Boulware, D. R., & Bischof, J. C. (2021). Improved Influenza Diagnostics through Thermal Contrast Amplification. Diagnostics, 11(3), 462. https://doi.org/10.3390/diagnostics11030462