
A Comprehensive Review of Computer-Aided Diagnosis of Major Mental and Neurological Disorders and Suicide: A Biostatistical Perspective on Data Mining


Abstract
1. Introduction
2. Materials and Methods
2.1. Gold Standard
2.1.1. Depression Disorder
2.1.2. Bipolar Disorder
2.1.3. Schizophrenia
2.1.4. Alzheimer’s
2.1.5. Dementia
2.1.6. Suicide
2.2. The Literature Review
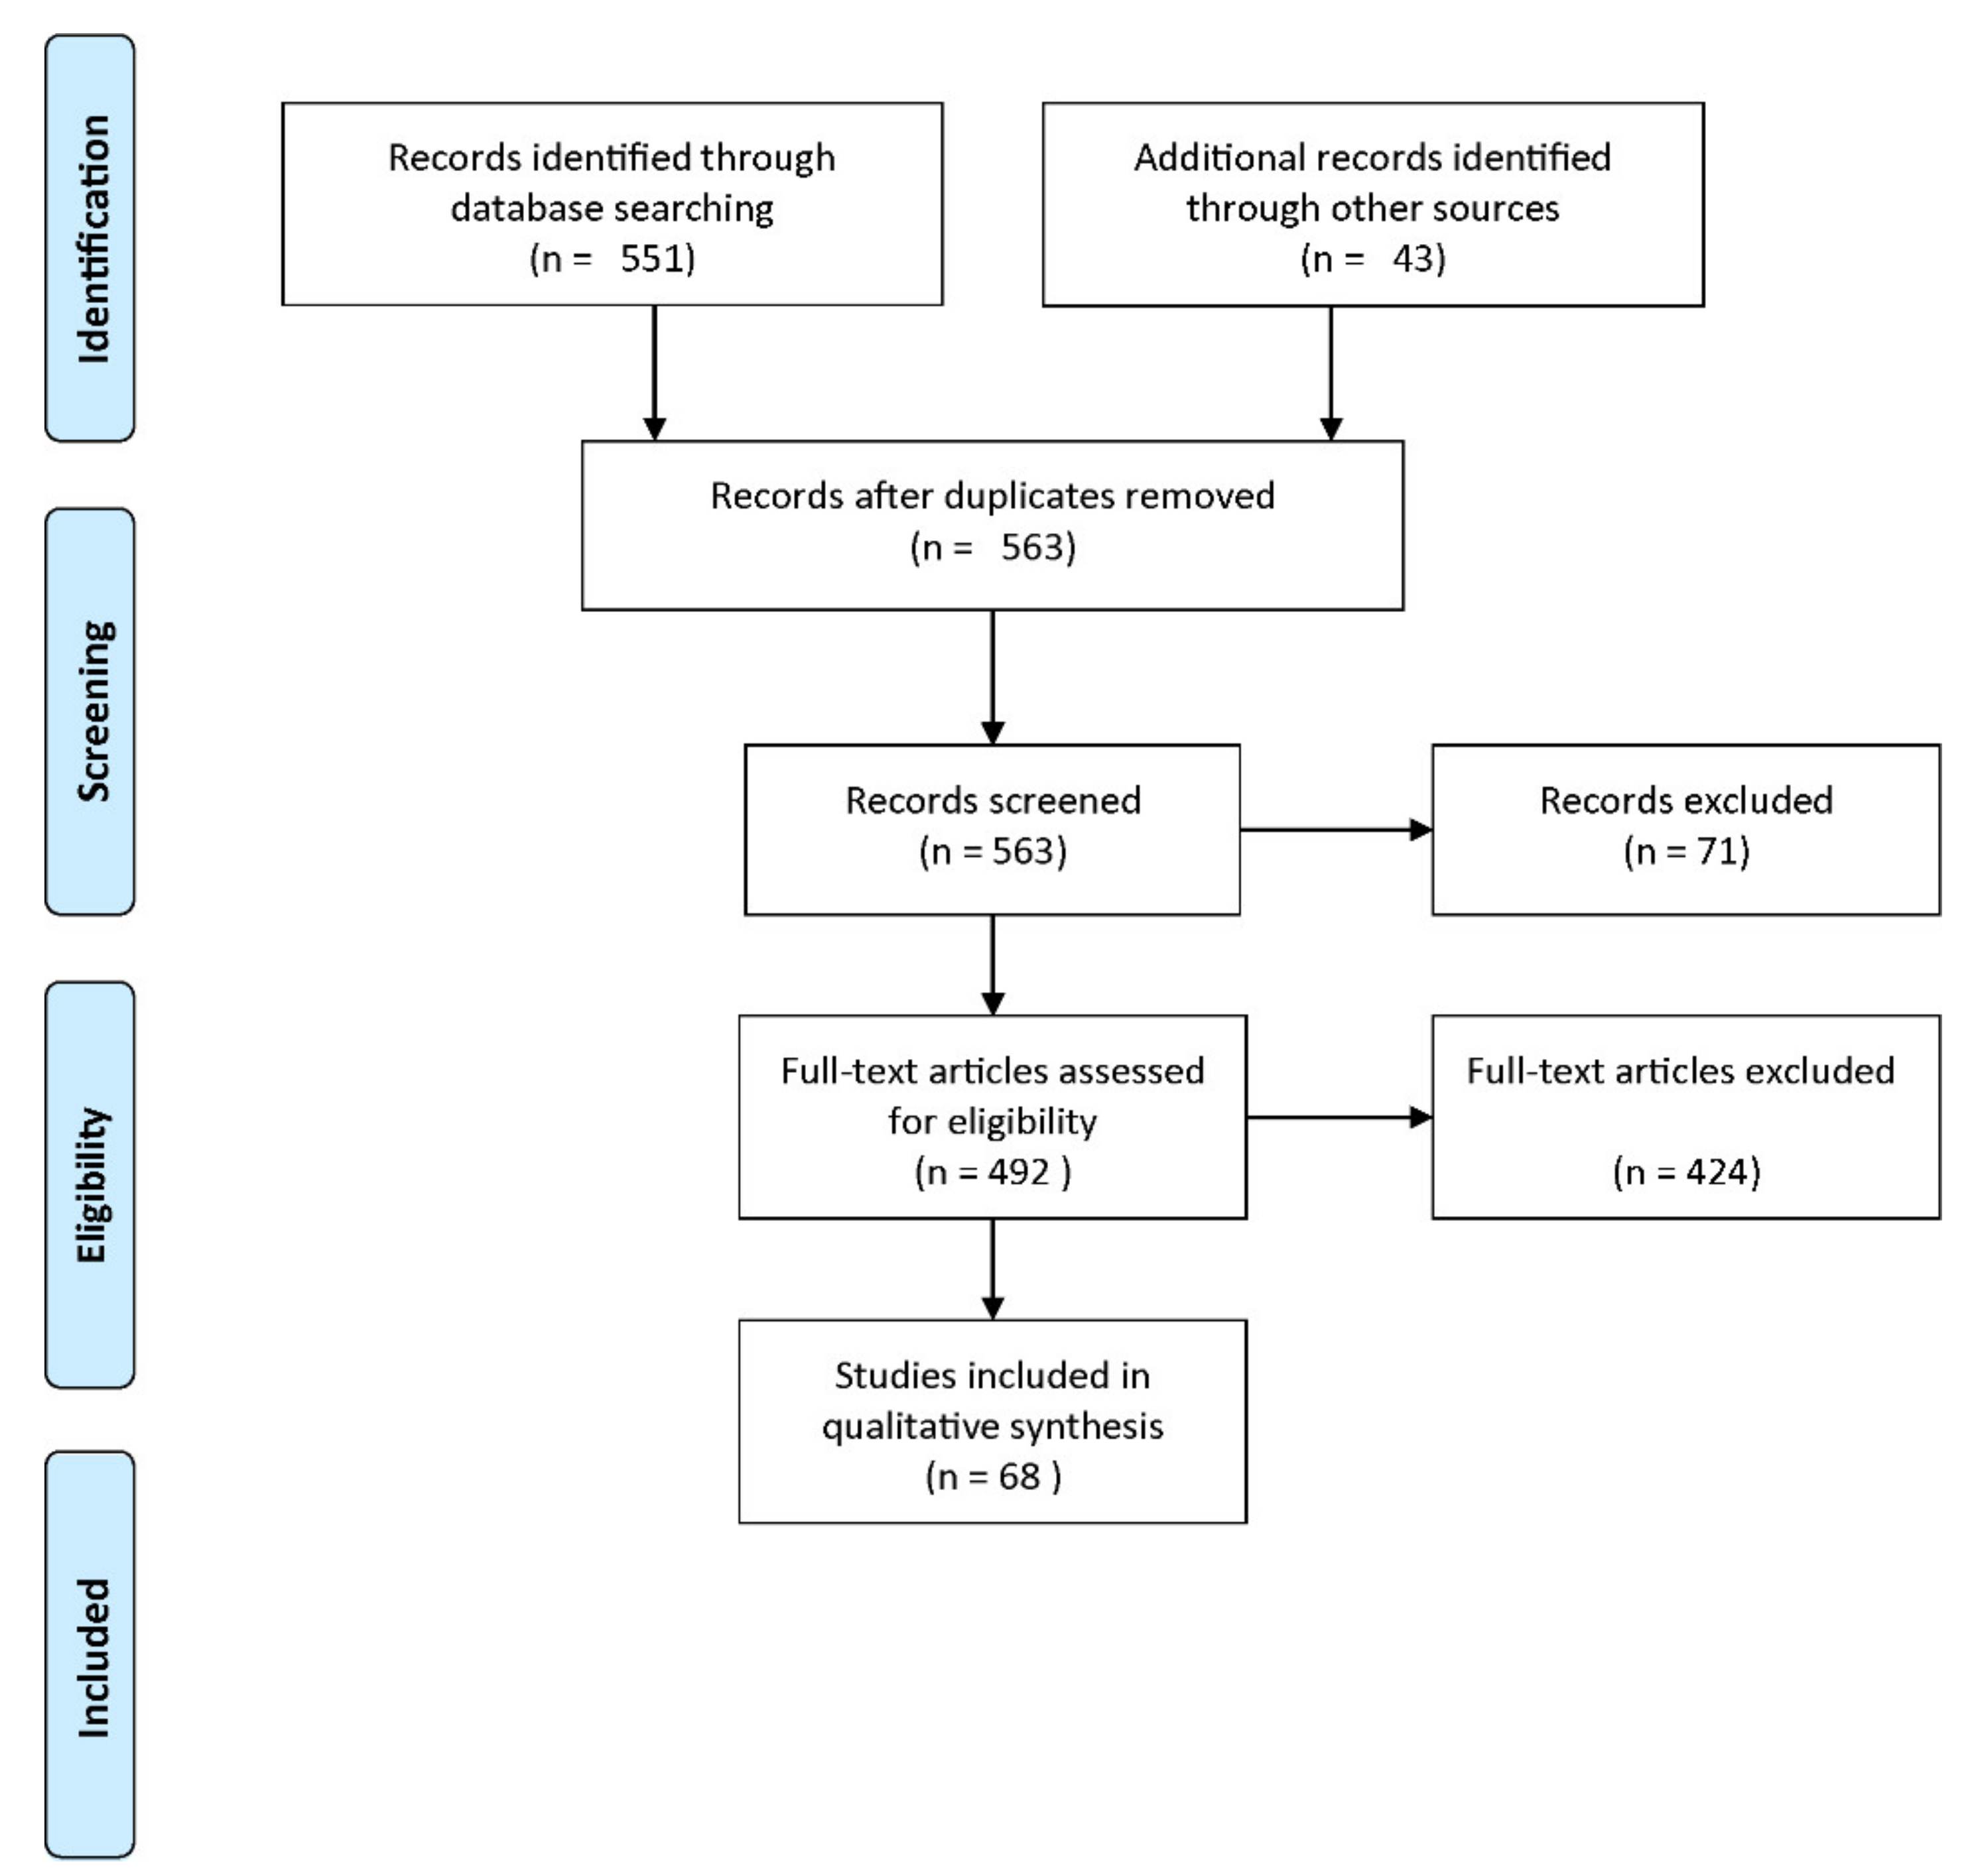
2.2.1. PRISMA Guideline
2.2.2. Search Strategy
2.2.3. Eligibility Criteria
2.2.4. Data Abstraction
3. Results
3.1. Validation Frameworks and Performance Indices
3.1.1. Validation Frameworks
3.1.2. Subject-Wise Cross-Validation
3.1.3. Critical Performance Indices
3.1.4. The 95% Confidence Interval
3.2. Input Features
3.3. Classification Methods
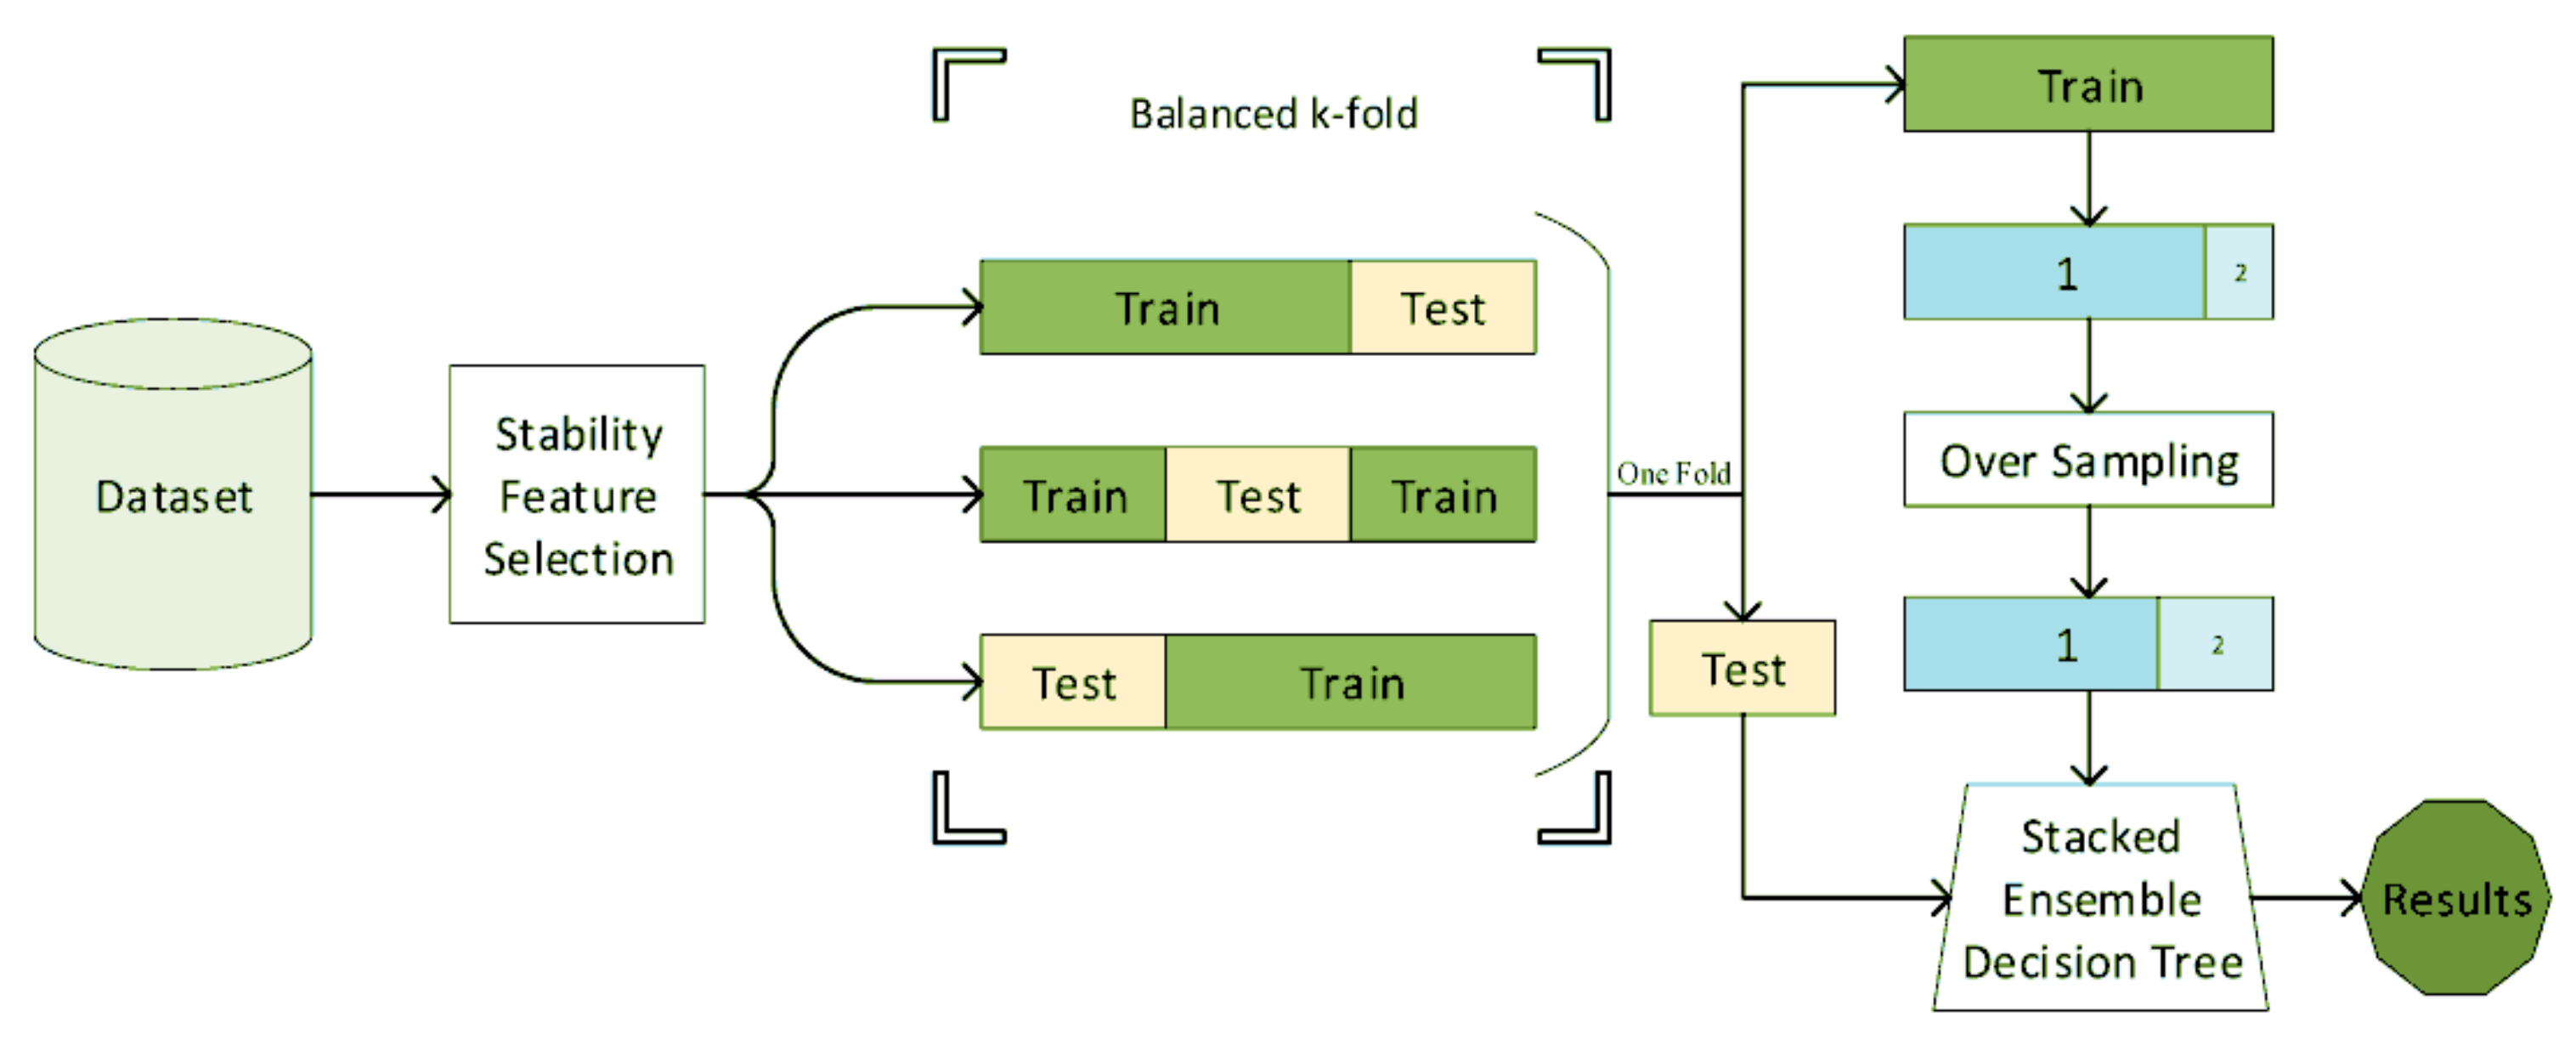
3.4. Balancing the Dataset and Generalization of the Results
3.5. EEG-Based Diagnosis
4. Discussion
5. Conclusions
- Proper performance indices must be provided in addition to their interpretation. This issue is especially critical when the database is imbalanced, and some indices could be biased [136].
- The CI 95% of the performance indices must be provided. It is especially critical for the AUC. If its CI 95% includes 0.5, the diagnostic method’s performance is not significantly better than a random generator.
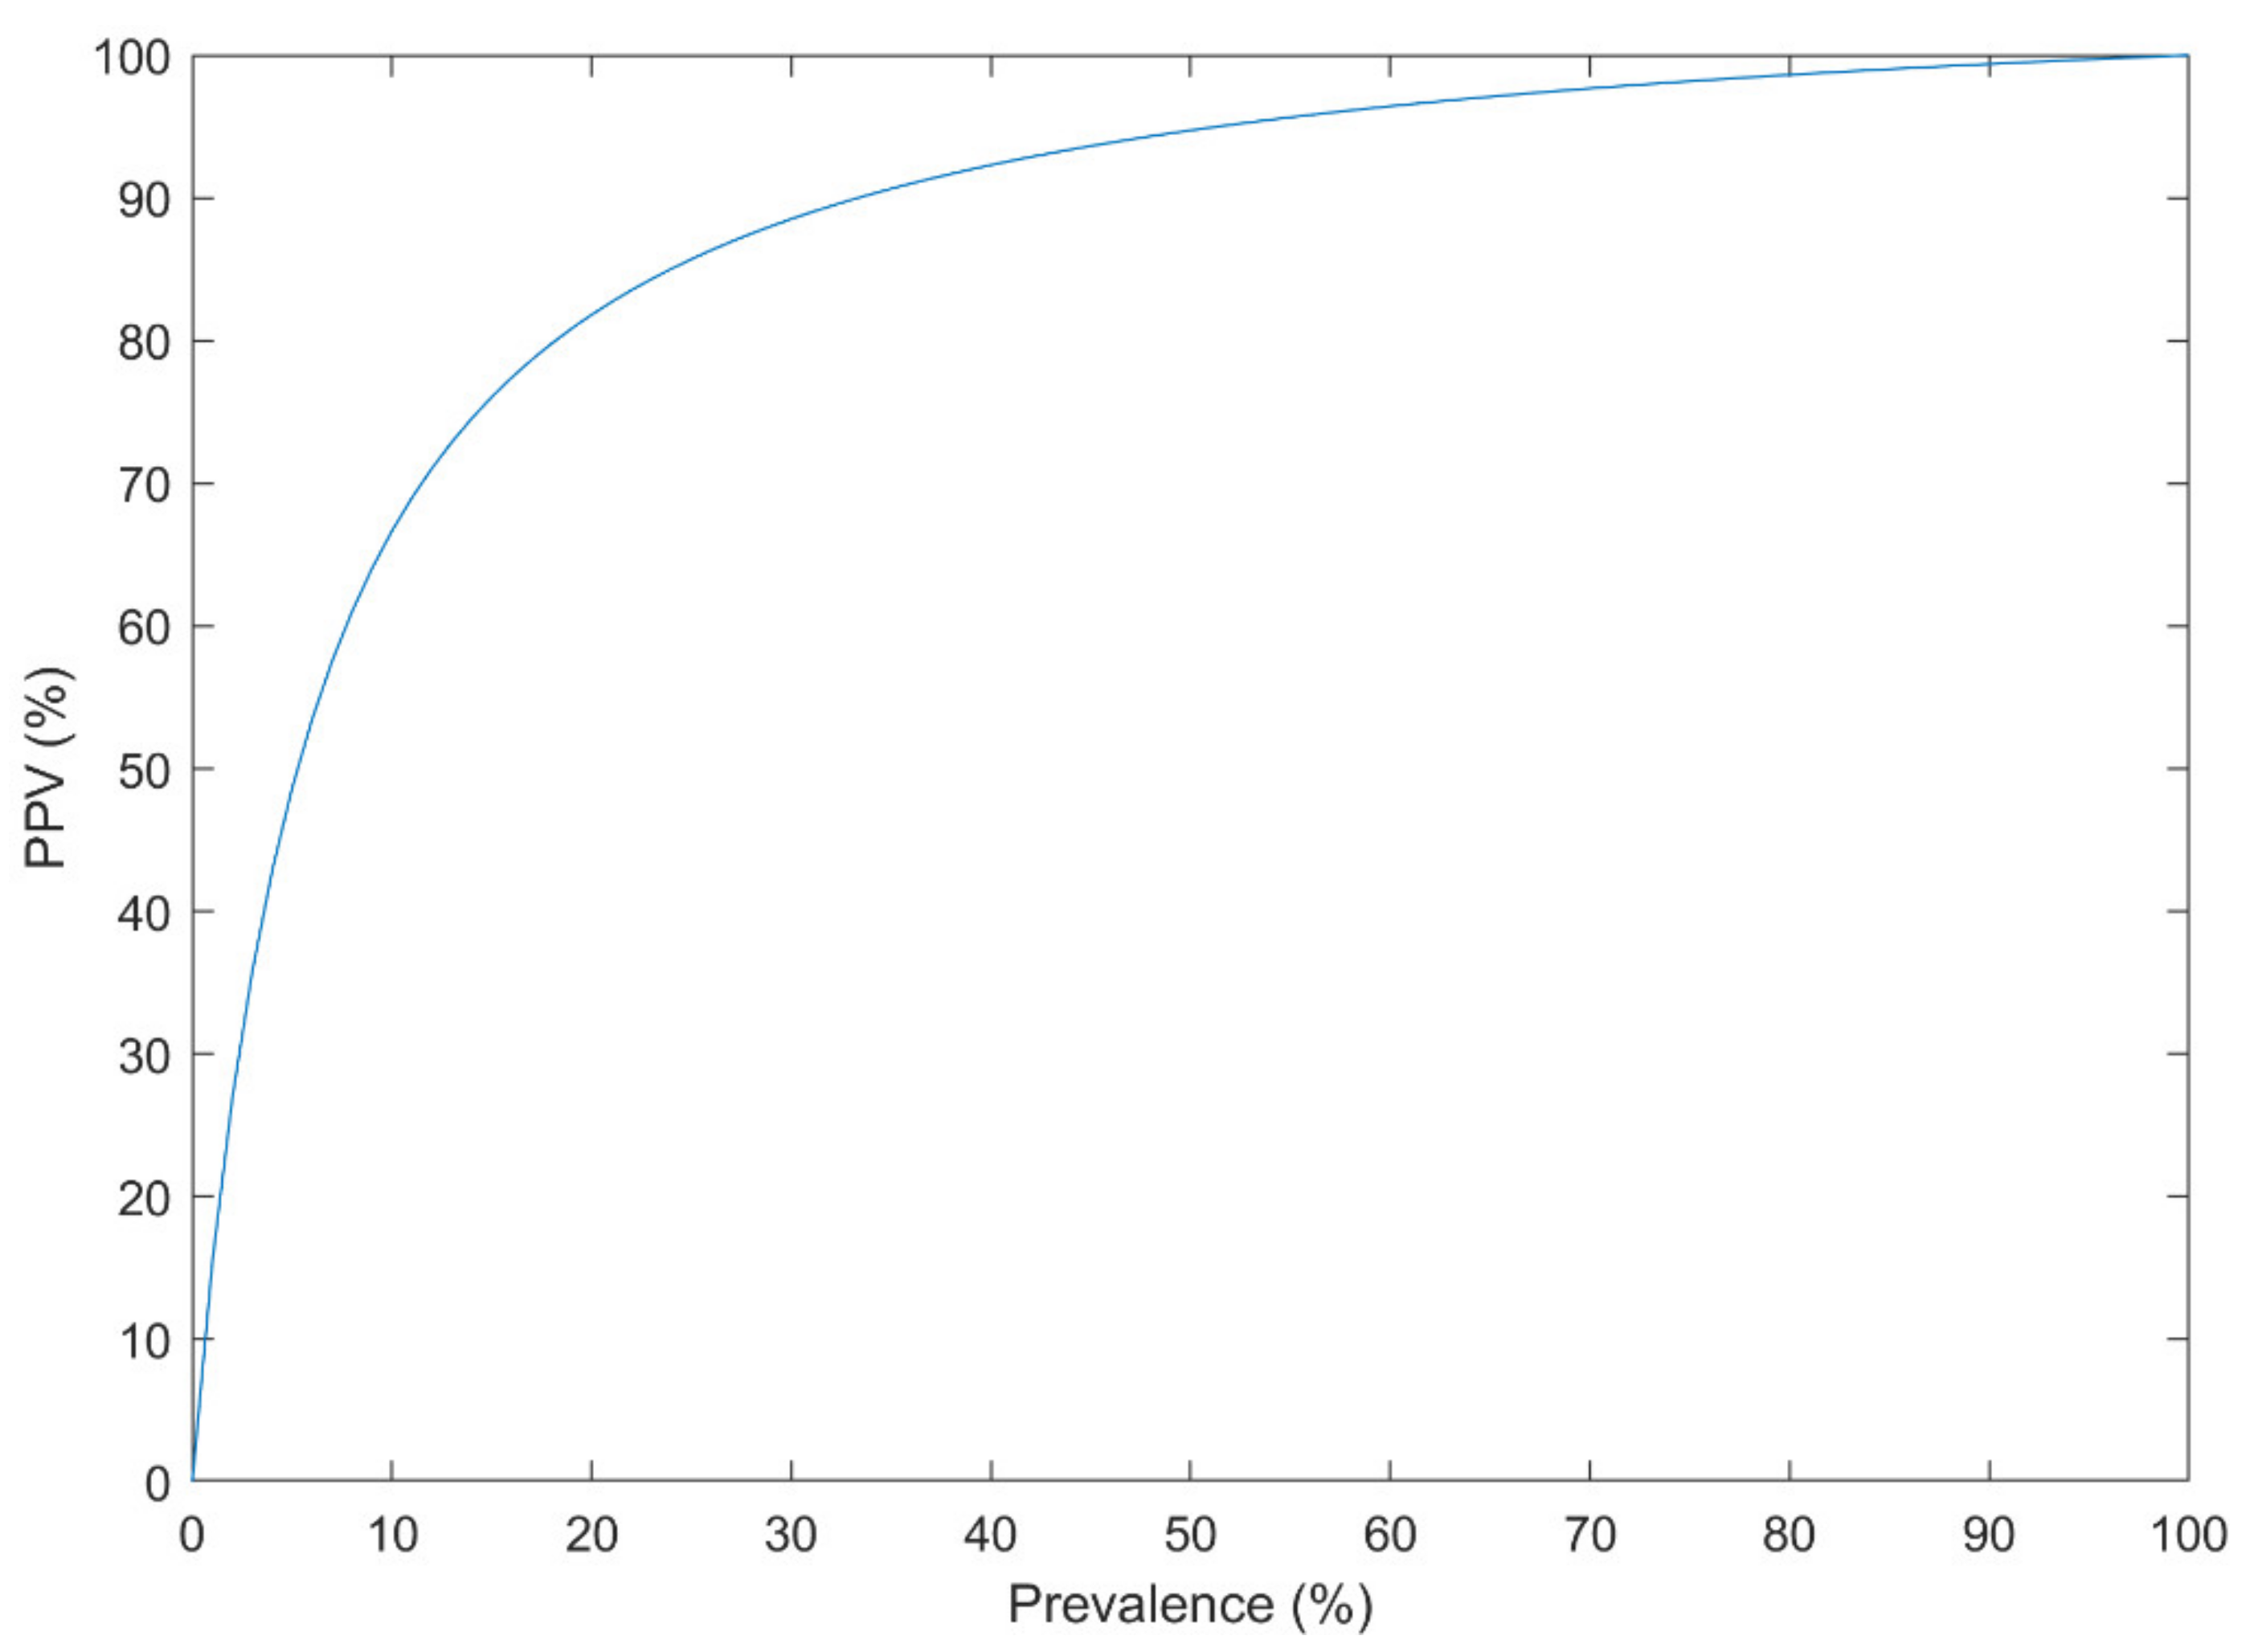
- The prevalence of the disorder in the analyzed dataset must resemble its actual prevalence in the population. Otherwise, the performance of the method in practice, a.k.a. PPV, is highly deteriorated.
- A proper validation framework must be used to avoid Type III error. External validation is the best method to improve the generalization of the designed CAD.
- The clinical interpretation of the input features, their ranking, and the classifier structure must be provided for clinicians.
Author Contributions
Funding
Conflicts of Interest
References
- Herrman, H.; Jané-Llopis, E. The status of mental health promotion. Public Health Rev. 2012, 34. [Google Scholar] [CrossRef]
- Cook, L. Mental Health in Australia: A Quick Guide; Parliament of Australia: Canberra, ACT, Australia, 2019. [Google Scholar]
- Statewide Peer Network Development Program for Recovery and Resiliency Grants; Department of Health and Human Services Substance Abuse and Mental Health Services Administration: Fishers Lane Rockville, MD, USA, 2005.
- Kessler, T.; Lev-Ran, S. The association between comorbid psychiatric diagnoses and hospitalization-related factors among individuals with schizophrenia. Compr. Psychiatry 2019, 89, 7–15. [Google Scholar] [CrossRef] [PubMed]
- Whiteford, H.A.; Ferrari, A.J.; Degenhardt, L.; Feigin, V.; Vos, T. The global burden of mental, neurological and substance use disorders: An analysis from the Global Burden of Disease Study 2010. PLoS ONE 2015, 10, e0116820. [Google Scholar] [CrossRef]
- Institute for Health Metrics and Evaluation (IHME). GBD Compare Data Visualization; IHME, University of Washington: Seattle, WA, USA, 2019; Available online: http://vizhub.healthdata.org/gbd-compare (accessed on 20 February 2021).
- Jha, S. The Mental Healthcare Act, 2017: A Ray of Hope. 2020. Available online: https://papers.ssrn.com/sol3/papers.cfm?abstract_id=3564919 (accessed on 20 February 2021).
- Wittchen, H.U.; Jacobi, F.; Rehm, J.; Gustavsson, A.; Svensson, M.; Jönsson, B.; Olesen, J.; Allgulander, C.; Alonso, J.; Faravelli, C.; et al. The size and burden of mental disorders and other disorders of the brain in Europe 2010. Eur. Neuropsychopharmacol. 2011, 21, 655–679. [Google Scholar] [CrossRef]
- Reddy, V. Mental health issues and challenges in India: A review. J. Soc. Sci. Manag. Entrep. (IJSSME) 2019, 3, 1–3. [Google Scholar]
- Ogunsemi, O.O.; Oluwole, F.A.; Abasiubong, F.; Erinfolami, A.R.; Amoran, O.E.; Ariba, A.J.; Alebiosu, C.O.; Olatawura, M.O. Detection of mental disorders with the Patient Health Questionnaire in primary care settings in Nigeria. Ment. Illn. 2010, 2, e10. [Google Scholar] [CrossRef] [PubMed]
- White, P.D.; Rickards, H.; Zeman, A.Z.J. Time to end the distinction between mental and neurological illnesses. BMJ 2012, 344, e3454. [Google Scholar] [CrossRef]
- Feigin, V.L.; Abajobir, A.A.; Abate, K.H.; Abd-Allah, F.; Abdulle, A.M.; Abera, S.F.; Abyu, G.Y.; Ahmed, M.B.; Aichour, A.N.; Aichour, I.; et al. Global, regional, and national burden of neurological disorders during 1990–2015: A systematic analysis for the Global Burden of Disease Study 2015. Lancet Neurol. 2017, 16, 877–897. [Google Scholar] [CrossRef]
- Ho, A.J.; Hua, X.; Lee, S.; Leow, A.D.; Yanovsky, I.; Gutman, B.; Dinov, I.D.; Leporé, N.; Stein, J.L.; Toga, A.W.; et al. Comparing 3 T and 1.5 T MRI for tracking Alzheimer’s disease progression with tensor-based morphometry. Hum. Brain Mapp. 2010, 31, 499–514. [Google Scholar] [CrossRef]
- Aggarwal, N.T.; Tripathi, M.; Dodge, H.H.; Alladi, S.; Anstey, K.J. Trends in Alzheimer’s disease and dementia in the asian-pacific region. Int. J. Alzheimers. Dis. 2012, 2012, 171327. [Google Scholar] [CrossRef] [PubMed]
- DeTure, M.A.; Dickson, D.W. The neuropathological diagnosis of Alzheimer’s disease. Mol. Neurodegener. 2019, 14, 32. [Google Scholar] [CrossRef]
- Saxena, S.; Setoya, Y. World health organization’s comprehensive mental health action plan 2013–2020. Psychiatry Clin. NeuroSci. 2014, 68, 585–586. [Google Scholar] [CrossRef]
- WHO Organization. Others Public Health Action for the Prevention of Suicide: A Framework; WHO: Geneva, Switzerland, 2012. [Google Scholar]
- Bilsen, J. Suicide and Youth: Risk Factors. Front. Psychiatry 2018, 9, 540. [Google Scholar] [CrossRef]
- Turecki, G.; Brent, D.A. Suicide and suicidal behaviour. Lancet 2016, 387, 1227–1239. [Google Scholar] [CrossRef]
- Naghavi, M. Global Burden of Disease Self-Harm Collaborators Global, regional, and national burden of suicide mortality 1990 to 2016: Systematic analysis for the Global Burden of Disease Study 2016. BMJ 2019, 364, l94. [Google Scholar] [CrossRef]
- Jamison, D.T.; Breman, J.G.; Measham, A.R.; Alleyne, G.; Claeson, M.; Evans, D.B.; Jha, P.; Mills, A.; Musgrove, P. Disease Control Priorities in Developing Countries; The World Bank: Washington, DC, USA, 2006. [Google Scholar]
- WHO. Mental and Neurological Disorders; WHO: Geneva, Switzerland, 2005. [Google Scholar]
- Kohn, R.; Saxena, S.; Levav, I.; Saraceno, B. The treatment gap in mental health care. Bull. World Health Organ. 2004, 82, 858–866. [Google Scholar]
- Iemmi, V.; Bantjes, J.; Coast, E.; Channer, K.; Leone, T.; McDaid, D.; Palfreyman, A.; Stephens, B.; Lund, C. Suicide and poverty in low-income and middle-income countries: A systematic review. Lancet Psychiatry 2016, 3, 774–783. [Google Scholar] [CrossRef]
- Franco-Martín, M.A.; Muñoz-Sánchez, J.L.; Sainz-de-Abajo, B.; Castillo-Sánchez, G.; Hamrioui, S.; de la Torre-Díez, I. A systematic literature review of technologies for suicidal behavior prevention. J. Med. Syst. 2018, 42, 71. [Google Scholar] [CrossRef]
- Castillo-Sánchez, G.; Marques, G.; Dorronzoro, E.; Rivera-Romero, O.; Franco-Martín, M.; De la Torre-Díez, I. Suicide risk assessment using machine learning and social networks: A scoping review. J. Med. Syst. 2020, 44, 205. [Google Scholar] [CrossRef]
- Winkler, A.S. The growing burden of neurological disorders in low-income and middle-income countries: Priorities for policy making. Lancet Neurol. 2020, 19, 200–202. [Google Scholar] [CrossRef]
- Druss, B.G.; Hwang, I.; Petukhova, M.; Sampson, N.A.; Wang, P.S.; Kessler, R.C. Impairment in role functioning in mental and chronic medical disorders in the United States: Results from the National Comorbidity Survey Replication. Mol. Psychiatry 2009, 14, 728–737. [Google Scholar] [CrossRef]
- Saarni, S.I.; Suvisaari, J.; Sintonen, H.; Pirkola, S.; Koskinen, S.; Aromaa, A.; Lönnqvist, J. Impact of psychiatric disorders on health-related quality of life: General population survey. Br. J. Psychiatry 2007, 190, 326–332. [Google Scholar] [CrossRef] [PubMed]
- Moncrieff, J.; Pomerleau, J. Trends in sickness benefits in Great Britain and the contribution of mental disorders. J. Public Health Med. 2000, 22, 59–67. [Google Scholar] [CrossRef]
- Mykletun, A.; Overland, S.; Dahl, A.A.; Krokstad, S.; Bjerkeset, O.; Glozier, N.; Aarø, L.E.; Prince, M. A population-based cohort study of the effect of common mental disorders on disability pension awards. Am. J. Psychiatry 2006, 163, 1412–1418. [Google Scholar] [CrossRef] [PubMed]
- El-Rufaie, O.E. Primary care psychiatry: Pertinent Arabian perspectives. East. Mediterr. Health J. 2005, 11, 449–458. [Google Scholar] [PubMed]
- Russ, T.C.; Stamatakis, E.; Hamer, M.; Starr, J.M.; Kivimäki, M.; Batty, G.D. Association between psychological distress and mortality: Individual participant pooled analysis of 10 prospective cohort studies. BMJ 2012, 345, e4933. [Google Scholar] [CrossRef] [PubMed]
- Bridge, J.A.; Goldstein, T.R.; Brent, D.A. Adolescent suicide and suicidal behavior. J. Child Psychol. Psychiatry 2006, 47, 372–394. [Google Scholar] [CrossRef]
- Gould, M.S. Suicide and the media. Ann. N. Y. Acad. Sci. 2001, 932, 200–224. [Google Scholar] [CrossRef]
- Palmer, B.A.; Pankratz, V.S.; Bostwick, J.M. The lifetime risk of suicide in schizophrenia: A reexamination. Arch. Gen. Psychiatry 2005, 62, 247–253. [Google Scholar] [CrossRef] [PubMed]
- De Cola, M.C.; Triglia, G.; Camera, M.; Corallo, F.; Di Cara, M.; Bramanti, P.; Lo Buono, V. Effect of neurological screening on early dementia detection in southern Italy. J. Int. Med. Res. 2020, 48. [Google Scholar] [CrossRef]
- Brammer, M. The role of neuroimaging in diagnosis and personalized medicine—Current position and likely future directions. Dialogues Clin. Neurosci. 2009, 11, 389–396. [Google Scholar] [PubMed]
- Faraz, S.; Azhar Ali, S.S.; Hasan Adil, S. Machine learning and stress assessment: A review. In Proceedings of the 2018 3rd International Conference on Emerging Trends in Engineering, Sciences and Technology (ICEEST), Karachi, Pakistan, 21–22 December 2018. [Google Scholar]
- Just, M.A.; Pan, L.; Cherkassky, V.L.; McMakin, D.L.; Cha, C.; Nock, M.K.; Brent, D. Machine learning of neural representations of suicide and emotion concepts identifies suicidal youth. Nat. Hum. Behav. 2017, 1, 911–919. [Google Scholar] [CrossRef]
- Agne, N.A.; Tisott, C.G.; Ballester, P.; Passos, I.C.; Ferrão, Y.A. Predictors of suicide attempt in patients with obsessive-compulsive disorder: An exploratory study with machine learning analysis. Psychol. Med. 2020, 1–11. [Google Scholar] [CrossRef]
- Naghavi, A.; Teismann, T.; Asgari, Z.; Mohebbian, M.R.; Mansourian, M.; Mañanas, M.Á. Accurate Diagnosis of Suicide Ideation/Behavior Using Robust Ensemble Machine Learning: A University Student Population in the Middle East and North Africa (MENA) Region. Diagnostics 2020, 10, 956. [Google Scholar] [CrossRef]
- Siuly, S.; Zhang, Y. Medical Big Data: Neurological Diseases Diagnosis Through Medical Data Analysis. Data Sci. Eng. 2016, 1, 54–64. [Google Scholar] [CrossRef]
- Arimura, H.; Magome, T.; Yamashita, Y.; Yamamoto, D. Computer-Aided Diagnosis Systems for Brain Diseases in Magnetic Resonance Images. Algorithms 2009, 2, 925–952. [Google Scholar] [CrossRef]
- Structured Clinical Interview for the DSM (SCID). In The Encyclopedia of Clinical Psychology; Cautin, R.L., Lilienfeld, S.O., Eds.; John Wiley & Sons, Inc.: Hoboken, NJ, USA, 2014; Volume 26, pp. 1–6. ISBN 9781118625392. [Google Scholar]
- Li, F.; He, H. Assessing the Accuracy of Diagnostic Tests. Shanghai Arch. Psychiatry 2018, 30, 207–212. [Google Scholar] [CrossRef]
- Malhi, G.S. The right services, at the right time, for the right people. Lancet Psychiatry 2019, 6, 800–802. [Google Scholar] [CrossRef]
- Kelly, T. Prospective: Is bipolar disorder being overdiagnosed? Int. J. Methods Psychiatr. Res. 2018, 27, e1725. [Google Scholar] [CrossRef]
- Lawrie, S.M.; Olabi, B.; Hall, J.; McIntosh, A.M. Do we have any solid evidence of clinical utility about the pathophysiology of schizophrenia? World Psychiatry 2011, 10, 19–31. [Google Scholar] [CrossRef]
- Kapur, S. Looking for a “biological test” to diagnose “schizophrenia”: Are we chasing red herrings? World Psychiatry 2011, 10, 32. [Google Scholar] [CrossRef]
- Lantero Rodriguez, J.; Karikari, T.K.; Suárez-Calvet, M.; Troakes, C.; King, A.; Emersic, A.; Aarsland, D.; Hye, A.; Zetterberg, H.; Blennow, K.; et al. Plasma p-tau181 accurately predicts Alzheimer’s disease pathology at least 8 years prior to post-mortem and improves the clinical characterisation of cognitive decline. Acta Neuropathologica 2020, 140, 267–278. [Google Scholar] [CrossRef]
- Miller, J.B.; Kauwe, J.S.K. Predicting Clinical Dementia Rating Using Blood RNA Levels. Genes 2020, 11, 706. [Google Scholar] [CrossRef]
- Douglas, V.C.; Neuhaus, J.; Johnson, J.K.; Racine, C.A.; Miller, B.L.; Josephson, S.A. Dementia=(MC)2: A 4-item screening test for mild cognitive impairment and dementia. Alzheimer Dis. Assoc. Disord. 2011, 25, 220–224. [Google Scholar] [CrossRef]
- Nguyen, V.T.; Quach, T.H.T.; Pham, A.G.; Tran, T.C. Feasibility, Reliability, and Validity of the Vietnamese Version of the Clinical Dementia Rating. Dement. Geriatr. Cogn. Disord. 2019, 48, 308–316. [Google Scholar] [CrossRef] [PubMed]
- Batterham, P.J.; Ftanou, M.; Pirkis, J.; Brewer, J.L.; Mackinnon, A.J.; Beautrais, A.; Fairweather-Schmidt, A.K.; Christensen, H. A systematic review and evaluation of measures for suicidal ideation and behaviors in population-based research. Psychol. Assess. 2015, 27, 501–512. [Google Scholar] [CrossRef]
- Osman, A.; Bagge, C.L.; Gutierrez, P.M.; Konick, L.C.; Kopper, B.A.; Barrios, F.X. The Suicidal Behaviors Questionnaire-Revised (SBQ-R): Validation with clinical and nonclinical samples. Assessment 2001, 8, 443–454. [Google Scholar] [CrossRef] [PubMed]
- Kobak, K.; Townsend, L.; Birmaher, B.; Milham, M.; Kaufman, J. Computer-Assisted Psychiatric Diagnosis. J. Am. Acad. Child Adolesc. Psychiatry 2020, 59, 213–215. [Google Scholar] [CrossRef]
- Fakhoury, M. Artificial Intelligence in Psychiatry. Adv. Exp. Med. Biol. 2019, 1192, 119–125. [Google Scholar] [CrossRef] [PubMed]
- Gülpınar, Ö.; Güçlü, A.G. How to write a review article? Turk. J. Urol. 2013, 39, 44–48. [Google Scholar] [CrossRef] [PubMed]
- Moher, D.; Liberati, A.; Tetzlaff, J.; Altman, D.G. PRISMA Group Preferred reporting items for systematic reviews and meta-analyses: The PRISMA statement. PLoS Med. 2009, 6, e1000097. [Google Scholar] [CrossRef]
- 10 Guidelines for Review Papers. Available online: https://journals.sagepub.com/page/mcr/suppl/review-paper-tips (accessed on 7 February 2021).
- Lee, S.-Y.; Lu, R.-B.; Wang, L.-J.; Chang, C.-H.; Lu, T.; Wang, T.-Y.; Tsai, K.-W. Serum miRNA as a possible biomarker in the diagnosis of bipolar II disorder. Sci. Rep. 2020, 10, 1131. [Google Scholar] [CrossRef]
- Alici, S.; Onur, Ö.Ş.; Çavuôlu, E.; Onur, I.U.; Erkiran, M. Optical coherence tomography findings in bipolar disorder: a preliminary receiver operating characteristic analysis on ganglion cell layer volume for diagnosis. Archives Clin. Psychiatry 2019, 46, 125–131. [Google Scholar]
- Zhao, G.; Zhang, C.; Chen, J.; Su, Y.; Zhou, R.; Wang, F.; Xia, W.; Huang, J.; Wang, Z.; Hu, Y.; et al. Ratio of mBDNF to proBDNF for Differential Diagnosis of Major Depressive Disorder and Bipolar Depression. Mol. Neurobiol. 2016, 54, 5573–5582. [Google Scholar] [CrossRef] [PubMed]
- Haenisch, F.; Cooper, J.D.; Reif, A.; Kittel-Schneider, S.; Steiner, J.; Leweke, F.M.; Rothermundt, M.; van Beveren, N.J.M.; Crespo-Facorro, B.; Niebuhr, D.W.; et al. Towards a blood-based diagnostic panel for bipolar disorder. Brain Behav. Immun. 2016, 52, 49–57. [Google Scholar] [CrossRef]
- Fernandes, B.S.; Karmakar, C.; Tamouza, R.; Tran, T.; Yearwood, J.; Hamdani, N.; Laouamri, H.; Richard, J.-R.; Yolken, R.; Berk, M.; et al. Precision psychiatry with immunological and cognitive biomarkers: a multi-domain prediction for the diagnosis of bipolar disorder or schizophrenia using machine learning. Transl. Psychiatry 2020, 10, 162. [Google Scholar] [CrossRef] [PubMed]
- Tsujii, N.; Otsuka, I.; Okazaki, S.; Yanagi, M.; Numata, S.; Yamaki, N.; Kawakubo, Y.; Shirakawa, O.; Hishimoto, A. Mitochondrial DNA Copy Number Raises the Potential of Left Frontopolar Hemodynamic Response as a Diagnostic Marker for Distinguishing Bipolar Disorder From Major Depressive Disorder. Front. Psychiatry 2019, 10, 312. [Google Scholar] [CrossRef] [PubMed]
- Faurholt-Jepsen, M.; Busk, J.; Þórarinsdóttir, H.; Frost, M.; Bardram, J.E.; Vinberg, M.; Kessing, L.V. Objective smartphone data as a potential diagnostic marker of bipolar disorder. Aust. N. Z. J. Psychiatry 2019, 53, 119–128. [Google Scholar] [CrossRef]
- Tasic, L.; Larcerda, A.L.T.; Pontes, J.G.M.; da Costa, T.B.B.C.; Nani, J.V.; Martins, L.G.; Santos, L.A.; Nunes, M.F.Q.; Adelino, M.P.M.; Pedrini, M.; et al. Peripheral biomarkers allow differential diagnosis between schizophrenia and bipolar disorder. J. Psychiatr. Res. 2019, 119, 67–75. [Google Scholar] [CrossRef] [PubMed]
- Munkholm, K.; Vinberg, M.; Pedersen, B.K.; Poulsen, H.E.; Ekstrøm, C.T.; Kessing, L.V. A multisystem composite biomarker as a preliminary diagnostic test in bipolar disorder. Acta Psychiatr. Scand. 2019, 139, 227–236. [Google Scholar] [CrossRef]
- Alimardani, F.; Cho, J.-H.; Boostani, R.; Hwang, H.-J. Classification of bipolar disorder and schizophrenia using steady-state visual evoked potential based features. IEEE Access 2018, 6, 40379–40388. [Google Scholar] [CrossRef]
- Wang, Y.; Sun, K.; Liu, Z.; Chen, G.; Jia, Y.; Zhong, S.; Pan, J.; Huang, L.; Tian, J. Classification of Unmedicated Bipolar Disorder Using Whole-Brain Functional Activity and Connectivity: A Radiomics Analysis. Cereb. Cortex 2020, 30, 1117–1128. [Google Scholar] [CrossRef] [PubMed]
- Ogruc Ildiz, G.; Bayari, S.; Aksoy, U.M.; Yorguner, N.; Bulut, H.; Yilmaz, S.S.; Halimoglu, G.; Kabuk, H.N.; Yavuz, G.; Fausto, R. Auxiliary differential diagnosis of schizophrenia and phases of bipolar disorder based on the blood serum Raman spectra. J. Raman Spectrosc. 2020, 51, 2233–2244. [Google Scholar] [CrossRef]
- Achalia, R.; Sinha, A.; Jacob, A.; Achalia, G.; Kaginalkar, V.; Venkatasubramanian, G.; Rao, N.P. A proof of concept machine learning analysis using multimodal neuroimaging and neurocognitive measures as predictive biomarker in bipolar disorder. Asian J. Psychiatr. 2020, 50, 101984. [Google Scholar] [CrossRef] [PubMed]
- Wu, M.-J.; Passos, I.C.; Bauer, I.E.; Lavagnino, L.; Cao, B.; Zunta-Soares, G.B.; Kapczinski, F.; Mwangi, B.; Soares, J.C. Individualized identification of euthymic bipolar disorder using the Cambridge Neuropsychological Test Automated Battery (CANTAB) and machine learning. J. Affect. Disord. 2016, 192, 219–225. [Google Scholar] [CrossRef]
- Sutcubasi, B.; Metin, S.Z.; Erguzel, T.T.; Metin, B.; Tas, C.; Arikan, M.K.; Tarhan, N. Anatomical connectivity changes in bipolar disorder and schizophrenia investigated using whole-brain tract-based spatial statistics and machine learning approaches. Neural Comput. Appl. 2019, 31, 4983–4992. [Google Scholar] [CrossRef]
- Zeng, L.-L.; Wang, H.; Hu, P.; Yang, B.; Pu, W.; Shen, H.; Chen, X.; Liu, Z.; Yin, H.; Tan, Q.; et al. Multi-Site Diagnostic Classification of Schizophrenia Using Discriminant Deep Learning with Functional Connectivity MRI. EBioMedicine 2018, 30, 74–85. [Google Scholar] [CrossRef] [PubMed]
- Oh, J.; Oh, B.-L.; Lee, K.-U.; Chae, J.-H.; Yun, K. Identifying Schizophrenia Using Structural MRI With a Deep Learning Algorithm. Front. Psychiatry 2020, 11, 16. [Google Scholar] [CrossRef]
- Aslan, Z.; Akin, M. Automatic Detection of Schizophrenia by Applying Deep Learning over Spectrogram Images of EEG Signals. Traitement du Signal 2020, 37, 235–244. [Google Scholar] [CrossRef]
- Shalbaf, A.; Bagherzadeh, S.; Maghsoudi, A. Transfer learning with deep convolutional neural network for automated detection of schizophrenia from EEG signals. Australas. Phys. Eng. Sci. Med. 2020. [Google Scholar] [CrossRef]
- Naira, C.A.T.; Jos´e, C. Classification of People who Suffer Schizophrenia and Healthy People by EEG Signals using Deep Learning. Int. J. Adv. Comput. Sci. Appl. 2019, 10. [Google Scholar] [CrossRef]
- Rozycki, M.; Satterthwaite, T.D.; Koutsouleris, N.; Erus, G.; Doshi, J.; Wolf, D.H.; Fan, Y.; Gur, R.E.; Gur, R.C.; Meisenzahl, E.M.; et al. Multisite Machine Learning Analysis Provides a Robust Structural Imaging Signature of Schizophrenia Detectable Across Diverse Patient Populations and Within Individuals. Schizophr. Bull. 2018, 44, 1035–1044. [Google Scholar] [CrossRef]
- Shim, M.; Hwang, H.-J.; Kim, D.-W.; Lee, S.-H.; Im, C.-H. Machine-learning-based diagnosis of schizophrenia using combined sensor-level and source-level EEG features. Schizophr. Res. 2016, 176, 314–319. [Google Scholar] [CrossRef]
- Winterburn, J.L.; Voineskos, A.N.; Devenyi, G.A.; Plitman, E.; de la Fuente-Sandoval, C.; Bhagwat, N.; Graff-Guerrero, A.; Knight, J.; Chakravarty, M.M. Can we accurately classify schizophrenia patients from healthy controls using magnetic resonance imaging and machine learning? A multi-method and multi-dataset study. Schizophr. Res. 2019, 214, 3–10. [Google Scholar] [CrossRef]
- Lin, E.; Lin, C.-H.; Lai, Y.-L.; Huang, C.-H.; Huang, Y.-J.; Lane, H.-Y. Combination of G72 Genetic Variation and G72 Protein Level to Detect Schizophrenia: Machine Learning Approaches. Front. Psychiatry 2018, 9, 566. [Google Scholar] [CrossRef]
- Cai, X.-L.; Xie, D.-J.; Madsen, K.H.; Wang, Y.-M.; Bögemann, S.A.; Cheung, E.F.C.; Møller, A.; Chan, R.C.K. Generalizability of machine learning for classification of schizophrenia based on resting-state functional MRI data. Hum. Brain Mapp. 2020, 41, 172–184. [Google Scholar] [CrossRef]
- Qureshi, M.N.I.; Oh, J.; Cho, D.; Jo, H.J.; Lee, B. Multimodal Discrimination of Schizophrenia Using Hybrid Weighted Feature Concatenation of Brain Functional Connectivity and Anatomical Features with an Extreme Learning Machine. Front. Neuroinform. 2017, 11, 59. [Google Scholar] [CrossRef]
- Juneja, A.; Rana, B.; Agrawal, R.K. A novel fuzzy rough selection of non-linearly extracted features for schizophrenia diagnosis using fMRI. Comput. Methods Programs Biomed. 2018, 155, 139–152. [Google Scholar] [CrossRef]
- de Boer, J.N.; van Hoogdalem, M.; Mandl, R.C.W.; Brummelman, J.; Voppel, A.E.; Begemann, M.J.H.; van Dellen, E.; Wijnen, F.N.K.; Sommer, I.E.C. Language in schizophrenia: relation with diagnosis, symptomatology and white matter tracts. NPJ Schizophr 2020, 6, 10. [Google Scholar] [CrossRef]
- Oh, S.L.; Vicnesh, J.; Ciaccio, E.; Rajamanickam, Y.; Acharya, U.R. Deep Convolutional Neural Network Model for Automated Diagnosis of Schizophrenia Using EEG Signals. NATO Adv. Sci. Inst. Ser. E Appl. Sci. 2019, 9, 2870. [Google Scholar] [CrossRef]
- Santos-Mayo, L.; San-Jose-Revuelta, L.M.; Arribas, J.I. A Computer-Aided Diagnosis System With EEG Based on the P3b Wave During an Auditory Odd-Ball Task in Schizophrenia. IEEE Trans. Biomed. Eng. 2017, 64, 395–407. [Google Scholar] [CrossRef] [PubMed]
- Chatterjee, I.; Agarwal, M.; Rana, B.; Lakhyani, N.; Kumar, N. Bi-objective approach for computer-aided diagnosis of schizophrenia patients using fMRI data. Multimed. Tools Appl. 2018, 77, 26991–27015. [Google Scholar] [CrossRef]
- Ding, Y.; Chen, X.; Fu, Q.; Zhong, S. A depression recognition method for college students using deep integrated support vector algorithm. IEEE Access 2020, 8, 75616–75629. [Google Scholar] [CrossRef]
- Li, X.; La, R.; Wang, Y.; Niu, J.; Zeng, S.; Sun, S.; Zhu, J. EEG-based mild depression recognition using convolutional neural network. Med. Biol. Eng. Comput. 2019, 57, 1341–1352. [Google Scholar] [CrossRef] [PubMed]
- Byeon, H. Chi-Square Automatic Interaction Detection Modeling for Predicting Depression in Multicultural Female Students. Int. J. Adv. Comput. Sci. Appl. 2017, 8. [Google Scholar] [CrossRef]
- Kautzky, A.; James, G.M.; Philippe, C.; Baldinger-Melich, P.; Kraus, C.; Kranz, G.S.; Vanicek, T.; Gryglewski, G.; Wadsak, W.; Mitterhauser, M.; et al. The influence of the rs6295 gene polymorphism on serotonin-1A receptor distribution investigated with PET in patients with major depression applying machine learning. Transl. Psychiatry 2017, 7, e1150. [Google Scholar] [CrossRef]
- Lin, W.; Tong, T.; Gao, Q.; Guo, D.; Du, X.; Yang, Y.; Guo, G.; Xiao, M.; Du, M.; Qu, X.; et al. Convolutional Neural Networks-Based MRI Image Analysis for the Alzheimer’s Disease Prediction From Mild Cognitive Impairment. Front. Neurosci. 2018, 12, 777. [Google Scholar] [CrossRef]
- Ding, X.; Bucholc, M.; Wang, H.; Glass, D.H.; Wang, H.; Clarke, D.H.; Bjourson, A.J.; Dowey, L.R.C.; O’Kane, M.; Prasad, G.; et al. A hybrid computational approach for efficient Alzheimer’s disease classification based on heterogeneous data. Sci. Rep. 2018, 8, 9774. [Google Scholar] [CrossRef]
- Lu, D.; Popuri, K.; Ding, G.W.; Balachandar, R.; Beg, M.F. Alzheimer’s Disease Neuroimaging Initiative Multiscale deep neural network based analysis of FDG-PET images for the early diagnosis of Alzheimer’s disease. Med. Image Anal. 2018, 46, 26–34. [Google Scholar] [CrossRef]
- Fiscon, G.; Weitschek, E.; Cialini, A.; Felici, G.; Bertolazzi, P.; De Salvo, S.; Bramanti, A.; Bramanti, P.; De Cola, M.C. Combining EEG signal processing with supervised methods for Alzheimer’s patients classification. BMC Med. Inform. Decis. Mak. 2018, 18, 35. [Google Scholar] [CrossRef]
- Aidos, H.; Fred, A. For the Alzheimer’s Disease Neuroimaging Initiative Discrimination of Alzheimer’s Disease using longitudinal information. Data Min. Knowl. Discov. 2017, 31, 1006–1030. [Google Scholar] [CrossRef]
- Bin-Hezam, R. Tomas A Machine Learning Approach towards Detecting Dementia based on its Modifiable Risk Factors. Int. J. Adv. Comput. Sci. Appl. 2019, 10. [Google Scholar] [CrossRef]
- Zhou, S.-M.; Tsang, G.; Xie, X.; Huo, L.; Brophy, S.; Lyons, R.A. Mining electronic health records to identify influential predictors associated with hospital admission of patients with dementia: an artificial intelligence approach. Lancet 2018, 392, S9. [Google Scholar] [CrossRef]
- Choi, H.-S.; Choe, J.Y.; Kim, H.; Han, J.W.; Chi, Y.K.; Kim, K.; Hong, J.; Kim, T.; Kim, T.H.; Yoon, S.; et al. Deep learning based low-cost high-accuracy diagnostic framework for dementia using comprehensive neuropsychological assessment profiles. BMC Geriatr. 2018, 18, 234. [Google Scholar] [CrossRef] [PubMed]
- Moreira, L.B.; Namen, A.A. A hybrid data mining model for diagnosis of patients with clinical suspicion of dementia. Comput. Methods Programs Biomed. 2018, 165, 139–149. [Google Scholar] [CrossRef]
- Bang, S.; Son, S.; Roh, H.; Lee, J.; Bae, S.; Lee, K.; Hong, C.; Shin, H. Quad-phased data mining modeling for dementia diagnosis. BMC Med. Inform. Decis. Mak. 2017, 17, 60. [Google Scholar] [CrossRef]
- Walsh, C.G.; Ribeiro, J.D.; Franklin, J.C. Predicting Risk of Suicide Attempts Over Time Through Machine Learning. Clin. Psychol. Sci. 2017, 5, 457–469. [Google Scholar] [CrossRef]
- Walsh, C.G.; Ribeiro, J.D.; Franklin, J.C. Predicting suicide attempts in adolescents with longitudinal clinical data and machine learning. J. Child Psychol. Psychiatry 2018, 59, 1261–1270. [Google Scholar] [CrossRef] [PubMed]
- Cheng, Q.; Li, T.M.; Kwok, C.-L.; Zhu, T.; Yip, P.S. Assessing Suicide Risk and Emotional Distress in Chinese Social Media: A Text Mining and Machine Learning Study. J. Med. Internet Res. 2017, 19, e243. [Google Scholar] [CrossRef]
- Oh, J.; Yun, K.; Hwang, J.-H.; Chae, J.-H. Classification of Suicide Attempts through a Machine Learning Algorithm Based on Multiple Systemic Psychiatric Scales. Front. Psychiatry 2017, 8, 192. [Google Scholar] [CrossRef]
- Hettige, N.C.; Nguyen, T.B.; Yuan, C.; Rajakulendran, T.; Baddour, J.; Bhagwat, N.; Bani-Fatemi, A.; Voineskos, A.N.; Mallar Chakravarty, M.; De Luca, V. Classification of suicide attempters in schizophrenia using sociocultural and clinical features: A machine learning approach. Gen. Hosp. Psychiatry 2017, 47, 20–28. [Google Scholar] [CrossRef] [PubMed]
- Ryu, S.; Lee, H.; Lee, D.-K.; Park, K. Use of a Machine Learning Algorithm to Predict Individuals with Suicide Ideation in the General Population. Psychiatry Investig. 2018, 15, 1030–1036. [Google Scholar] [CrossRef] [PubMed]
- Jung, J.S.; Park, S.J.; Kim, E.Y.; Na, K.-S.; Kim, Y.J.; Kim, K.G. Prediction models for high risk of suicide in Korean adolescents using machine learning techniques. PLoS ONE 2019, 14, e0217639. [Google Scholar] [CrossRef]
- Lin, G.-M.; Nagamine, M.; Yang, S.-N.; Tai, Y.-M.; Lin, C.; Sato, H. Machine learning based suicide ideation prediction for military personnel. IEEE J. Biomed. Health Inform. 2020, 24, 1907–1916. [Google Scholar] [CrossRef] [PubMed]
- Su, C.; Aseltine, R.; Doshi, R.; Chen, K.; Rogers, S.C.; Wang, F. Machine learning for suicide risk prediction in children and adolescents with electronic health records. Transl. Psychiatry 2020, 10, 413. [Google Scholar] [CrossRef] [PubMed]
- Choi, S.B.; Lee, W.; Yoon, J.-H.; Won, J.-U.; Kim, D.W. Ten-year prediction of suicide death using Cox regression and machine learning in a nationwide retrospective cohort study in South Korea. J. Affect. Disord. 2018, 231, 8–14. [Google Scholar] [CrossRef]
- Chen, Q.; Zhang-James, Y.; Barnett, E.J.; Lichtenstein, P.; Jokinen, J.; D’Onofrio, B.M.; Faraone, S.V.; Larsson, H.; Fazel, S. Predicting suicide attempt or suicide death following a visit to psychiatric specialty care: A machine learning study using Swedish national registry data. PLoS Med. 2020, 17, e1003416. [Google Scholar] [CrossRef]
- Edgcomb, J.B.; Thiruvalluru, R.; Pathak, J.; Brooks, J.O., 3rd. Machine Learning to Differentiate Risk of Suicide Attempt and Self-harm After General Medical Hospitalization of Women With Mental Illness. Med. Care 2021, 59, S58–S64. [Google Scholar] [CrossRef]
- Haroz, E.E.; Walsh, C.G.; Goklish, N.; Cwik, M.F.; O’Keefe, V.; Barlow, A. Reaching Those at Highest Risk for Suicide: Development of a Model Using Machine Learning Methods for use With Native American Communities. Suicide Life Threat. Behav. 2020, 50, 422–436. [Google Scholar] [CrossRef]
- Ryu, S.; Lee, H.; Lee, D.-K.; Kim, S.-W.; Kim, C.-E. Detection of Suicide Attempters among Suicide Ideators Using Machine Learning. Psychiatry Investig. 2019, 16, 588–593. [Google Scholar] [CrossRef]
- Miché, M.; Studerus, E.; Meyer, A.H.; Gloster, A.T.; Beesdo-Baum, K.; Wittchen, H.-U.; Lieb, R. Prospective prediction of suicide attempts in community adolescents and young adults, using regression methods and machine learning. J. Affect. Disord. 2020, 265, 570–578. [Google Scholar] [CrossRef] [PubMed]
- Shen, Y.; Zhang, W.; Chan, B.S.M.; Zhang, Y.; Meng, F.; Kennon, E.A.; Wu, H.E.; Luo, X.; Zhang, X. Detecting risk of suicide attempts among Chinese medical college students using a machine learning algorithm. J. Affect. Disord. 2020, 273, 18–23. [Google Scholar] [CrossRef]
- Parghi, N.; Chennapragada, L.; Barzilay, S.; Newkirk, S.; Ahmedani, B.; Lok, B.; Galynker, I. Assessing the predictive ability of the Suicide Crisis Inventory for near-term suicidal behavior using machine learning approaches. Int. J. Methods Psychiatr. Res. 2020, e1863. [Google Scholar] [CrossRef]
- Cohen, J.; Wright-Berryman, J.; Rohlfs, L.; Wright, D.; Campbell, M.; Gingrich, D.; Santel, D.; Pestian, J. A Feasibility Study Using a Machine Learning Suicide Risk Prediction Model Based on Open-Ended Interview Language in Adolescent Therapy Sessions. Int. J. Environ. Res. Public Health 2020, 17, 8187. [Google Scholar] [CrossRef] [PubMed]
- Zheng, L.; Wang, O.; Hao, S.; Ye, C.; Liu, M.; Xia, M.; Sabo, A.N.; Markovic, L.; Stearns, F.; Kanov, L.; et al. Development of an early-warning system for high-risk patients for suicide attempt using deep learning and electronic health records. Transl. Psychiatry 2020, 10, 72. [Google Scholar] [CrossRef]
- Tadesse, M.M.; Lin, H.; Xu, B.; Yang, L. Detection of Suicide Ideation in Social Media Forums Using Deep Learning. Algorithms 2019, 13, 7. [Google Scholar] [CrossRef]
- Devijver, P.A.; Kittler, J. Pattern Recognition: A Statistical Approach; Prentice Hall: Upper Saddle River, NJ, USA, 1982. [Google Scholar]
- Webb, A.R. Statistical Pattern Recognition; John Wiley & Sons: Hoboken, NJ, USA, 2003; ISBN 9780470854785. [Google Scholar]
- Mosteller, F. A k-Sample Slippage Test for an Extreme Population. In Selected Papers of Frederick Mosteller; Fienberg, S.E., Hoaglin, D.C., Eds.; Springer New York: New York, NY, USA, 2006; ISBN 9780387449562. [Google Scholar]
- Theodoridis, S.; Koutroumbas, K. Others Pattern recognition. IEEE Trans. Neural Netw. 2008, 19, 376. [Google Scholar]
- Moons, K.G.M.; Altman, D.G.; Reitsma, J.B.; Ioannidis, J.P.A.; Macaskill, P.; Steyerberg, E.W.; Vickers, A.J.; Ransohoff, D.F.; Collins, G.S. Transparent Reporting of a multivariable prediction model for Individual Prognosis or Diagnosis (TRIPOD): explanation and elaboration. Ann. Intern. Med. 2015, 162, W1-73. [Google Scholar] [CrossRef]
- Li, X.; Li, Y.; Li, X. Predicting Clinical Outcomes of Alzheimer’s Disease from Complex Brain Networks. In International Conference on Advanced Data Mining and Applications; Springer: Cham, Switzerland, 2017; pp. 519–525. [Google Scholar]
- Sayed, G.I.; Hassanien, A.E.; Nassef, T.M.; Pan, J.-S. Alzheimer’s Disease Diagnosis Based on Moth Flame Optimization. In Proceedings of the Genetic and Evolutionary Computing; Springer International Publishing: Cham, Switzerland, 2017; pp. 298–305. [Google Scholar]
- Saeb, S.; Lonini, L.; Jayaraman, A.; Mohr, D.C.; Kording, K.P. The need to approximate the use-case in clinical machine learning. Gigascience 2017, 6, 1–9. [Google Scholar] [CrossRef]
- Little, M.A.; Varoquaux, G.; Saeb, S.; Lonini, L.; Jayaraman, A.; Mohr, D.C.; Kording, K.P. Using and understanding cross-validation strategies. Perspectives on Saeb et al. Gigascience 2017, 6. [Google Scholar] [CrossRef]
- Mansourian, M.; Marateb, H.R.; Mansourian, M.; Mohebbian, M.R.; Binder, H.; Mañanas, M.Á. Rigorous performance assessment of computer-aided medical diagnosis and prognosis systems: a biostatistical perspective on data mining. In Modelling and Analysis of Active Biopotential Signals in Healthcare, Volume 2; IOP Publishing: Bristol, UK, 2020; ISBN 9780750334112. [Google Scholar]
- Ellis, P.D. The essential guide to effect sizes: statistical power, meta-analysis, and the interpretation of research results. Choice 2011, 48, 48–5742. [Google Scholar] [CrossRef]
- Colquhoun, D. An investigation of the false discovery rate and the misinterpretation of p-values. R. Soc. Open Sci. 2014, 1, 140216. [Google Scholar] [CrossRef]
- Ghosh, A.K. Mayo Clinic Internal Medicine Review, Eighth Edition; CRC Press: Boca Raton, FL, USA, 2008; ISBN 9781420084788. [Google Scholar]
- Li, J.; Rong, Y.; Meng, H.; Lu, Z.; Kwok, T.; Cheng, H. TATC: Predicting Alzheimer’s Disease with Actigraphy Data. In Proceedings of the KDD’18, 24th ACM SIGKDD International Conference on Knowledge Discovery & Data Mining, London, UK, 19–23 August 2018; pp. 509–518. [Google Scholar]
- Collins, G.S.; Reitsma, J.B.; Altman, D.G.; Moons, K.G.M. Transparent reporting of a multivariable prediction model for individual prognosis or diagnosis (TRIPOD): the TRIPOD Statement. BMC Med. 2015, 13, 1. [Google Scholar] [CrossRef] [PubMed]
- Bossuyt, P.M.; Reitsma, J.B.; Bruns, D.E.; Gatsonis, C.A.; Glasziou, P.P.; Irwig, L.; Lijmer, J.G.; Moher, D.; Rennie, D.; de Vet, H.C.W.; et al. STARD 2015: an updated list of essential items for reporting diagnostic accuracy studies. BMJ 2015, 351, h5527. [Google Scholar] [CrossRef] [PubMed]
- Hazra, A. Using the confidence interval confidently. J. Thorac. Dis. 2017, 9, 4125–4130. [Google Scholar] [CrossRef] [PubMed]
- Tsoi, K.K.F.; Lam, M.W.Y.; Chu, C.T.K.; Wong, M.P.F.; Meng, H.M.L. Machine Learning on Drawing Behavior for Dementia Screening; Association for Computing Machinery: New York, NY, USA, 2018; pp. 131–132. [Google Scholar]
- Yule, A.; Fitzgerald, M.; Wilens, T.; Wozniak, J.; Woodworth, K.Y.; Pulli, A.; Uchida, M.; Faraone, S.V.; Biederman, J. Further Evidence of the Diagnostic Utility of the Child Behavior Checklist for Identifying Pediatric Bipolar I Disorder. Scand. J. Child Adolescent Psychiatry Psychol. 2019, 7, 29–36. [Google Scholar] [CrossRef]
- McGuire, P.K.; Matsumoto, K. Functional neuroimaging in mental disorders. World Psychiatry 2004, 3, 6–11. [Google Scholar]
- Peter, F.; Andrea, S.; Nancy, A. Forty years of structural brain imaging in mental disorders: is it clinically useful or not? Dialogues Clin. Neurosci. 2018, 20, 179–186. [Google Scholar] [CrossRef]
- Desmyter, S.; van Heeringen, C.; Audenaert, K. Structural and functional neuroimaging studies of the suicidal brain. Progress Neuro-Psychopharmacol. Biol. Psychiatry 2011, 35, 796–808. [Google Scholar] [CrossRef]
- Hirsch, G.V.; Bauer, C.M.; Merabet, L.B. Using structural and functional brain imaging to uncover how the brain adapts to blindness. Ann. Neurosci. Psychol. 2015, 2, 7. [Google Scholar] [CrossRef]
- Uludağ, K.; Roebroeck, A. General overview on the merits of multimodal neuroimaging data fusion. Neuroimage 2014, 102 Pt 1, 3–10. [Google Scholar] [CrossRef]
- Lei, D.; Pinaya, W.H.L.; Young, J.; van Amelsvoort, T.; Marcelis, M.; Donohoe, G.; Mothersill, D.O.; Corvin, A.; Vieira, S.; Huang, X.; et al. Integrating machining learning and multimodal neuroimaging to detect schizophrenia at the level of the individual. Hum. Brain Mapp. 2020, 41, 1119–1135. [Google Scholar] [CrossRef]
- Aleem, I.S.; Jalal, H.; Aleem, I.S.; Sheikh, A.A.; Bhandari, M. Clinical decision analysis: Incorporating the evidence with patient preferences. Patient Prefer. Adherence 2008, 21. [Google Scholar] [CrossRef] [PubMed]
- Jo, T.; Nho, K.; Saykin, A.J. Deep learning in Alzheimer’s disease: Diagnostic classification and prognostic prediction using neuroimaging data. Front. Aging Neurosci. 2019, 11, 220. [Google Scholar] [CrossRef]
- Ghojogh, B.; Crowley, M. The theory behind overfitting, cross validation, regularization, bagging, and boosting: Tutorial. arXiv 2019, arXiv:1905.12787. [Google Scholar]
- Johnson, J.M.; Khoshgoftaar, T.M. Survey on deep learning with class imbalance. J. Big Data 2019, 6. [Google Scholar] [CrossRef]
- Elgendi, M.; Nasir, M.; Tang, Q.; Smith, D.; Grenier, J.-P.; Batte, C.; Spieler, B.; Leslie, W.D.; Menon, C.; Fletcher, R.; et al. The effectiveness of image augmentation in deep learning networks for detecting COVID-19: A geometric transformation perspective. Front. Med. 2021, 8, 153. [Google Scholar] [CrossRef]
- Lu, D.; Popuri, K.; Ding, G.W.; Balachandar, R.; Beg, M.F.; Alzheimer’s Disease Neuroimaging Initiative. Multimodal and Multiscale Deep Neural Networks for the Early Diagnosis of Alzheimer’s Disease using structural MR and FDG-PET images. Sci. Rep. 2018, 8. [Google Scholar] [CrossRef]
- Su, C.; Xu, Z.; Pathak, J.; Wang, F. Deep learning in mental health outcome research: a scoping review. Transl. Psychiatry 2020, 10, 116. [Google Scholar] [CrossRef] [PubMed]
- Samek, W.; Binder, A.; Montavon, G.; Lapuschkin, S.; Muller, K.-R. Evaluating the visualization of what a deep neural network has learned. IEEE Trans. Neural Netw. Learn. Syst. 2017, 28, 2660–2673. [Google Scholar] [CrossRef]
- Cheng, Q.; Varshney, P.K.; Arora, M.K. Logistic regression for feature selection and soft classification of remote sensing data. IEEE Geosci. Remote Sens. Lett. 2006, 3, 491–494. [Google Scholar] [CrossRef]
- Sarrafzadegan, N.; Hassannejad, R.; Marateb, H.R.; Talaei, M.; Sadeghi, M.; Roohafza, H.R.; Masoudkabir, F.; Oveisgharan, S.; Mansourian, M.; Mohebian, M.R.; et al. PARS risk charts: A 10-year study of risk assessment for cardiovascular diseases in Eastern Mediterranean Region. PLoS ONE 2017, 12, e0189389. [Google Scholar] [CrossRef] [PubMed]
- McHugh, C.M.; Large, M.M. Can machine-learning methods really help predict suicide? Curr. Opin. Psychiatry 2020, 33, 369–374. [Google Scholar] [CrossRef] [PubMed]
- Szmukler, G.; Everitt, B.; Leese, M. Risk assessment and receiver operating characteristic curves. Psychol. Med. 2012, 42, 895–898. [Google Scholar] [CrossRef] [PubMed]
- Bachmann, S. Epidemiology of suicide and the psychiatric perspective. Int. J. Environ. Res. Public Health 2018, 15, 1425. [Google Scholar] [CrossRef]
- McGrath, J.; Saha, S.; Chant, D.; Welham, J. Schizophrenia: a concise overview of incidence, prevalence, and mortality. Epidemiol. Rev. 2008, 30, 67–76. [Google Scholar] [CrossRef]
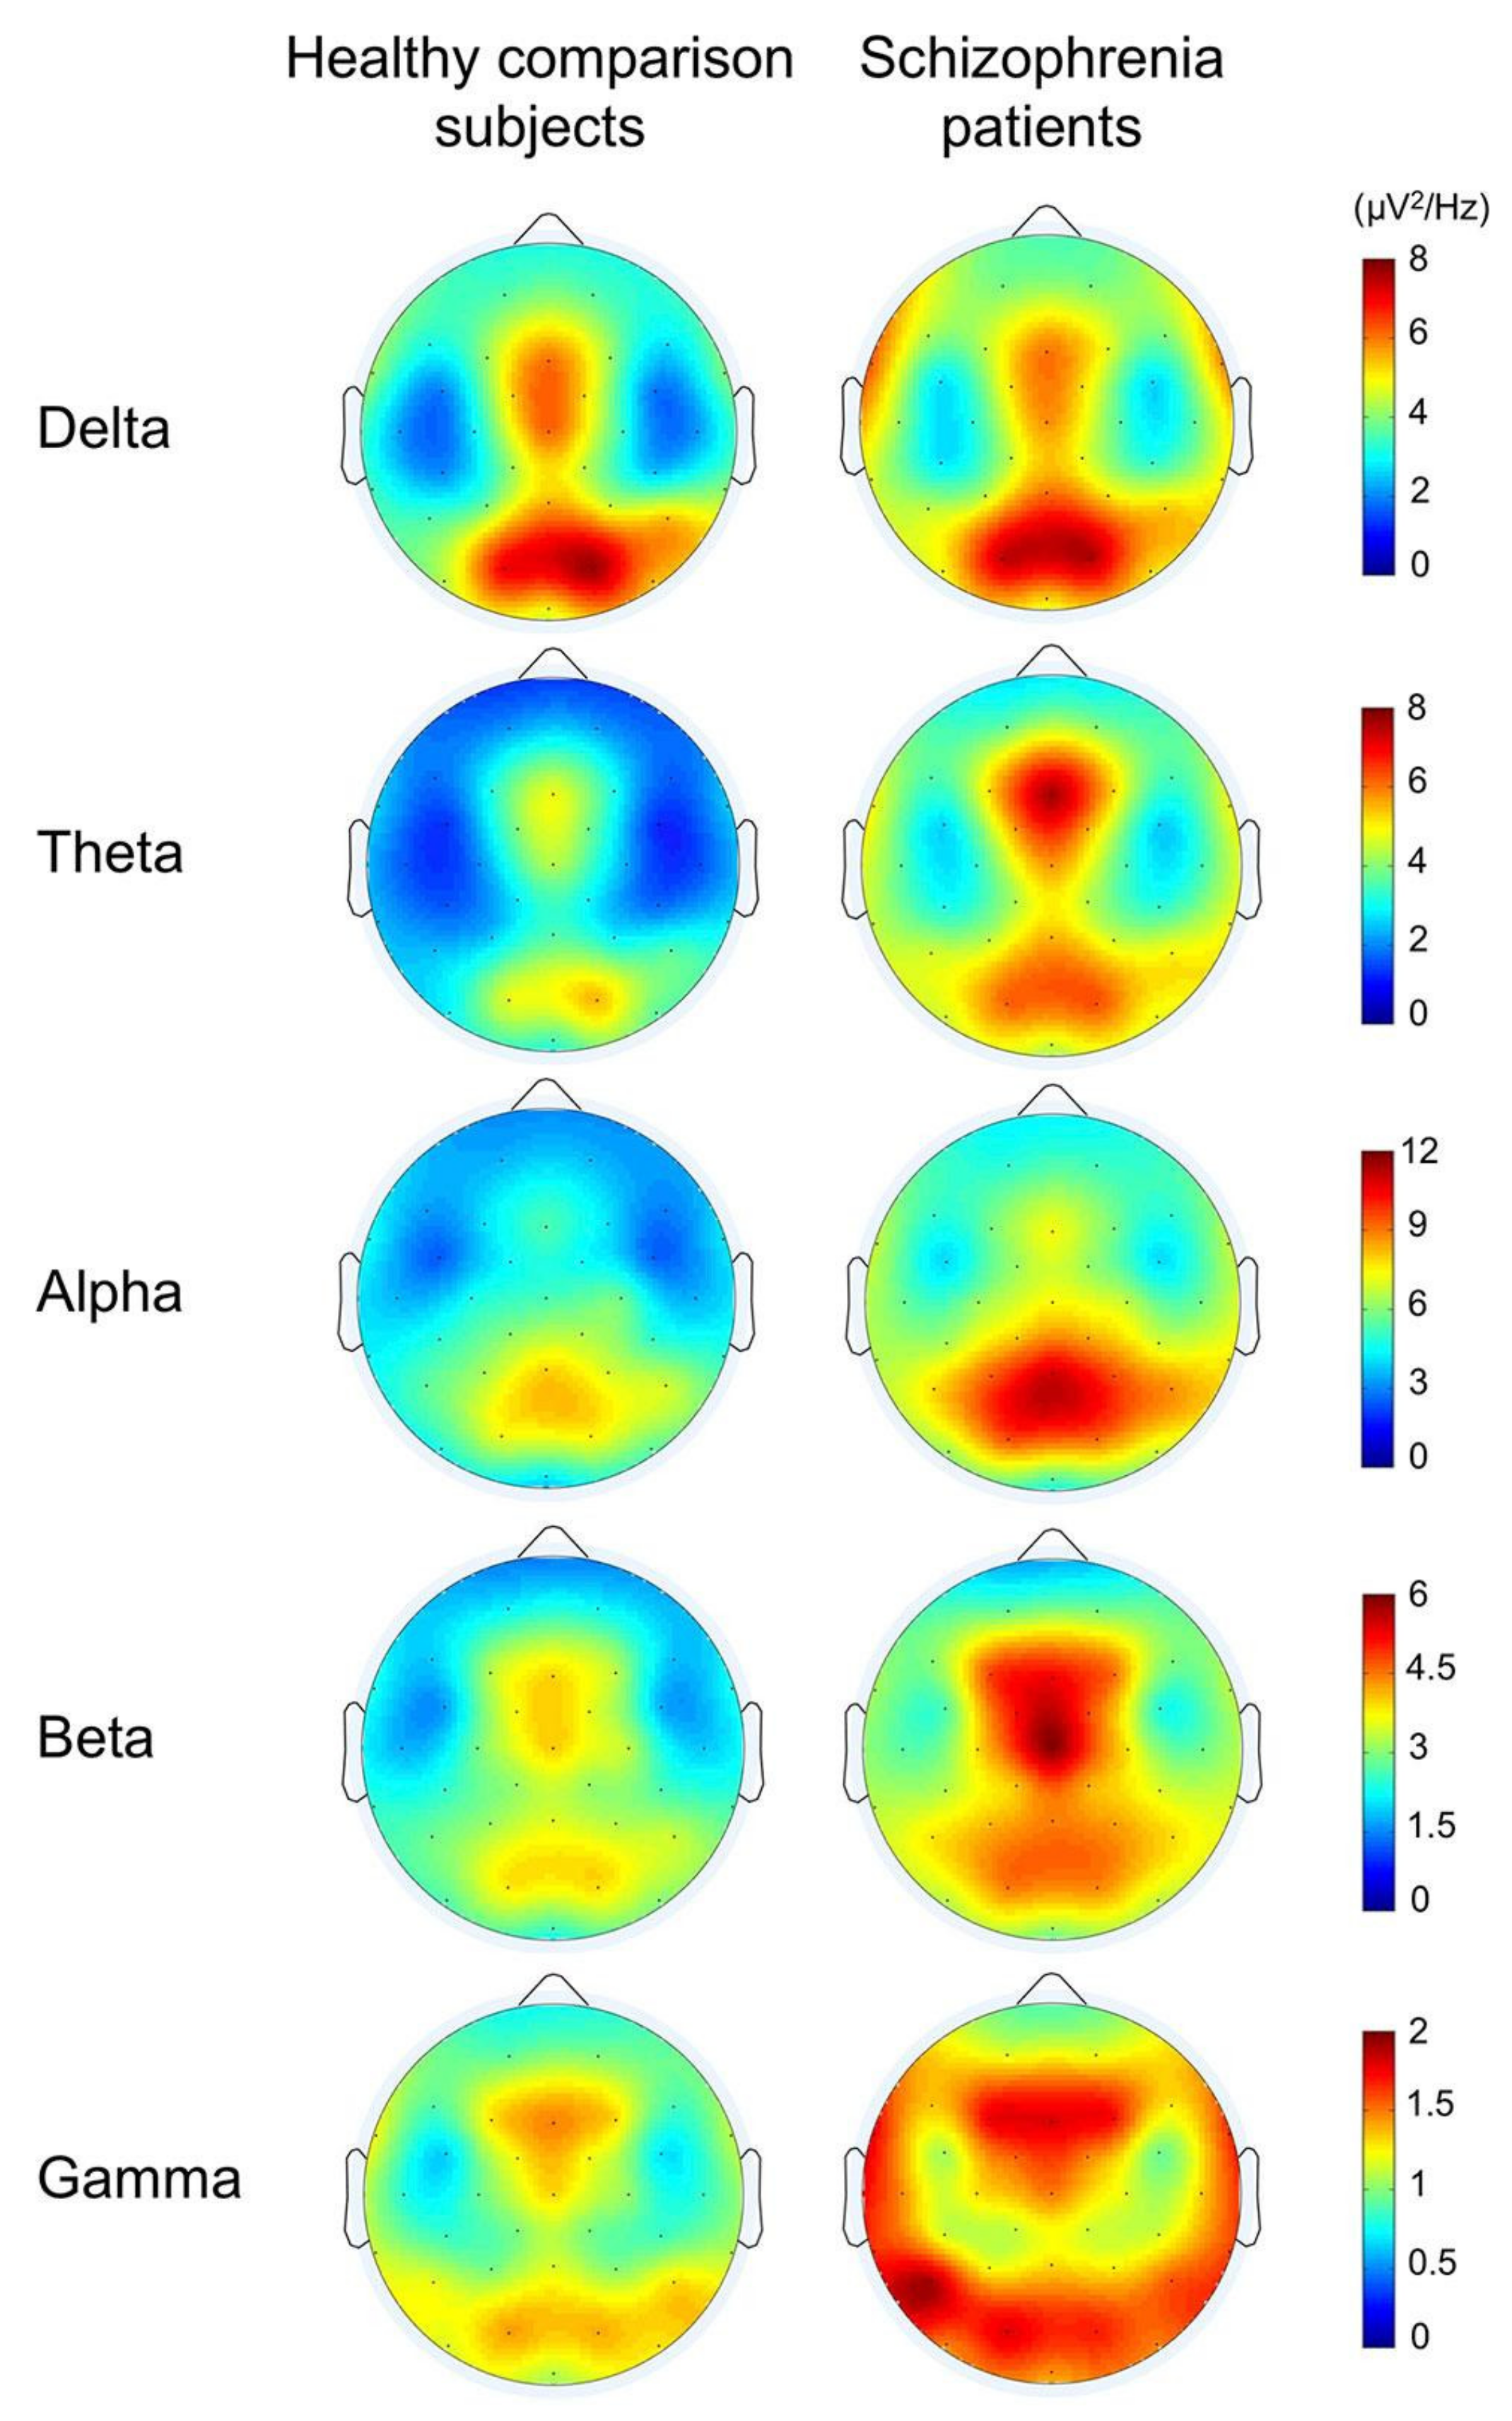
- Newson, J.J.; Thiagarajan, T.C. EEG Frequency Bands in Psychiatric Disorders: A Review of Resting State Studies. Front. Hum. Neurosci. 2018, 12, 521. [Google Scholar] [CrossRef] [PubMed]
- Tanaka-Koshiyama, K.; Koshiyama, D.; Miyakoshi, M.; Joshi, Y.B.; Molina, J.L.; Sprock, J.; Braff, D.L.; Light, G.A. Abnormal Spontaneous Gamma Power Is Associated With Verbal Learning and Memory Dysfunction in Schizophrenia. Front. Psychiatry 2020, 11, 832. [Google Scholar] [CrossRef]
- Uhlhaas, P.J.; Singer, W. Oscillations and neuronal dynamics in schizophrenia: the search for basic symptoms and translational opportunities. Biol. Psychiatry 2015, 77, 1001–1009. [Google Scholar] [CrossRef]
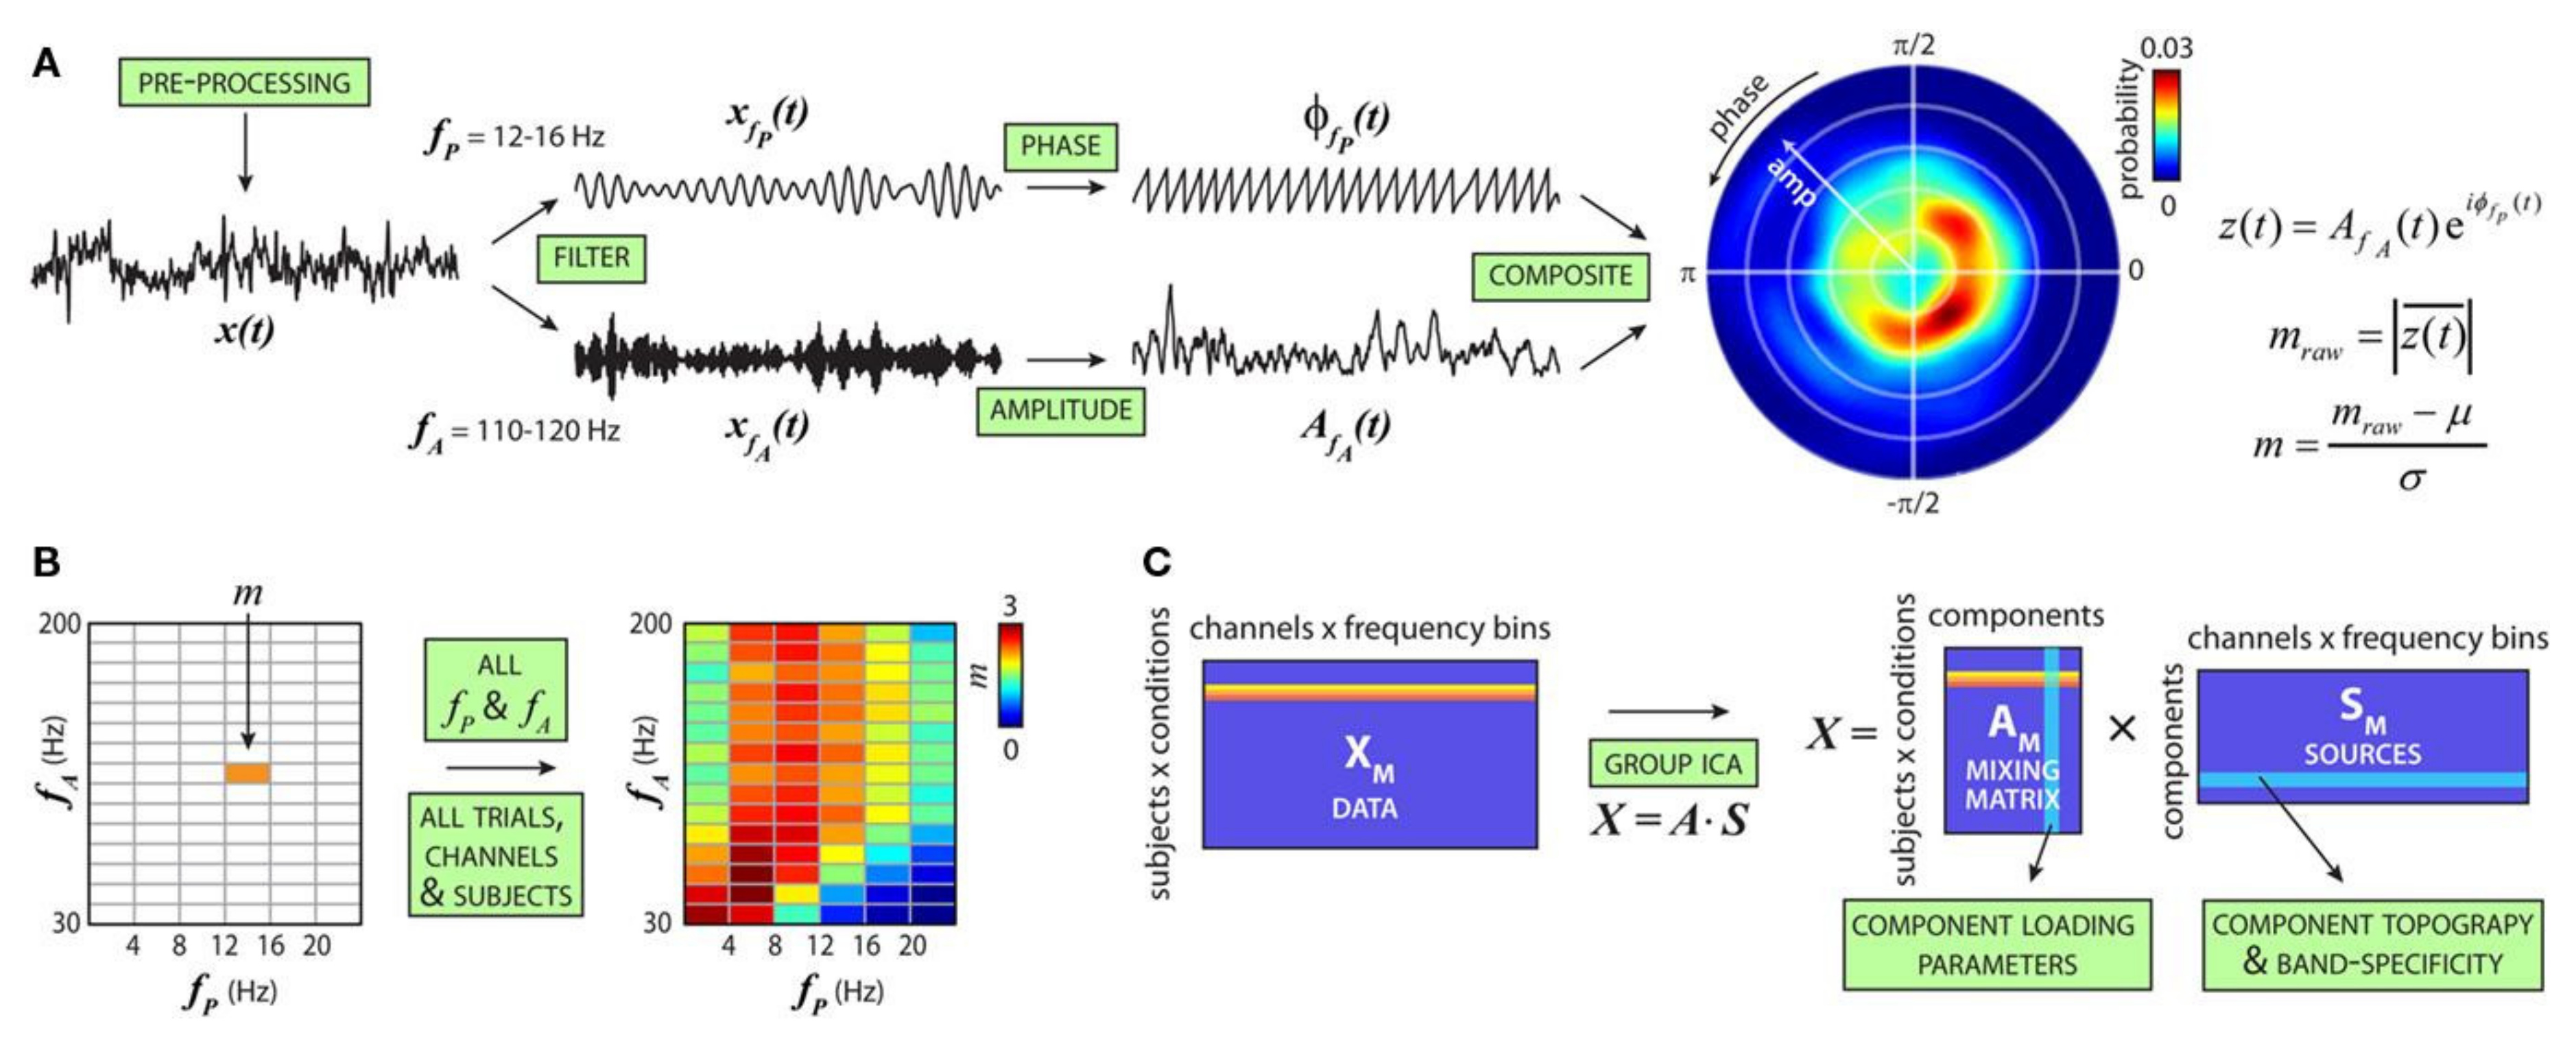
- Salimpour, Y.; Anderson, W.S. Cross-Frequency Coupling Based Neuromodulation for Treating Neurological Disorders. Front. Neurosci. 2019, 13, 125. [Google Scholar] [CrossRef]
- Dürschmid, S.; Zaehle, T.; Kopitzki, K.; Voges, J.; Schmitt, F.C.; Heinze, H.-J.; Knight, R.T.; Hinrichs, H. Phase-amplitude cross-frequency coupling in the human nucleus accumbens tracks action monitoring during cognitive control. Front. Hum. Neurosci. 2013, 7, 635. [Google Scholar] [CrossRef]
- Allen, E.A.; Liu, J.; Kiehl, K.A.; Gelernter, J.; Pearlson, G.D.; Perrone-Bizzozero, N.I.; Calhoun, V.D. Components of cross-frequency modulation in health and disease. Front. Syst. Neurosci. 2011, 5, 59. [Google Scholar] [CrossRef] [PubMed]
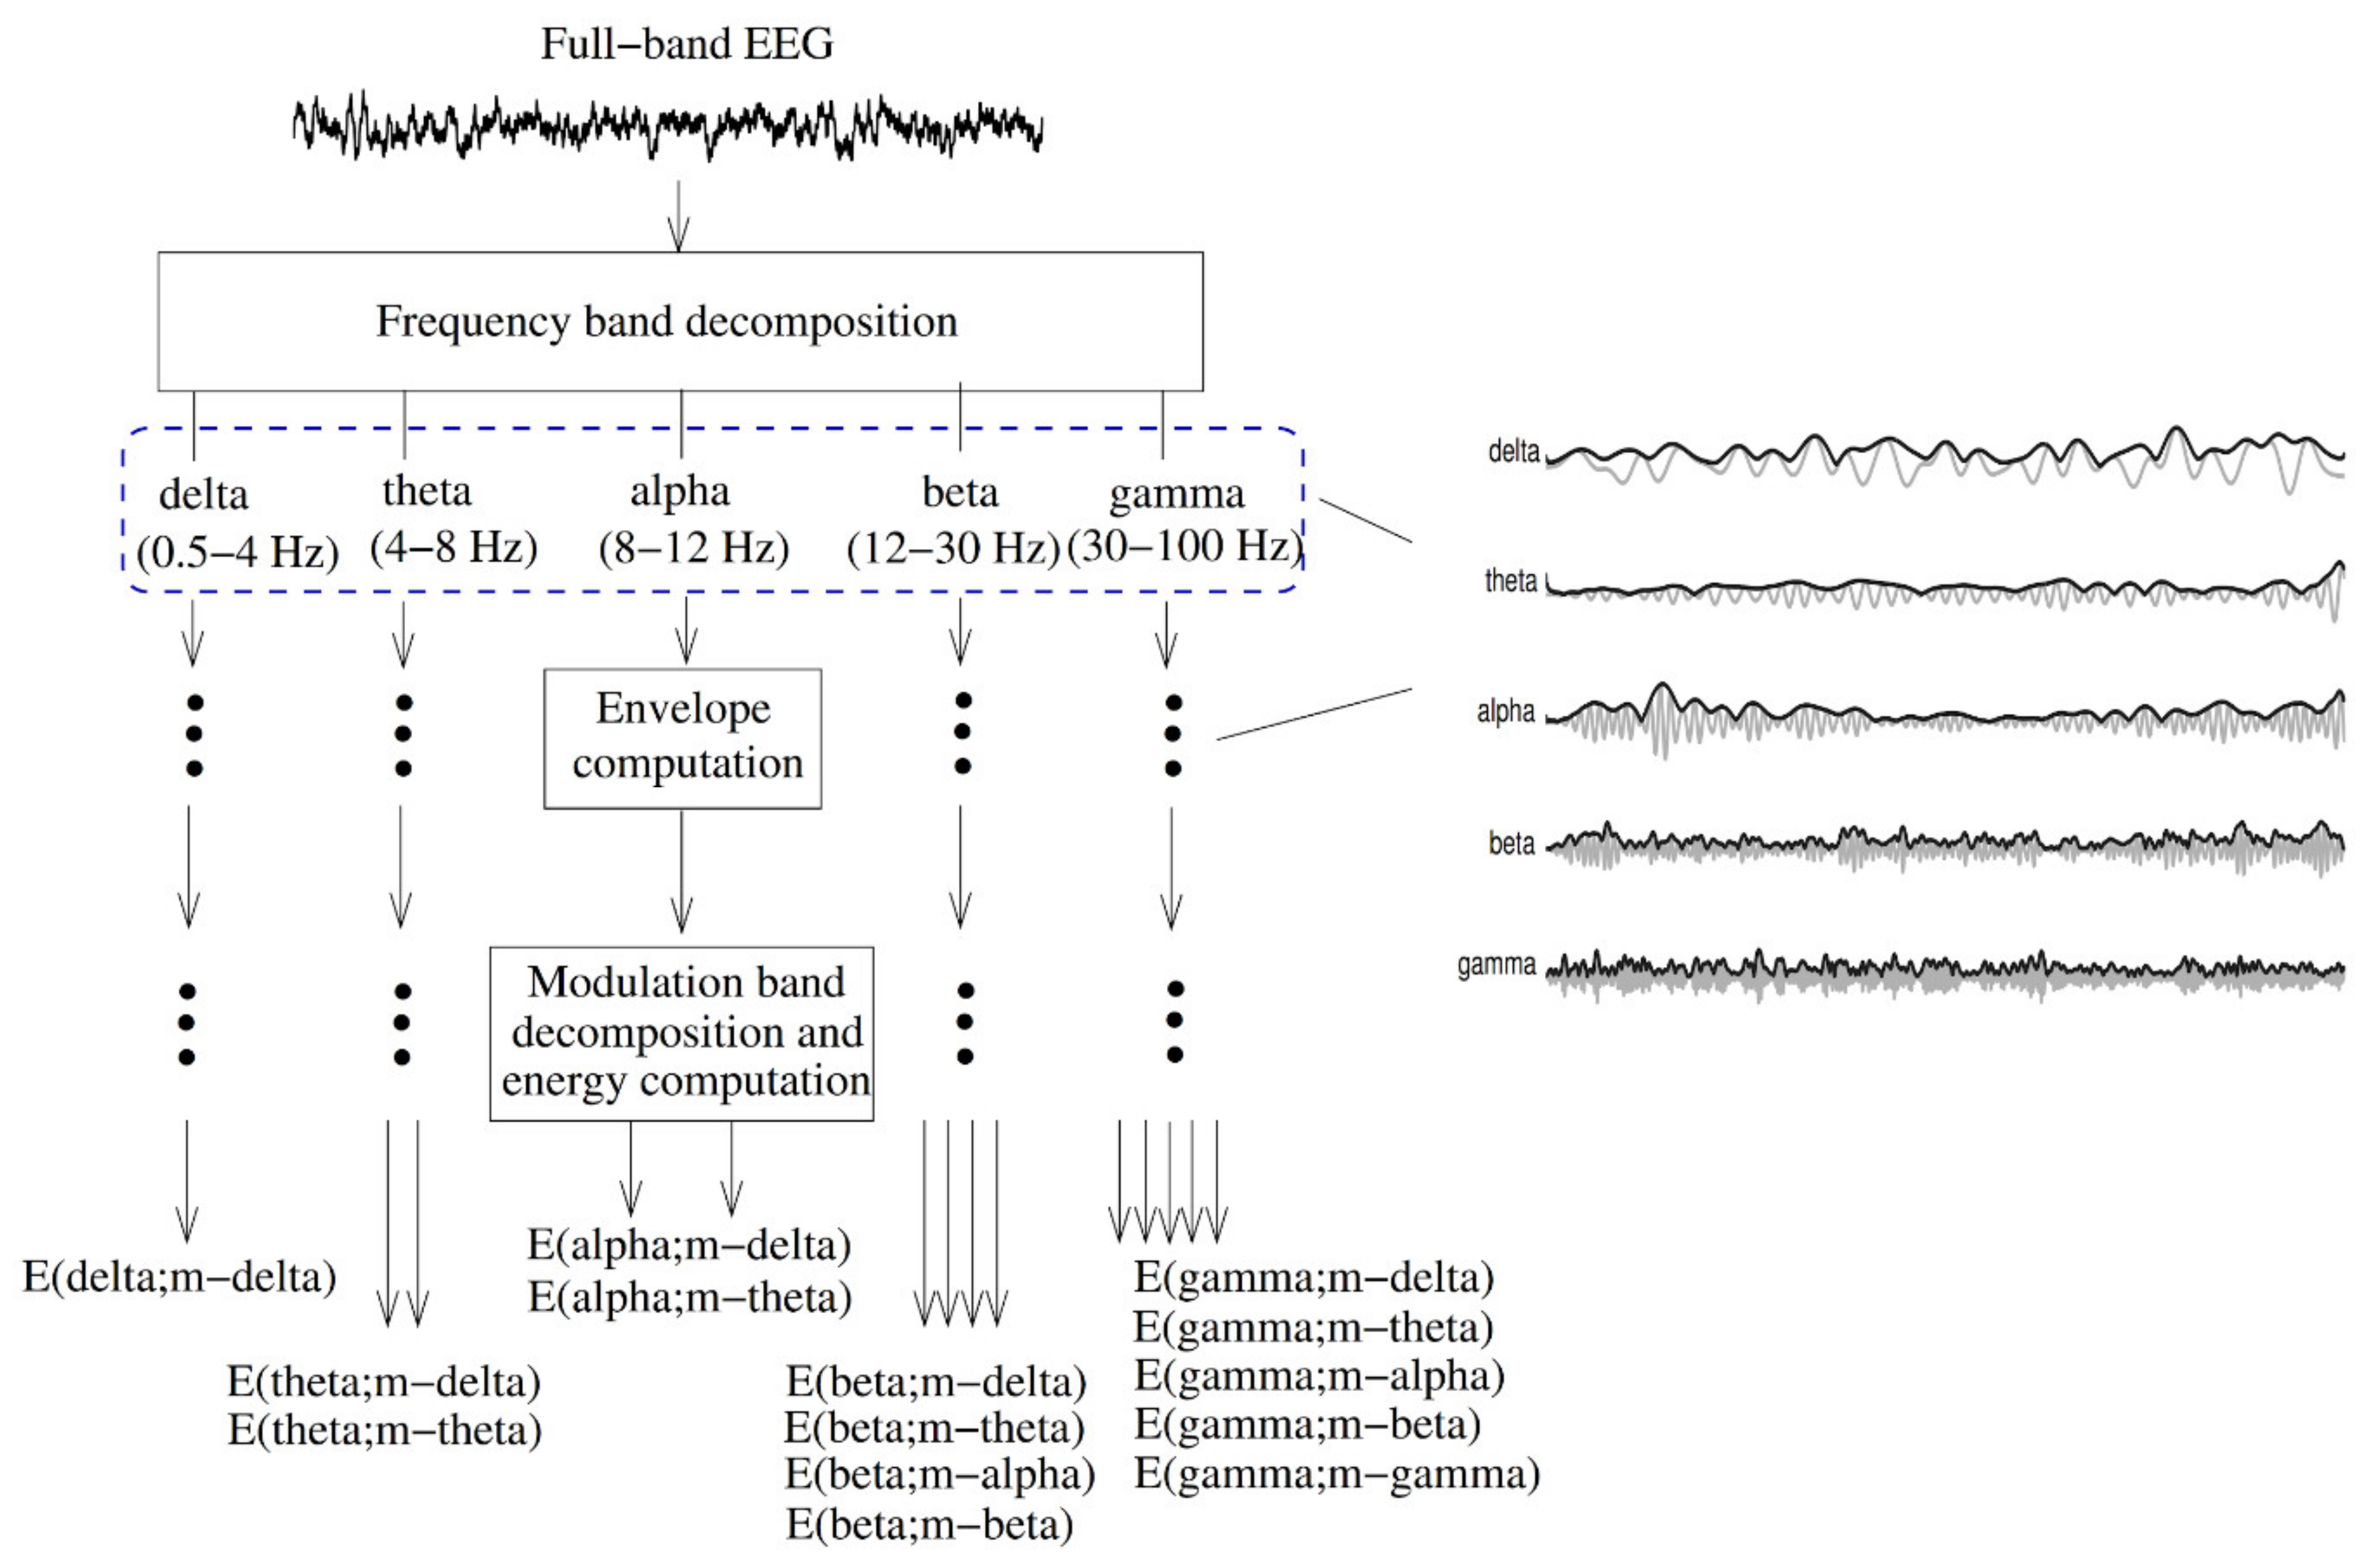
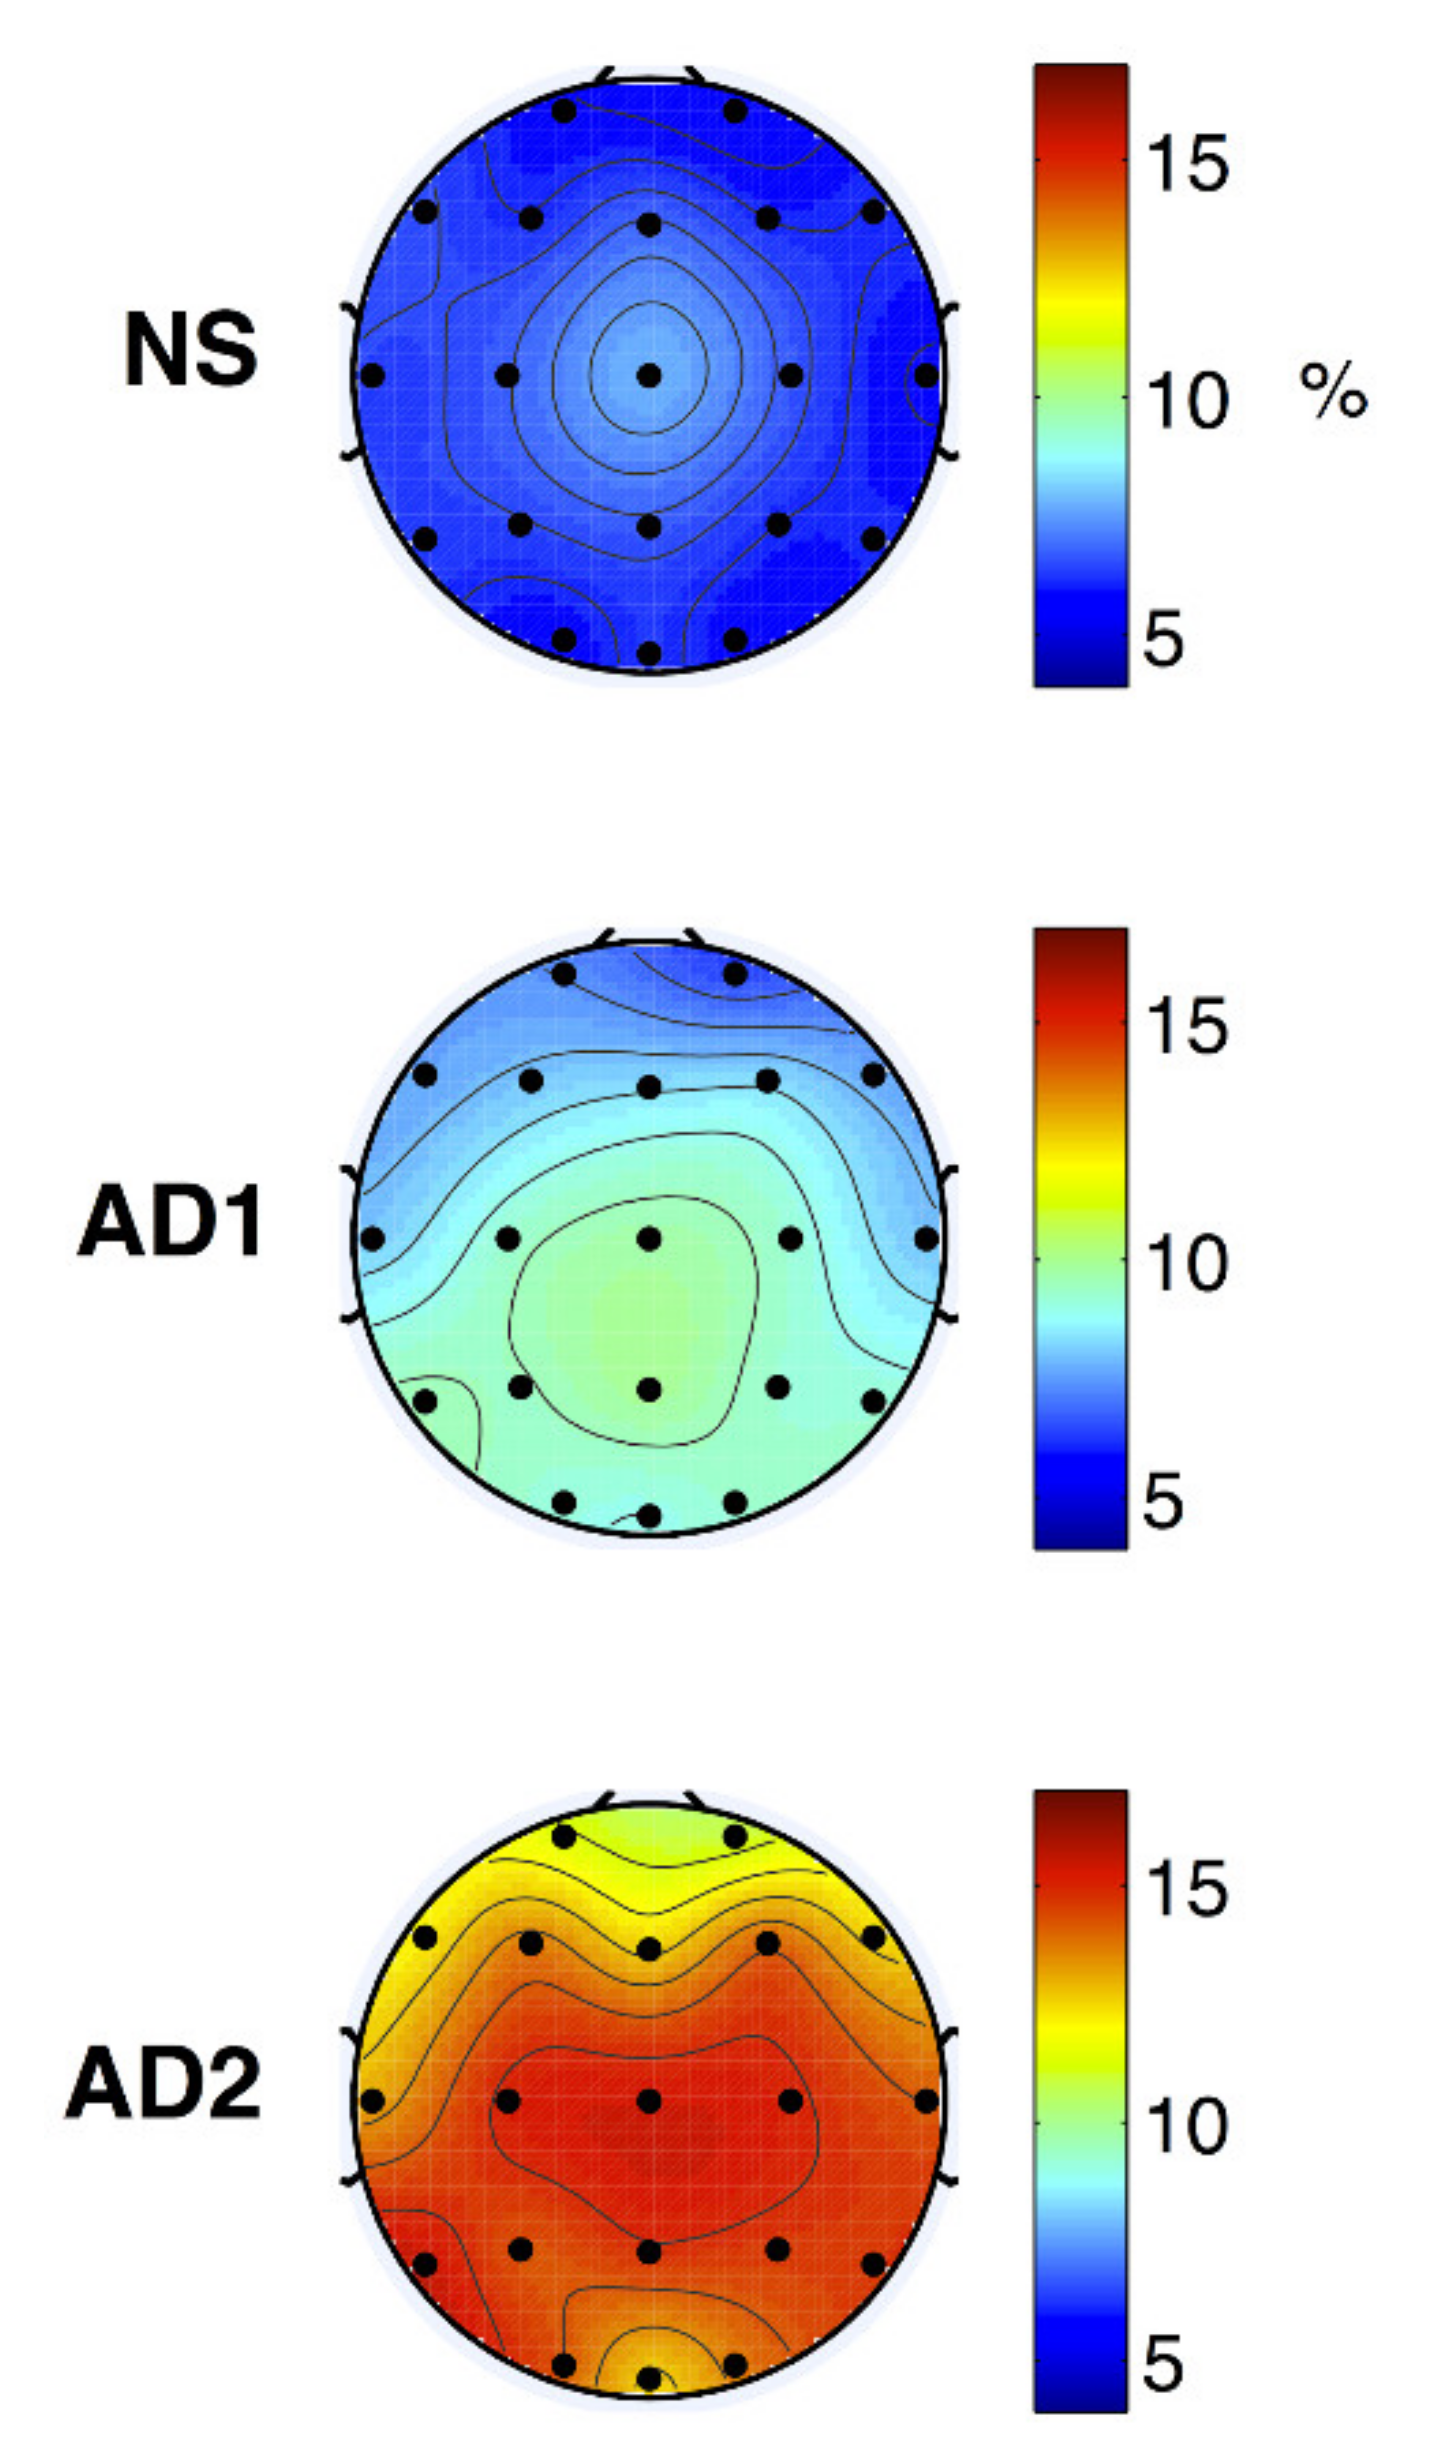
- Fraga, F.J.; Falk, T.H.; Kanda, P.A.M.; Anghinah, R. Characterizing Alzheimer’s disease severity via resting-awake EEG amplitude modulation analysis. PLoS ONE 2013, 8, e72240. [Google Scholar] [CrossRef]
- Buzsáki, G.; Draguhn, A. Neuronal oscillations in cortical networks. Science 2004, 304, 1926–1929. [Google Scholar] [CrossRef] [PubMed]
- Alonso, S.G.; de la Torre-Díez, I.; Hamrioui, S.; López-Coronado, M.; Barreno, D.C.; Nozaleda, L.M.; Franco, M. Data Mining algorithms and techniques in Mental Health: A systematic review. J. Med. Syst. 2018, 42, 161. [Google Scholar] [CrossRef]
- Thieme, A.; Belgrave, D.; Doherty, G. Machine learning in mental health. ACM Trans. Comput. Hum. Interact. 2020, 27, 1–53. [Google Scholar] [CrossRef]
- Librenza-Garcia, D.; Kotzian, B.J.; Yang, J.; Mwangi, B.; Cao, B.; Pereira Lima, L.N.; Bermudez, M.B.; Boeira, M.V.; Kapczinski, F.; Passos, I.C. The impact of machine learning techniques in the study of bipolar disorder: A systematic review. Neurosci. Biobehav. Rev. 2017, 80, 538–554. [Google Scholar] [CrossRef] [PubMed]
- de Filippis, R.; Carbone, E.A.; Gaetano, R.; Bruni, A.; Pugliese, V.; Segura-Garcia, C.; De Fazio, P. Machine learning techniques in a structural and functional MRI diagnostic approach in schizophrenia: a systematic review. Neuropsychiatr. Dis. Treat. 2019, 15, 1605–1627. [Google Scholar] [CrossRef]
- Marateb, H.R.; Tasdighi, Z.; Mohebian, M.R.; Naghavi, A.; Hess, M.; Motlagh, M.E.; Heshmat, R.; Mansourian, M.; Mananas, M.A.; Binder, H.; et al. Computer-aided diagnosis of psychiatric distress in children and adolescents using deep interaction networks: The CASPIAN-IV study. Res. Square 2020. [Google Scholar] [CrossRef]
- Collins, G.S.; Moons, K.G.M. Reporting of artificial intelligence prediction models. Lancet 2019, 393, 1577–1579. [Google Scholar] [CrossRef]
- Zamanipoor Najafabadi, A.H.; Ramspek, C.L.; Dekker, F.W.; Heus, P.; Hooft, L.; Moons, K.G.M.; Peul, W.C.; Collins, G.S.; Steyerberg, E.W.; van Diepen, M. TRIPOD statement: a preliminary pre-post analysis of reporting and methods of prediction models. BMJ Open 2020, 10, e041537. [Google Scholar] [CrossRef] [PubMed]


| References | Goal | Sample Size | Data | Classifier | Internal, External, Validation | Type of Validation | Performance Indices |
|---|---|---|---|---|---|---|---|
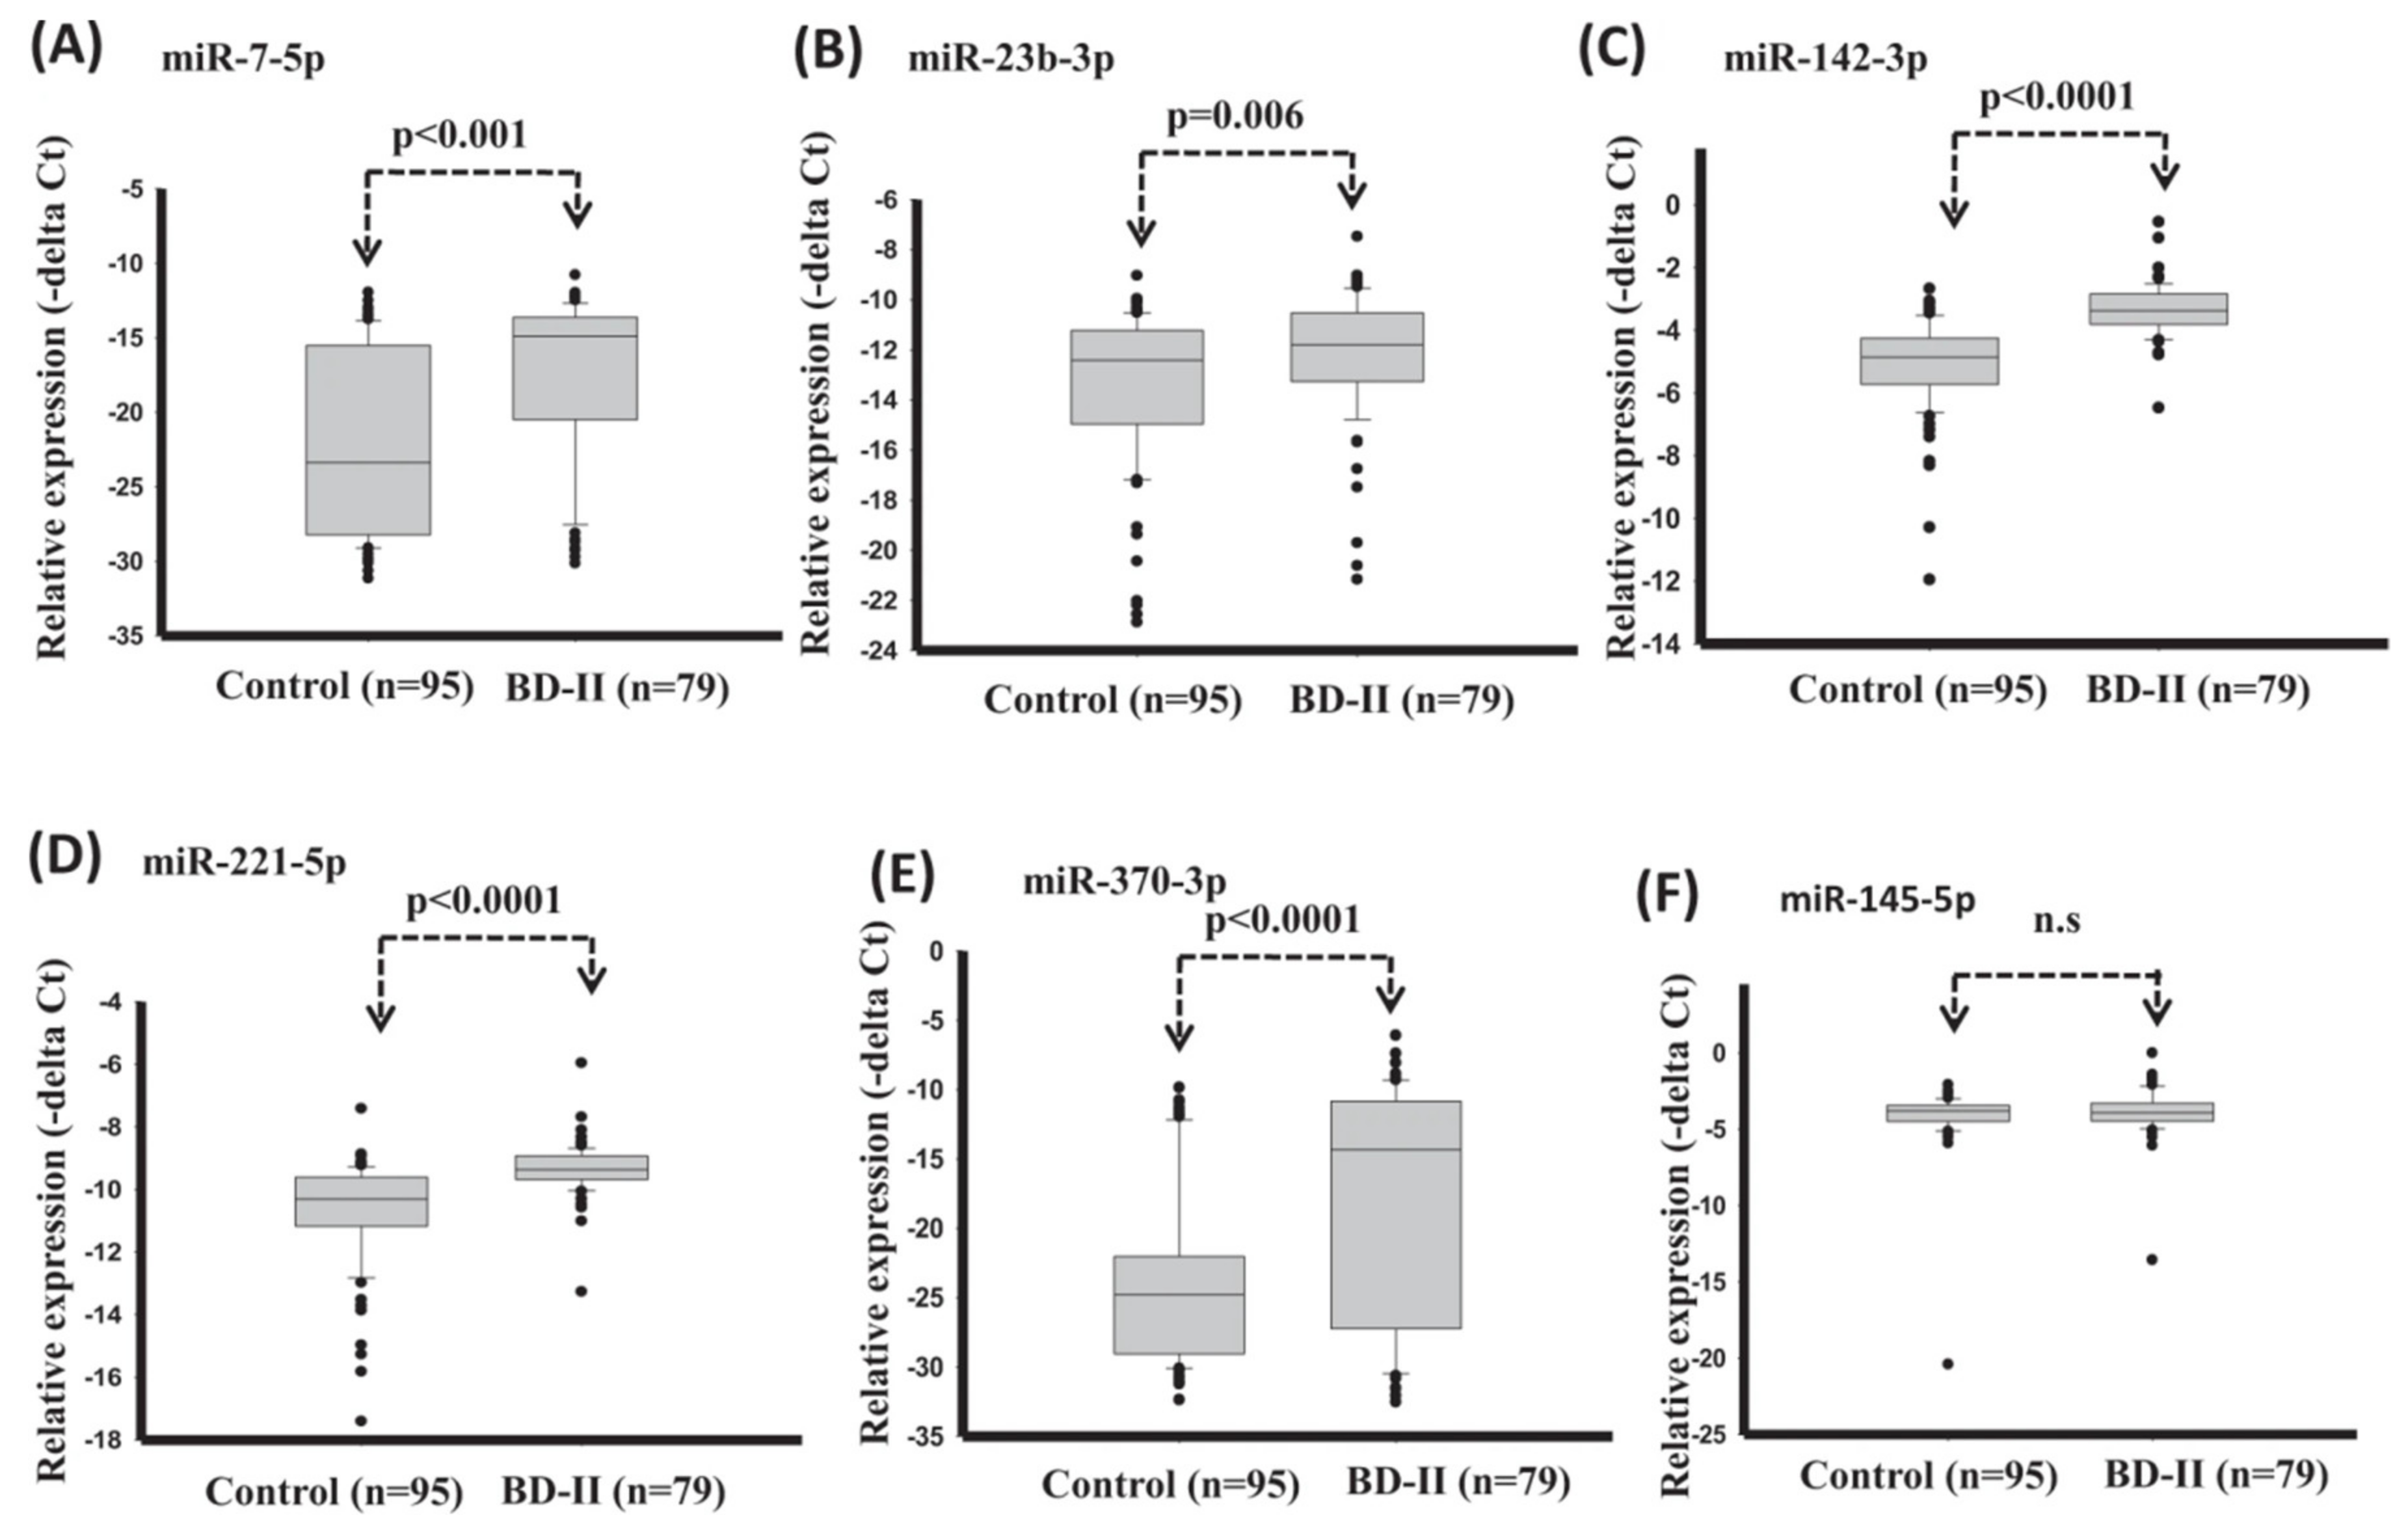
| Lee et al. (2020) [62] | BD-II | (BD-II: n = 20, C: n = 20 | Blood sample, Serum miRNA | Support vector machine (SVM) | Internal | Holdout | AUC: 0.91 |
| Alici et al. (2019) [63] | BD | BD = 80, C = 80 | Optical coherence tomography | logistic regression analysis | - | - | AUC: 0.69 |
| Zhao et al. (2016) [64] | major depressive disorder (MDD) and BD | C = 44, MDD = 37 BD = 24 | Blood sample | logistic regression | - | - | AUC: 0.86 |
| Haenisch et al. (2016) [65] | BD | C = 44 l, BD = 66 (validation) Test: (First-onset MDD = 90, un-diagnosed BD = 12, C = 184 Pre-diagnostic = 110) | Blood sample | lasso regression | Both | 10-fold CV | AUC: 0.8 (BD vs. first onset MDD), AUC: 0.79 (BD vs. C) |
| Fernandes et al. (2020) [66] | BD or SZ | blood-based domain = 323 (BD = 121, SZ = 71, C = 131), cognitive domain = 372 (SZ = 84, C = 171), multi-domain composed by the immune blood-based domain plus the cognitive domain = 279 (BD = 98, SZ = 5, C = 123) | peripheral blood sample cognitive biomarkers | linear discriminative analysis (LDA) | Internal | 10-fold CV | (BD vs. C) Accuracy: 80, AUC: 0.86 (SZ vs. C) Accuracy: 86.18, AUC: 0.89 (BD vs. SZ) Accuracy: 76.43, AUC: 0.80 |
| Tsujii et al. (2019) [67] | Distinguishing BD and MDD | 58 healthy C: 58 BD: 79 MDD: 44 | Blood sample, NIRS | Logistic Regression Analysis | - | - | AUC: 0.92 |
| Faurholt-Jepsen et al. (2019) [68] | BD | BD (Euthymia, Depression, Mania): 29, C: 37 | objective smartphone data reflecting behavioral activities | Gradient boosting | Internal | 10-fold CV (random oversampling, sampling the minority class with replacement) | AUC: 0.66 |
| References | Goal | Sample Size | Data | Classifier | Internal, External, Validation | Type of Validation | Index (the Best Result) |
|---|---|---|---|---|---|---|---|
| Tasic et al. (2019) [69] | diagnosis between SZ and BD | SZ = 54 euthymic outpatients with BD type 1 (BD) = 68, C = 60 | blood serum samples; NMR | PLS-DA (Partial Least Squares Discriminant Analysis) | Internal | CV | AUC: 1 (SZ and HC), AUC: 0.87 (BD and HC), AUC: 9.93 (SZ and BD) |
| Munkholm et al. (2019) [70] | diagnostic test in BD | BD = 33, C = 35 | blood and urine sample (211 sample, 140 BD, 71 C) | composite biomarker score | Internal | Holdout (50%) | AUC: 0. 95 |
| Alimardani et al. (2018) [71] | Classification of BD and SZ | SZ = 23 BD = 23 | SSVEP (number of channels = 21) | k-nearest neighbor | Internal | Leave one-out CV | accuracy: 91.30% |
| Wang et al. (2020) [72] | Classification of Unmedicated BD | unmedicated BD II = 90 C = 117 | rs-fMRI | Support vector machine (SVM) | Internal | Holdout Train (BD (n = 72), HC (n = 94)) Test (BD (n = 18), C (n = 23)) | accuracy: 80% AUC: 0.838 |
| Ogruc Ildiz et al. (2020) [73] | schizophrenia (SZ) and phases of BD | 40 to manic episode (BD-M) and depressive episode (BD-D), 60 to the SZ, euthymic (BD-E), C | blood serum Raman spectra | Partial Least Squares Discriminant Analysis (PLS-DA) | Internal | holdout | Accuracy: 99% |
| Achalia et al. (2020) [74] | BD | Type I BD = 30 HC = 30 | T1 weighted three-dimensional MR images and rs-fMRI | Support vector machine (SVM) | Internal | CV | accuracy: 88% |
| Wu et al. (2016) [75] | BD-E | BD-E = 21, demographically matched C = 21 | computerized Cambridge Neurocognitive Test Automated Battery | least absolute shrinkage selection operator (LASSO) | Internal | leave-one -out CV | accuracy: 71%, AUC: 0.71 |
| References | Goal | Sample Size | Data | Classifier | Internal, External, Validation | Type of Validation | Index (the Best Result) |
|---|---|---|---|---|---|---|---|
| Sutcubasi et al. (2019) [76] | BD and SZ | BD = 41, SZ = 39, C = 23 | MRI | artificial neural network (ANN) | Internal | 4-fold CV | accuracy: 81.25% |
| Zeng et al. (2018) [77] | Multi-Site Diagnostic Classification of SZ | 7 sites: patients = 357, C = 377 | fMRI | Discriminant Autoencoder Network with Sparsity constraint (DANS)-SVM | Internal | 10-fold CV leave-site-out | Accuracies of 85% and 81% in multi-site pooling classification and leave-site-out transfer classification |
| Oh et al. (2020) [78] | SZ | Internal: SZ = 443, C = 423 External: SZ = 30, C = 30 | MRI | three-dimensional convolutional neural network (3DCNN) | Both | 10-fold CV | External: accuracy rate: 70%, AUC: 0.72 internal: AUC: 0.959 overall accuracy rate: 97% |
| Aslan et al. (2020) [79] | SZ | two separate sets of data (children and adult) Dataset A: C = 39 SZ = 45, Dataset B: C = 14 SZ = 14 | EEG 16/19 electrode | Convolutional Neural Network architecture (VGG-16) | Internal | Holdout (80% train, 20% test) | accuracy of 95% and 97% in two datasets AUC: 0.95 and 0.974 |
| Shalbaf et al. (2020) [80] | SZ | C = 14 SZ = 14 | EEG 19 channel | ResNet-18-SVM | Internal | 10-fold CV | accuracy: 99% |
| Naira et al. (2019) [81] | SZ and C | C = 39 SZ = 45 | EEG 16 channel | CNN | Internal | Holdout (96% train, 4% test) | Accuracy: 90% |
| Rozycki et al. (2018) [82] | SZ | 5 sites: (941 adult participants, SZ = 440 | MRI | SVM | Internal | 10-fold CV & leave-site-out | cross-validated prediction accuracy: 76% (AUC: 0.84) leave-site-out validation accuracy/AUC range of 72–77%/0.73–0.91 |
| Shim et al. (2016) [83] | SZ | SZ = 34 HC = 34 | EEG 62 electrode | support vector machine (SVM) | Internal | leave-one-out CV | accuracy: 88% |
| References | Goal | Sample Size | Data | Classifier | Internal, External, Validation | Type of Validation | Index (the Best Result) |
|---|---|---|---|---|---|---|---|
| Winterburn et al. (2019) [84] | SZ and C | 435 subjects total | MRI | support vector machines (SVM) | Internal | 10-fold CV, and a held-out (2:1 ratio) | accuracy: 74% |
| Lin et al. (2018) [85] | SZ | SZ = 89 HC = 60 | Blood sample | naive Bayes model | Internal | 10-fold CV | AUC = 0.94 |
| Cai et al. (2020) [86] | SZ | Internal: SZ = 51 HC = 51 External: SZ = 34 HC = 27 | rs-fMRI | linear discriminant analysis (LDA) | Both | Leave one out CV | Accuracy Internal: 0.725, External: 0.70 |
| Qureshi et al. (2017) [87] | SZ | Normal control = 72 SZ = 72 | rs-fMRI & sMRI | Extreme Learning Machine Classifier (ELM) | Internal | 10-by-10-fold CV | Train accuracy = 0.99 Test accuracy: 0.99 |
| Juneja et al. (2018) [88] | SZ | D1: C = 34, SZ = 34 D2: C = 25, SZ = 25 | fMRI | SVM | Internal | Leave one out CV | Accuracy: D1: 97% D2: 98% |
| de Boer (2020) [89] | SZ | SZ = 26, C = 22 | Subject speech | logistic regression model | - | - | AUC: 0.86 |
| Oh et al. (2019) [90] | Automated Diagnosis of SZ | C = 14 SZ = 14 | EEG 19 electrode | CNN (Convolutional Neural Network) | Internal | non-subject based testing (10-fold CV) and subject-based testing (14-fold CV) | accuracy of 98% for non-subject-based testing, accuracy of 81%, for subject-based testing |
| Santos-Mayo et al. (2017) [91] | SZ | SZ = 16 C = 31 | EEG 17 electrode | SVM & Multilayer Perceptron (MLP) | Internal | Holdout | AUC: 0.96 (Total-15HzJ5-MLP&SVM), AUC: 0.98, Right Hemisphere35Hz-J5-SVM) |
| Chatterjee (2018) et al. [92] | SZ | D1: SZ = 30, C = 30 D2: SZ = 25, C = 25 | fMRI | SVM | Internal | Leave-One-Out CV | Mean classification accuracy D1 99.5% D2 97.4% |
| References | Goal | Sample Size | Data | Classifier | Internal, External, Validation | Type of Validation | Index (the Best Result) |
|---|---|---|---|---|---|---|---|
| Ding et al. (2020) [93] | depression recognition (Depression and Normal) | Depression-prone = 108 C = 585 | Internet behavior characteristics of Internet users on social media | DISVM (deep integrated support vector Machine) | Internal | Holdout | accuracy P (Precision) = 86% |
| Li et al. (2019) [94] | Mild depression | depressed = 24 C = 27 | EEG signals (Number of channels = 128) | convolutional neural network (CNN) | Internal | 24-fold CV | accuracy = 86% |
| Byeon et al. (2017) [95] | Depression | of 9024, subjects (depression = 2627) | general characteristics, economic level, employment, health, and health care, and marriage | Chi-Squared Automatic Interaction Detection (CHAID) | Internal | 10-fold CV | predictive accuracy of the model was 74%, |
| Kautzky et al. (2017) [96] | Depression | C = 62 acutely depressed = 19 | PET using the radioligand [carbonyl-11C] | randomForest (RF) and (SVM) | Internal | 10-fold CV | RF reached an accuracy around 0.725 for all samples (vs 0.750 for SVM) |
| Lin et al. (2018) [97] | Predict MCI-to-AD conversion | 188 AD, 229 NC, and 401 MCI subjects | MRI data | convolutional neural networks (CNN) extreme learning machine | Internal | leave-one-out CV | accuracy: 80% , AUC: 0.86 |
| Ding et al. (2018) [98] | AD classification (Normal, Very mild AD, Mild AD, Moderate AD) | 861 participants in the non-imaging dataset 613 participants in brain imaging (MRI) dataset, 207 participants in PET data | Demographics, medical history, ApoE genotype, psychological/functional assessments, blood analyses, and clinical diagnoses. brain imaging dataset (structural MRI and PET data) | Bayesian network (BN) | Internal | Holdout (90% 10-fold CV, 10% test), Resampling: Synthetic minority oversampling technique (SMOTE) | AUC: 0.91 |
| References | Goal | Sample Size | Data | Classifier | Internal, External, Validation | Type of Validation | Index (the Best Result) |
|---|---|---|---|---|---|---|---|
| Lu et al. (2018) [99] | Early Diagnosis of AD ((Normal controls (NC), stable MCI (sMCI), the progressive MCI (pMCI), AD clinically diagnosed | 1051 subjects NC = 304 sMCI = 409 pMCI = 112 probable AD = 226 | FDG-PET images and structural MRI | ensemble multiple classifiers (Multiscale Deep Neural Networks) | Internal | Holdout (10-fold CV in training) | Accuracy: 94%, NC vs. AD, Accuracy: 82%, sMCI vs. pMCI and Accuracy: 83%, sMCI vs. pMCI with sample from NC & AD |
| Fiscon et al. (2018) [100] | Classifying AD (AD,MCI,C) | C = 23, MCI = 37, AD = 49 | multi-channel EEG signals 19 electrode | Decision Trees classifiers | Internal | leave-one-out CV | Accuracy: 92% for HC vs. MCI, Accuracy: 83% for HC vs. AD, Accuracy: 73% for HC vs. CASE (MCI+AD), and accuracy: 79% for MCI vs. AD |
| Aidos et al. (2017) [101] | Predicting AD (Cl, MCI, and AD) | 58 subjects for AD with four images each, 88 subjects with MCI with six images each, and 60 subjects for CN with five images each | FDG-PET scans | SVM with an RBF kernel | Internal | Repeated Holdout-20 times (70% training 10-fold CV, 30% test) | in a multiclass classification task, 59% accuracy at baseline and goes up to 69% in the follow-up |
| References | Goal | Sample Size | Data | Classifier | Internal, External, Validation | Type of Validation | Index (the Best Result) |
|---|---|---|---|---|---|---|---|
| Bin-Hezam et al. (2019) [102] | Detecting Dementia based on risk factors | 1812 subjects | Demographics and Medical History | logistic regression & random forest | Internal | Holdout (StratifiedKFold 75% train, 25% test) and 10-Fold CV | Accuracy: 91.53%, (dementia vs. non-dementia), Accuracy: 77%, (multi-class prediction (CN vs. MCI vs. dementia) |
| Zhou et al. (2016) [103] | Predictors of hospital admission of patients with dementia Health and dementia | 59,298 dementia patients (30,178 were admitted to hospital and 29,120 remained with GP care) | initial GP read codes, diagnostic events, five medication events, three procedural events, sex, age | neural network with entropy regularization | Internal | 10-fold cross-validation | AUC: 0.76 |
| Choi et al. (2018) [104] | A diagnostic framework for dementia (normal vs. dementia) | 2666 cognitively normal elderly = 2666 dementia patients = 435 | Mini-Mental Status Examination (MMSE) as a screening test, KLOSCAD-N assessment | deep neural networks (DNNs) | Internal | Holdout (80% training (5-fold CV), 20% test) | Accuracy of 93%, |
| Moreira et al. (2016) [105] | Diagnosis of patients with clinical suspicion of dementia | AD = 209 MCI = 97, Others = 218) | Demographic, clinical, and screening tests | J48 (decision tree algorithm C4.5) | Internal | Holdout (75% train, 25% test) Resampling: SMOTE just for MCI | AD Accuracy:80%, AUC: 0.849, MCI Accuracy:91% |
| Bang et al. (2017) [106] | Dementia diagnosis normal groups and dementia groups | 14,917 participants | Clinical data called CREDOS | Support Vector Machine (SVM) | Internal | Holdout (40% for training, 30% for test and 30% for validation) | AUC: 0.96 Accuracy: 90% |
| References | Goal | Sample Size | Data | Classifier | Internal, External, Validation | Type of Validation | Index (the Best Result) |
|---|---|---|---|---|---|---|---|
| Walsh et al. (2017) [107] | suicide | 5167 adult patients 3250 patients made a suicide attempt (cases), and 1917 controls | (a) demographic data (b) diagnoses based on claims data (c) past health care utilization (d) evidence of prior suicide attempts (e) body mass index (f) socioeconomic status (g) medication data | Random forests | Internal | boot strapping (rep = 100) | AUC: 0.84 |
| Walsh et al. (2018) [108] | Suicide | 496 adolescents with other self-injury (OSI), 7059 adolescents with depressive symptoms, and 25,081 controls | longitudinal clinical data in adults: diagnostic, demographic, medication, and socioeconomic factors | random forests | Internal | boot strapping | OSI C (AUC = 0.83) at 720 days; AUC = 0.85 at 7 days) and depressed C (AUC = 0.87), depressed C (AUC = 0.87) and 0.90 at 720 days at 7 days) General hospital C (AUC 0.94 at 1720 days, 0.97 at 7 days). |
| Just et al. (2017) [40] | suicidal ideation | Internal: (17 suicidal ideation versus 17 Controls External: 21 suicidal ideation | fMRI | Gaussian Naive Bayes (GNB) | both | leave out half of the participants from each group | suicidal vs. C accuracy of 0.91, those had previously attempted those who had not (accuracy of 0.94) External: suicidal ideation from C accuracy of 0.87 |
| Cheng et al. (2017) [109] | Suicide Risk assessment | 974 Weibo users | Weibo posts | Support Vector Machine (SVM) | internal | leave-one-out | AUC: 0.6 |
| Oh et al. (2017) [110] | Suicide | Patients with depression and anxiety disorders (n = 573) | 31 psychiatric scales and 10 sociodemographic elements | artificial neural network | Internal | Hold out | (1-month) accuracy: 93.7%., AUC: 0.93, (1-year): 90.8%, AUC: 0.87, (lifetime) Accuracy: 87.4%, AUC: 0.89 |
| Hettige et al. (2017) [111] | Suicide attempters in schizophrenia | 345 participants | clinical, demographic, and sociocultural | Regularized logistic regression | internal | Stratified 10-fold CV | accuracy: 67% AUC: 0.71 |
| References | Goal | Sample Size | Data | Classifier | Internal, External, Validation | Type of Validation | Index (the Best Result) |
|---|---|---|---|---|---|---|---|
| Ryu et al. (2018) [112] | Suicide | 11,628 individuals (5814 suicide) | Korea National Health and Nutrition Examination Survey (KNHANES) | random forest | internal | Hold out (training: 10-fold CV) | AUC = 0.85 accuracy of 0.821 |
| Jung et al. (2019) [113] | adolescents of high-risk suicide | n = 59,984 (7443 adolescents with a history of suicide) | Korean Young Risk Behavior Web-based Survey (KYRBWS) | extreme gradient boosting (XGB) | internal | 5-fold CV | Accuracy:79% AUC = 0.86 |
| Lin et al. (2020) [114] | Suicide | 3546 military men and women | The questionnaire for the military personnel composed of five psychopathological domains, anxiety, depression, hostility, interpersonal sensitivity and insomnia) | SVM And multilayer perceptron | internal | 10-fold CV | Accuracy:100% AUC:100% |
| Su et al. (2020) [115] | Suicide in children and adolescents | Suicide-positive subjects (n = 180) Suicide-negative subjects (n = 41,541) | Longitudinal clinical records demographics, diagnosis, laboratory tests, and medications | logistic regression | internal | Repeated Hold out: 10 times (90% training) | AUC: 0.86 |
| Choi et al. (2018) [116] | Suicide | 819,951 subjects Suicidal death No (n = 817,405) Yes (n = 2546) | qualification and medical services claim data | Cox regression, SVM and deep neural networks (DNNs) | internal | Hold out (70% training, 30% validation) | AUC of Cox regression: 0.688, of SVM: 0.687, of DNN 0.683 |
| Chen et al. (2020) [117] | Suicide | 541,300 inpatient | demographic characteristics, socioeconomic | ensemble learning of elastic net penalized logistic regression, random forest, gradient boosting, and a neural network | internal | Hold out (80% training, 20% test) (training: 10-fold CV) | AUC = 0.88 |
| References | Goal | Sample Size | Data | Classifier | Internal, External, Validation | Type of Validation | Index (the Best Result) |
|---|---|---|---|---|---|---|---|
| Edgcomb et al. (2021) [118] | Differentiate Risk of Suicide Attempt and Self-harm | 1628 women (University of California Los Angeles) 140,848 women (New York City Clinical Data Research Network) | Sociodemographic data, medications, health care utilization, and diagnostic codes | decision tree | internal | 10-fold CV | University of California Los Angeles (Accuracy: 84%, AUC: 0.73) New York City Clinical Data Research Network (Accuracy: 84%, AUC: 0.71) |
| Agne et al. (2020) [41] | suicide attempt in patients with obsessive-compulsive disorder | 959 outpatients with OCD | clinical and sociodemographic variables | elastic net | internal | Hold out (75% training, 25% test) (10-fold CV in training) | AUC: 0.95 accuracy: 85.97% |
| Haroz et al. (2020) [119] | Identify patients with the highest risk for suicide | n = 2390 individuals | demographics, educational history, past mental health, and substance use | regularized regression using ridge regression | internal | Hold out (train, test: two-thirds/one-third split) | AUC = 0.87 |
| Ryu et al. (2019) [120] | Suicide | 5773 subjects | Korea National Health and Nutrition Examination Survey (KNHANES) | random forest | internal | Hold out (Train 70%, test 30%) (training 10-fold CV) | AUC = 0.947 accuracy: 0.889 |
| Miché et al. (2020) [121] | Suicide | n = 2797 adolescents and young adults aged 14–24 years | demographics, cognitive abilities, family history of psychopathology, general psychopathology, psychosis, prior self-injurious thoughts or behaviors, social factors, and treatment history | logistic regression, lasso, ridge, and random forest | internal | repeated nested 10-fold CV | mean AUCs of logistic regression, lasso, ridge, and random forest, were 0.828, 0.826, 0.829, and 0.824, respectively |
| Shen et al. (2020) [122] | Suicide | 4882 medical students | Self-report data on sociodemographic and clinical characteristics were collected online via the website or through the widely used social media app, WeChat | random forest | internal | 5-fold CV | (AUC) = 0.9255 Accuracy: 90.1% |
| References | Goal | Sample Size | Data | Classifier | Internal, External, validation | Type of Validation | Index (the Best Result) |
|---|---|---|---|---|---|---|---|
| Parghi et al. (2020) [123] | near-term suicidal behavior | n = 591, attempted: n = 20, those who did not (n = 571) | Suicide Crisis Inventory (SCI) data, which measures the Suicide Crisis Syndrome, a presuicidal mental state | gradient boosting | internal | enhanced bootstrap | Accuracy 0.981 |
| Naghavi et al. (2020) [42] | Suicide | 573 university students | Different types of Questionnaire | decision trees | internal | 3-fold CV | AUC = 0.90 |
| Cohen et al. (2020) [124] | Suicide | Internal (ACT Study, STM Study) External (267 interviews, 60 students, 29 students indicating suicide or self-harm risk) | language samples, depression, and standardized suicidality scale scores, and therapist impression of the client’s mental state | extreme gradient boosting | both | Leave-one-site-out | AUC: 0.78 |
| Zheng et al. (2020) [125] | Suicide | The retrospective cohort (118,252 individuals, cases: 255) The validation cohort (118,095 individuals, cases: 203) | Electronic health records (EHRs) | Deep neural network | both | CV | AUC: 0.77 |
| Tadesse et al. (2020) [126] | Suicide Ideation in Social Media Forums | 3549 suicide-indicative posts, 3652 non-suicidal posts | Reddit social media dataset | LSTM-CNN Long Short-Term Memory Convolutional Neural Network | Internal | CV | Accuracy: 93.8 |
Publisher’s Note: MDPI stays neutral with regard to jurisdictional claims in published maps and institutional affiliations. |
© 2021 by the authors. Licensee MDPI, Basel, Switzerland. This article is an open access article distributed under the terms and conditions of the Creative Commons Attribution (CC BY) license (http://creativecommons.org/licenses/by/4.0/).
Share and Cite
Mansourian, M.; Khademi, S.; Marateb, H.R. A Comprehensive Review of Computer-Aided Diagnosis of Major Mental and Neurological Disorders and Suicide: A Biostatistical Perspective on Data Mining. Diagnostics 2021, 11, 393. https://doi.org/10.3390/diagnostics11030393
Mansourian M, Khademi S, Marateb HR. A Comprehensive Review of Computer-Aided Diagnosis of Major Mental and Neurological Disorders and Suicide: A Biostatistical Perspective on Data Mining. Diagnostics. 2021; 11(3):393. https://doi.org/10.3390/diagnostics11030393
Chicago/Turabian StyleMansourian, Mahsa, Sadaf Khademi, and Hamid Reza Marateb. 2021. "A Comprehensive Review of Computer-Aided Diagnosis of Major Mental and Neurological Disorders and Suicide: A Biostatistical Perspective on Data Mining" Diagnostics 11, no. 3: 393. https://doi.org/10.3390/diagnostics11030393
APA StyleMansourian, M., Khademi, S., & Marateb, H. R. (2021). A Comprehensive Review of Computer-Aided Diagnosis of Major Mental and Neurological Disorders and Suicide: A Biostatistical Perspective on Data Mining. Diagnostics, 11(3), 393. https://doi.org/10.3390/diagnostics11030393