
Deformation Parameters of the Heart in Endurance Athletes and in Patients with Dilated Cardiomyopathy—A Cardiac Magnetic Resonance Study

 ,
,  and
and
Abstract
1. Introduction
2. Materials and Methods
2.1. Study Groups
2.2. CMR Study and Analysis
2.3. Statistical Methods
3. Results
3.1. Baseline Characteristics
3.2. Deformation Mechanics of the LV
3.3. Deformation Mechanics of the RV
3.4. Discriminating Ability of the Analysed Parameters
3.5. Inter-Reader Variability
4. Discussion
5. Conclusions
Supplementary Materials
Author Contributions
Funding
Institutional Review Board Statement
Informed Consent Statement
Data Availability Statement
Conflicts of Interest
References
- Pelliccia, A.; Culasso, F.; Di Paolo, F.M.; Maron, B.J. Physiologic Left Ventricular Cavity Dilatation in Elite Athletes. Ann. Intern. Med. 1999, 130, 23–31. [Google Scholar] [CrossRef] [PubMed]
- Pelliccia, A.; Maron, B.J.; Spataro, A.; Proschan, M.A.; Spirito, P. The Upper Limit of Physiologic Cardiac Hypertrophy in Highly Trained Elite Athletes. N. Engl. J. Med. 1991, 324, 295–301. [Google Scholar] [CrossRef] [PubMed]
- Małek, Ł.A.; Barczuk-Falęcka, M.; Werys, K.; Czajkowska, A.; Mróz, A.; Witek, K.; Burrage, M.; Bakalarski, W.; Nowicki, D.; Roik, D.; et al. Cardiovascular magnetic resonance with parametric mapping in long-term ultra-marathon runners. Eur. J. Radiol. 2019, 117, 89–94. [Google Scholar] [CrossRef] [PubMed]
- Pluim, B.M.; Zwinderman, A.H.; van der Laarse, A.; van der Wall, E.E. The athlete’s heart: A meta-analysis of cardiac structure and function. Circulation 2000, 101, 336–344. [Google Scholar] [CrossRef] [PubMed]
- Abulí, M.; De La Garza, M.S.; Sitges, M. Differentiating Athlete’s Heart from Left Ventricle Cardiomyopathies. J. Cardiovasc. Transl. Res. 2020, 13, 1–9. [Google Scholar] [CrossRef]
- Harmon, K.G.; Drezner, J.A.; Maleszewski, J.J.; Lopez-Anderson, M.; Owens, D.; Prutkin, J.M.; Asif, I.M.; Klossner, D.; Ackerman, M.J. Pathogeneses of Sudden Cardiac Death in National Collegiate Athletic Association Athletes. Circ. Arrhythmia Electrophysiol. 2014, 7, 198–204. [Google Scholar] [CrossRef]
- Finocchiaro, G.; Papadakis, M.; Robertus, J.L.; Dhutia, H.; Steriotis, A.K.; Tome, M.; Mellor, G.; Merghani, A.; Malhotra, A.; Behr, E.; et al. Etiology of sudden death in sports: Insights from a United Kingdom Regional Registry. J. Am. Coll. Cardiol. 2016, 67, 2108–2115. [Google Scholar] [CrossRef] [PubMed]
- Sharma, S.; Drezner, J.A.; Baggish, A.; Papadakis, M.; Wilson, M.G.; Prutkin, J.M.; La Gerche, A.; Ackerman, M.J.; Börjesson, M.; Salerno, J.C.; et al. International recommendations for electrocardiographic interpretation in athletes. Eur. Heart J. 2018, 39, 1466–1480. [Google Scholar] [CrossRef]
- Galderisi, M.; Cardim, N.; D’Andrea, A.; Bruder, O.; Cosyns, B.; Davin, L.; Donal, E.; Edvardsen, T.; Freitas, A.; Habib, G.; et al. The multi-modality cardiac imaging approach to the Athlete’s heart: An expert consensus of the European Association of Cardiovascular Imaging. Eur. Heart J. Cardiovasc. Imaging 2015, 16, 353. [Google Scholar] [CrossRef] [PubMed]
- Pelliccia, A.; Caselli, S.; Sharma, S.; Basso, C.; Bax, J.J.; Corrado, D.; D’Andrea, A.; D’Ascenzi, F.; Di Paolo, F.M.; Edvardsen, T.; et al. European Association of Preventive Cardiology (EAPC) and European Association of Cardiovascular Imaging (EACVI) joint position statement: Recommendations for the indication and interpretation of cardio-vascular imaging in the evaluation of the athlete’s heart. Eur. Heart J. 2018, 39, 1949–1969. [Google Scholar] [PubMed]
- Millar, L.M.; Fanton, Z.; Finocchiaro, G.; Sanchez-Fernandez, G.; Dhutia, H.; Malhotra, A.; Merghani, A.; Papadakis, M.; Behr, E.R.; Bunce, N.; et al. Differentiation between athlete’s heart and dilated cardiomyopathy in athletic individuals. Heart 2020, 106, 1059–1065. [Google Scholar] [CrossRef] [PubMed]
- Lang, R.M.; Badano, L.P.; Mor-Avi, V.; Afilalo, J.; Armstrong, A.; Ernande, L.; Flachskampf, F.A.; Foster, E.; Goldstein, S.A.; Kuznetsova, T.; et al. Recommendations for cardiac chamber quantification by echocardiography in adults: An update from the American society of echocardiography and the European association of cardiovascular imaging. Eur. Heart J. Cardiovasc. Imaging 2015, 16, 233–271. [Google Scholar] [CrossRef] [PubMed]
- Maceira, A.M.; Tuset-Sanchis, L.; Lopez-Garrido, M.; San Andreas, M.; Lopez-Lereu, M.P.; Monmeneu, J.V.; Garcia-Gonzalez, M.P.; Higueras, L. Feasibility and reproducibility offeature-tracking-based strain and strain rate measures of the left ventricle in different diseases and genders. J. Magn. Reason. Imaging 2018, 47, 1415–1425. [Google Scholar] [CrossRef]
- Caselli, S.; Montesanti, D.; Autore, C.; Di Paolo, F.M.; Pisicchio, C.; Squeo, M.R.; Musumeci, B.; Spataro, A.; Pandian, N.G.; Pelliccia, A.; et al. Patterns of Left Ventricular Longitudinal Strain and Strain Rate in Olympic Athletes. J. Am. Soc. Echocardiogr. 2015, 28, 245–253. [Google Scholar] [CrossRef] [PubMed]
- Weiner Hutter, A.M., Jr.; Wang, F.; Kim, J.; Weyman, A.E.; Wood, M.J.; Picard, M.H.; Baggish, A.L. The impact of endurance exercise training on left ventricular torsion. JACC Cardiovasc Imaging 2010, 3, 1001–1009. [Google Scholar] [CrossRef] [PubMed]
- Oxborough, D.; Sharma, S.; Shave, R.; Whyte, G.; Birch, K.; Artis, N.; Batterham, A.M.; George, K. The Right Ventricle of the Endurance Athlete: The Relationship between Morphology and Deformation. J. Am. Soc. Echocardiogr. 2012, 25, 263–271. [Google Scholar] [CrossRef]
- Swoboda, P.P.; Erhayiem, B.; McDiarmid, A.K.; Lancaster, R.E.; Lyall, G.K.; Dobson, L.E.; Ripley, D.P.; Musa, T.A.; Garg, P.; Ferguson, C.; et al. Relationship between cardiac deformation parameters measured by cardiovascular magnetic resonance and aerobic fitness in endurance athletes. J. Cardiovasc. Magn. Reson. 2016, 18, 48. [Google Scholar] [CrossRef]
- Tahir, E.; Starekova, J.; Muellerleile, K.; Freiwald, E.; von Stritzky, A.; Munch, J.; Avaneson, M.; Weinrich, J.M.; Stehning, C.; Cavus, E.; et al. Impact of myocardial fibrosis on left ventricular function evaluated by fea-ture-tracking myocardial strain cardiac magnetic resonance in competitive male triathletes with normal ejection fraction. Circ. J. 2019, 83, 1553–1562. [Google Scholar] [CrossRef]
- Kawel-Boehm, N.; Maceira, A.; Valsangiacomo-Buechel, E.R.; Vogel-Claussen, J.; Turkbey, E.B.; Williams, R.; Plein, S.; Tee, M.; Eng, J.; Bluemke, D.A. Normal values for cardiovascular magnetic resonance in adults and children. J. Cardiovasc. Magn. Reson. 2015, 17, 1–33. [Google Scholar] [CrossRef]
- Małek, Ł.A.; Bucciarelli-Ducci, C. Myocardial fibrosis in athletes—Current perspective. Clin. Cardiol. 2020, 43, 882–888. [Google Scholar] [CrossRef]
- Claessen, G.; Schnell, F.; Bogaert, J.; Claeys, M.; Pattyn, N.; De Buck, F.; Dymarkowski, S.; Claus, P.; Carré, F.; Van Cleemput, J.; et al. Exercise cardiac magnetic resonance to differentiate athlete’s heart from structural heart disease. Eur. Hear. J. Cardiovasc. Imaging 2018, 19, 1062–1070. [Google Scholar] [CrossRef]
- Taylor, R.J.; Moody, W.E.; Umar, F.; Edwards, N.C.; Taylor, T.J.; Stegemann, B.; Townend, J.N.; Hor, K.N.; Steeds, R.P.; Mazur, W.; et al. Myocardial strain measurement with feature-tracking cardiovascular magnetic resonance: Normal values. Eur. Heart J. Cardiovasc. Imaging 2015, 16, 871–881. [Google Scholar] [CrossRef] [PubMed]
- Barreiro-Pérez, M.; Curione, D.; Symons, R.; Claus, P.; Voigt, J.-U.; Bogaert, J. Left ventricular global myocardial strain assessment comparing the re-producibility of four commercially available CMR-feature tracking algorithms. Eur. Radiol. 2018, 28, 5137–5147. [Google Scholar] [CrossRef] [PubMed]
- Dobrovie, M.; Barreiro-Pérez, M.; Curione, D.; Symons, R.; Claus, P.; Voigt, J.-U.; Bogaert, J. Inter-vendor reproducibility and accuracy of segmental left ventricular strain measurements using CMR feature tracking. Eur. Radiol. 2019, 29, 6846–6857. [Google Scholar] [CrossRef]
- Pryds, K.; Larsen, A.H.; Hansen, M.S.; Grøndal, A.Y.K.; Tougaard, R.S.; Hansson, N.H.; Clemmensen, T.S.; Løgstrup, B.B.; Wiggers, H.; Kim, W.Y.; et al. Myocardial strain assessed by feature tracking cardiac magnetic resonance in patients with a variety of cardiovascular diseases—A comparison with echocardiography. Sci. Rep. 2019, 9, 1–9. [Google Scholar] [CrossRef]
- Caselli, S.; Di Pietro, R.; Di Paolo, F.M.; Pisicchio, C.; Di Giacinto, B.; Guerra, E.; Culasso, F.; Pelliccia, A. Left ventricular systolic performance is improved in elite athletes. Eur. J. Echocardiogr. 2011, 12, 514–519. [Google Scholar] [CrossRef]
- Geyer, H.; Caracciolo, G.; Abe, H.; Wilansky, S.; Carerj, S.; Gentile, F.; Nesser, H.-J.; Khandheria, B.; Narula, J.; Sengupta, P.P. Assessment of myocardial mechanics using speckle tracking echocardiography: Fun-damentals and clinical applications. J. Am. Soc. Echocardiogr. 2010, 23, 351–369. [Google Scholar] [CrossRef] [PubMed]
- Mahrholdt, H.; Wagner, A.; Judd, R.M.; Sechtem, U.; Kim, R.J. Delayed enhancement cardiovascular magnetic resonance assessment of non-ischaemic cardiomyopathies. Eur. Heart J. 2005, 26, 1461–1474. [Google Scholar] [CrossRef] [PubMed]


| Parameter | Control Group n = 21 | Endurance Group n = 22 | DCM Group n = 22 | p for Trend |
|---|---|---|---|---|
| Age, years (±SD) | 40 ± 12 | 41 ± 6 | 45 ± 12 | 0.271 |
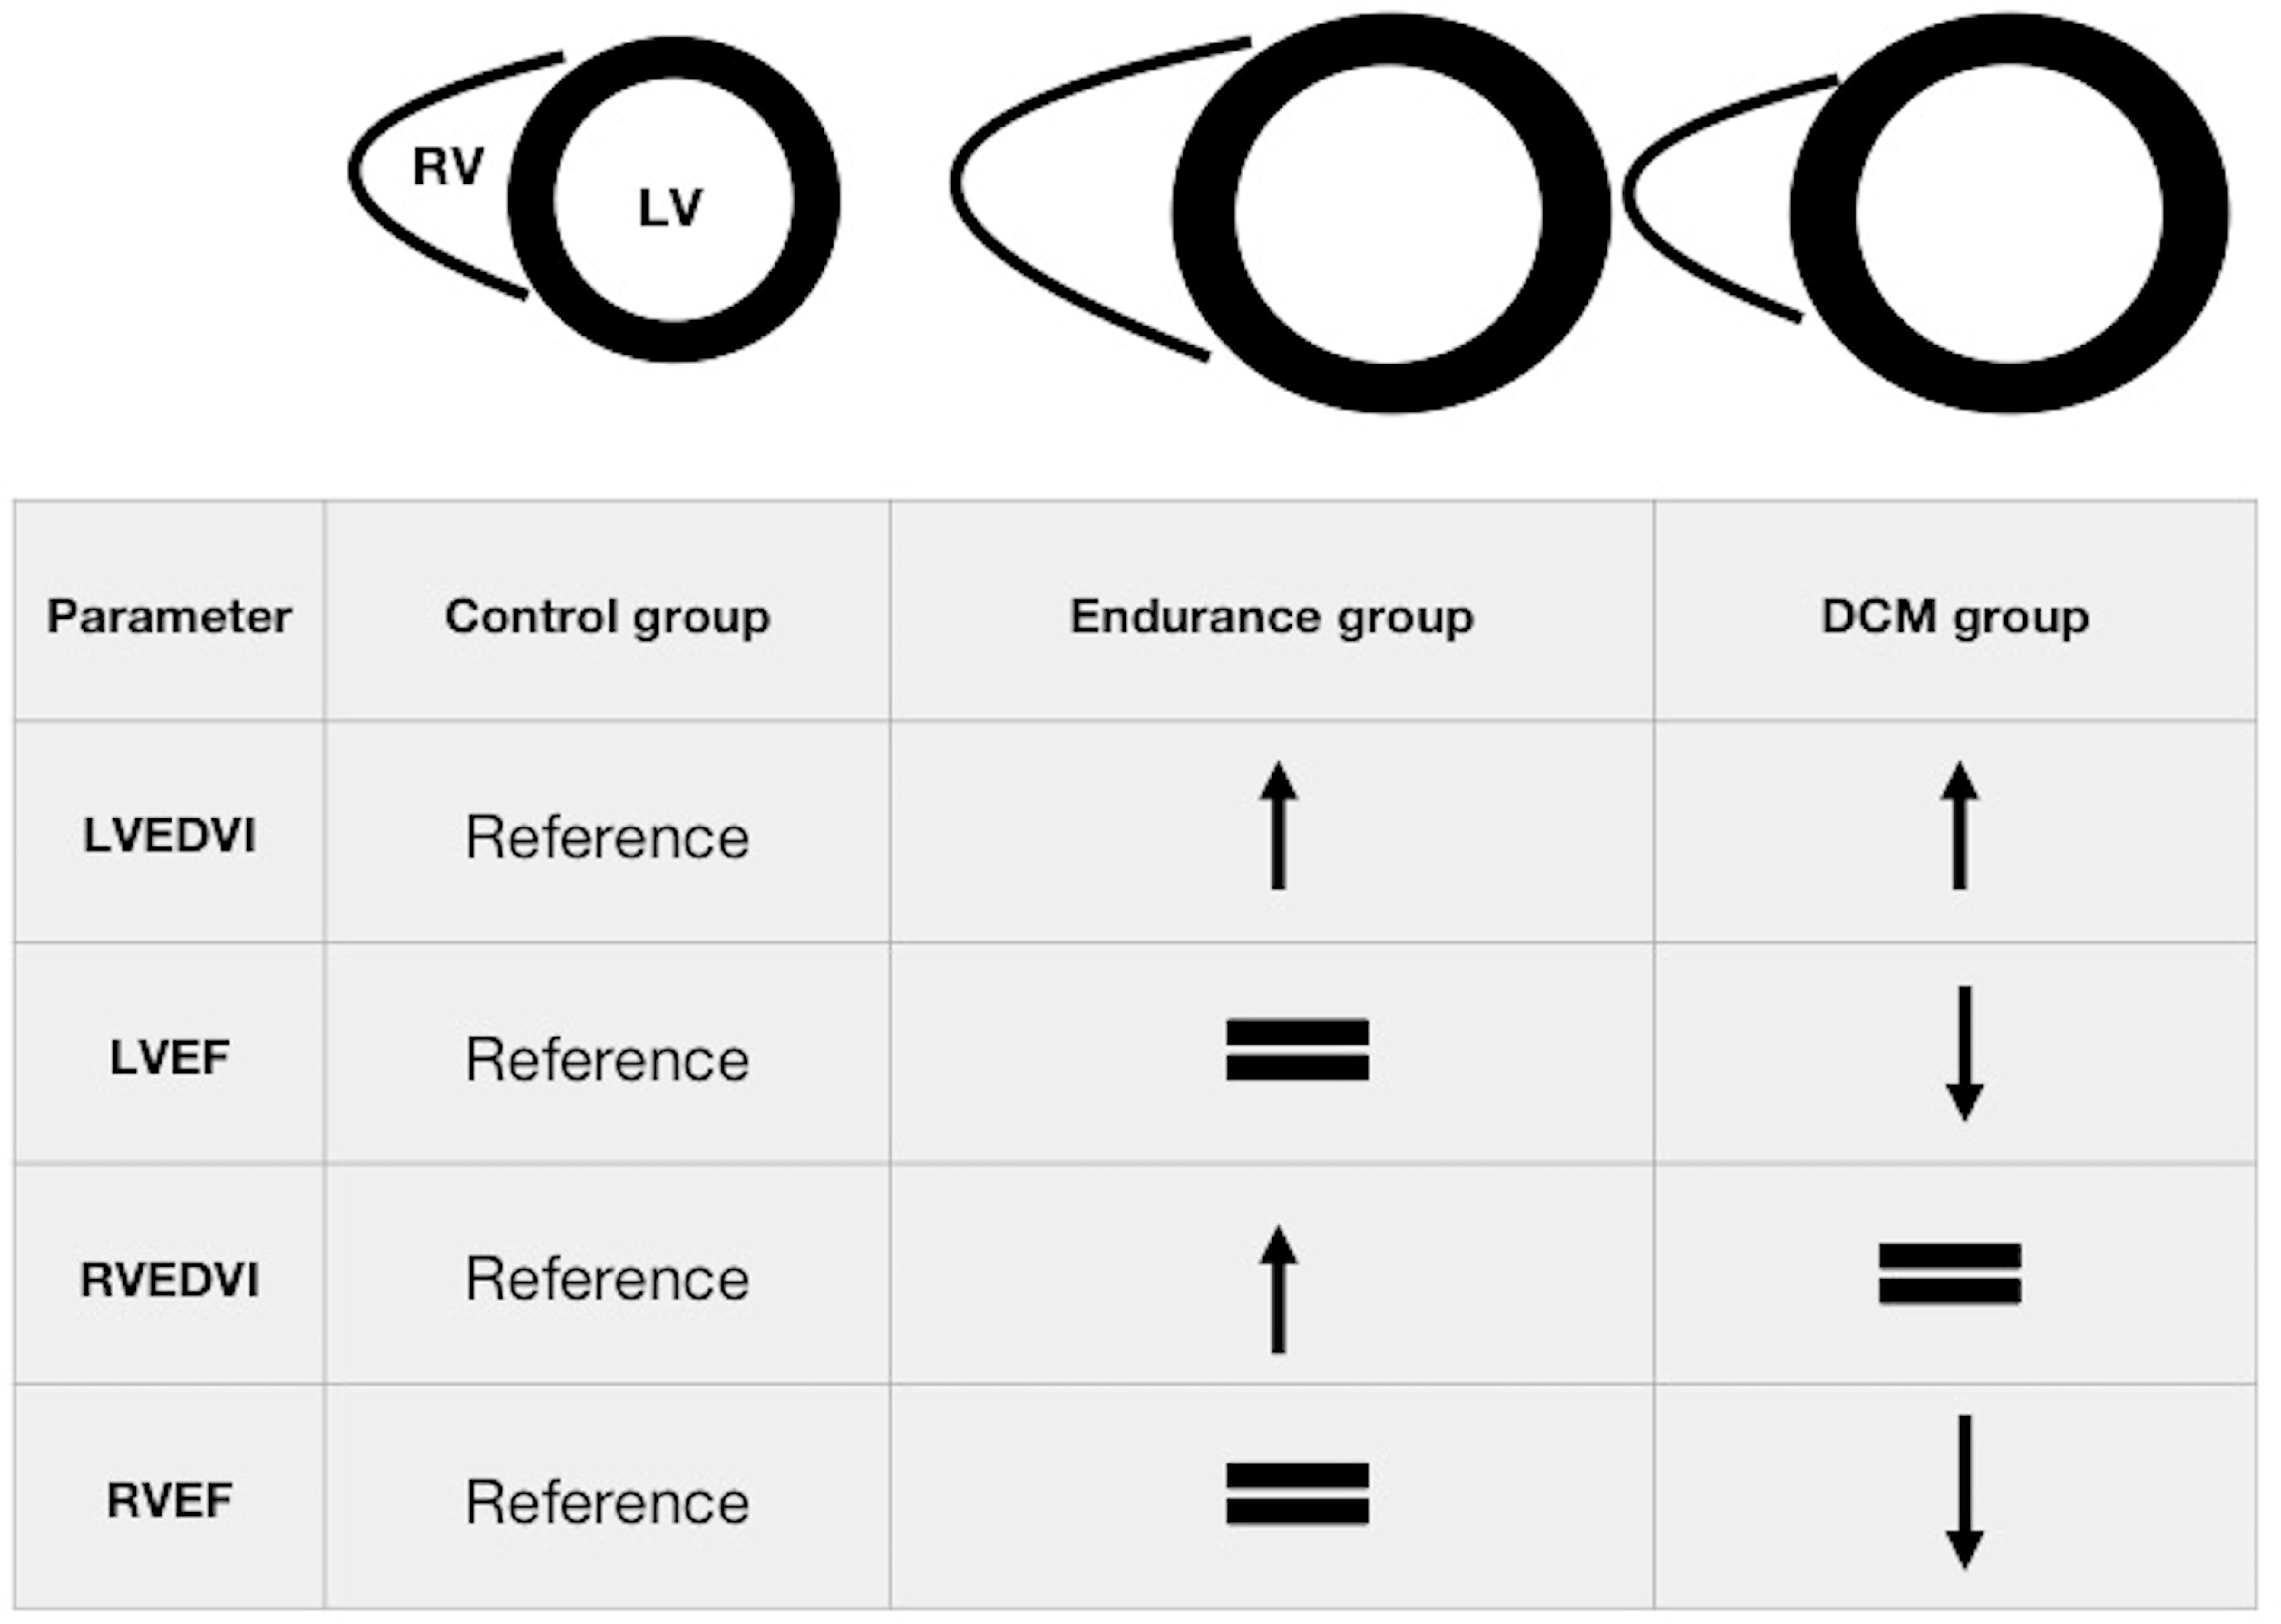
| LVEDVI, mL/m2 (±SD) | 84 ± 15 | 117 ± 10 * | 123 ± 29 * | <0.001 |
| LVESVI, mL/m2 (±SD) | 30 ± 6 | 43 ± 7 | 74 ± 14 | <0.001 |
| LVSVI, mL/m2 (±SD) | 54 ± 10 # | 74 ± 8 | 49 ± 13 # | <0.001 |
| LVEF, % (±SD) | 64 ± 4 ** | 63 ± 4 ** | 41 ± 9 | <0.001 |
| LVMI, g/m2 (±SD) | 68 ± 10 # | 86 ± 11 | 73 ± 14 # | <0.001 |
| RVEDVI, mL/m2 (±SD) | 89 ± 15 # | 132 ± 18 | 88 ± 25 # | <0.001 |
| RVESVI, mL/m2 (±SD) | 39 ± 9 # | 56 ± 11 | 44 ± 14 # | <0.001 |
| RVSVI, mL/m2 (±SD) | 50 ± 10 # | 76 ± 10 | 44 ± 15 # | <0.001 |
| RVEF, % (±SD) | 56 ± 6 ** | 58 ± 5 ** | 49 ± 10 | <0.001 |
| LGE, % Nonischaemic Junction point Inferolateral IVS Ischaemic | 1 (8) 1 1 0 0 0 | 4 (28) 4 3 1 0 0 | 11 (50) 11 1 4 6 0 | 0.003 |
| Parameter | Control Group n = 21 | Endurance Group n = 22 | DCM Group n = 22 | p for Trend |
|---|---|---|---|---|
| Left Ventricle | ||||
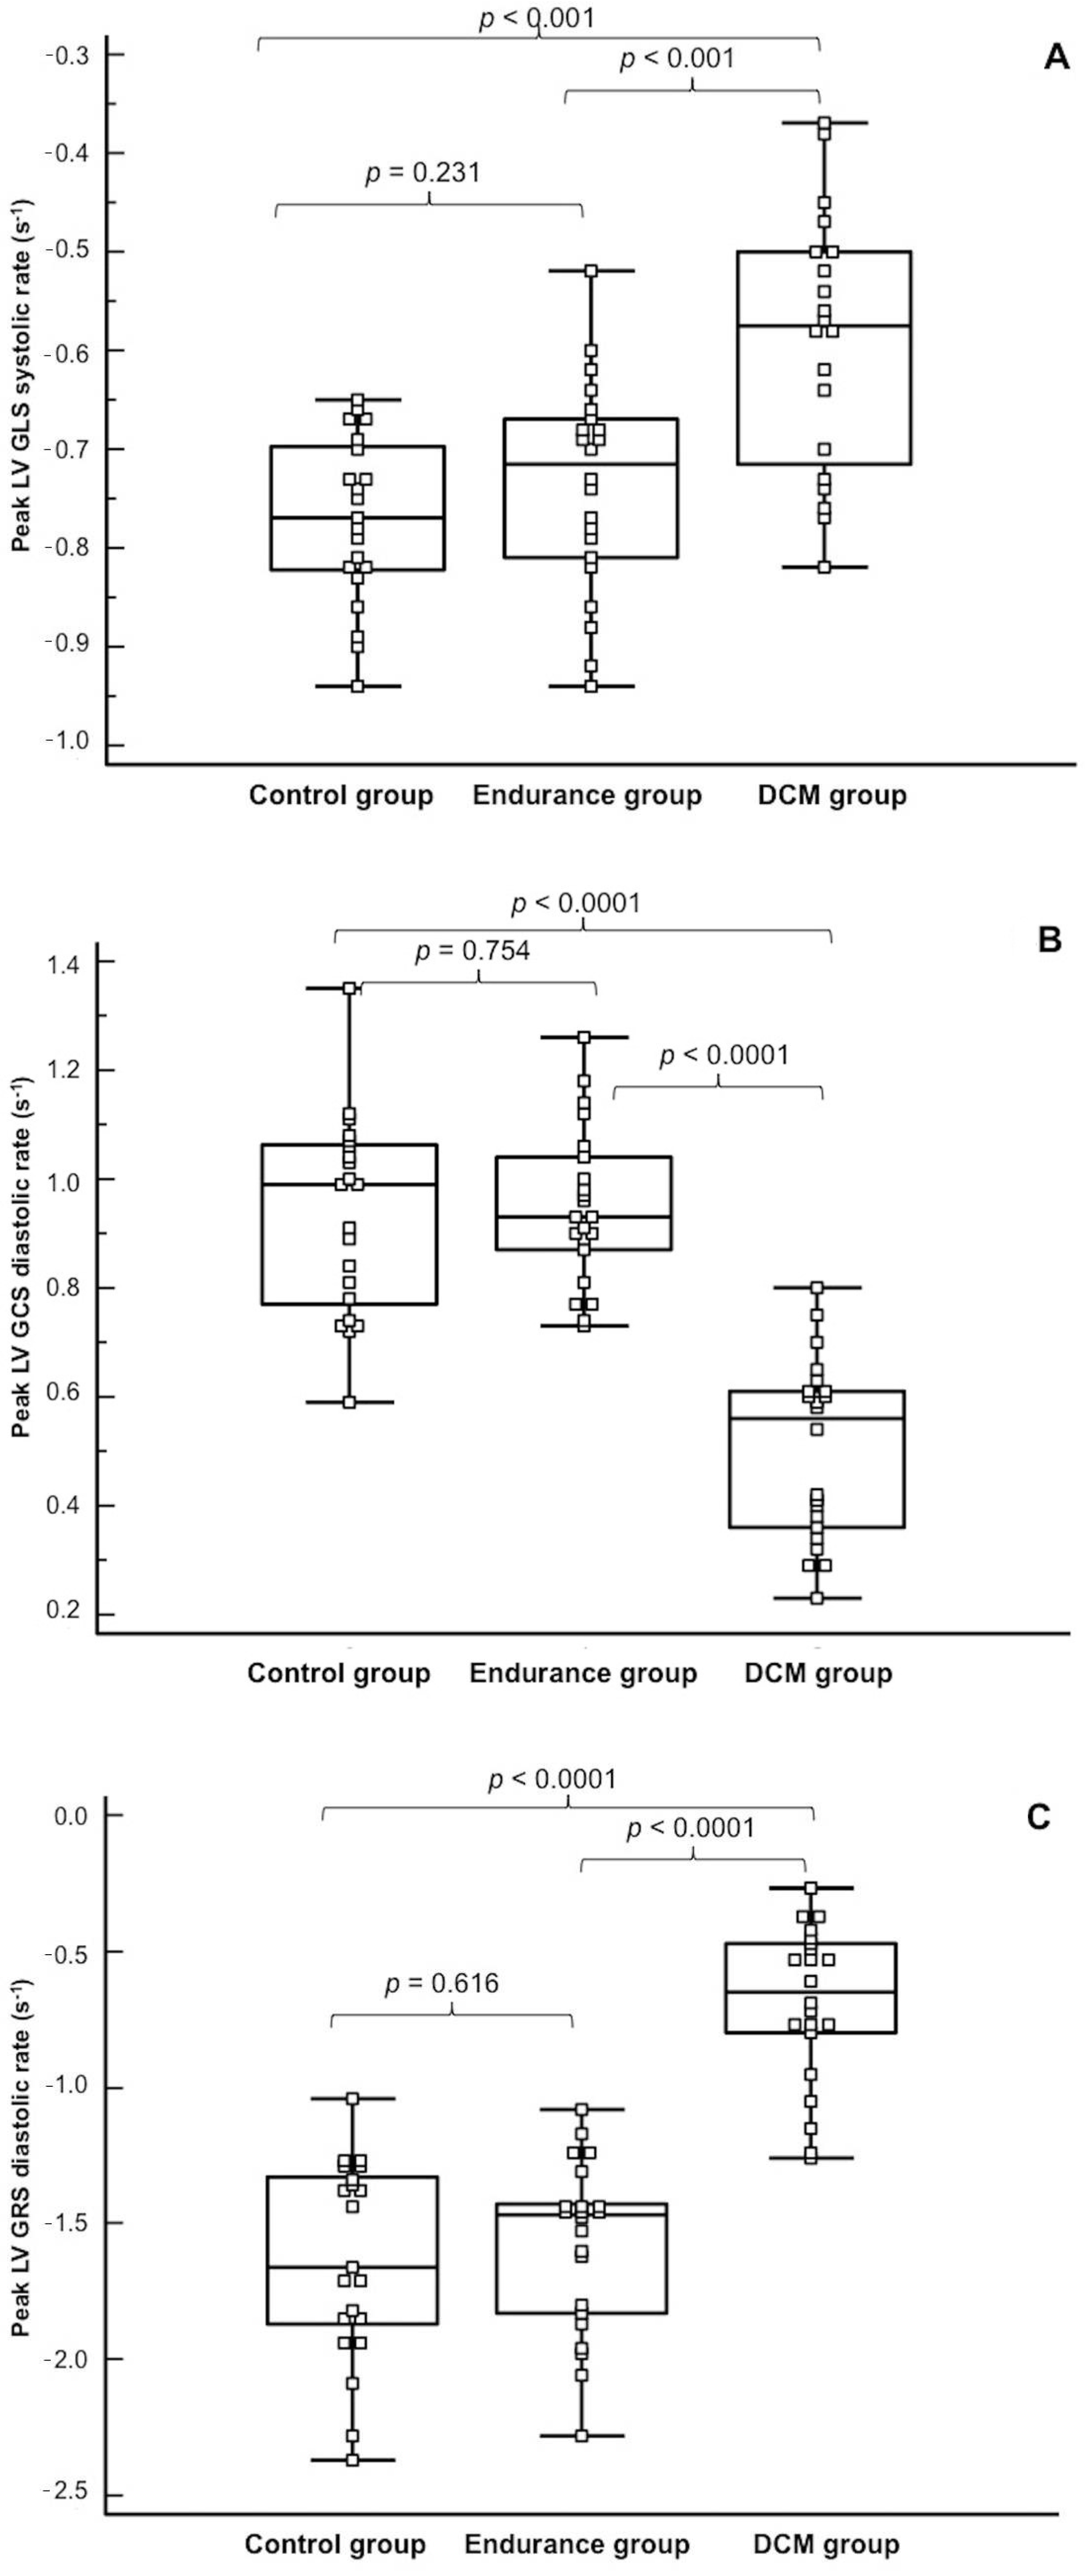
| Global longitudinal strain (±SD) Peak, % Peak systolic rate, s−1 Peak diastolic rate, s−1 | −14.4 ± 1.9 ** −0.77 ± 0.08 ** −0.78 ± 0.18 | −14.3 ± 2.3 ** −0.73 ± 0.10 ** −0.56 ± 0.09 * | −10.3 ± 3.2 −0.59 ± 0.13 −0.57 ± 0.16 * | <0.001 <0.001 <0.001 |
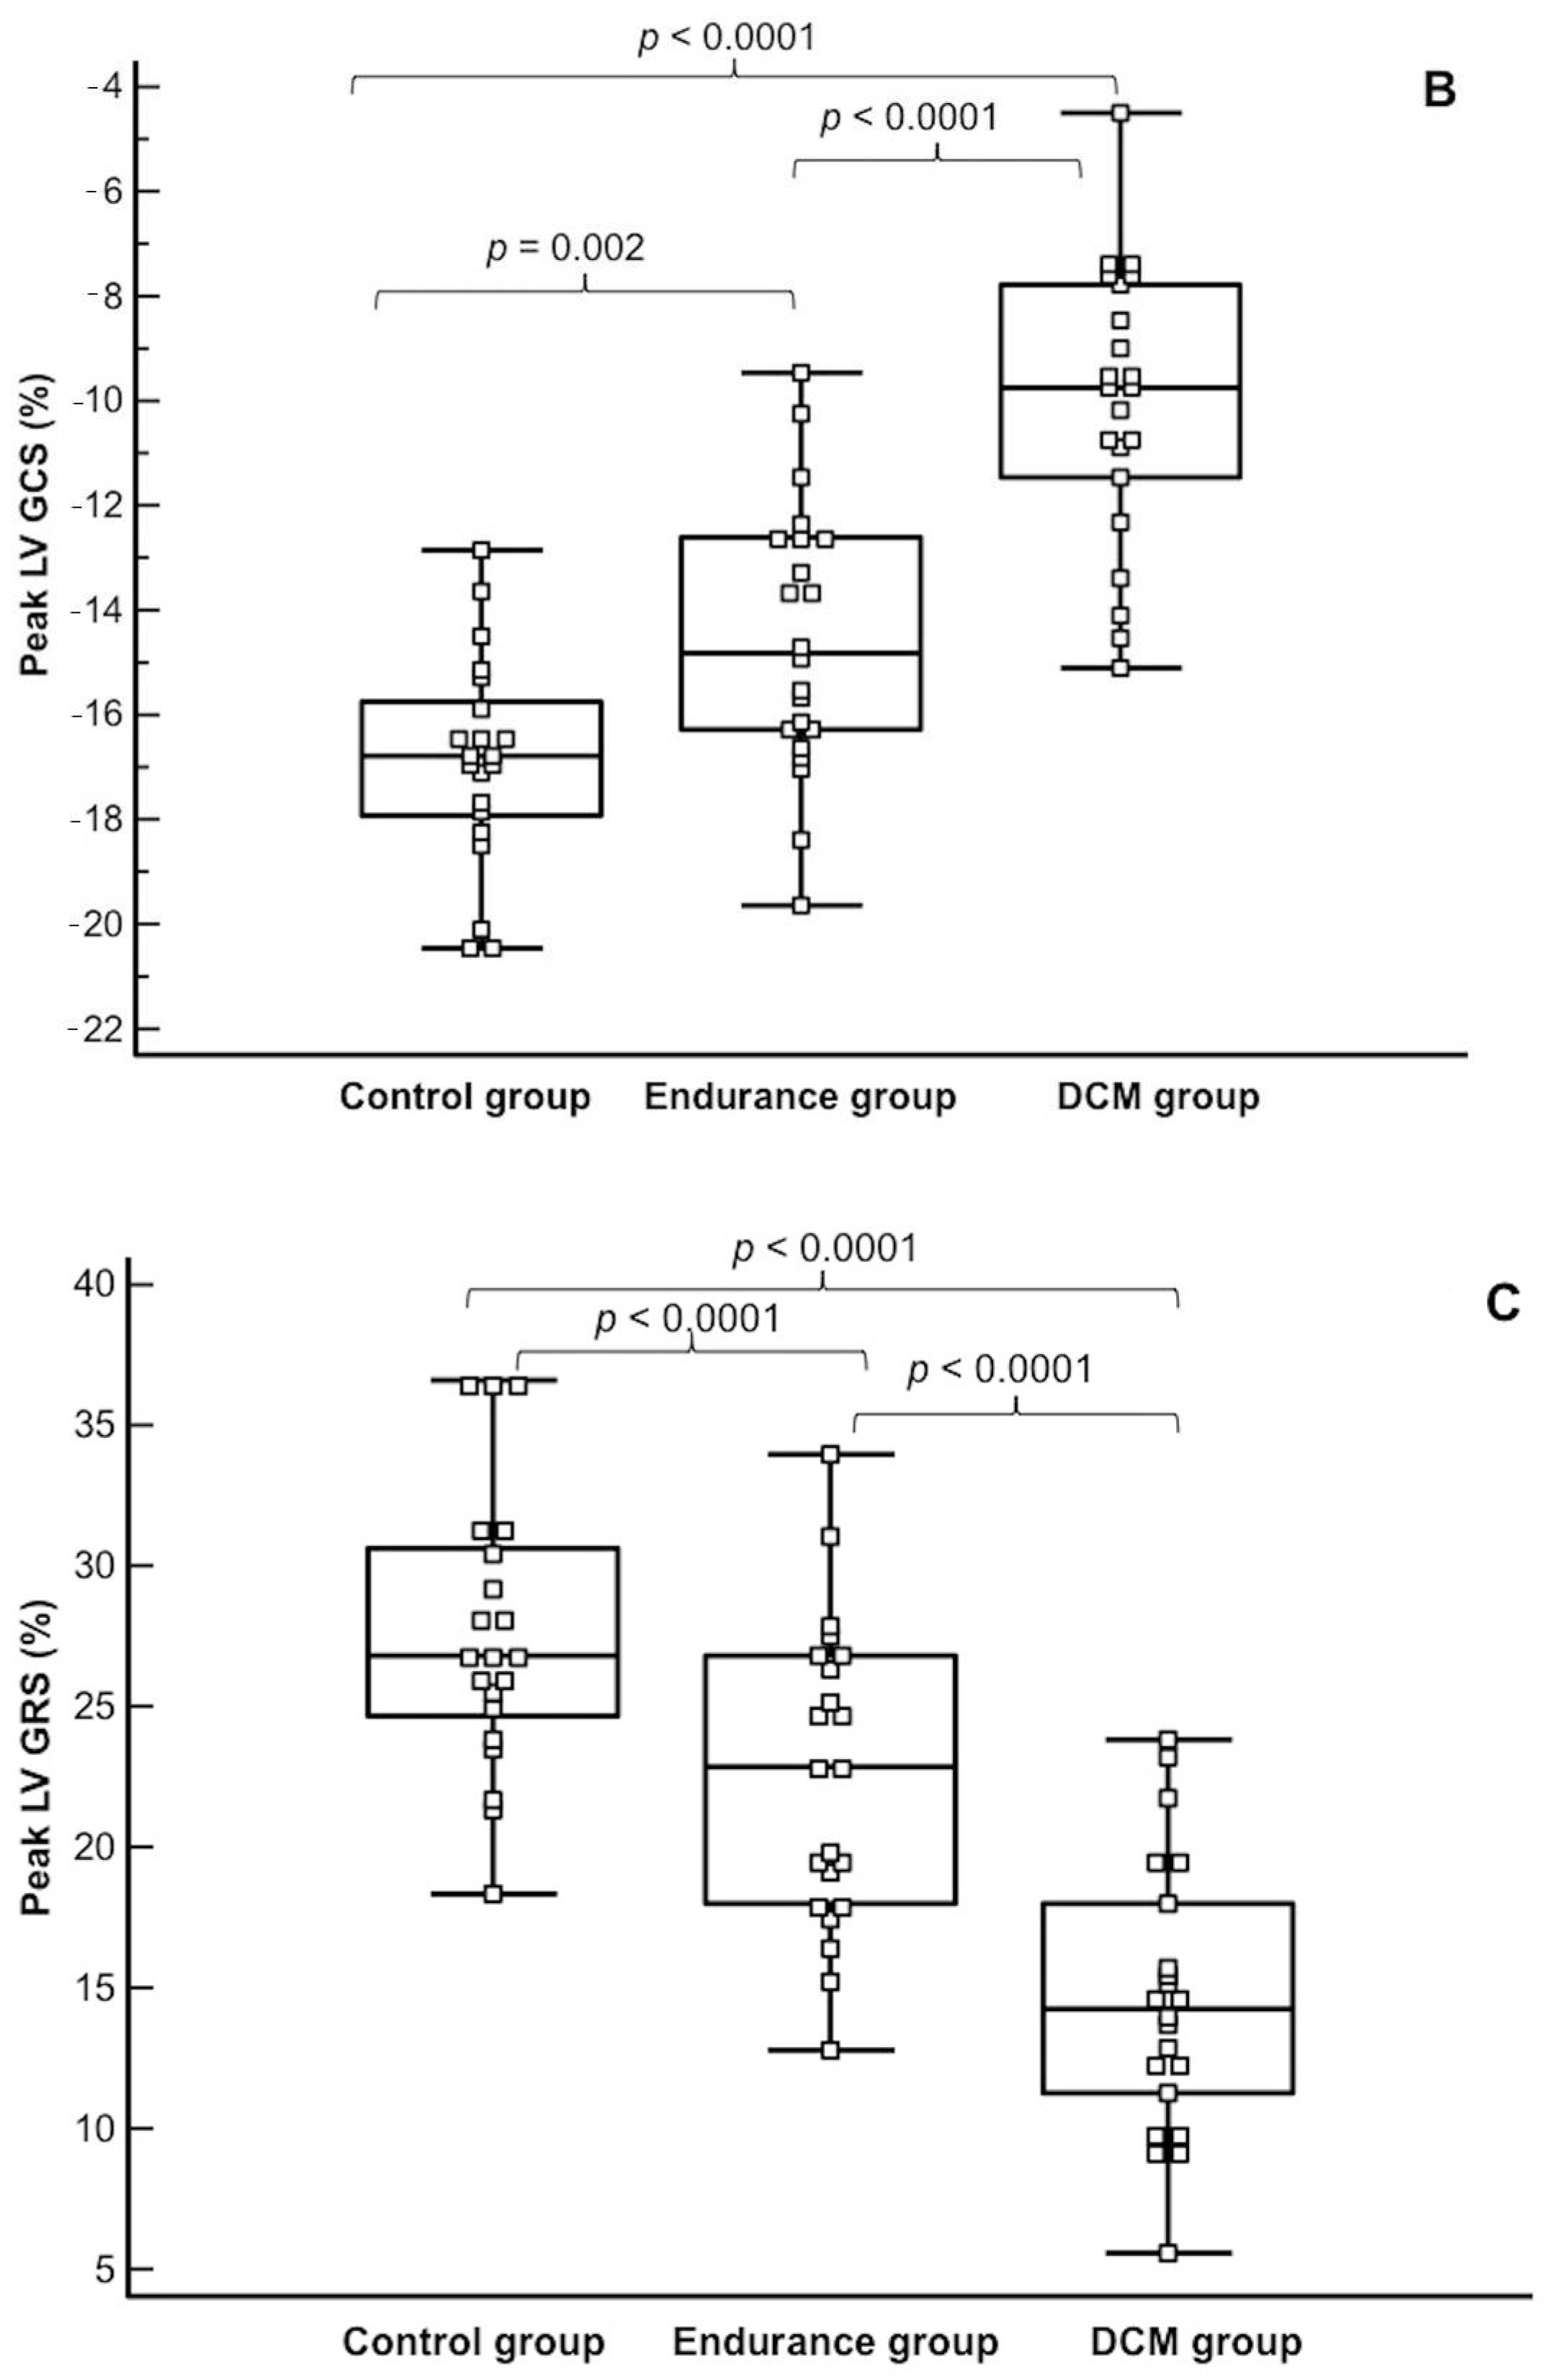
| Global circumferential strain Peak, % Peak systolic rate, s−1 Peak diastolic rate, s−1 | −16.9 ± 2.0 −0.89 ± 0.14 −0.93 ± 0.18 ** | −14.5 ± 2.6 −0.70 ± 0.12 −0.95 ± 0.14 ** | −10.1 ± 2.7 −0.59 ± 0.14 −0.50 ± 0.16 | <0.001 <0.001 <0.001 |
| Global radial strain (±SD) Peak, % Peak systolic rate, s−1 Peak diastolic rate, s−1 | 27.6 ± 4.9 1.48 ± 0.42 −1.63 ± 0.37 ** | 22.6 ± 5.4 1.06 ± 0.30 −1.58 ± 0.31 ** | 14.6 ± 4.8 0.80 ± 0.24 −0.69 ± 0.29 | <0.001 <0.015 <0.001 |
| Torsion, % (±SD) Peak (°/cm) Peak rate (°/(cm·s)) | 0.86 ± 0.35 ** 7.7 ± 2.1 ** | 0.73 ± 0.36 */** 6.4 ± 2.1 */** | 0.56 ± 0.19 * 5.6 ± 2.2 * | 0.01 0.01 |
| Right Ventricle | ||||
| Global longitudinal strain (±SD) Peak, % Peak systolic rate, s−1 Peak diastolic rate, s−1 | −18.4 ± 4.1 −1.21 ± 0.31 1.03 ± 0.29 | −15.7 ± 3.6 −1.00 ± 0.33 0.97 ± 0.30 | −17.8 ± 5.5 −1.24 ± 0.74 1.08 ± 0.67 | 0.116 0.221 0.731 |
| Variable | Cut-Off Value | AUC | Sensitivity | Specificity | p |
|---|---|---|---|---|---|
| RVEDVI | ≤119 mL/m2 | 0.724 | 95.5% | 41.9% | 0.0004 |
| LVEDVI | >122 mL/m2 | 0.732 | 50.0% | 88.4% | 0.0008 |
| RVEF | ≤50% | 0.790 | 59.1% | 93.0% | 0.0001 |
| Peak LV GLS systolic rate | >−0.65 s−1 | 0.830 | 70.0% | 90.7% | 0.0001 |
| Peak LV GLS | >−11.0% | 0.847 | 70.0% | 97.7% | 0.0001 |
| Peak LV GRS | ≤15.7% | 0.918 | 72.7% | 95.3% | 0.0001 |
| Peak LV GCS | >12.3% | 0.931 | 81.8% | 93.0% | 0.0001 |
| Peak LV GCS diastolic rate | ≤0.70 s−1 | 0.974 | 90.9% | 97.7% | 0.0001 |
| Peak LV GRS diastolic rate | >−1.27 s−1 | 0.987 | 100% | 88.4% | 0.0001 |
| LVEF | ≤53% | 0.990 | 90.9% | 100% | 0.0001 |
Publisher’s Note: MDPI stays neutral with regard to jurisdictional claims in published maps and institutional affiliations. |
© 2021 by the authors. Licensee MDPI, Basel, Switzerland. This article is an open access article distributed under the terms and conditions of the Creative Commons Attribution (CC BY) license (http://creativecommons.org/licenses/by/4.0/).
Share and Cite
Małek, Ł.A.; Mazurkiewicz, Ł.; Marszałek, M.; Barczuk-Falęcka, M.; Simon, J.E.; Grzybowski, J.; Miłosz-Wieczorek, B.; Postuła, M.; Marczak, M. Deformation Parameters of the Heart in Endurance Athletes and in Patients with Dilated Cardiomyopathy—A Cardiac Magnetic Resonance Study. Diagnostics 2021, 11, 374. https://doi.org/10.3390/diagnostics11020374
Małek ŁA, Mazurkiewicz Ł, Marszałek M, Barczuk-Falęcka M, Simon JE, Grzybowski J, Miłosz-Wieczorek B, Postuła M, Marczak M. Deformation Parameters of the Heart in Endurance Athletes and in Patients with Dilated Cardiomyopathy—A Cardiac Magnetic Resonance Study. Diagnostics. 2021; 11(2):374. https://doi.org/10.3390/diagnostics11020374
Chicago/Turabian StyleMałek, Łukasz A., Łukasz Mazurkiewicz, Mikołaj Marszałek, Marzena Barczuk-Falęcka, Jenny E. Simon, Jacek Grzybowski, Barbara Miłosz-Wieczorek, Marek Postuła, and Magdalena Marczak. 2021. "Deformation Parameters of the Heart in Endurance Athletes and in Patients with Dilated Cardiomyopathy—A Cardiac Magnetic Resonance Study" Diagnostics 11, no. 2: 374. https://doi.org/10.3390/diagnostics11020374
APA StyleMałek, Ł. A., Mazurkiewicz, Ł., Marszałek, M., Barczuk-Falęcka, M., Simon, J. E., Grzybowski, J., Miłosz-Wieczorek, B., Postuła, M., & Marczak, M. (2021). Deformation Parameters of the Heart in Endurance Athletes and in Patients with Dilated Cardiomyopathy—A Cardiac Magnetic Resonance Study. Diagnostics, 11(2), 374. https://doi.org/10.3390/diagnostics11020374