
Has the Flood Entered the Basement? A Systematic Literature Review about Machine Learning in Laboratory Medicine


Abstract
1. Introduction
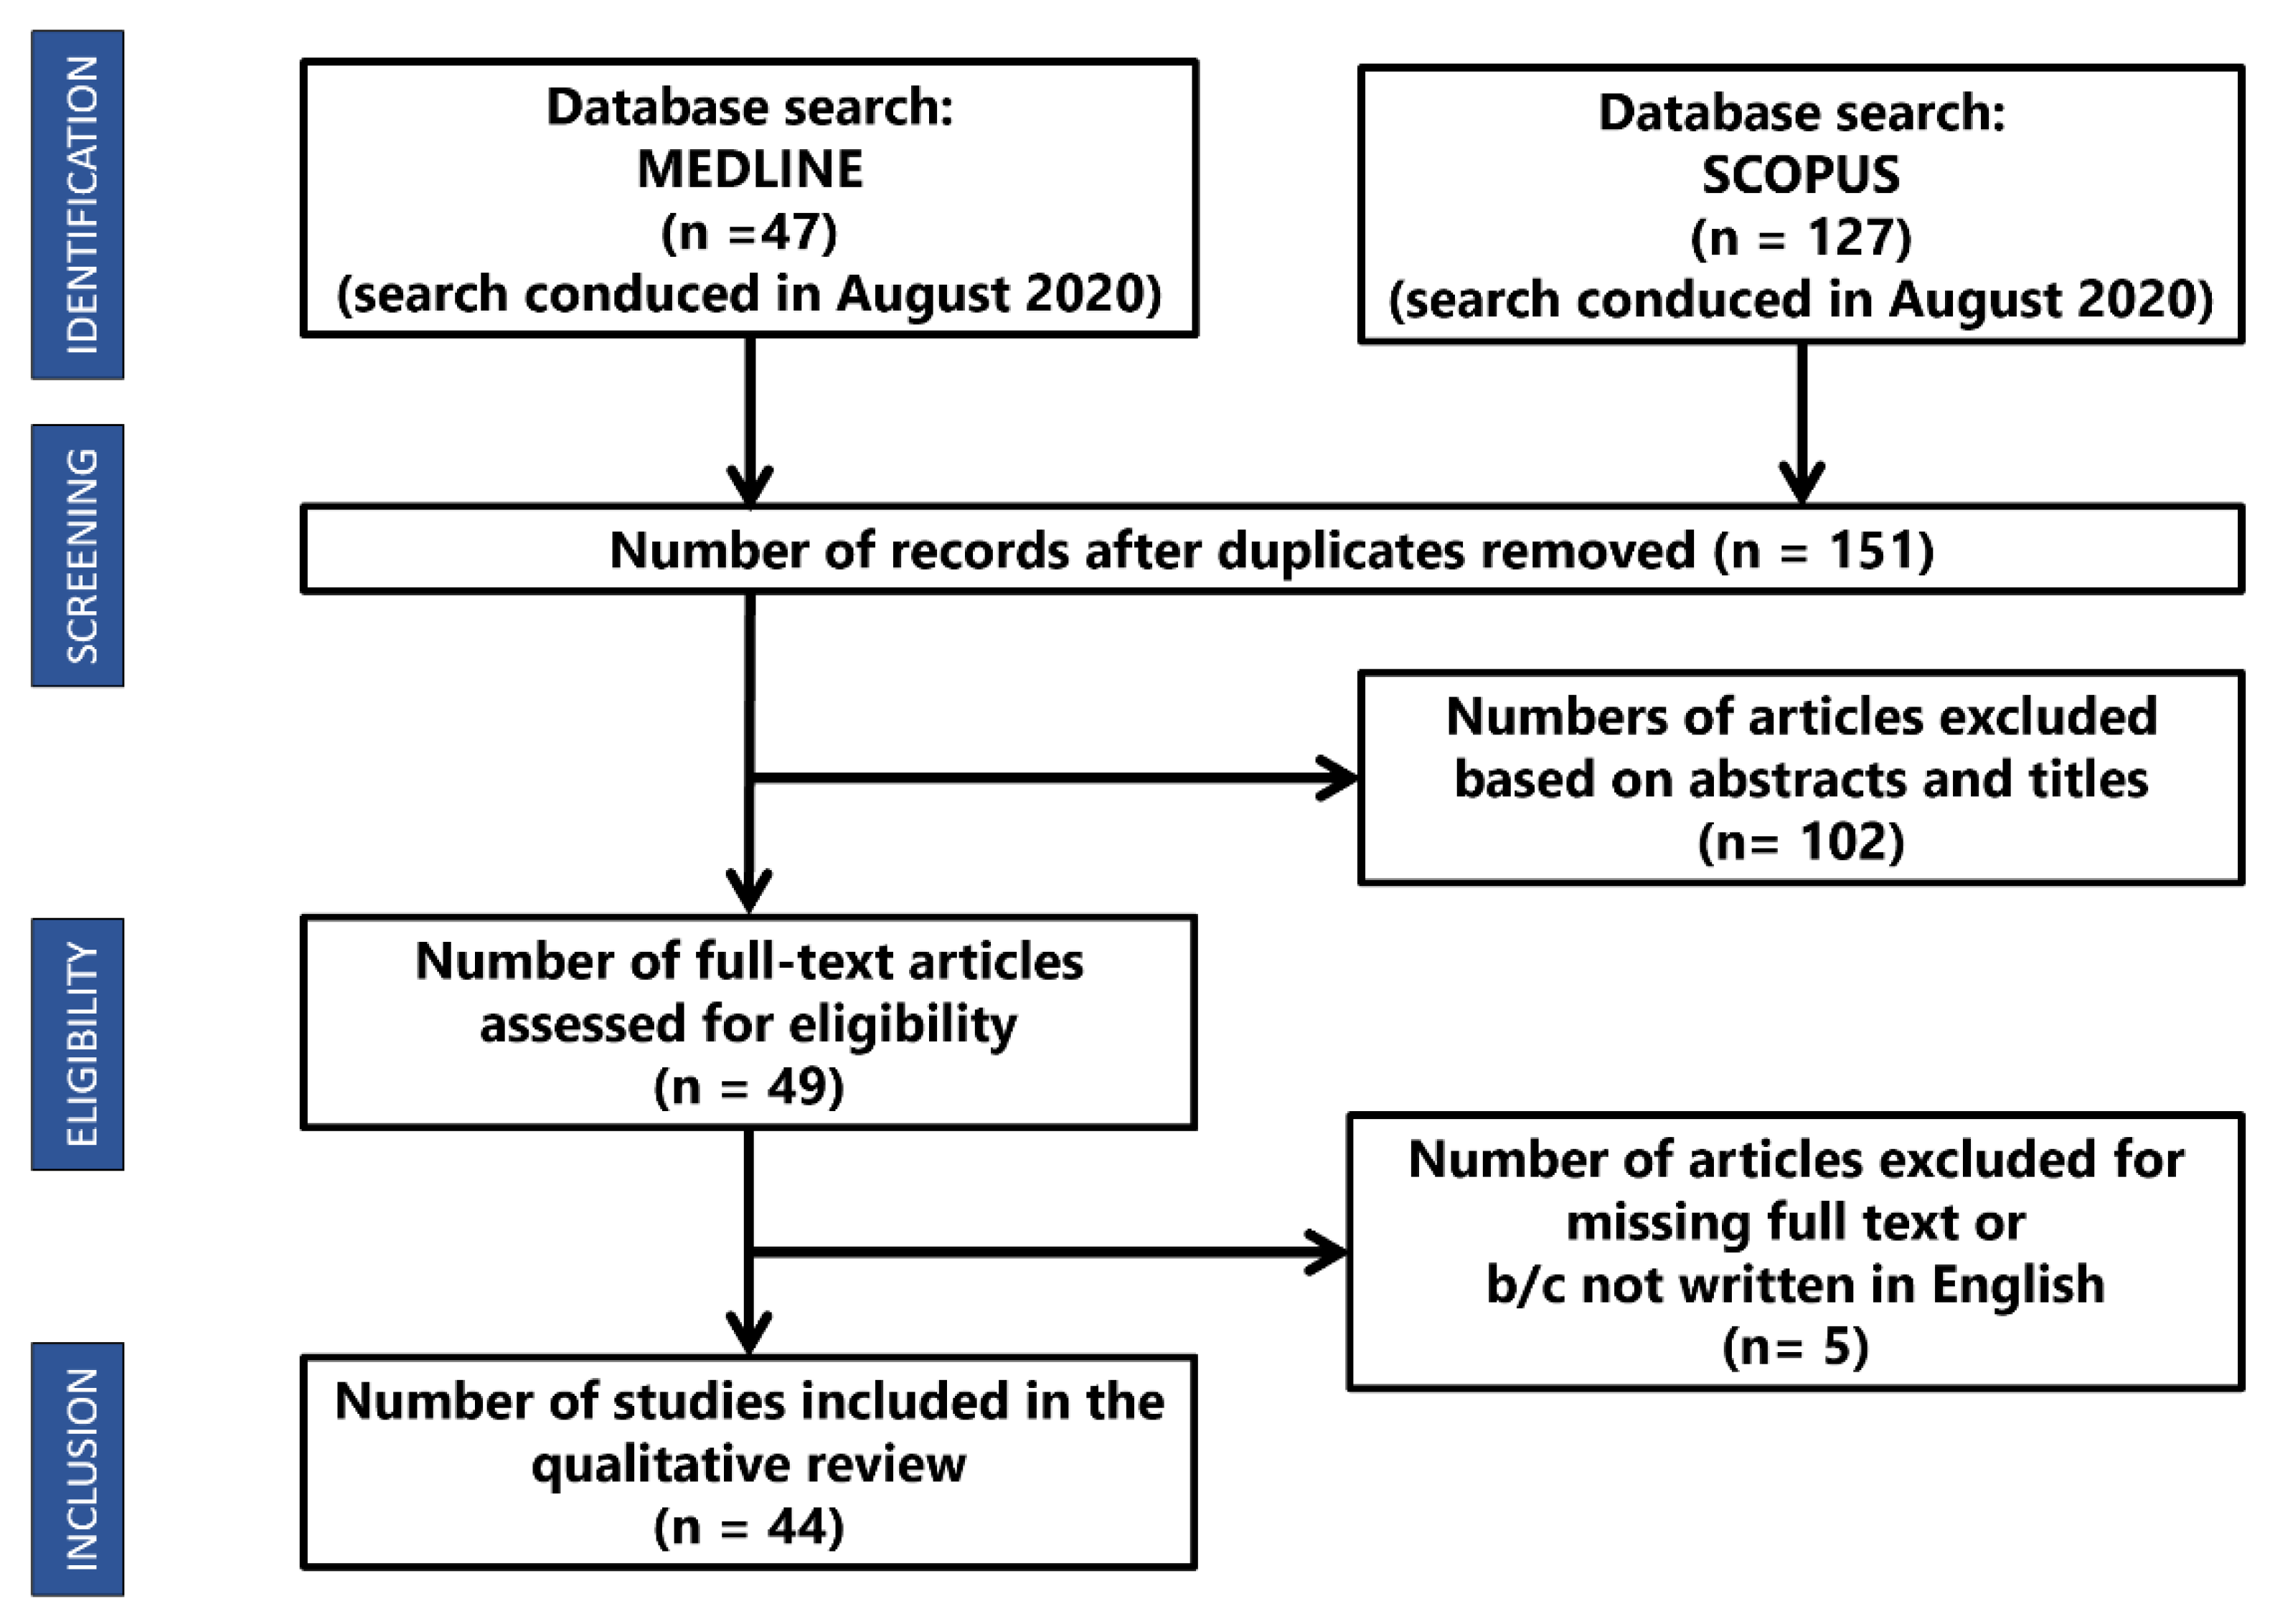
2. Materials and Methods
- The study was written in English.
- The study was published after March 2017.
- The study mentioned at least one known ML technique.
- The study was available online as a full research article or review.
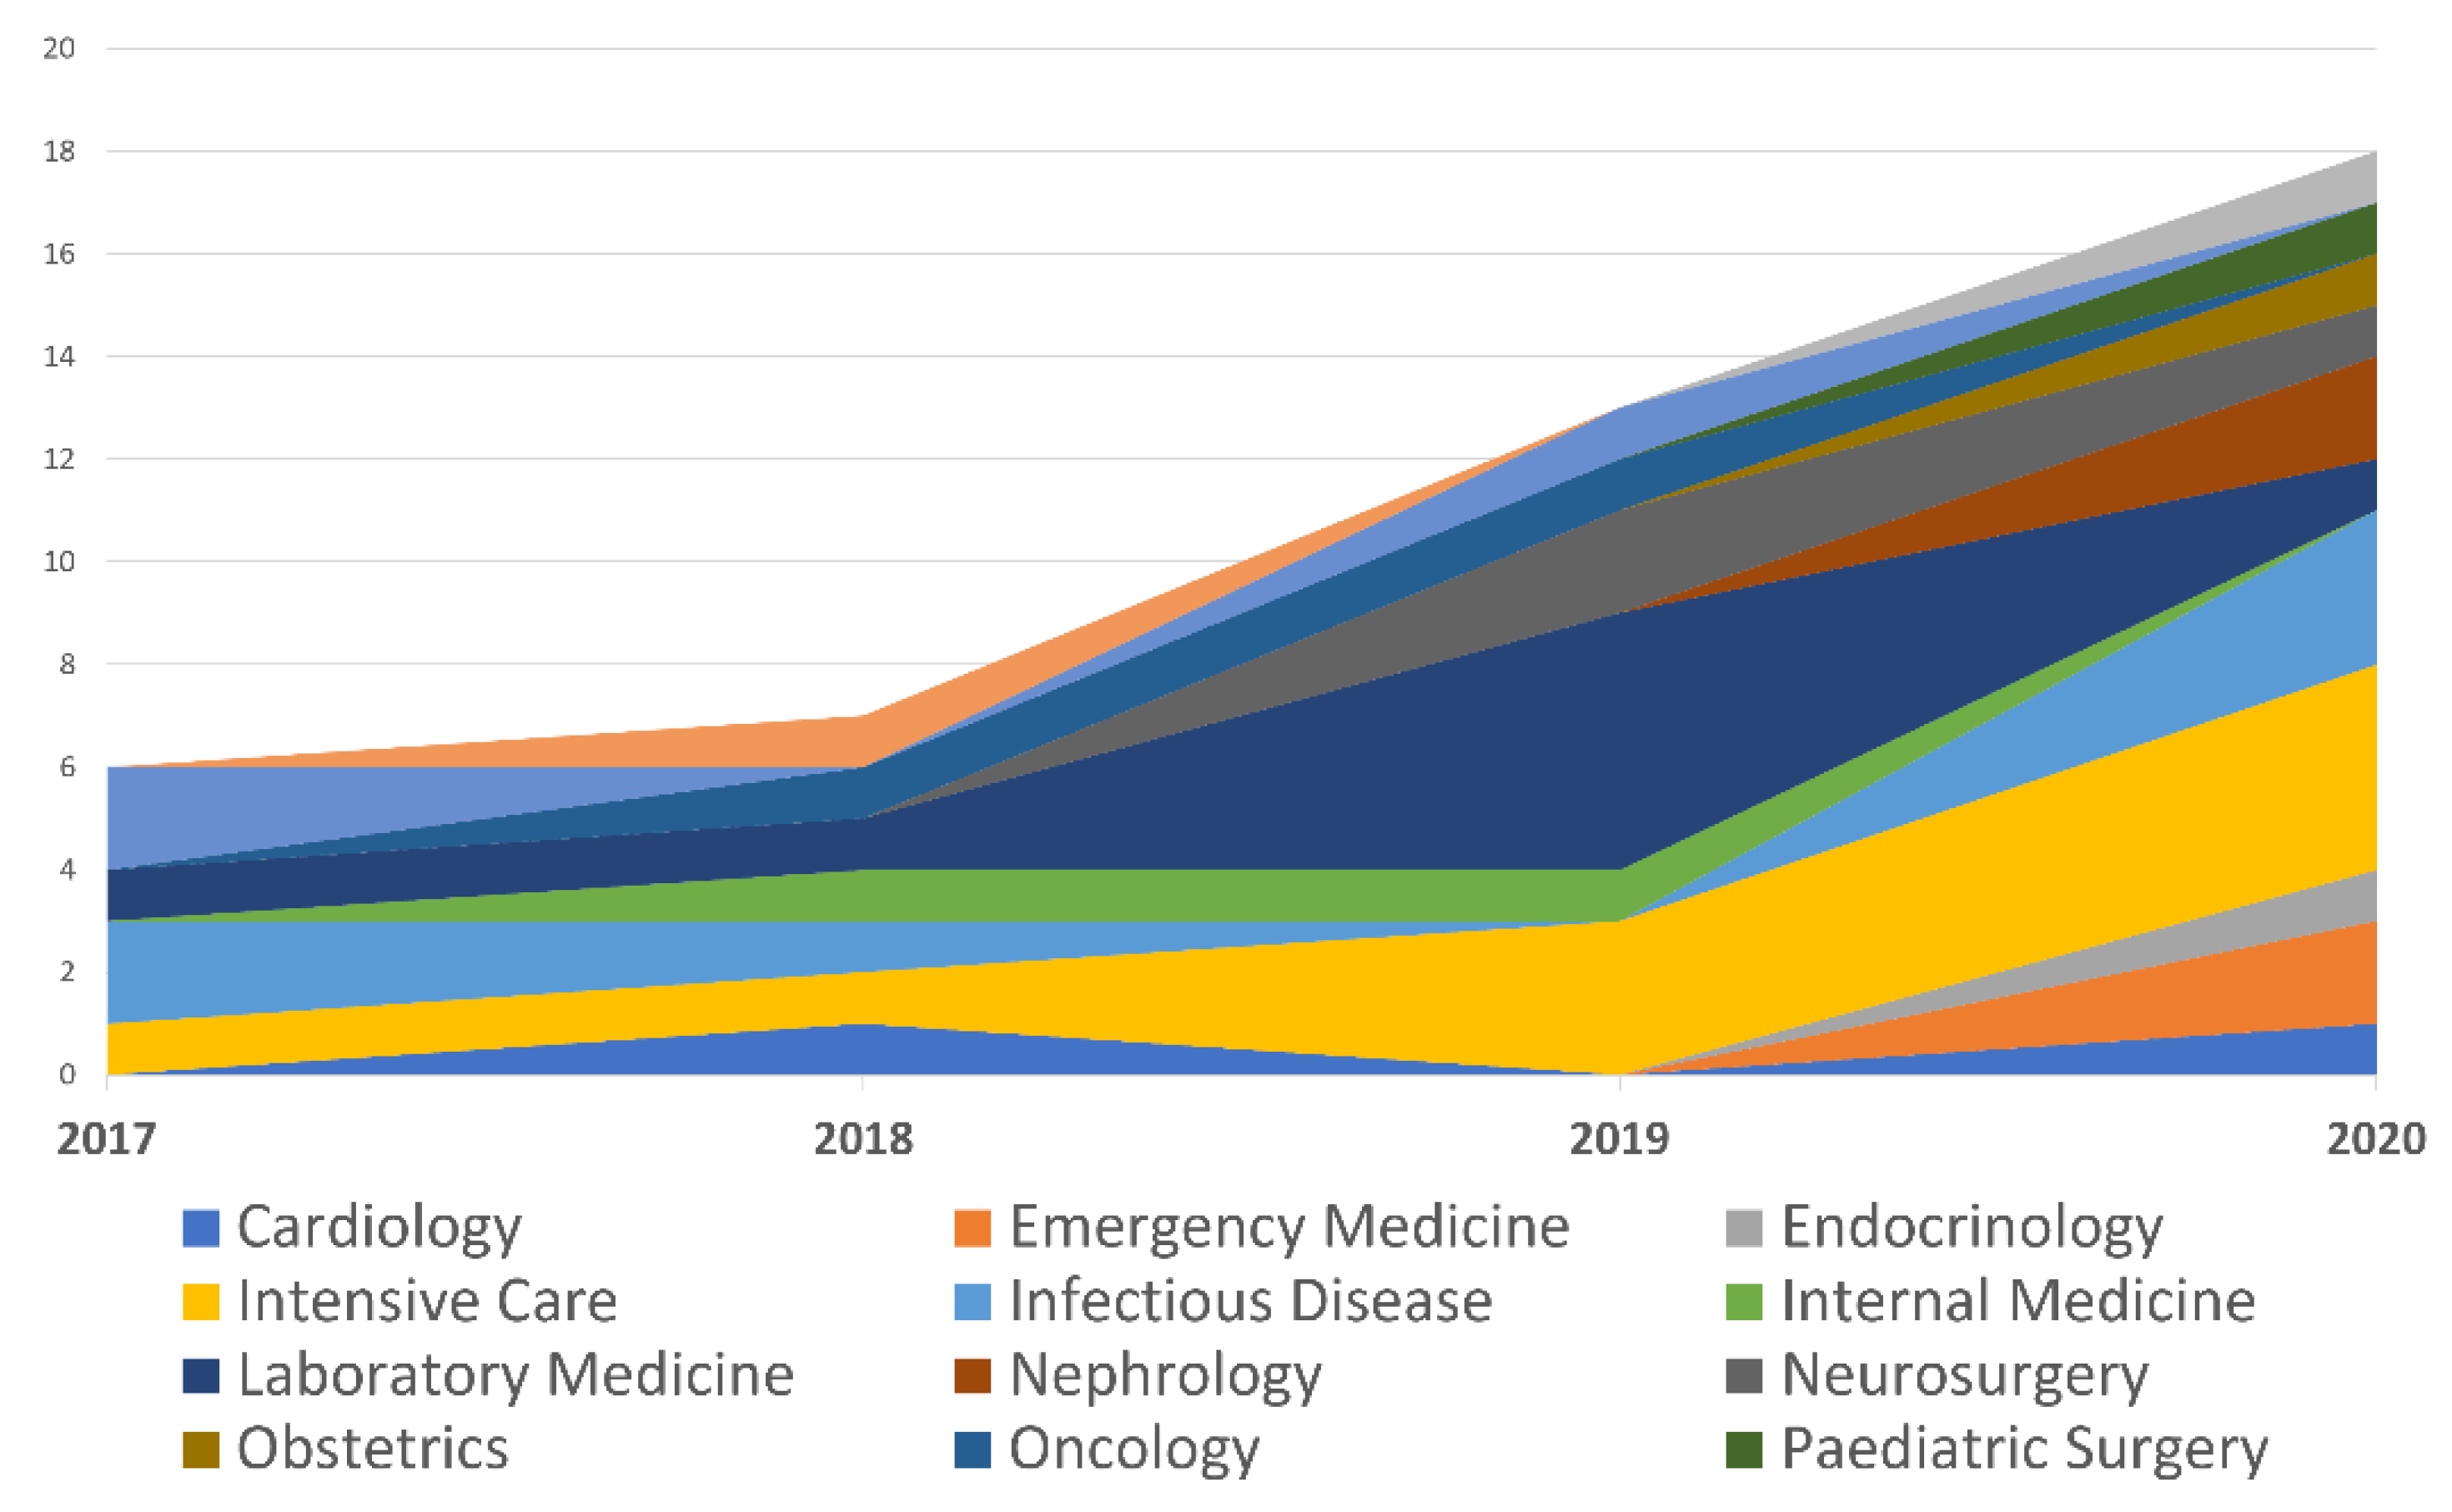
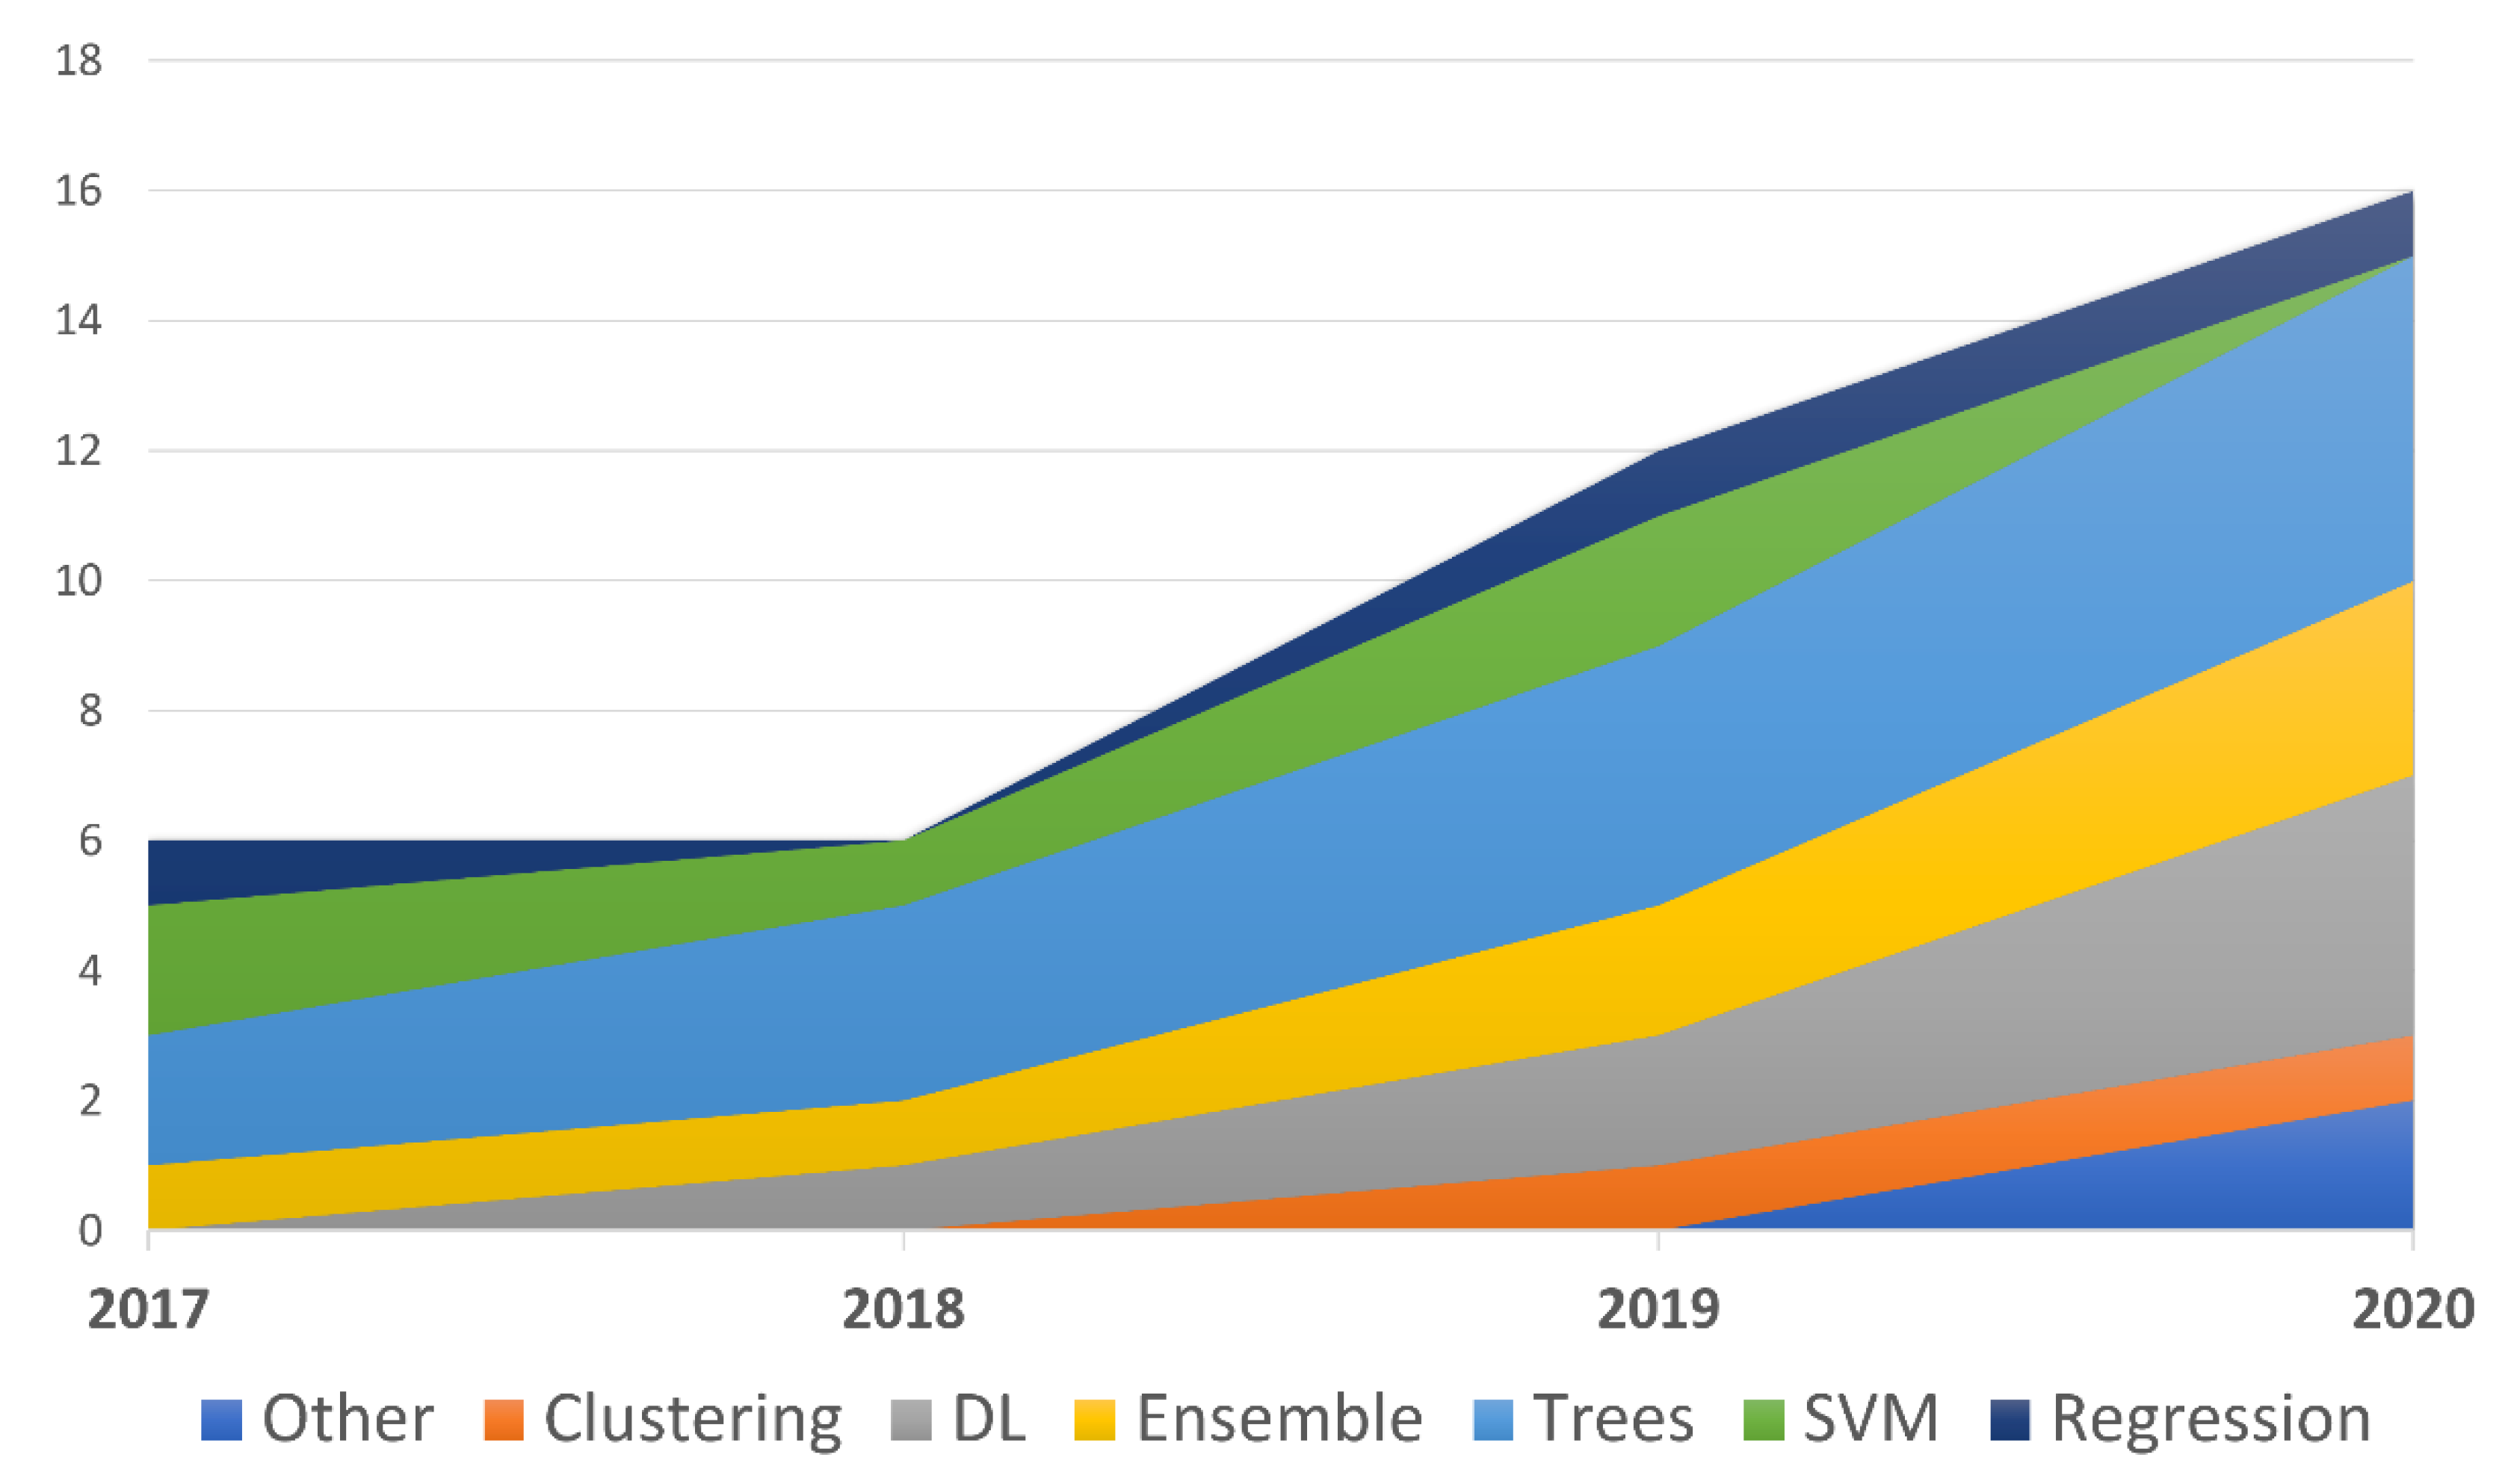
3. Results
3.1. Cardiology: Machine Learning Can Predict the Survival of Patients with Heart Failure from Serum Creatinine and Ejection Fraction Alone
3.2. Emergency Medicine: Predicting Adverse Outcomes for Febrile Patients in the Emergency Department Using Sparse Laboratory Data: Development of a Time-Adaptive Model
3.3. Endocrinology: Identification of the Risk Factors for Patients with Diabetes: Diabetic Polyneuropathy Case Study
3.4. Intensive Care: Early Diagnosis of Bloodstream Infections in the Intensive Care Unit Using Machine Learning Algorithms
3.5. Infectious Disease: Routine Laboratory Blood Tests Predict SARS-CoV-2 Infection Using Machine Learning
3.6. Internal Medicine: A Real-Time Early Warning System for Monitoring Inpatient Mortality Risk: Prospective Study Using Electronic Medical Record Data
3.7. Laboratory Medicine: Predict or Draw Blood: An Integrated Method to Reduce Lab Tests
3.8. Nephrology: A Recurrent Neural Network Approach to Predicting Haemoglobin Trajectories in Patients with End-stage Renal Disease
3.9. Neurosurgery: Feasibility of Machine Learning-based Predictive Modelling of Postoperative Hyponatremia after Pituitary Surgery
3.10. Obstetrics: Comparison of Machine Learning Methods and Conventional Logistic Regressions for Predicting Gestational Diabetes Using Routine Clinical Data: A Retrospective Cohort Study
3.11. Oncology: Survival Outcome Prediction in Cervical Cancer: Cox Models vs. Deep-learning Model
3.12. Paediatric Surgery: A Novel and Simple Machine Learning Algorithm for Preoperative Diagnosis of Acute Appendicitis in Children
3.13. Paediatrics: Enhanced Early Prediction of Clinically Relevant Neonatal Hyperbilirubinemia with Machine Learning
3.14. Pharmacology: Machine Learning Model Combining Features from Algorithms with Different Analytical Methodologies to Detect Laboratory-event-related Adverse Drug Reaction Signals
3.15. Urology: Dynamic Readmission Prediction using Routine Postoperative Laboratory Results after Radical Cystectomy
4. Discussion
5. Conclusions
Author Contributions
Funding
Institutional Review Board Statement
Informed Consent Statement
Data Availability Statement
Conflicts of Interest
Appendix A
Appendix B
| 6MWD | 6-minutewalkingdistance |
| AA | AggregatedAccuracy |
| AdaBoost | AdaptiveBoosting |
| ADR | AdverseDrugReactions |
| AG | AnionGap |
| ANN | ArtificialNeuralNetwork |
| APACHE | AcutePhysiologyandChronicHealthEvaluation |
| ATC | AcuteTraumaticCoagulopathy |
| AUC | AreaUndertheCurve |
| AUPRCorPRAUC | AreaUnderthePrecisionRecallCurve |
| AUROC | AreaUndertheCurveofReceiverOperatingCharacteristic |
| BA | BalancedAccuracy |
| BE | BaseExcess |
| BIDMC | BethIsraelDeaconessMedicalCenter |
| BSI | bloodstreaminfection |
| Bt | Bootstrapping |
| Ca | Cardiology |
| CART | ClassificationandRegressionTree |
| CERT | ComparisonofExtremeLaboratoryTest |
| CFS | CorrelationbasedFeatureSelection |
| Ch | Characterization |
| Cl | Clusterisation |
| CLEAR | ComparisonofExtremeAbnormalityRatio |
| CP | CheckingProportion |
| CPH | CoxProportionalHazard |
| Cr | Creatinine |
| CURB-65 | confusion,urea,respiratoryrate,bloodpressure,>65years |
| CV | Cross-validation |
| DBP | DiastolicBloodPressure |
| De | Detection |
| Dg | Diagnosis |
| DL | DeepLearning |
| DT | DecisionTree |
| DT-J48 | DecisionTreeJ48 |
| EF | EjectionFraction |
| EHR | ElectronicHealthRecords |
| EM | EmergencyMedicine |
| EMPICU | EarlyMortalityPredictionforIntensiveCareUnitpatients |
| En | Endocrinology |
| ESA | erythropoiesisstimulatingagents |
| ESRD | End-StageRenalDisease |
| EWS | earlywarningsystem |
| EWSORA | EntropyWeightedScore-basedOptimalRankingAlgorithm |
| F1 | Fscore |
| FN | FalseNegative |
| FNR | FalseNegativeRate |
| FP | FalsePositive |
| FPR | FalsePositiveRate |
| FU | Followup |
| GA | GeneticAlgorithm |
| GBC | gradientboostingclassifier |
| GBDTorGDBT | GradientBoostingDecisionTree |
| GBT | GradientBoostedTree |
| GCS | GlasgowComaScale |
| GLM | GeneralizedLinearModels |
| GS | GunmaScore |
| HbA1c | GlycatedHaemoglobin |
| HFMD | Hand-Foot-MouthDisease |
| IC | IntensiveCare |
| ICH | intracerebralhaemorrhage |
| ICU | IntensiveCareUnit |
| ID | InfectiousDisease |
| IDI | IntegratedDiscriminationImprovement |
| IM | InternalMedicine |
| KD | Kawasakidisease |
| KNN | K-nearestneighbours |
| KS | KurumeScore |
| LASSO | LogisticRegressionwithleastabsoluteshrinkageandselectionoperator |
| LFA | LateralFlowAssay |
| LGB | LightGradientBoosting |
| LiR | LinearRegression |
| LM | LaboratoryMedicine |
| LoR | LogisticRegression |
| LSTM | LongShort-TermMemory |
| MCC | MatthewsCorrelationCoefficient |
| MEWS | ModifiedEarlyWarningScore |
| ML | machinelearning |
| MLP | Multi-LayerPerceptron |
| NA | NotAvailable |
| NB | NaïveBayes |
| Ne | Nephrology |
| NE | NotEvaluable |
| NEWS | NationalEarlyWarningScore |
| NLR | NegativeLikelihoodRatio |
| NN | NeuralNetwork |
| NNE | numberofincidentcasesonewouldneedtoevaluatetodetectonerecurrence |
| NN-MLP | NeuralNetworkMultilayerPerceptrons |
| NPV | negativepredictivevalue |
| NRI | netreclassificationimprovement |
| Ns | Neurosurgery |
| NT-proBNP | N-terminalpro–brain-typenatriureticpeptide |
| Ob | Obstetrics |
| On | Oncology |
| OOB | Out-of-Bagerrorestimation |
| OS | OsakaScore |
| OSO | orderstatusonly |
| OSR | orderstatusandresults |
| PACE | PrescriptionpatternAroundClinicalEvent |
| PART | ProjectiveAdaptiveResonanceTheory |
| PC | Prospectivecohort |
| Pd | Paediatry |
| PFS | Progression-freesurvival |
| Pg | Prognosis |
| Ph | Pharmacology |
| PLR | PositiveLikelihoodRatio |
| PPV | PositivePredictiveValue |
| PS | PaediatricSurgery |
| PSI | PneumoniaSeverityIndex |
| PSO | ParticleSwarmOptimization |
| qSOFA | quickSepsis-relatedOrganFailureAssessment |
| R2 | Nagelkerke’spseudo-R2 |
| RBC | RedBloodCell |
| RC | RetrospectiveCohort |
| Rch | Research |
| Re | Regression |
| RF | RandomForest |
| RHCC | RambamHealthCareCampus |
| RI | relativeimportance |
| RMSEV | RootMeanSquareErrorValues |
| RNN | RecurrentNeuralNetwork |
| RNN-LSTM | RecurrentNeuralNetwork-LongShort-TermMemory |
| RT-PCR(Agr-PCR) | Real-timereversetranscriptionpolymerasechainreaction |
| SAPS | SimplifiedAcutePhysiologyScore |
| SAPS-II | SimplifiedAcutePhysiologyScoreII |
| SI | ShockIndex |
| SMOTE | SyntheticMinorityOversamplingTechnique |
| SOFA | SequentialOrganFailureAssessment |
| SVM | SupportVectorMachine |
| TBil | TotalBilirubin |
| Th | Therapy |
| TN | TrueNegative |
| TNR | TrueNegativeRate |
| TP | TruePositive |
| TPR | TruePositiveRate |
| Ur | Urology |
| ViEWS | VitalPACEarlyWarningScore |
| VS | ValidationSet |
| WBC | WhiteBloodCell |
| WBIT | WrongBloodinTube |
| XGBorXGBoost | eXtremeGradientBoosting |
| XGBT | eXtremeGradientBoostingTrees |
References
- Cabitza, F.; Banfi, G. Machine learning in laboratory medicine: Waiting for the flood? Clin. Chem. Lab. Med. 2018, 56, 516–524. [Google Scholar] [CrossRef]
- Naugler, C.; Church, D.L. Automation and artificial intelligence in the clinical laboratory. Crit. Rev. Clin. Lab. Sci. 2019, 56, 98–110. [Google Scholar] [CrossRef] [PubMed]
- Meskó, B.; Görög, M. A short guide for medical professionals in the era of artificial intelligence. NPJ Digit. Med. 2020, 3, 126. [Google Scholar] [CrossRef]
- The Medical Futurist. Available online: https://medicalfuturist.com/fda-approved-ai-based-algorithms/ (accessed on 1 August 2020).
- Gruson, D.; Bernardini, S.; Dabla, P.K.; Gouget, B.; Stankovic, S. Collaborative AI and Laboratory Medicine integration in precision cardiovascular medicine. Clin. Chim. Acta 2020, 509, 67–71. [Google Scholar] [CrossRef] [PubMed]
- Dark Daily Information. Available online: https://www.darkdaily.com/fda-approves-smartphone-based-urinalysis-test-kit-for-at-home-use-that-matches-quality-of-clinical-laboratory-tests/ (accessed on 1 August 2020).
- Medtronic. Available online: https://www.medtronicdiabetes.com/products/guardian-connect-continuous-glucose-monitoring-system (accessed on 1 August 2020).
- Cabitza, F.; Locoro, A.; Banfi, G. Machine Learning in Orthopedics: A Literature Review. Front. Bioeng. Biotechnol. 2018, 6, 75. [Google Scholar] [CrossRef] [PubMed]
- Tomar, D.; Agarwal, S. A survey on Data Mining approaches for Healthcare. Int. J. Bio-Sci. Bio-Technol. 2013, 5, 241–266. [Google Scholar] [CrossRef]
- Rashidi, H.H.; Tran, N.K.; Betts, E.V.; Howell, L.P.; Green, R. Artificial Intelligence and Machine Learning in Pathology: The Present Landscape of Supervised Methods. Acad. Pathol. 2019, 6. [Google Scholar] [CrossRef]
- Gruson, D.; Helleputte, T.; Rousseau, P.; Gruson, D. Data science, artificial intelligence, and machine learning: Opportunities for laboratory medicine and the value of positive regulation. Clin. Biochem. 2019, 69, 1–7. [Google Scholar] [CrossRef]
- Wang, S.; Summers, R.M. Machine learning and radiology. Med. Image Anal. 2012, 16, 933–951. [Google Scholar] [CrossRef]
- Obermeyer, Z.; Emanuel, E.J. Predicting the Future—Big Data, Machine Learning, and Clinical Medicine. N. Engl. J. Med. 2016, 375, 1216–1219. [Google Scholar] [CrossRef]
- Christodoulou, E.; Ma, J.; Collins, G.S.; Steyerberg, E.W.; Verbakel, J.Y.; Van Calster, B. A systematic review shows no performance benefit of machine learning over logistic regression for clinical prediction models. J. Clin. Epidemiol. 2019, 110, 12–22. [Google Scholar] [CrossRef] [PubMed]
- Cabitza, F.; Rasoini, R.; Gensini, G.F. Unintended Consequences of Machine Learning in Medicine. JAMA 2017, 318, 517–518. [Google Scholar] [CrossRef]
- Salvador-Olivan, J.A.; Marco-Cuenca, G.; Arquero-Aviles, R. Errors in search strategies used in systematic reviews and their effects on information retrieval. J. Med. Libr. Assoc. 2019, 107, 210–221. [Google Scholar] [CrossRef]
- Wolfswinkel, J.F.; Furtmueller, E.; Wilderom, C.P. Using grounded theory as a method for rigorously reviewing literature. Eur. J. Inf. Syst. 2013, 22, 45–55. [Google Scholar] [CrossRef]
- Awad, A.; Bader-El-Den, M.; McNicholas, J.; Briggs, J. Early hospital mortality prediction of intensive care unit patients using an ensemble learning approach. Int. J. Med. Inform. 2017, 108, 185–195. [Google Scholar] [CrossRef] [PubMed]
- Escobar, G.J.; Baker, J.M.; Kipnis, P.; Greene, J.D.; Mast, T.C.; Gupta, S.B.; Cossrow, N.; Mehta, V.; Liu, V.; Dubberke, E.R. Prediction of recurrent clostridium difficile infection using comprehensive electronic medical records in an integrated healthcare delivery system. Infect. Control Hosp. Epidemiol. 2017, 38, 1196–1203. [Google Scholar] [CrossRef]
- Richardson, A.M.; Lidbury, B.A. Enhancement of hepatitis virus immunoassay outcome predictions in imbalanced routine pathology data by data balancing and feature selection before the application of support vector machines. BMC Med. Inform. Decis. Mak. 2017, 17. [Google Scholar] [CrossRef] [PubMed]
- Zhang, B.; Wan, X.; Ouyang, F.S.; Dong, Y.H.; Luo, D.H.; Liu, J.; Liang, L.; Chen, W.B.; Luo, X.N.; Mo, X.K.; et al. Machine Learning Algorithms for Risk Prediction of Severe Hand-Foot-Mouth Disease in Children. Sci. Rep. 2017, 7, 5368. [Google Scholar] [CrossRef] [PubMed]
- Takeuchi, M.; Inuzuka, R.; Hayashi, T.; Shindo, T.; Hirata, Y.; Shimizu, N.; Inatomi, J.; Yokoyama, Y.; Namai, Y.; Oda, Y.; et al. Novel Risk Assessment Tool for Immunoglobulin Resistance in Kawasaki Disease: Application Using a Random Forest Classifier: Application Using a Random Forest Classifer. Pediatr. Infect. Dis. J. 2017, 36, 821–826. [Google Scholar] [CrossRef] [PubMed]
- Hernandez, B.; Herrero, P.; Rawson, T.M.; Moore, L.S.P.; Evans, B.; Toumazou, C.; Holmes, A.H.; Georgiou, P. Supervised learning for infection risk inference using pathology data. BMC Med. Inform. Decis. Mak. 2017, 17, 168. [Google Scholar] [CrossRef]
- Bertsimas, D.; Dunn, J.; Pawlowski, C.; Silberholz, J.; Weinstein, A.; Zhuo, Y.D.; Chen, E.; Elfiky, A.A. Applied Informatics Decision Support Tool for Mortality Predictions in Patients With Cancer. JCO Clin. Cancer Inform. 2018, 2, 1–11. [Google Scholar] [CrossRef] [PubMed]
- Jeong, E.; Park, N.; Choi, Y.; Park, R.W.; Yoon, D. Machine learning model combining features from algorithms with different analytical methodologies to detect laboratory-event-related adverse drug reaction signals. PLoS ONE 2018, 13, e0207749. [Google Scholar] [CrossRef]
- Rosenbaum, M.W.; Baron, J.M. Using machine learning-based multianalyte delta checks to detect wrong blood in tube errors. Am. J. Clin. Pathol. 2018, 150, 555–566. [Google Scholar] [CrossRef]
- Ge, W.; Huh, J.W.; Park, Y.R.; Lee, J.H.; Kim, Y.H.; Turchin, A. An Interpretable ICU Mortality Prediction Model Based on Logistic Regression and Recurrent Neural Networks with LSTM units. AMIA Annu. Symp. Proc. 2018, 2018, 460–469. [Google Scholar] [PubMed]
- Jonas, K.; Magoń, W.; Waligóra, M.; Seweryn, M.; Podolec, P.; Kopeć, G. High-density lipoprotein cholesterol levels and pulmonary artery vasoreactivity in patients with idiopathic pulmonary arterial hypertension. Pol. Arch. Intern. Med. 2018, 128, 440–446. [Google Scholar] [CrossRef]
- Sahni, N.; Simon, G.; Arora, R. Development and Validation of Machine Learning Models for Prediction of 1-Year Mortality Utilizing Electronic Medical Record Data Available at the End of Hospitalization in Multicondition Patients: A Proof-of-Concept Study. J. Gen. Intern. Med. 2018, 33, 921–928. [Google Scholar] [CrossRef]
- Rahimian, F.; Salimi-Khorshidi, G.; Payberah, A.H.; Tran, J.; Ayala Solares, R.; Raimondi, F.; Nazarzadeh, M.; Canoy, D.; Rahimi, K. Predicting the risk of emergency admission with machine learning: Development and validation using linked electronic health records. PLoS Med. 2018, 15. [Google Scholar] [CrossRef]
- Foysal, K.H.; Seo, S.E.; Kim, M.J.; Kwon, O.S.; Chong, J.W. Analyte Quantity Detection from Lateral Flow Assay Using a Smartphone. Sensors 2019, 19, 4812. [Google Scholar] [CrossRef] [PubMed]
- Xu, S.; Hom, J.; Balasubramanian, S.; Schroeder, L.F.; Najafi, N.; Roy, S.; Chen, J.H. Prevalence and Predictability of Low-Yield Inpatient Laboratory Diagnostic Tests. JAMA Netw. Open 2019, 2, e1910967. [Google Scholar] [CrossRef] [PubMed]
- Burton, R.J.; Albur, M.; Eberl, M.; Cuff, S.M. Using artificial intelligence to reduce diagnostic workload without compromising detection of urinary tract infections. BMC Med. Inform. Decis. Mak. 2019, 19. [Google Scholar] [CrossRef] [PubMed]
- Fillmore, N.; Do, N.; Brophy, M.; Zimolzak, A. Interactive Machine Learning for Laboratory Data Integration. Stud. Health Technol. Inform. 2019, 264, 133–137. [Google Scholar] [CrossRef]
- Zimmerman, L.P.; Reyfman, P.A.; Smith, A.D.R.; Zeng, Z.; Kho, A.; Sanchez-Pinto, L.N.; Luo, Y. Early prediction of acute kidney injury following ICU admission using a multivariate panel of physiological measurements. BMC Med. Inform. Decis. Mak. 2019, 19. [Google Scholar] [CrossRef]
- Sharafoddini, A.; Dubin, J.A.; Maslove, D.M.; Lee, J. A new insight into missing data in intensive care unit patient profiles: Observational study. J. Med. Internet Res. 2019, 21. [Google Scholar] [CrossRef]
- Matsuo, K.; Purushotham, S.; Jiang, B.; Mandelbaum, R.S.; Takiuchi, T.; Liu, Y.; Roman, L.D. Survival outcome prediction in cervical cancer: Cox models vs deep-learning model. Am. J. Obstet. Gynecol. 2019, 220, 381.e1–381.e14. [Google Scholar] [CrossRef] [PubMed]
- Yang, Z.; Tan, E.H.; Li, Y.; Lim, B.; Metz, M.P.; Loh, T.P. Relative criticalness of common laboratory tests for critical value reporting. J. Clin. Pathol. 2019, 72, 325–328. [Google Scholar] [CrossRef]
- Daunhawer, I.; Kasser, S.; Koch, G.; Sieber, L.; Cakal, H.; Tütsch, J.; Pfister, M.; Wellmann, S.; Vogt, J.E. Enhanced early prediction of clinically relevant neonatal hyperbilirubinemia with machine learning. Pediatr. Res. 2019, 86, 122–127. [Google Scholar] [CrossRef] [PubMed]
- Estiri, H.; Klann, J.G.; Murphy, S.N. A clustering approach for detecting implausible observation values in electronic health records data. BMC Med. Inform. Decis. Mak. 2019, 19. [Google Scholar] [CrossRef]
- Kayhanian, S.; Young, A.M.H.; Mangla, C.; Jalloh, I.; Fernandes, H.M.; Garnett, M.R.; Hutchinson, P.J.; Agrawal, S. Modelling outcomes after paediatric brain injury with admission laboratory values: A machine-learning approach. Pediatr. Res. 2019, 86, 641–645. [Google Scholar] [CrossRef] [PubMed]
- Wang, H.L.; Hsu, W.Y.; Lee, M.H.; Weng, H.H.; Chang, S.W.; Yang, J.T.; Tsai, Y.H. Automatic machine-learning-based outcome prediction in patients with primary intracerebral hemorrhage. Front. Neurol. 2019, 10. [Google Scholar] [CrossRef]
- Ye, C.; Wang, O.; Liu, M.; Zheng, L.; Xia, M.; Hao, S.; Jin, B.; Jin, H.; Zhu, C.; Huang, C.J.; et al. A Real-Time Early Warning System for Monitoring Inpatient Mortality Risk: Prospective Study Using Electronic Medical Record Data. J. Med. Internet Res. 2019, 21, e13719. [Google Scholar] [CrossRef]
- Yang, H.S.; Hou, Y.; Vasovic, L.V.; Steel, P.; Chadburn, A.; Racine-Brzostek, S.E.; Velu, P.; Cushing, M.M.; Loda, M.; Kaushal, R.; et al. Routine laboratory blood tests predict SARS-CoV-2 infection using machine learning. Clin. Chem. 2020. [Google Scholar] [CrossRef] [PubMed]
- Ma, X.; Ng, M.; Xu, S.; Xu, Z.; Qiu, H.; Liu, Y.; Lyu, J.; You, J.; Zhao, P.; Wang, S.; et al. Development and validation of prognosis model of mortality risk in patients with COVID-19. Epidemiol. Infect. 2020, 148, e168. [Google Scholar] [CrossRef] [PubMed]
- Hyun, S.; Kaewprag, P.; Cooper, C.; Hixon, B.; Moffatt-Bruce, S. Exploration of critical care data by using unsupervised machine learning. Comput. Methods Programs Biomed. 2020, 194. [Google Scholar] [CrossRef]
- Lee, S.; Hong, S.; Cha, W.C.; Kim, K. Predicting adverse outcomes for febrile patients in the emergency department using sparse laboratory data: Development of a time adaptive model. J. Med. Internet Res. 2020, 22. [Google Scholar] [CrossRef]
- Morid, M.A.; Sheng, O.R.L.; Del Fiol, G.; Facelli, J.C.; Bray, B.E.; Abdelrahman, S. Temporal Pattern Detection to Predict Adverse Events in Critical Care: Case Study With Acute Kidney Injury. JMIR Med. Inform. 2020, 8, e14272. [Google Scholar] [CrossRef]
- Yu, L.; Zhang, Q.; Bernstam, E.V.; Jiang, X. Predict or draw blood: An integrated method to reduce lab tests. J. Biomed. Inform. 2020, 104. [Google Scholar] [CrossRef]
- Chicco, D.; Jurman, G. Machine learning can predict survival of patients with heart failure from serum creatinine and ejection fraction alone. BMC Med. Inform. Decis. Mak. 2020, 20. [Google Scholar] [CrossRef] [PubMed]
- Ye, Y.; Ye, Y.; Xiong, Y.; Xiong, Y.; Zhou, Q.; Zhou, Q.; Wu, J.; Wu, J.; Li, X.; Xiao, X.; et al. Comparison of Machine Learning Methods and Conventional Logistic Regressions for Predicting Gestational Diabetes Using Routine Clinical Data: A Retrospective Cohort Study. J. Diabetes Res. 2020, 2020. [Google Scholar] [CrossRef]
- Macias, E.; Morell, A.; Serrano, J.; Vicario, J.L.; Ibeas, J. Mortality prediction enhancement in end-stage renal disease: A machine learning approach. Inform. Med. Unlocked 2020, 19. [Google Scholar] [CrossRef]
- Lobo, B.; Abdel-Rahman, E.; Brown, D.; Dunn, L.; Bowman, B. A recurrent neural network approach to predicting hemoglobin trajectories in patients with End-Stage Renal Disease. Artif. Intell. Med. 2020, 104. [Google Scholar] [CrossRef]
- Roimi, M.; Neuberger, A.; Shrot, A.; Paul, M.; Geffen, Y.; Bar-Lavie, Y. Early diagnosis of bloodstream infections in the intensive care unit using machine-learning algorithms. Intensive Care Med. 2020, 46, 454–462. [Google Scholar] [CrossRef] [PubMed]
- Kirk, P.S.; Liu, X.; Borza, T.; Li, B.Y.; Sessine, M.; Zhu, K.; Lesse, O.; Qin, Y.; Jacobs, B.; Urish, K.; et al. Dynamic readmission prediction using routine postoperative laboratory results after radical cystectomy. Urol. Oncol. Semin. Original Investig. 2020, 38, 255–261. [Google Scholar] [CrossRef]
- Li, K.; Wu, H.; Pan, F.; Chen, L.; Feng, C.; Liu, Y.; Hui, H.; Cai, X.; Che, H.; Ma, Y.; et al. A Machine Learning–Based Model to Predict Acute Traumatic Coagulopathy in Trauma Patients Upon Emergency Hospitalization. Clin. Appl. Thromb. Hemost. 2020, 26. [Google Scholar] [CrossRef]
- Balamurugan, S.A.A.; Mallick, M.S.M.; Chinthana, G. Improved prediction of dengue outbreak using combinatorial feature selector and classifier based on entropy weighted score based optimal ranking. Inform. Med. Unlocked 2020, 20. [Google Scholar] [CrossRef]
- Hu, C.A.; Chen, C.M.; Fang, Y.C.; Liang, S.J.; Wang, H.C.; Fang, W.F.; Sheu, C.C.; Perng, W.C.; Yang, K.Y.; Kao, K.C.; et al. Using a machine learning approach to predict mortality in critically ill influenza patients: A cross-sectional retrospective multicentre study in Taiwan. BMJ Open 2020, 10. [Google Scholar] [CrossRef] [PubMed]
- Aydin, E.; Türkmen, İ.U.; Namli, G.; Öztürk, Ç.; Esen, A.B.; Eray, Y.N.; Eroğlu, E.; Akova, F. A novel and simple machine learning algorithm for preoperative diagnosis of acute appendicitis in children. Pediatr. Surg. Int. 2020, 36, 735–742. [Google Scholar] [CrossRef] [PubMed]
- Metsker, O.; Magoev, K.; Yakovlev, A.; Yanishevskiy, S.; Kopanitsa, G.; Kovalchuk, S.; Krzhizhanovskaya, V.V. Identification of risk factors for patients with diabetes: Diabetic polyneuropathy case study. BMC Med. Inform. Decis. Mak. 2020, 20. [Google Scholar] [CrossRef]
- Voglis, S.; van Niftrik, C.H.B.; Staartjes, V.E.; Brandi, G.; Tschopp, O.; Regli, L.; Serra, C. Feasibility of machine learning based predictive modelling of postoperative hyponatremia after pituitary surgery. Pituitary 2020, 23, 543–551. [Google Scholar] [CrossRef]
- Scardoni, A.; Balzarini, F.; Signorelli, C.; Cabitza, F.; Odone, A. Artificial intelligence-based tools to control healthcare associated infections: A systematic review of the literature. J. Infect. Public Health 2020, 13, 1061–1077. [Google Scholar] [CrossRef]
- Teng, A.K.M.; Wilcox, A.B. A Review of Predictive Analytics Solutions for Sepsis Patients. Appl. Clin. Inform. 2020, 11, 387–398. [Google Scholar] [CrossRef] [PubMed]
- Chen, P.-H.C.; Liu, Y.; Peng, L. How to develop machine learning models for healthcare. Nat. Mater. 2019, 18, 410–414. [Google Scholar] [CrossRef] [PubMed]
- Wilkinson, J.; Arnold, K.F.; Murray, E.J.; van Smeden, M.; Carr, K.; Sippy, R.; de Kamps, M.; Beam, A.; Konigorski, S.; Lippert, C.; et al. Time to reality check the promises of machine learning-powered precision medicine. Lancet Digit. Health 2020, 2, e677–e680. [Google Scholar] [CrossRef]
- Luo, Y.; Szolovits, P.; Dighe, A.S.; Baron, J.M. 3D-MICE: Integration of cross-sectional and longitudinal imputation for multi-analyte longitudinal clinical data. J. Am. Med. Inform. Assoc. 2018, 25, 645–653. [Google Scholar] [CrossRef]
- Daberdaku, S.; Tavazzi, E.; Di Camillo, B. A Combined Interpolation and Weighted K-Nearest Neighbours Approach for the Imputation of Longitudinal ICU Laboratory Data. J. Healthc. Inform. Res. 2020, 4, 174–188. [Google Scholar] [CrossRef]
- Jazayeri, A.; Liang, O.S.; Yang, C.C. Imputation of Missing Data in Electronic Health Records Based on Patients’ Similarities. J. Healthc. Inform. Res. 2020, 4, 295–307. [Google Scholar] [CrossRef]
- Zhang, X.; Yan, C.; Gao, C.; Malin, B.A.; Chen, Y. Predicting Missing Values in Medical Data Via XGBoost Regression. J. Healthc. Inform. Res. 2020. [Google Scholar] [CrossRef]
- Bengio, Y.; Grandvalet, Y. No unbiased estimator of the variance of k-fold cross-validation. J. Mach. Learn. Res. 2004, 5, 1089–1105. [Google Scholar]
- Rodriguez, J.D.; Perez, A.; Lozano, J.A. Sensitivity analysis of k-fold cross validation in prediction error estimation. IEEE Trans. Pattern Anal. Mach. Intell. 2009, 32, 569–575. [Google Scholar] [CrossRef]
- Liu, X.; Faes, L.; Calvert, M.J.; Denniston, A.K. Extension of the CONSORT and SPIRIT statements. Lancet 2019, 394, 1225. [Google Scholar] [CrossRef]
- Liu, X.; Rivera, S.C.; Moher, D.; Calvert, M.J.; Denniston, A.K. Reporting guidelines for clinical trial reports for interventions involving artificial intelligence: The CONSORT-AI Extension. BMJ 2020, 370, m3164. [Google Scholar] [CrossRef]
- Neumaier, M. Diagnostics 4.0: The medical laboratory in digital health. Clin. Chem. Lab. Med. 2019, 57, 343–348. [Google Scholar] [CrossRef] [PubMed]


| Title | Reference | Year | Specialty | Sample | Features | Design Studio | Purpose | Objective | Analysis |
|---|---|---|---|---|---|---|---|---|---|
| Early hospital mortality prediction of intensive care unit patients using an ensemble learning approach | Awad et al. (2017) [18] | 2017 | IC | 11,722 patients (subgroups) | 20–29 ** | RC | Pg | To highlight the main data challenges in early mortality prediction in ICU patients and introduces a new machine learning based framework for Early (6h) Mortality Prediction for IC Unit patients (EMPICU) | De |
| Prediction of Recurrent Clostridium Difficile Infection (rCDI) Using Comprehensive Electronic Medical Records in an Integrated Healthcare Delivery System | Escobar et al. (2017) [19] | 2017 | ID | 12,706 | 150–23 ** | RC | Pg | To develop and validate rCDI predictive models based on ML in a large and representative sample of adults | De |
| Enhancement of hepatitis virus immunoassay outcome predictions in imbalanced routine pathology data by data balancing and feature selection before the application of support vector machines | Richardson and Lidbury (2017) [20] | 2017 | LM | 16,990 | 5–27 ** | RC | Dg | To use SVMs to identify predictors for the enhanced laboratory diagnosis of hepatitis virus infection, and to identify the type of data balancing and feature selection that best assisted this enhanced classification of HBV/HCV negative or positive | De |
| Machine Learning Algorithms for Risk Prediction of Severe Hand-Foot-Mouth Disease in Children | Zhang et al. (2017) [21] | 2017 | Pd | 530 | 18 | RC | Pg | To identify clinical and MRI-related predictors for the occurrence of severe HFMD in children and to assess the interaction effects between them using machine learning algorithms | De |
| Novel Risk Assessment Tool for Immunoglobulin Resistance in Kawasaki Disease: Application Using a Random Forest Classifier: Application Using a Random Forest Classifier | Takeuchi et al. (2017) [22] | 2017 | Pd | 767 | 23 | RC | Th | To develop a new risk assessment tool for IVIG resistance using RF | De |
| Supervised learning for infection risk inference using pathology data | Hernandez et al. (2017) [23] | 2017 | ID | >500,000 patients | 6 | RC | Dg | To evaluates the performance of different binary classifiers to detect any type of infection from a reduced set of commonly requested clinical measurements | De |
| Applied Informatics Decision Support Tool for Mortality Predictions in Patients with Cancer | Bertsimas et al. (2018) [24] | 2018 | On | 23,983 patients | 401 | RC | Pg | To develop a predictive tool that estimates the probability of mortality for an individual patient being proposed their next treatment | Re |
| Machine learning model combining features from algorithms with different analytical methodologies to detect laboratory-event-related adverse drug reaction signals | Jeong et al. (2018) [25] | 2018 | Ph | 1674 drug-laboratory event pairs | 48 | RC | Th | To develop a more accurate ADR signal detection algorithm for post-market surveillance using EHR data by integrating the results of existing ADR detection algorithms using ML models | De |
| Using Machine Learning-Based Multianalyte Delta Checks to Detect Wrong Blood in Tube Errors | Rosenbaum and Baron (2018) [26] | 2018 | LM | 20,638 patient collections of 4855 patients | 3 features for each of 11 lab tests | RC | Rch | To test whether machine learning-based multianalyte delta checks could outperform traditional single-analyte ones in identifying WBIT | De |
| An Interpretable ICU Mortality Prediction Model Based on Logistic Regression and Recurrent Neural Networks with LSTM units | Ge et al. (2018) [27] | 2018 | IC | 4896 | NA | RC | Pg | To develop an interpretable ICU mortality prediction model based on Logistic Regression and RNN with LSTM units | De |
| High-density lipoprotein cholesterol levels and pulmonary artery vasoreactivity in patients with idiopathic pulmonary arterial hypertension | Jonas et al. (2018) [28] | 2018 | Ca | 66 | NA | PC | Pg | To investigate the association between cardiometabolic risk factors and vasoreactivity of pulmonary arteries in patients with Idiopathic Pulmonary Arterial Hypertension | NE |
| Development and Validation of Machine Learning Models for Prediction of 1-Year Mortality Utilizing Electronic Medical Record Data Available at the End of Hospitalization in Multi-condition Patients: a Proof-of-Concept Study | Sahni et al. (2018) [29] | 2018 | ID | 59,848 | 4 classes ** | RC | Pg | To construct models that utilize EHR data to prognosticate 1-year mortality in a large, diverse cohort of multi-condition hospitalizations | Re |
| Predicting the risk of emergency admission with machine learning: Development and validation using linked electronic health records | Rahimian et al. (2018) [30] | 2018 | IM | 4,637,297 | 43 + 13 ** | RC | Rch | To improve discrimination and calibration for predicting the risk of emergency admission | Re |
| Analyte Quantity Detection from Lateral Flow Assay Using a Smartphone | Foysal et al. (2019) [31] | 2019 | LM | 15 LFA set for 75 readings | NE | RC | Dg | To propose a robust smartphone-based analyte (albumin) detection method that estimates the amount of analyte on an LFA strip using a smartphone camera | Ch |
| Prevalence and Predictability of Low-Yield Inpatient Laboratory Diagnostic Tests | Xu et al. (2019) [32] | 2019 | LM | 10,000 samples per feature | 43 | RC | Rch | To identify inpatient diagnostic laboratory testing with predictable results that are unlikely to yield new information | Re |
| Using artificial intelligence to reduce diagnostic workload without compromising detection of urinary tract infections | Burton et al. (2019) [33] | 2019 | LM | 225,207 | 21 | RC | Dg | To reduce the burden of culturing the large number of culture-negative samples without reducing detection of culture-positive samples | De |
| Interactive Machine Learning for Laboratory Data Integration | Fillmore et al. (2019) [34] | 2019 | LM | 4 ∗ 10^9 records | NE | RC | Rch | To develop a machine learning system to predict whether a lab test type clinically belongs within the concept of interest | Ch |
| Early prediction of acute kidney injury following ICU admission using a multivariate panel of physiological measurements | Zimmerman et al. (2019) [35] | 2019 | IC | 23,950 | NA ** | RC | Dg | To predict AKI (creatinine values in day 2 and 3) using first-day measurements of a multivariate panel of physiologic variables | De |
| A New Insight into Missing Data in IC Unit Patient Profiles: Observational Study | Sharafoddini et al. (2019) [36] | 2019 | IC | 32,618–20,318–13,670 patients (days 1–2–3) | NA ** | RC | Pg | To examine whether the presence or missingness of a variable itself in ICU records can convey information about the patient health status | De |
| Survival outcome prediction in cervical cancer: Cox models vs deep-learning model | Matsuo et al. (2019) [37] | 2019 | On | 768 | 40 ** | RC | Rch | To compare the deep Learning neural network model and the Cox proportional hazard regression model in the prediction of survival in women with cervical cancer | Re |
| Relative criticalness of common laboratory tests for critical value reporting | Yang et al. (2019) [38] | 2019 | IC | 22,174 | 23 | RC | Pg | To evaluate the relative strength of association between 23 most commonly ordered laboratory tests in a CCU setting and the adverse outcome, defined as death during the CCU stay within 24 h of reporting of the laboratory result | NE |
| Enhanced early prediction of clinically relevant neonatal hyperbilirubinemia with machine learning | Daunhawer et al. (2019) [39] | 2019 | Pd | 362 | 44–4 | PC | Dg | To enhance the early detection of clinically relevant hyperbilirubinemia in advance of the first phototherapy treatment | De |
| A clustering approach for detecting implausible observation values in electronic health records data | Estiri et al. (2019) [40] | 2019 | LM | >720 million records, 50 lab tests | NE | RC | Rch | To develop and test an unsupervised clustering-based anomaly/outlier detection approach for detecting implausible observations in EHR data | De |
| Modelling outcomes after paediatric brain injury with admission laboratory values: a machine-learning approach | Kayhanian et al. (2019) [41] | 2019 | Ns | 94 | 14 | RC | Pg | To identify which admission laboratory variables are correlated to outcomes after Traumatic Brain Injury (TBI) in children and to explore prediction of outcomes, using both univariate analysis and supervised learning methods | De |
| Automatic Machine-Learning-Based Outcome Prediction in Patients with Primary Intracerebral Haemorrhage | Wang et al. (2019) [42] | 2019 | Ns | 1-month outcome: 307; 6-month outcome: 243 | 1-month outcome: 26; 6-month outcome: 22 | RC | Pg | To predict the functional outcome in patients with primary intracerebral haemorrhage (ICH) | Ch |
| A Real-Time Early Warning System for Monitoring Inpatient Mortality Risk: Prospective Study Using Electronic Medical Record Data | Ye et al. (2019) [43] | 2019 | IM | 42,484 retrospective, 11,762 prospective | 680 ** | PC | Pg | To build and prospectively validate an Early Warning System-based inpatient mortality Electronic Medical Record | Ch |
| Routine laboratory blood tests predict SARS-CoV-2 infection using machine learning | Yang et al. (2020) [44] | 2020 | ID | 3356 | 33 | RC | Dg | To develop a ML model integrating age, gender, race and routine laboratory blood tests, which are readily available with a short Turnaround Time | De |
| Development and validation of prognosis model of mortality risk in patients with COVID-19 | Ma et al. (2020) [45] | 2020 | ID | 305 | 33 | RC | Pg | Investigate ML to rank clinical features, and multivariate logistic regression method to identify clinical features with statistical significance in prediction of mortality risk in patients with COVID-19 using their clinical data | De |
| Exploration of critical care data by using unsupervised machine learning | Hyun et al. (2020) [46] | 2020 | IC | 1503 | 9 | RC | Rch | To discover subgroups among ICU patients and to examine their clinical characteristics, therapeutic procedures conducted during the ICU stay, and discharge dispositions | NE |
| Predicting Adverse Outcomes for Febrile Patients in the Emergency Department Using Sparse Laboratory Data: Development of a Time Adaptive Model | Lee et al. (2020) [47] | 2020 | EM | 9491 | NA | RC | Pg | To develop time adaptive models that predict adverse outcomes for febrile patients assessing the utility of routine lab tests (only request OSO, and request and value OSR) | De |
| Temporal Pattern Detection to Predict Adverse Events in Critical Care: Case study With Acute Kidney Injury | Morid et al. (2020) [48] | 2020 | IC | 22,542 | 17 | RC | Pg | To evaluate approaches to predict Adverse Events in ICU settings using structural temporal pattern detection methods for both local (within each time window) and global (across time windows) trends, derived from first 48 h of ICU | NE |
| Predict or draw blood: An integrated method to reduce lab tests | Yu et al. (2020) [49] | 2020 | LM | 41,113 | 20 | RC | Rch | To propose a novel deep learning method to jointly predict future lab test events to be omitted and the values of the omitted events based on observed testing values | Re |
| Machine learning can predict survival of patients with heart failure from serum creatinine and ejection fraction alone | Chicco and Jurman (2020) [50] | 2020 | Ca | 299 | 13–2 ** | RC | Pg | To use several data mining techniques first to predict survival of the patients, and to rank the most important features included in the medical records | De |
| Comparison of Machine Learning Methods and Conventional Logistic Regressions for Predicting Gestational Diabetes Using Routine Clinical Data: A Retrospective Cohort Study | Ye et al. (2020) [51] | 2020 | Ob | 22,242 | 104 | RC | Dg | To use machine learning methods to predict GDM (Gestational Diabetes) and compare their performance with that of logistic regressions | De |
| Mortality prediction enhancement in end-stage renal disease (ESRD): A machine learning approach | Macias et al. (2020) [52] | 2020 | Ne | 261 | NA | RC | Pg | To assess the potential of the massive use of variables together with machine learning techniques for the improvement of mortality predictive models in ESRD | De |
| A recurrent neural network approach to predicting haemoglobin trajectories in patients with End-Stage Renal Disease | Lobo et al. (2020) [53] | 2020 | Ne | 1972 patients ** | NA | RC | Dg | To develop a RNN approach that uses historical data together with future ESA and iron dosing data to predict the 1-, 2-, and 3-month Hgb levels of patients with ESRD-induced anaemia | Re |
| Early diagnosis of bloodstream infections in the intensive care unit using machine-learning algorithms | Roimi et al. (2020) [54] | 2020 | IC | 2351 + 1021 | NA | RC | Dg | To develop a machine-learning (ML) algorithm that can predict intensive care unit (ICU)-acquired bloodstream infections (BSI) among patients suspected of infection in the ICU | De |
| Dynamic readmission prediction using routine postoperative laboratory results after radical cystectomy | Kirk et al. (2020) [55] | 2020 | Ur | 996 | 15 | RC | Pg | To determine if the addition of electronic health record data enables better risk stratification and 30-day readmission prediction after radical cystectomy | De |
| A Machine Learning–Based Model to Predict Acute Traumatic Coagulopathy (ATC) in Trauma Patients Upon Emergency Hospitalization | Li et al. (2020) [56] | 2020 | EM | 818 retrospective, 578 prospective | 6 ** | PC | Dg | To develop and validate a prediction model for ATC that is based on objective indicators which are already routinely obtained as patients are admitted at the hospital | De |
| Improved prediction of dengue outbreak using combinatorial feature selector and classifier based on entropy weighted score based optimal ranking | Balamurugan et al. (2020) [57] | 2020 | ID | 480 | 20 ** | RC | Dg | To analyse the performance of the proposed EWSORA Feature Selector, detailed experimentation is conducted on various ML classifiers | De |
| Using a machine learning approach to predict mortality in critically ill influenza patients: a cross-sectional retrospective multicentre study in Taiwan | Hu et al. (2020) [58] | 2020 | IC | 336 | 76 | RC | Pg | To establish an explainable ML model for predicting mortality in critically ill influenza patients using a real-world severe influenza data set (first 7 days) | De |
| A novel and simple machine learning algorithm for preoperative diagnosis of acute appendicitis in children | Aydin et al. (2020) [59] | 2020 | PS | 7244 | NA | RC | Dg | Provide an easily interpretable model to understand the relationship between blood variables and appendicitis to create an automated decision support tool in the future | De |
| Identification of risk factors for patients with diabetes: diabetic polyneuropathy case study | Metsker et al. (2020) [60] | 2020 | En | 5425 | 29–31 | RC | Pg | Early identification of the risk of diabetes polyneuropathy based on structured electronic medical records | De |
| Feasibility of machine learning based predictive modelling of postoperative hyponatremia after pituitary surgery | Voglis et al. (2020) [61] | 2020 | Ns | 207 | 26 | RC | Pg | Evaluate the feasibility of predictive modelling of postoperative hyponatremia after pituitary tumour surgery using preoperative available variables | Re |
| Reference | Validation | Comparison | Best Performer | BP’s family | Metrics Used | Results | Most Important Laboratory Features for the Model | Issues/Notes | |
|---|---|---|---|---|---|---|---|---|---|
| Awad et al. (2017) [18] | CV | RF, DT, NB, PART, Scores (SOFA, SAPS-I, APACHE-II, NEWS, qSOFA) | RF | Trees | AUROC | RF best performance (VS subset) predicting hospital mortality: 0.90 ± 0.01 AUROC AUROC RF (15 variables) at 6 h: 0.82 ± 0.04 SAPS at 24 h (best performer among scores): 0.650 ± 0.012 | Vital Signs, age, serum urea nitrogen, respiratory rate max, heart rate max, heart rate min, creatinine max, care unit name, potassium min, GCS min and systolic blood pressure min | Performance metrics for comparison referred to cross-validation results | |
| Escobar et al. (2017) [19] | CV | 3 LoR models, Zilberberg model | LoR (automated model) | Regression | AUROC, pseudo-R2, Sensitivity, Specificity, PPV, NPV, NNE, NRI, IDI | AUROC; R2 | Performance metrics for comparison referred to cross-validation results | ||
| Age ≥ 65 years | 0.546; −0.1131 | ||||||||
| Basic model | 0.591; −0.0910 | ||||||||
| Zilberberg model | 0.591; −0.0875 | ||||||||
| Enhanced model | 0.587; −0.0924 | ||||||||
| Automated model | 0.605; −0.1033 | ||||||||
| Richardson and Lidbury (2017) [20] | CV | RF (variables selection) + SVM *** | NE | SVM *** | AUROC, F1, Sensibility, Specificity, Precision | For both HBV and HCV, 3 balancing methods and 2 feature selectors were tested, showing how they can change SVM performances | HBV: ALT, Age and Sodium HCV: Age, ALT and Urea | ||
| Zhang et al. (2017) [21] | CV | GBT *** | NE | Ensemble *** | RI, H-statistic (features) AUROC, Sensibility, Specificity (model) | WBC count ≥ 15 × 109/L (RI: 49.47, p < 0.001), spinal cord involvement (RI: 26.62, p < 0.001), spinal nerve roots involvement (RI: 10.34, p < 0.001), hyperglycaemia (RI: 3.40, p < 0.001), brain or spinal meninges involvement (RI: 2.45, p = 0.003), EV-A71 infection (RI: 2.24, p < 0.001). Interaction between elevated WBC count and hyperglycaemia (H statistic: 0.231, 95% CI: 0–0.262, p = 0.031), between spinal cord involvement and duration of fever (H statistic: 0.291, 95% CI: 0.035–0.326, p = 0.035), and between brainstem involvement and body temperature (H statistic: 0.313, 95% CI: 0–0.273, p = 0.017) GBT model: 92.3% prediction accuracy, AUROC 0.985, Sensibility 0.85, Specificity 0.97 | |||
| Takeuchi et al. (2017) [22] | OOB | Scores (Gunma Score, Kurume Score and Osaka Score), RF | RF | Trees | AUROC, Sensibility, Specificity, PPV, NPV, Out OF Bag error estimation | RF: AUROC 0.916, Sensitivity 79.7%, Specificity 87.3%, PPV 85.2%, NPV82.1%, OOB error rate 15.5% Sensitivity and Specificity were: 69.8% and 60.0% GS; 60.6% and 55.4% KS; 24.1% and 77.0% OS. PPV (28.2%–45.1%), NPV (82.0%–86.8%) | Aspartate aminotransferase, lactate dehydrogenase concentrations, percent neutrophils | Performance metrics for comparison referred to cross-validation results | |
| Hernandez et al. (2017) [23] | CV | DT, RF, SVM, Naive Bayes | SVM | SVM | AUROC, AUPRC, Sensitivity, Specificity, PPV, NPV, TP, FP, TN, FN | SVM with SMOTE sampling method and considering 6 features obtained the best results AUROC, AUCPR, Sensibility, Specificity 0.830, 0.884, 0.747, 0.912 | |||
| Bertsimas et al. (2018) [24] | VS | LoR, Regularized LoR, Optimal Classification Tree, CART, GBT | Optimal Classification Tree * | Trees | Accuracy (threshold 50%), PPV at Sensibility of 0.6, AUC | Optimal Classification Tree results 60-day mortality, 90-day, 120-day Accuracy: 94.9, 93.3, 86.1 PPV: 20.2, 27.5, 43.1 AUC: 0.86, 0.84, 0.83 | Albumin, change in weight, Pulse, WBC count, Haematocrit according to the kind of cancer | The validation set was used only for NN, KNN, and SVM | |
| Jeong et al. (2018) [25] | CV | CERT, CLEAR, PACE, RF, L1-regularized LoR, SVM, NN | RF | Trees | AUROC, F1, Sensibility, Specificity, PPV, NPV | ML models produced higher averaged F1-measures (0.629–0.709) and AUROC (0.737–0.816) compared to those of the original methods AUROC (0.020–0.597) and F1 (0.475–0.563) | |||
| Rosenbaum and Baron (2018) [26] | NA | Univariate models, LoR, SVM | SVM | SVM | AUC, Specificity, PPV | AUROC on testing set (simulated WIBT) best univariate (BUN): 0.84 (interquartile range 0.83–0.84) SVM (difference and values): 0.97 (0.96–0.97) LoR (Difference and values): 0.93 | Difference and Values together | Not available data from the comparison among machines | |
| Ge et al. (2018) [27] | CV | RNN-LSTM + LoR vs LoR | RNN-LSTM | DL | AUROC, TP, FP | AUROC cross-validation, AUROC testing set Logistic Regression: 0.7751, 0.7412 RNN-LSTM model: 0.8076, 0.7614 | Associated with ICU Mortality: Do Not Reanimate, Prednisolone, Disseminated intravascular coagulation; Associated with ICU Survival: Arterial blood gas pH, Oxygen saturation, Pulse | ||
| Jonas et al. (2018) [28] | CV | LoR (LASSO), RF *** | NE | NE | NE | LASSO identified as the most predictive of a positive response to vasoreactivity test: 6-MWD, diabetes, HDL-C, creatinine, right atrial pressure, and cardiac index RF identified as the most predictive: NT-proBNP, HDL-C, creatinine, right atrial pressure, and cardiac index 6-MWD, HDL-C, hs-CRP, and creatinine levels best discriminated between long-term-responder and not | Performance metrics for comparison referred to cross-validation results Tool available online | ||
| Sahni et al. (2018) [29] | NA | LoR, RF | RF | Trees | AUROC | AUROC RF (demographics, physiological, lab, all comorbidities) 0.85 (0.84–0.86) LoR (demographics, physiological, lab, all comorbidities) 0.91 (0.90–0.92) | Age, BUN, platelet count, haemoglobin, creatinine, systolic blood pressure, BMI, and pulse oximetry readings | Performance metrics for comparison referred to cross-validation results | |
| Rahimian et al. (2018) [30] | CV | CPH, RF, GBC | GBC | Ensemble | AUROC | AUROC (CI95), internal validation variables, CPH, RF, GBC QA: 0.740 (0.739, 0.741), 0.752 (0.751, 0.753), 0.779 (0.777, 0.781) T: 0.805 (0.804, 0.806), 0.825 (0.824, 0.826), 0.848 (0.847, 0.849) external validation QA: 0.736, 0.736, 0.796 T: 0.788, 0.810, 0.826 | age, cholesterol ratio, haemoglobin, and platelets, frequency of lab tests, systolic blood pressure, number of admissions during the last year | Tool available online | |
| Foysal et al. (2019) [31] | CV | Regression analysis and SVM *** | NE | SVM | R2 score, Standard error of detection, Accuracy | Accuracy: 98% | NE | Performance metrics for comparison referred to cross-validation results | |
| Xu et al. (2019) [32] | CV | L1 Logistic Regression, Regress and Round, Naive Bayes, NN-MLP, DT, RF, AdaBoost, XGBoost. | XGBoost, RF | NA | AUROC, Sensitivity, Specificity, NPV, PPV | Mean AUROC: 0.77 on testing set AUROC > 0.90 on 22 lab tests out of 43 On external validation: results were different according to lab test considered | NE | DL missed Albumin as OS predictor | |
| Burton et al. (2019) [33] | CV | Heuristic model (LoR) with microscopy thresholds, NN, RF, XGBoost | XGBoost * | Ensemble | AUROC, Accuracy, PPV, NPV, Sensitivity, Specificity, Relative Workload Reduction (%) | AUC Accuracy PPV NPV Sensitivity (%) Specificity (%) Relative Workload Reduction (%) Pregnant patients 0.828, 26.94, 94.6 [±0.56], 26.84 [±1.88], 25.29 [±0.92] Children (<11 years) 0.913, 62.00, 94.8 [±0·88], 55.00 [±2.12], 46.24 [±1.48] Pregnant patients 0.894, 71.65, 95.3 [±0.24], 60.93 [±0.65], 43.38 [±0.41] Combined performance 0.749, 65.65, 47.64 [±0.51], 97.14 [±0.28], 95.2 [±0.22], 60.93 [±0.60], 41.18 [±0.39] | WBC count, Bacterial count, Age, Epithelial cell count, RBC count | ||
| Fillmore et al. (2019) [34] | CV | L1 LoR (LASSO), SVM, RF | RF | Trees | Accuracy | LabTest: LR, SVM, RF ALP: 0.98, 0.97, 0.98 ALT: 0.98, 0.94, 0.92 ALB: 0.97, 0.92, 0.98 HDLC: 0.98, 0.91, 0.98 Na: 0.97, 0.98, 0.99 Mg: 0.97, 0.95, 0.99 HGB: 0.97, 0.95, 0.99 | Not provided precise data of the performances on testing set | ||
| Zimmerman et al. (2019) [35] | CV | LiR, LoR, RF, NN-MLP | NN-MLP | DL | AUROC, Accuracy, Sensitivity, Specificity, PPV, NPV | LiR Regression task: RMSEV Linear Backward Selection Model 0.224 Linear All Variables Model 0.224 AUROC, Accuracy, Sensitivity, Specificity, PPV, NPV LR, Backward Selection Model: 0.780, 0.724, 0.697, 0.730, 0.337, 0.924 LR, All Variables Model: 0.783, 0.729, 0.698, 0.736, 0.342, 0.925 RF, Backward Selection Model: 0.772, 0.739, 0.660, 0.754, 0.346, 0.918 RF, All Variables Model: 0.779, 0.742, 0.673, 0.756, 0.352, 0.921 MLP, Backward Selection Model: 0.792, 0.744, 0.684, 0.756, 0.356, 0.924 MLP, All Variables Model: 0.796, 0.743, 0.694, 0.753, 0.357, 0.926 | Sex, age, ethnicity, Hypoxemia, mechanical ventilation, Coagulopathy, calcium, potassium, creatinine level | Performance metrics for comparison referred to cross-validation results | |
| Sharafoddini et al. (2019) [36] | CV | LASSO for choosing most important variables. DT, LoR, RF, SAPS-II (score) | Logistic Regression | Regression | AUROC | Including indicators improved the AUROC in all modelling techniques, on average by 0.0511; the maximum improvement was 0.1209 | BUN, RDW, anion gap all 3 days. day 1: TBil, phosphate, Ca, and Lac day 2&3: Lac, BE, PO2, and PCO2 day 3: PTT and pH | ||
| Matsuo et al. (2019) [37] | CV | NN, CPH, CoxBoost, CoxLasso, Random Survival Forest | NN | DL | Concordance Index, Mean Absolute Error | Progression-free survival (PFS): Concordance index, Mean absolute error (mean ± standard error) CPH: 0.784 ± 0.069, 316.2 ± 128.3 DL: 0.795 ± 0.066, 29.3 ± 3.4 Overall survival (OS): CPH: 0.607 ± 0.039, 43.6 ± 4.3 DL: 0.616 ± 0.041, 30.7 ± 3.6 | PFS: BUN, Creatinine, Albumin, (Only DL) WBC, Platelet, Bicarbonate, Haemoglobin OS: BUN (only DL) Bicarbonate (only CPH) Platelet, Creatinine, Albumin | ||
| Yang et al. (2019) [38] | OOB | RF *** | NE | Trees *** | OOB | Predicting Outcome (discharge/death) Out-of-bag error 0.073 Accuracy: 0.927 Recall/sensitivity: 0.702 Specificity: 0.973 Precision: 0.840 | bicarbonate, phosphate, anion gap, white cell count (total), PTT, platelet, total calcium, chloride, glucose and INR | Not clear how they split dataset and which results are reported | |
| Daunhawer et al. (2019) [39] | CV | L1 Regularized LoR (LASSO), RF | RF+LASSO | NE | AUROC | AUROC cross-validation test set external set RF: 0.933 ± 0.019, 0.927, 0.9329 LASSO: 0.947 ± 0.015, 0.939, 0.9470 RF + LASSO: 0.952 ± 0.013, 0.939, 0.9520 | Gestational Age, weight, bilirubin level, and hours since birth | ||
| Estiri et al. (2019) [40] | Pl | CAD (Standard deviation and Mahalanobis distance), Hierarchical k-means | Hierarchical k-means | Clustering | FP, TP, FN, TN, Sensitivity, Specificity, and fallout across the eight thresholds | Specificity increases as threshold decreases. The lowest was 0.9938 Sensitivity in 39/41 variable > 0.85, Troponin I = 0.0545, LDL = 0.4867 About sensitivity, 39/41 CAD~ML, 9/41 CAD > ML About FP, in 45/50 ML had less FP than CAD | |||
| Kayhanian et al. (2019) [41] | CV | LoR, SVM | SVM | SVM | Sensitivity, Specificity, AUC, J-statistic | Sensitivity, Specificity, J-statistic, AUC Linear model, all variables: 0.75, 0.99, 0.7, 0.9 Linear model, three variables: 0.71, 0.99, 0.74, 0.83 SVM, all variables: 0.63, 1, 0.79, N/A SVM, three variables: 0.8, 0.99, 0.63, N/A | Lactate, pH and glucose | ||
| Wang et al. (2019) [42] | CV | Auto-Weka (39 ML algorithms) | RF | Trees | Sensitivity, Specificity, AUROC, Accuracy | Time after ICH, Case number, Best algorithms Sensitivity, Specificity, Accuracy, AUC 1-month: 307 Random forest, 0.774, 0.869, 0.831, 0.899 6 months: 243 Random forest, 0.725, 0.906, 0.839, 0.917 | 1 month: ventricle compression, GCS, ICH volume, location, Hgb; 6 months: GCS, location, age, ICH volume, gender, DBP, WBC | Connection between HDL-C and reactivity of the pulmonary vasculature is a novel finding | |
| Ye et al. (2019) [43] | NA | Retrospective: RF, XGBoost, Boosting, SVM, LASSO, KNN Prospective: RF | RF | Trees | AUROC, PPV, Sensitivity, Specificity | RF’s AUROC: 0.884 (highest among all other ML models) high-risk sensitivity, PPV, low–moderate risk sensitivity, PPV EWS: 26.7%, 69%, 59.2%, 35.4% ViEWS: 13.7%, 35%, 35.7%, 21.4% | Diagnoses of cardiovascular diseases, congestive heart failure, or renal diseases | No information about tuning | |
| Yang et al. (2020) [44] | CV | LoR, DT (CART), RF, and GBDT | GBDT | Ensemble | AUROC, sensitivity, specificity, agreement with RT-PCR (Agr-PCR) | AUROC; Sensitivity; Specificity; Agr-PCR GBDT 0.854 (0.829–0.878); 0.761 (0.744–0.778); 0.808 (0.795–0.821); 0.791 (0.776–0.805); on cross-validation; GBDT 0.838; 0.758; 0.740 on independent testing set | LDH, CRP, Ferritin | No information about model, training, validation, test | |
| Ma et al. (2020) [45] | CV | RF, XGBoost, LoR for selecting variables for the new model New Model vs Score (CURB-65), XGBoost | New Model | Other | AUROC | AUROC on testing set (13 patients), AUROC on cross-validation New Model: 0.9667, 0.9514 CURB-65: 0.5500, 0.8501 XGBoost: 0.3333, 0.4530 | LDH, CRP, Age | Tool available online | |
| Hyun et al. (2020) [46] | NE | k-means*** | NE | Clustering*** | NE | 3 Clusters Cluster 2: abnormal haemoglobin and RBC Cluster 3: highest mortality, intubation, cardiac medications and blood administration | BUN, creatinine, potassium, haemoglobin, and red blood cell | ||
| Lee et al. (2020) [47] | CV | RF, SVM, LASSO, Ridge, Elastic Net Regulation, MEWS | RF | Trees | AUROC, AUPRC, BA, Sensitivity, Specificity, F1, PLR, and NLR | AUROC AUPRC Sensitivity Specificity RF OSO: 0.80 (0.76 to 0.84); 0.25 (0.18 to 0.33); 0.70 (0.62 to 0.82); 0.78 (0.66 to 0.83) RF OSR: 0.88 (0.85 to 0.91); 0.39 (0.30 to 0.47); 0.81 (0.76 to 0.89); 0.81 (0.75 to 0.83) | OSO: Troponin I, creatine kinase and CK-MB; OSR: Lactic Acid | Performance metrics for comparison referred to cross-validation results | |
| Morid et al. (2020) [48] | CV | RF, XGBT, Kernel-based Bayesian Network, SVM, LoR, Naive Bayes, KNN, ANN | RF | Trees | AUC, F1, Accuracy | RF Model performances according to the detection method, Accuracy AUC Last recorded Value: 0.581, 0.589 Symbolic pattern detection: 0.706, 0.694 Local structural pattern: 0.781, 0.772 Global structural pattern: 0.744, 0.730 Local & Global: 0.813, 0.809 | NE | ||
| Yu et al. (2020) [49] | NA | ANN*** | NE | DL *** | Checking Proportions (CP), Prediction Accuracy, Aggregated Accuracy (AA) | Threshold for CP.AA. performing test 0.15: 90.14%; 95.83% 0.25: 85.78%; 95.05% 0.35: 79.71%; 93.32% 0.45: 71.70%; 90.95% 0.6: 50.46%; 85.30% | NE | Not included data about performances, but only graph of AUROC of prediction to 1 month (with 4-month history) | |
| Chicco and Jurman (2020) [50] | VS | LiR, RF, One-Rule, DT, ANN, SVM, KNN, Naive Bayes, XGBoost | RF | Trees | MCC, F1, Accuracy, TP, TN, PRAUC, AUROC | MCC F1 Accuracy TP TN PRAUC AUROC All features RF + 0.384, 0.547, 0.740, 0.491, 0.864, 0.657, 0.800 Cr+ EF RF +0.418 0.754 0.585 0.541 0.855 0.541 0.698 Cr+EF+FU time LoR +0.616 0.719 0.838 0.785 0.860 0.617 0.822 | Serum Creatinine and Ejection Fraction | ||
| Ye et al. (2020) [51] | CV | GDBT, AdaBoost, LGB, Logistic, Vote, XGB, Decision Tree, and Random Forest, stepwise LoR, LoR with RCS | GDBT | Ensemble | AUROC, Recall, Precision, F1 | Discrimination AUC GDBT 73.51%, 95% CI 71.36%–75.65% LoR with RCS 70.9%, 95% CI 68.68%–73.12% 0.3 and 0.7 were set as cut-off points for predicting outcomes (GDM or adverse pregnancy outcomes) | GBDT: Fasting blood glucose, HbA1c, triglycerides, and maternal BMI LoR: HbA1c and high-density lipoprotein | ||
| Macias et al. (2020) [52] | CV | RF (features) + RNN-LSTM, RF | RNN-LSTM (all variables) | DL | AUROC | AUROC mortality prediction 1 month RF 0.737 RNN (many) expert variables 0.781 ± 0.021 RNN RF variables 0.820 ± 0.015 RNN all variables 0.873 ± 0.021 | |||
| Lobo et al. (2020) [53] | VS | RNN-LSTM + NN + RNN-LSTM *** | NE | DL | Mean Error (ME), Mean Absolute Error (MAE), Mean Squared Error (MSE) | Best model performance ME: 0.017; MAE: 0.527; MSE: 0.489; predicting to 1 month with 5 month of history data | |||
| Roimi et al. (2020) [54] | CV | 6 RF+2 XGBoost, RF, XGBoost, LoR | 6 RF+2 XGBoost | Other | AUROC, Brier score | Modelling approach BIDMC RHCC AUROC Derivation set, CV Validation set, Derivation set, CV Validation set Logistic-regression: 0.75 ± 0.06, 0.70 ± 0.02, 0.80 ± 0.08, 0.72 ± 0.02 Random-Forest: 0.82 ± 0.03, 0.85 ± 0.01, 0.90 ± 0.03, 0.88 ± 0.02 Gradient Boosting Trees: 0.84 ± 0.04, 0.84 ± 0.02, 0.93 ± 0.04, 0.88 ± 0.01 Ensemble of models: 0.87 ± 0.03, 0.89 ± 0.01, 0.93 ± 0.03, 0.92 ± 0.01 validating the models of BIDMC over RHCC dataset and vice versa, the AUROCs of the models deteriorated to 0.59 ± 0.07 and 0.60 ± 0.06 for BIDMC and RHCC | Most of the strongest features included patterns of change in the time-series variables | Performance metrics for comparison referred to cross-validation results | |
| Kirk et al. (2020) [55] | NA | SVM (cut-offs features), LoR, Random Forest regression Algorithm | RF | Trees | AUROC | AUROC baseline clinical and demographic values 0.52 inclusion of laboratory value thresholds from the day of discharge 0.54 add daily postoperative laboratory thresholds to the demographic and clinical variables 0.59 add postoperative complications 0.62 random forest regression all features 0.68 | white blood cell count, bicarbonate, BUN, and creatinine | ||
| Li et al. (2020) [56] | VS | RF, LoR | LoR | Regression | AUROC, Accuracy, Precision, F1, Recall | Prospective cohort results AU-ROC Accuracy Precision F1 score Recall RF: 0.830 (0.770–0.887), 0.916 (0.891–0.936), 0.907 (0.881–0.928), 0.901 (0.874–0.922), 0.917 (0.892–0.937) LoR: 0.858 (0.808–0.903), 0.905 (0.879–0.926), 0.887 (0.859–0.910), 0.883 (0.855–0.906), 0.905 (0.879–0.926) | RBC, SI, BE, Lac, DBP, pH | ||
| Balamurugan et al. (2020) [57] | CV | Auto-Weka (Naive Bayes, DT-J48, MLP, SVM) & 4 features selectors *** | NE | NE | AUROC, F1, Precision, Accuracy, Recall, MCC, TPR, FPR | Proposed model: features selected; Accuracy; TP Rate; FP Rate GA + J48: 9; 94.32; 0.925; 0.118; PSO + J48: 9; 96.25; 0.963; 0.163; CFS + J48: 11; 84.63; 0.861; 0.871; EWSORA + J48; 4; 98.72; 0.950; 0.165; | RBC, HGB, HCT, WBC | Performance metrics for comparison referred to cross-validation results | |
| Hu et al. (2020) [58] | CV | XGBoost, RF, LR, Score (APACHE II, PSI) | XGBoost | Ensemble | AUROC | AUROC XGBoost 0.842 (95% CI 0.749–0.928) RF 0.809 (95% CI 0.629–0.891) LR 0.701 (95% CI 0.573–0.825) APACHE II 0.720 (95% CI 0.653–0.784) PSI 0.720 (95% CI 0.654–0.7897) | Fluid balance domain, Laboratory data domain, severity score domain, Management domain, Demographic and symptom domain, Ventilation domain | ||
| Aydin et al. (2020) [59] | CV | Naïve Bayes, KNN, SVM, GLM, RF, and DT | DT * | Trees | AUC, Accuracy, Sensitivity, Specificity | AUC (%) Accuracy (%) Sensitivity (%) Specificity (%) RF 99.67; 97.45; 97.79; 97.21 KNN 98.68; 95.58; 95.08; 95.93 NB 98.71; 94.76; 94.06; 95.25 DT 93.97; 94.69; 93.55; 96.55 SVM 96.76; 91.24; 90.32; 91.86 GLM 96.83; 90.96; 90.66; 91.16 | Platelet distribution width (PDW), white blood cell count (WBC), neutrophils, lymphocytes | ||
| Metsker et al. (2020) [60] | CV | KNN for clustering data and then comparison among Linear Regression, Logistic Regression, ANN, DT, and SVM | ANN | DL | AUROC, F1, Precision, Accuracy, Recall | Model Precision Recall F1 score Accuracy AUC 29’s variables Linear Regression 0.6777, 0.7911, 0.7299 0.7472 31’s variables ANN 0.7982, 0.8152, 0.8064, 0.8261, 0.8988 | Age, Mean Platelet Volume | ||
| Voglis et al. (2020) [61] | Bt | Generalized Linear Models (GLM), GLMBoost, Naïve Bayes classifier, and Random Forest | GLMBoost | Ensemble | AUROC, Accuracy, F1, PPV, NPV, Sensibility, Specificity | AUROC: 84.3% (95% CI 67.0–96.4) Accuracy: 78.4% (95% CI 66.7–88.2) Sensitivity: 81.4% Specificity: 77.5% F1 score: 62.1% NPV (93.9%) PPV (50%) | preoperative serum prolactin preoperative serum insulin-like growth factor 1 level (IGF-1) BMI preoperative serum sodium level | ||
| Specialty | 2017 | 2018 | 2019 | 2020 |
|---|---|---|---|---|
| Cardiology | 0 | 1 | 0 | 1 |
| Emergency Medicine | 0 | 0 | 0 | 2 |
| Endocrinology | 0 | 0 | 0 | 1 |
| Intensive Care | 1 | 1 | 3 | 4 |
| Infectious Disease | 2 | 1 | 0 | 3 |
| Internal Medicine | 0 | 1 | 1 | 0 |
| Laboratory Medicine | 1 | 1 | 5 | 1 |
| Nephrology | 0 | 0 | 0 | 2 |
| Neurosurgery | 0 | 0 | 2 | 1 |
| Obstetrics | 0 | 0 | 0 | 1 |
| Oncology | 0 | 1 | 1 | 0 |
| Paediatric Surgery | 0 | 0 | 0 | 1 |
| Paediatrics | 2 | 0 | 1 | 0 |
| Pharmacology | 0 | 1 | 0 | 0 |
| Urology | 0 | 0 | 0 | 1 |
| Total | 6 | 7 | 13 | 18 |
Publisher’s Note: MDPI stays neutral with regard to jurisdictional claims in published maps and institutional affiliations. |
© 2021 by the authors. Licensee MDPI, Basel, Switzerland. This article is an open access article distributed under the terms and conditions of the Creative Commons Attribution (CC BY) license (http://creativecommons.org/licenses/by/4.0/).
Share and Cite
Ronzio, L.; Cabitza, F.; Barbaro, A.; Banfi, G. Has the Flood Entered the Basement? A Systematic Literature Review about Machine Learning in Laboratory Medicine. Diagnostics 2021, 11, 372. https://doi.org/10.3390/diagnostics11020372
Ronzio L, Cabitza F, Barbaro A, Banfi G. Has the Flood Entered the Basement? A Systematic Literature Review about Machine Learning in Laboratory Medicine. Diagnostics. 2021; 11(2):372. https://doi.org/10.3390/diagnostics11020372
Chicago/Turabian StyleRonzio, Luca, Federico Cabitza, Alessandro Barbaro, and Giuseppe Banfi. 2021. "Has the Flood Entered the Basement? A Systematic Literature Review about Machine Learning in Laboratory Medicine" Diagnostics 11, no. 2: 372. https://doi.org/10.3390/diagnostics11020372
APA StyleRonzio, L., Cabitza, F., Barbaro, A., & Banfi, G. (2021). Has the Flood Entered the Basement? A Systematic Literature Review about Machine Learning in Laboratory Medicine. Diagnostics, 11(2), 372. https://doi.org/10.3390/diagnostics11020372