Quantitative Magnetic Resonance Imaging in Perianal Crohn’s Disease at 1.5 and 3.0 T: A Feasibility Study
Abstract
:1. Introduction
- To measure disease activity within a pCD patient cohort using quantitative MRI sequences (DWI, DCE, MT and T2 relaxometry) and clinical parameters before and after biological therapy.
- To investigate the repeatability of the quantitative data and compare the utility of both 1.5 and 3 T MRI platforms.
- To design a pCD MRI model to predict response to therapy at baseline.
- To investigate the inter-relationship between these MRI sequences.
2. Materials and Methods
2.1. Study Population
2.2. MRI Image Acquisition
2.3. MRI Image Analysis
2.3.1. Radiological Evaluation
2.3.2. Repeatability of Quantitative Measurements
2.4. Clinical Evaluation
2.5. Statistical Methods
3. Results
3.1. Patient Characteristics
3.2. Changes in Clinical and MRI Parameters after Treatment
3.3. Repeatability of Quantitative Measurements
3.4. A Baseline Model to Predict Response at Week 12
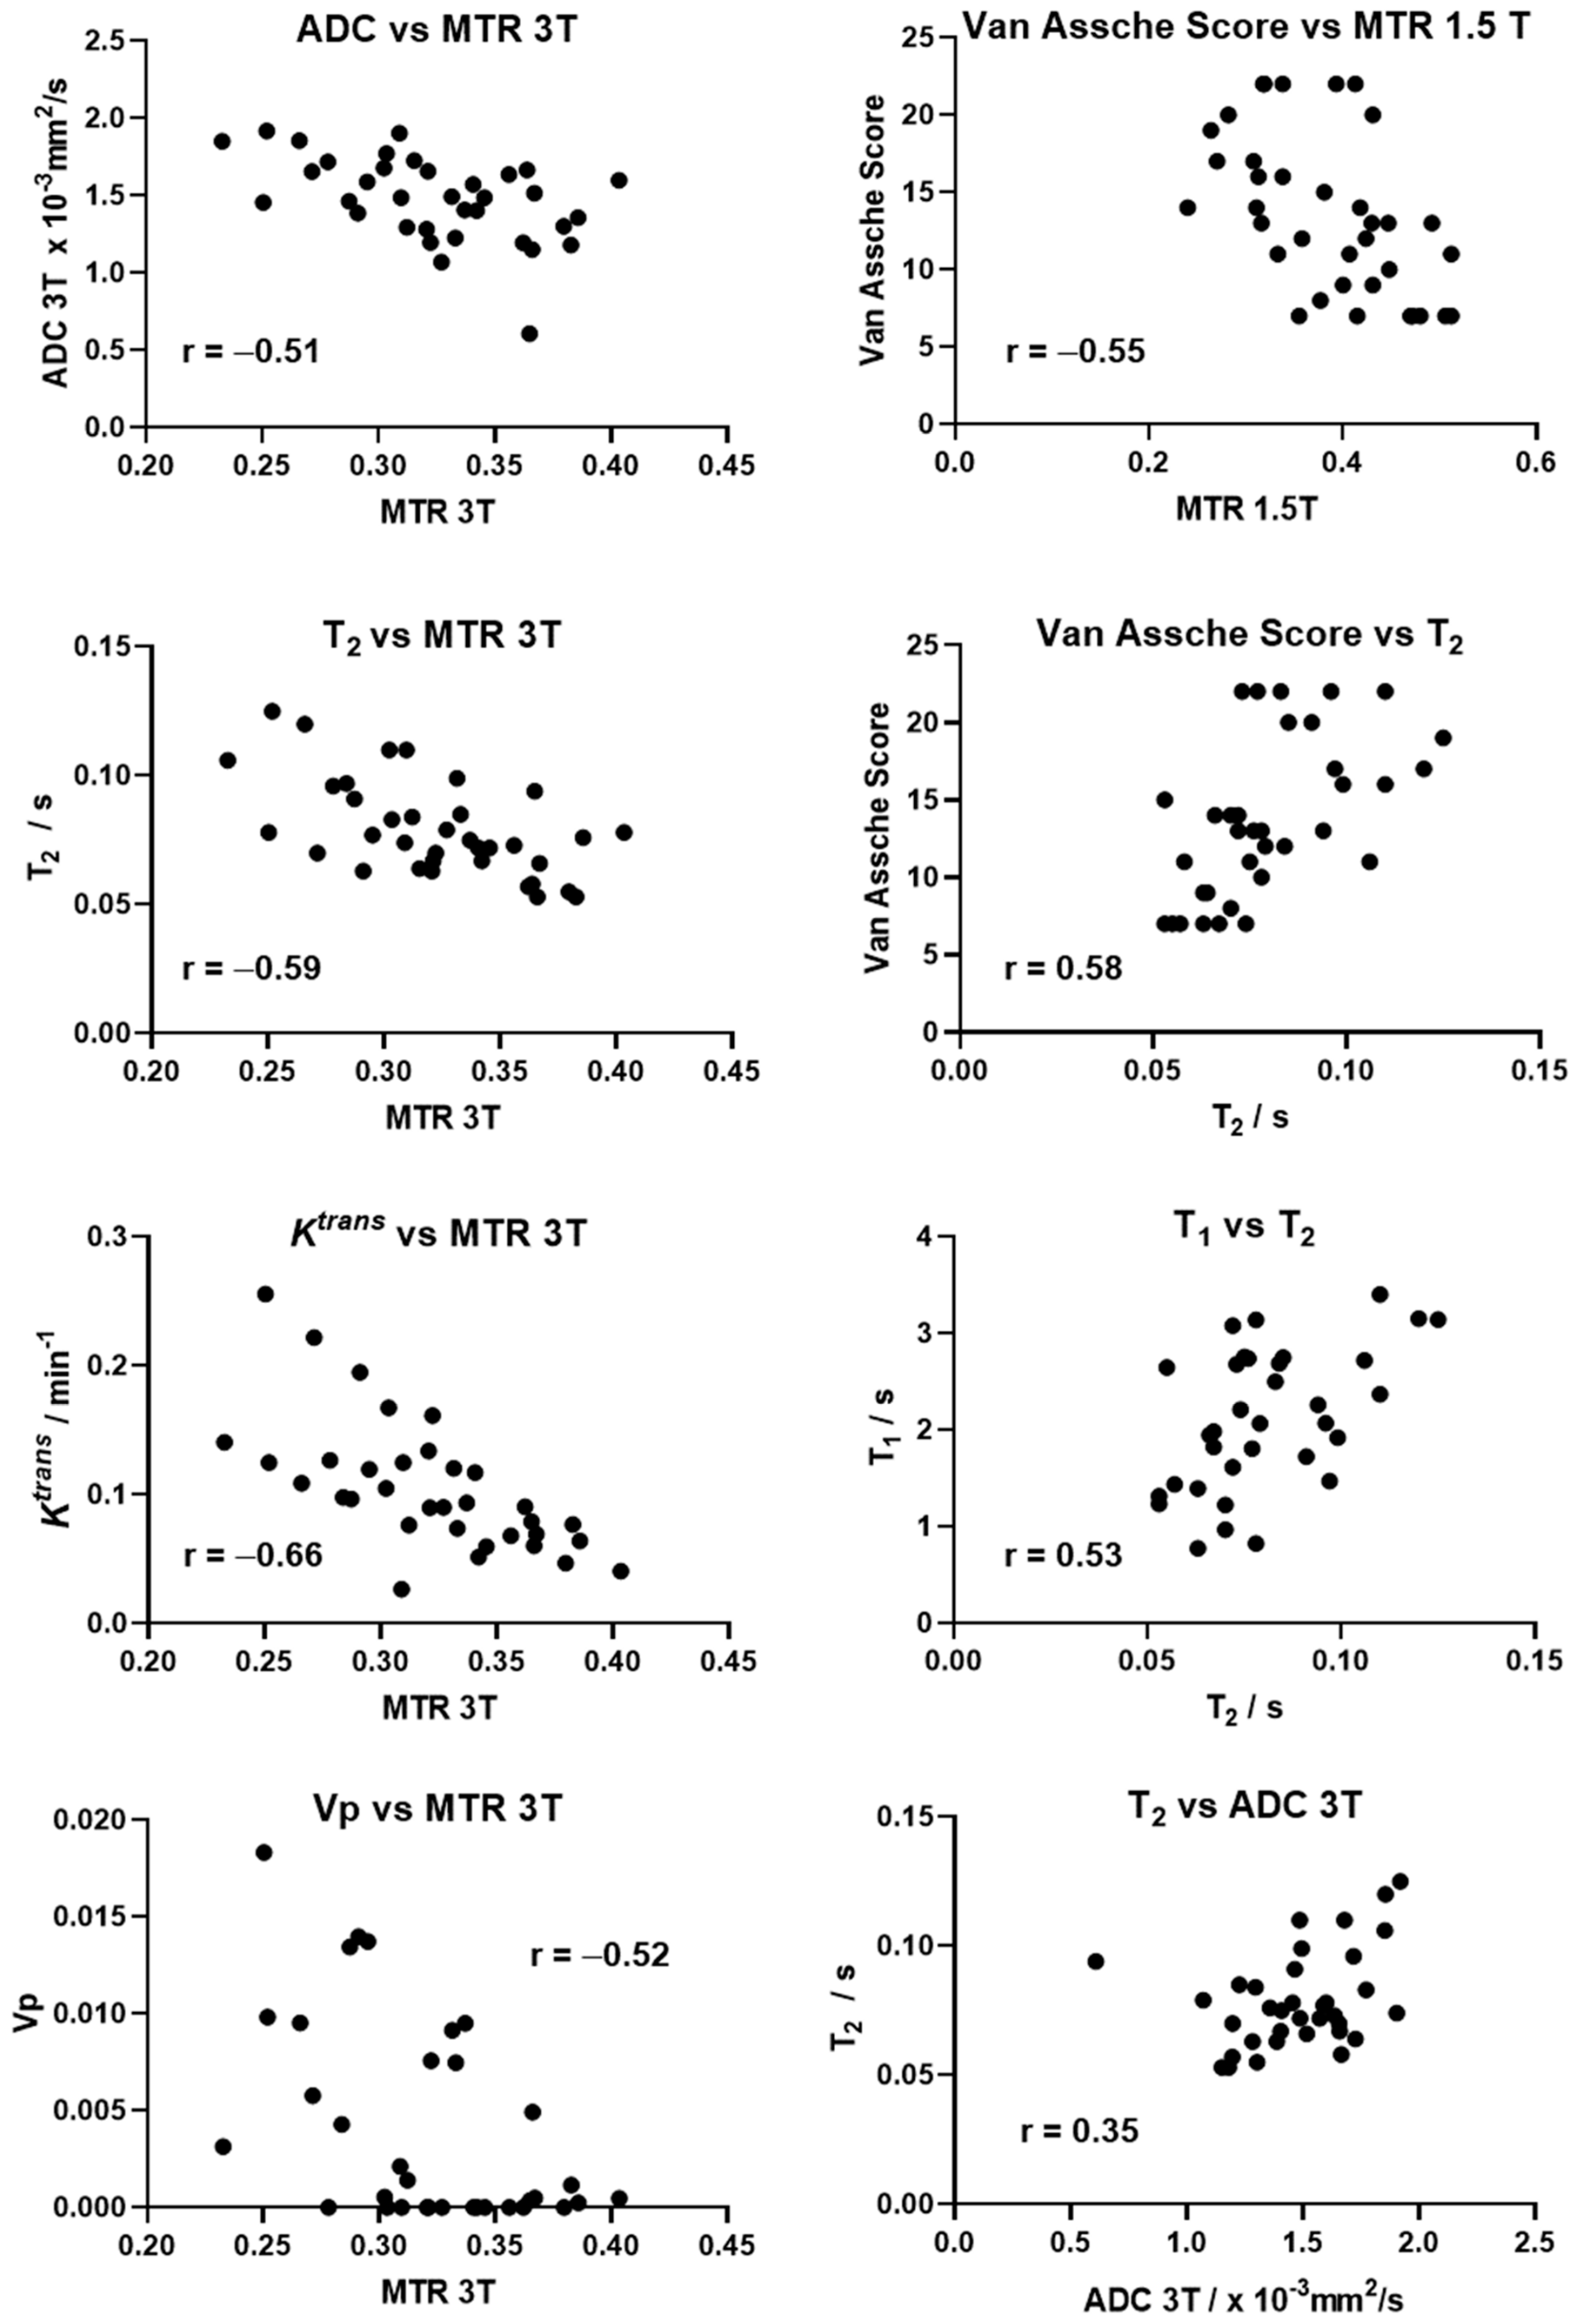
3.5. Correlation between MRI Parameters
4. Discussion
5. Conclusions
Supplementary Materials
Author Contributions
Funding
Institutional Review Board Statement
Informed Consent Statement
Data Availability Statement
Acknowledgments
Conflicts of Interest
Appendix A
| Parameters | Imaging Plane | TR/TE ms | FOV mm2 | Slice Thickness (Gap) mm | Matrix Acquired | Matrix Recon |
|---|---|---|---|---|---|---|
| T2w FSE | Sagittal | 4500/93 | 260 × 260 | 4 (0.4) | 288 × 244 | 512 × 512 |
| T2w FSE | Coronal | 7000/114 | 320 × 320 | 4 (0.4) | 320 × 224 | 512 × 512 |
| T2w FSE | Axial | 9740/114 | 320 × 320 | 4 (0.4) | 320 × 224 | 512 × 512 |
| STIR FSE | Coronal Oblique | 4100/57 | 270 × 270 | 3 (0.3) | 256 × 224 | 256 × 256 |
| STIR FSE | Axial Oblique | 3900/58 | 270 × 270 | 3 (0.3) | 256 × 224 | 256 × 256 |
| MTR GRE | Coronal Oblique | 33/3.8 | 380 × 380 | 4 (0.4) | 288 × 244 | 512 × 512 |
| DWI | Axial | 2000/71 | 350 × 350 | 4 (0.4) | 144 × 144 | 256 × 256 |
| Parameters | Imaging Plane | TR/TE ms | FOV mm2 | Slice Thickness (Gap) mm | Matrix Acquired | Matrix Recon |
|---|---|---|---|---|---|---|
| T2w FSE | Sagittal | 3163/90 | 260 × 260 | 4 (0.4) | 324 × 255 | 384 × 384 |
| T2w FSE | Coronal | 4291/109 | 320 × 320 | 4 (0.4) | 320 × 240 | 400 × 400 |
| T2w FSE | Axial | 4517/106 | 320 × 320 | 4 (0.4) | 320 × 257 | 400 × 400 |
| STIR FSE | Coronal Oblique | 4643/60 | 270 × 270 | 3 (0.3) | 300 × 240 | 400 × 400 |
| STIR FSE | Axial Oblique | 4916/60 | 270 × 270 | 3 (0.3) | 300 × 240 | 384 × 384 |
| MTR GRE | Coronal Oblique | 47/4.2 | 300 × 300 | 4 (0) | 272 × 231 | 336 × 336 |
| DWI | Axial | 2500/64 | 350 × 350 | 4 (0.4) | 144 × 144 | 160 × 160 |
| Parameters | Imaging Plane | TR/TE ms | FOV mm2 | Slice Thickness (Gap) mm | Matrix Acquired | Matrix Recon |
|---|---|---|---|---|---|---|
| T2w FSE | Sagittal | 5417/100 | 260 × 260 | 4 (0.4) | 228 × 220 | 320 × 320 |
| T2w FSE | Coronal | 6500/100 | 320 × 320 | 4 (0.4) | 280 × 252 | 384 × 384 |
| T2w FSE | Axial | 10,472/100 | 320 × 320 | 4 (0.4) | 280 × 220 | 384 × 384 |
| T2w FSE SPAIR | Coronal Oblique | 4526/80 | 270 × 270 | 3 (0.3) | 272 × 237 | 288 × 288 |
| T2w FSE SPAIR short echo time | Coronal Oblique | 4526/7.3 | 270 × 270 | 3 (0.3) | 272 × 237 | 288 × 288 |
| T2w FSE SPAIR | Axial Oblique | 4385/80 | 270 × 270 | 3 (0.3) | 244 × 244 | 352 × 352 |
| DWI | Axial | 6154/88 | 320 × 296 | 4 (0.4) | 160 × 146 | 192 × 192 |
| MTR 3D GRE | Coronal Oblique | 72/4.5 | 298 × 298 | 3 (0) | 248 × 228 | 384 × 384 |
| 3D T1w GRE VFA (2°,10°,20°,30°) | Coronal Oblique | 9.2/1.8 | 280 × 280 | 4 (0) | 216 × 216 | 288 × 288 |
| T1w GRE Pre/Post-contrast FATSAT | Coronal Oblique | 3.2/1.5 | 260 × 260 | 1.6 (0) | 162 × 162 | 288 × 288 |
| T1w GRE Pre/Post contrast FATSAT | Axial Oblique | 3.2/1.5 | 260 × 260 | 1.6 (0) | 162 × 162 | 288 × 288 |
| DCE-4D THRIVE with Fat Sat | Coronal Oblique | 3.3/1.6 | 280 × 280 | 4 (0) | 216 × 216 | 288 × 288 |
| Parameters | Imaging Plane | TR/TE ms | FOV mm2 | Slice Thickness (Gap) mm | Matrix Acquired | Matrix Recon |
|---|---|---|---|---|---|---|
| T2w FSE | Sagittal | 8978/100 | 260 × 260 | 4 (0.4) | 228 × 220 | 320 ×320 |
| T2w FSE | Coronal | 10,774/100 | 320 × 320 | 4 (0.4) | 280 × 252 | 384 × 384 |
| T2w FSE | Axial | 17,359/100 | 320 × 320 | 4 (0.4) | 280 × 220 | 384 × 384 |
| T2w FSE SPAIR | Coronal Oblique | 10,631/80 | 270 × 270 | 3 (0.3) | 272 × 237 | 288 × 288 |
| T2w FSE SPAIR short echo time | Coronal Oblique | 10,631/7.3 | 270 × 270 | 3 (0.3) | 272 × 237 | 288 × 288 |
| T2w FSE SPAIR | Axial Oblique | 4627/80 | 270 × 270 | 3 (0.3) | 244 × 244 | 352 × 352 |
| DWI | Axial | 4547/77 | 320 × 296 | 4 (0.4) | 160 × 146 | 192 × 192 |
| MTR 3D GRE | Coronal Oblique | 144/4.5 | 298 × 298 | 3 (0) | 248 × 228 | 384 × 384 |
| 3D T1w GRE VFA (2°,10°,20°,30°) | Coronal Oblique | 9.2/1.8 | 280 × 280 | 4 (0) | 216 × 216 | 288 × 288 |
| T1w GRE Pre/Post-contrast FATSAT | Coronal Oblique | 3/1.4 | 260 × 260 | 1.6 (0) | 162 × 162 | 288 × 288 |
| T1w GRE Pre/Post contrast FATSAT | Axial Oblique | 3/1.4 | 260 × 260 | 1.6 (0) | 162 × 162 | 288 × 288 |
| DCE-4D THRIVE with Fat Sat | Coronal Oblique | 3.3/1.6 | 280 × 280 | 4 (0) | 216 × 216 | 288 × 288 |
Appendix B
- Calculate initial estimates for T1v and M0 using a linearisation of Equation (A1).
- Calculate the predicted non-fat-supressed signal Sv(A(d)), using the results of step 1 and Equation (A1).
- From the mean signal of the pre-contrast portion of the fat-supressed dynamic time series images Sd and the predicted non-fat-supressed signal Sv(A(d)), calculate an initial estimate of the fat fraction F as
- Calculate an initial estimate for T1w using the relationship
- Input these initial estimates to a nonlinear fit of Equation (A2) to the VFA images using an assumed T1f = 0.3 s to find M0, T1w and F.
References
- Ingle, S.; Loftus, E.V., Jr. The natural history of perianal Crohn’s disease. Dig. Liver Dis. 2007, 39, 963–969. [Google Scholar] [CrossRef]
- Present, D.H.; Rutgeerts, P.; Targan, S.; Hanauer, S.B.; Mayer, L.; Van Hogezand, R.; Podolsky, D.K.; Sands, B.E.; Braakman, T.; De Woody, K.L. Infliximab for the treatment of fistulas in patients with Crohn’s disease. N. Engl. J. Med. 1999, 340, 1398–1405. [Google Scholar] [CrossRef] [Green Version]
- Bell, S.; Halligan, S.; Windsor, A.; Williams, A.; Wiesel, P.; Kamm, M. Response of fistulating Crohn’s disease to infliximab treatment assessed by magnetic resonance imaging. Aliment. Pharmacol. Ther. 2003, 17, 387–393. [Google Scholar] [CrossRef]
- Michelassi, F.; Melis, M.; Rubin, M.; Hurst, R.D. Surgical treatment of anorectal complications in Crohn’s disease. Surgery 2000, 128, 597–603. [Google Scholar] [CrossRef]
- Bouguen, G.; Siproudhis, L.; Gizard, E.; Wallenhorst, T.; Billioud, V.; Bretagne, J.F.; Bigard, M.A.; Peyrin-Biroulet, L. Long-term outcome of perianal fistulizing Crohn’s disease treated with infliximab. Clin. Gastroenterol. Hepatol. 2013, 11, 975–981.e1–4. [Google Scholar] [CrossRef] [Green Version]
- Haennig, A.; Staumont, G.; Lepage, B.; Faure, P.; Alric, L.; Buscail, L.; Bournet, B.; Moreau, J. The results of seton drainage combined with anti-TNFalpha therapy for anal fistula in Crohn’s disease. Colorectal. Dis. 2015, 17, 311–319. [Google Scholar] [CrossRef] [PubMed]
- Makowiec, F.; Jehle, E.C.; Becker, H.D.; Starlinger, M. Clinical course after transanal advancement flap repair of perianal fistula in patients with Crohn’s disease. Br. J. Surg. 1995, 82, 603–606. [Google Scholar] [CrossRef] [PubMed]
- Irvine, E.J. Usual therapy improves perianal Crohn’s disease as measured by a new disease activity index. McMaster IBD Study Group. J. Clin. Gastroenterol. 1995, 20, 27–32. [Google Scholar] [PubMed]
- O’Connor, J.P.; Aboagye, E.O.; Adams, J.E.; Aerts, H.J.; Barrington, S.F.; Beer, A.J.; Boellaard, R.; Bohndiek, S.E.; Brady, M.; Brown, G. Imaging biomarker roadmap for cancer studies. Nat. Rev. Clin. Oncol. 2017, 14, 169–186. [Google Scholar] [CrossRef] [PubMed]
- Gecse, K.B.; Sebastian, S.; Hertogh, G.D.; Yassin, N.A.; Kotze, P.G.; Reinisch, W.; Spinelli, A.; Koutroubakis, I.E.; Katsanos, K.H.; Hart, A. Results of the Fifth Scientific Workshop of the ECCO [II]: Clinical aspects of perianal fistulising Crohn’s disease—The unmet needs. J. Crohn’s Colitis 2016, 10, 758–765. [Google Scholar] [CrossRef] [Green Version]
- Karmiris, K.; Bielen, D.; Vanbeckevoort, D.; Vermeire, S.; Coremans, G.; Rutgeerts, P.; Van Assche, G. Long-term monitoring of infliximab therapy for perianal fistulizing Crohn’s disease by using magnetic resonance imaging. Clin. Gastroenterol. Hepatol. 2011, 9, 130–136.e131. [Google Scholar] [CrossRef]
- Ng, S.C.; Plamondon, S.; Gupta, A.; Burling, D.; Swatton, A.; Vaizey, C.J.; Kamm, M.A. Prospective evaluation of anti-tumor necrosis factor therapy guided by magnetic resonance imaging for Crohn’s perineal fistulas. Am. J. Gastroenterol. 2009, 104, 2973. [Google Scholar] [CrossRef]
- Horsthuis, K.; Lavini, C.; Bipat, S.; Stokkers, P.C.; Stoker, J. Perianal Crohn Disease: Evaluation of Dynamic Contrast-enhanced MR Imaging as an Indicator of Disease Activity 1. Radiology 2009, 251, 380–387. [Google Scholar] [CrossRef]
- Savoye-Collet, C.; Savoye, G.; Koning, E.; Dacher, J.-N.; Lerebours, E. Fistulizing perianal Crohn’s disease: Contrast-enhanced magnetic resonance imaging assessment at 1 year on maintenance anti-TNF-alpha therapy. Inflamm. Bowel Dis. 2011, 17, 1751–1758. [Google Scholar] [CrossRef]
- Tozer, P.; Ng, S.C.; Siddiqui, M.R.; Plamondon, S.; Burling, D.; Gupta, A.; Swatton, A.; Tripoli, S.; Vaizey, C.J.; Kamm, M.A. Long-term MRI-guided combined anti-TNF-α and thiopurine therapy for crohn’s perianal fistulas. Inflamm. Bowel Dis. 2012, 18, 1825–1834. [Google Scholar] [CrossRef]
- Ziech, M.L.; Lavini, C.; Bipat, S.; Ponsioen, C.Y.; Spijkerboer, A.M.; Stokkers, P.C.; Nederveen, A.J.; Stoker, J. Dynamic contrast-enhanced MRI in determining disease activity in perianal fistulizing Crohn disease: A pilot study. Am. J. Roentgenol. 2013, 200, W170–W177. [Google Scholar] [CrossRef] [PubMed]
- Van Assche, G.; Vanbeckevoort, D.; Bielen, D.; Coremans, G.; Aerden, I.; Noman, M.; D’Hoore, A.; Penninckx, F.; Marchal, G.; Cornillie, F. Magnetic resonance imaging of the effects of infliximab on perianal fistulizing Crohn’s disease. Am. J. Gastroenterol. 2003, 98, 332–339. [Google Scholar] [CrossRef]
- Hindryckx, P.; Jairath, V.; Zou, G.; Feagan, B.G.; Sandborn, W.J.; Stoker, J.; Khanna, R.; Stitt, L.; van Viegen, T.; Shackelton, L.M. Development and Validation of a Magnetic Resonance Index for Assessing Fistulas in Patients with Crohn’s Disease. Gastroenterology 2019, 157, 1233–1244.e1235. [Google Scholar] [CrossRef] [PubMed] [Green Version]
- Samaan, M.A.; Puylaert, C.A.; Levesque, B.G.; Zou, G.; Stitt, L.; Taylor, S.A.; Shackelton, L.M.; Vandervoort, M.K.; Khanna, R.; Santillan, C. The development of a magnetic resonance imaging index for fistulising Crohn’s disease. Aliment. Pharmacol. Ther. 2017, 46, 516–528. [Google Scholar] [CrossRef]
- Yoshizako, T.; Wada, A.; Takahara, T.; Kwee, T.C.; Nakamura, M.; Uchida, K.; Hara, S.; Luijten, P.R.; Kitagaki, H. Diffusion-weighted MRI for evaluating perianal fistula activity: Feasibility study. Eur. J. Radiol. 2012, 81, 2049–2053. [Google Scholar] [CrossRef]
- Pinson, C.; Dolores, M.; Cruypeninck, Y.; Koning, E.; Dacher, J.; Savoye, G.; Savoye-Collet, C. Magnetization transfer ratio for the assessment of perianal fistula activity in Crohn’s disease. Eur. Radiol. 2017, 27, 80–87. [Google Scholar] [CrossRef]
- Giri, S.; Chung, Y.C.; Merchant, A.; Mihai, G.; Rajagopalan, S.; Raman, S.V.; Simonetti, O.P. T2 quantification for improved detection of myocardial edema. J. Cardiovasc. Magn. Reson. 2009, 11, 56. [Google Scholar] [CrossRef] [Green Version]
- Treier, R.; Steingoetter, A.; Fried, M.; Schwizer, W.; Boesiger, P. Optimized and combined T1 and B1 mapping technique for fast and accurate T1 quantification in contrast-enhanced abdominal MRI. Magn. Reson. Med. Off. J. Int. Soc. Magn. Reson. Med. 2007, 57, 568–576. [Google Scholar] [CrossRef]
- Pazahr, S.; Blume, I.; Frei, P.; Chuck, N.; Nanz, D.; Rogler, G.; Patak, M.; Boss, A. Magnetization transfer for the assessment of bowel fibrosis in patients with Crohn’s disease: Initial experience. Magn. Reson. Mater. Phys. Biol. Med. 2013, 26, 291–301. [Google Scholar] [CrossRef] [PubMed] [Green Version]
- Sourbron, S.P.; Buckley, D.L. On the scope and interpretation of the Tofts models for DCE-MRI. Magn. Reson. Med. 2011, 66, 735–745. [Google Scholar] [CrossRef] [PubMed]
- Tofts, P.S. Modeling tracer kinetics in dynamic Gd-DTPA MR imaging. J. Magn. Reson. Imaging 1997, 7, 91–101. [Google Scholar] [CrossRef]
- Parker, G.J.; Roberts, C.; Macdonald, A.; Buonaccorsi, G.A.; Cheung, S.; Buckley, D.L.; Jackson, A.; Watson, Y.; Davies, K.; Jayson, G.C. Experimentally-derived functional form for a population-averaged high-temporal-resolution arterial input function for dynamic contrast-enhanced MRI. Magn. Reson. Med. 2006, 56, 993–1000. [Google Scholar] [CrossRef]
- Raunig, D.L.; McShane, L.M.; Pennello, G.; Gatsonis, C.; Carson, P.L.; Voyvodic, J.T.; Wahl, R.L.; Kurland, B.F.; Schwarz, A.J.; Gonen, M.; et al. Quantitative imaging biomarkers: A review of statistical methods for technical performance assessment. Stat. Methods Med. Res. 2015, 24, 27–67. [Google Scholar] [CrossRef] [PubMed] [Green Version]
- Norman, G.R.; Sloan, J.A.; Wyrwich, K.W. Interpretation of changes in health-related quality of life: The remarkable universality of half a standard deviation. Med. Care 2003, 41, 582–592. [Google Scholar] [CrossRef]
- Maccioni, F.; Staltari, I.; Pino, A.; Tiberti, A. Value of T2-weighted magnetic resonance imaging in the assessment of wall inflammation and fibrosis in Crohn’s disease. Abdom. Imaging 2012, 37, 944–957. [Google Scholar] [CrossRef]
- Punwani, S.; Rodriguez-Justo, M.; Bainbridge, A.; Greenhalgh, R.; De Vita, E.; Bloom, S.; Cohen, R.; Windsor, A.; Obichere, A.; Hansmann, A. Mural inflammation in Crohn disease: Location-matched histologic validation of MR imaging features 1. Radiology 2009, 252, 712–720. [Google Scholar] [CrossRef]
- Fornasa, F.; Benassuti, C.; Benazzato, L. Role of magnetic resonance enterography in differentiating between fibrotic and active inflammatory small bowel stenosis in patients with Crohn’s disease. J. Clin. Imaging Sci. 2011, 1, 35. [Google Scholar] [CrossRef]
- Martens, M.H.; Lambregts, D.M.; Papanikolaou, N.; Heijnen, L.A.; Riedl, R.G.; zur Hausen, A.; Maas, M.; Beets, G.L.; Beets-Tan, R.G. Magnetization transfer ratio: A potential biomarker for the assessment of postradiation fibrosis in patients with rectal cancer. Investig. Radiol. 2014, 49, 29–34. [Google Scholar] [CrossRef] [PubMed] [Green Version]
- Horsthuis, K.; Ziech, M.L.; Bipat, S.; Spijkerboer, A.M.; de Bruine-Dobben, A.C.; Hommes, D.W.; Stoker, J. Evaluation of an MRI-based score of disease activity in perianal fistulizing Crohn’s disease. Clin. Imaging 2011, 35, 360–365. [Google Scholar] [CrossRef]
- Spencer, J.A.; Ward, J.; Beckingham, I.; Adams, C.; Ambrose, N.S. Dynamic contrast-enhanced MR imaging of perianal fistulas. Am. J. Roentgenol. 1996, 167, 735–741. [Google Scholar] [CrossRef] [Green Version]
- Lefrancois, P.; Zummo-Soucy, M.; Olivie, D.; Billiard, J.S.; Gilbert, G.; Garel, J.; Visee, E.; Manchec, P.; Tang, A. Diagnostic performance of intravoxel incoherent motion diffusion-weighted imaging and dynamic contrast-enhanced MRI for assessment of anal fistula activity. PLoS ONE 2018, 13, e0191822. [Google Scholar] [CrossRef] [Green Version]
- Baik, J.; Kim, S.H.; Lee, Y.; Yoon, J.-H. Comparison of T2-weighted imaging, diffusion-weighted imaging and contrast-enhanced T1-weighted MR imaging for evaluating perianal fistulas. Clin. Imaging 2017, 44, 16–21. [Google Scholar] [CrossRef]
- Dohan, A.; Eveno, C.; Oprea, R.; Pautrat, K.; Placé, V.; Pocard, M.; Hoeffel, C.; Boudiaf, M.; Soyer, P. Diffusion-weighted MR imaging for the diagnosis of abscess complicating fistula-in-ano: Preliminary experience. Eur. Radiol. 2014, 24, 2906–2915. [Google Scholar] [CrossRef] [PubMed]
- Hori, M.; Oto, A.; Orrin, S.; Suzuki, K.; Baron, R.L. Diffusion-weighted MRI: A new tool for the diagnosis of fistula in ano. J. Magn. Reson. Imaging 2009, 30, 1021–1026. [Google Scholar] [CrossRef] [PubMed]
- Vernuccio, F.; Picone, D.; Midiri, F.; Salerno, S.; Lagalla, R.; Lo Re, G. MR Imaging of Perianal Crohn Disease: The Role of Contrast-enhanced Sequences. Radiology 2017, 284, 921–922. [Google Scholar] [CrossRef] [Green Version]
- Lung, P.F.; Sahnan, K.; Burling, D.; Burn, J.; Tozer, P.; Yassin, N.; Adegbola, S.O.; Baldwin-Cleland, R.; Warusavitarne, J.; Gupta, A. Volume assessment magnetic resonance imaging technique for monitoring perianal Crohn’s fistulas. Ther. Adv. Gastroenterol. 2018, 11, 1756284818793609. [Google Scholar] [CrossRef] [Green Version]
| N | Baseline | 12 Weeks | Estimated Difference of Mean | 95% Confidence Interval | |
|---|---|---|---|---|---|
| MRI parameters on 3 T | |||||
| MTR | 18 | 0.32 (0.03) | 0.32 (0.05) | 0.002 (0.008) | −0.015, 0.019 |
| ADC (×10−3 mm2/s) | 17 | 1.48 (0.30) | 1.46 (0.24) | −0.02 (0.05) | −0.14, 0.09 |
| T2 (s) | 18 | 0.082 (0.018) | 0.077 (0.019) | −0.006 (0.004) | −0.013, 0.002 |
| T1 (s) | 17 | 2.24 (0.69) | 1.98 (0.76) | −0.27 (0.12) | −0.530, −0.002 |
| ETM Ktrans (min–1) | 17 | 0.10 (0.05) | 0.11 (0.06) | 0.008 (0.009) | −0.011, 0.027 |
| ETM ve | 17 | 0.30 (0.11) | 0.34 (0.13) | 0.043 (0.024) | −0.008, 0.094 |
| ETM vP | 17 | 0.0040 (0.0050) | 0.0041 (0.0057) | 0.0002 (0.0016) | −0.0032, 0.0035 |
| Fistula Volume from MTR sequence (mL) | 18 | 16.9 (22.0) | 13.2 (20.9) | −3.7 (3.2) | −10.4, 3.1 |
| MRI parameters on 1.5 T | |||||
| MTR | 18 | 0.38 (0.08) | 0.40 (0.08) | 0.018 (0.023) | −0.029, 0.067 |
| ADC (×10−3 mm2/s) | 16 | 1.27 (0.29) | 1.42 (0.29) | 0.14 (0.06) | 0.02, 0.27 |
| Van Assche score | 18 | 15 (6) | 12 (4) | −3 (1) | −6, 0 |
| Fistula volume from MTR sequence (mL) | 18 | 14.9 (19.8) | 14.4 (25.9) | −0.5 (2.8) | −6.3, 5.3 |
| Clinical indicators | |||||
| PDAI | 18 | 8 (3) | 5 (3) | −3 (1) | −5, −2 |
| CRP (mg/L) | 18 | 17 (18) | 6 (5) | −11 (4) | −20, −2 |
| Patient No. | PDAI Change | CRP Change | VAS Change | 3 T MTR Change | 3 T ADC Change | 3 T T2 Change | 1.5 T MTR Change | 1.5 T ADC Change | 3 T Fistula Volume Change | 1.5 T Fistula Volume Change |
|---|---|---|---|---|---|---|---|---|---|---|
| 1 | ↓ | ↓ | ↑ | ↑↑ | → | ↓ | ↑ | → | ↑ | ↑↑ |
| 2 | ↓↓ | ↓↓ | ↓↓ | ↑↑ | → | ↓ | ↑ | → | ↓↓ | ↓↓ |
| 3 | ↑ | → | → | ↑ | ↓↓ | ↓↓ | ↓↓ | → | → | → |
| 5 | ↓↓ | → | ↑ | ↓ | → | → | → | ↑↑ | → | ↑↑ |
| 6 | ↓↓ | ↓ | ↓↓ | ↓↓ | → | ↑↑ | ↓ | → | ↓ | ↓↓ |
| 7 | ↓↓ | ↓ | ↑↑ | → | → | ↑ | ↑ | ↓ | → | → |
| 8 | ↓↓ | ↓↓ | ↓↓ | ↑ | ↓ | ↓↓ | → | ↑↑ | ↓↓ | ↓↓ |
| 9 | ↓↓ | → | ↓↓ | → | → | → | ↑ | ↑↑ | ↓↓ | ↓ |
| 11 | ↓↓ | ↓↓ | ↓↓ | ↑ | → | ↓↓ | ↑↑ | ↑↑ | ↓↓ | ↓↓ |
| 12 | ↓↓ | ↓↓ | ↓↓ | ↑ | → | ↓↓ | → | → | ↑↑ | ↑ |
| 13 | ↓↓ | ↓↓ | ↓ | ↓ | ↑↑ | ↓↓ | → | ↑↑ | ↓ | → |
| 14 | ↓↓ | ↓ | ↓↓ | → | → | ↓ | ↑↑ | → | ↓ | ↑ |
| 15 | ↓↓ | ↓ | ↓↓ | → | ↑ | ↓ | → | → | ↑↑ | ↑ |
| 16 | ↓↓ | → | ↓↓ | → | ↓ | ↓↓ | ↑ | N/A | → | → |
| 17 | ↓↓ | ↓↓ | ↓↓ | → | ↑ | → | → | → | → | ↓ |
| 18 | ↓↓ | ↓ | ↑ | → | N/A | ↑↑ | ↓↓ | → | → | → |
| 19 | ↑ | ↑ | → | → | → | ↓ | → | N/A | ↓ | ↓ |
| 20 | ↑ | → | ↑ | → | → | → | → | → | ↑ | ↑ |
Publisher’s Note: MDPI stays neutral with regard to jurisdictional claims in published maps and institutional affiliations. |
© 2021 by the authors. Licensee MDPI, Basel, Switzerland. This article is an open access article distributed under the terms and conditions of the Creative Commons Attribution (CC BY) license (https://creativecommons.org/licenses/by/4.0/).
Share and Cite
Alyami, A.; Hoad, C.L.; Tench, C.; Bannur, U.; Clarke, C.; Latief, K.; Argyriou, K.; Lobo, A.; Lung, P.; Baldwin-Cleland, R.; et al. Quantitative Magnetic Resonance Imaging in Perianal Crohn’s Disease at 1.5 and 3.0 T: A Feasibility Study. Diagnostics 2021, 11, 2135. https://doi.org/10.3390/diagnostics11112135
Alyami A, Hoad CL, Tench C, Bannur U, Clarke C, Latief K, Argyriou K, Lobo A, Lung P, Baldwin-Cleland R, et al. Quantitative Magnetic Resonance Imaging in Perianal Crohn’s Disease at 1.5 and 3.0 T: A Feasibility Study. Diagnostics. 2021; 11(11):2135. https://doi.org/10.3390/diagnostics11112135
Chicago/Turabian StyleAlyami, Ali, Caroline L. Hoad, Christopher Tench, Uday Bannur, Christopher Clarke, Khalid Latief, Konstantinos Argyriou, Alan Lobo, Philip Lung, Rachel Baldwin-Cleland, and et al. 2021. "Quantitative Magnetic Resonance Imaging in Perianal Crohn’s Disease at 1.5 and 3.0 T: A Feasibility Study" Diagnostics 11, no. 11: 2135. https://doi.org/10.3390/diagnostics11112135
APA StyleAlyami, A., Hoad, C. L., Tench, C., Bannur, U., Clarke, C., Latief, K., Argyriou, K., Lobo, A., Lung, P., Baldwin-Cleland, R., Sahnan, K., Hart, A., Limdi, J. K., Mclaughlin, J., Atkinson, D., Parker, G. J. M., O’Connor, J. P. B., Little, R. A., Gowland, P. A., & Moran, G. W. (2021). Quantitative Magnetic Resonance Imaging in Perianal Crohn’s Disease at 1.5 and 3.0 T: A Feasibility Study. Diagnostics, 11(11), 2135. https://doi.org/10.3390/diagnostics11112135


