
Utilizing 3D Arterial Spin Labeling to Identify Cerebrovascular Leak and Glymphatic Obstruction in Neurodegenerative Disease

Abstract
:1. Introduction
2. Perfusion ASL
3. 3D-ASL Method
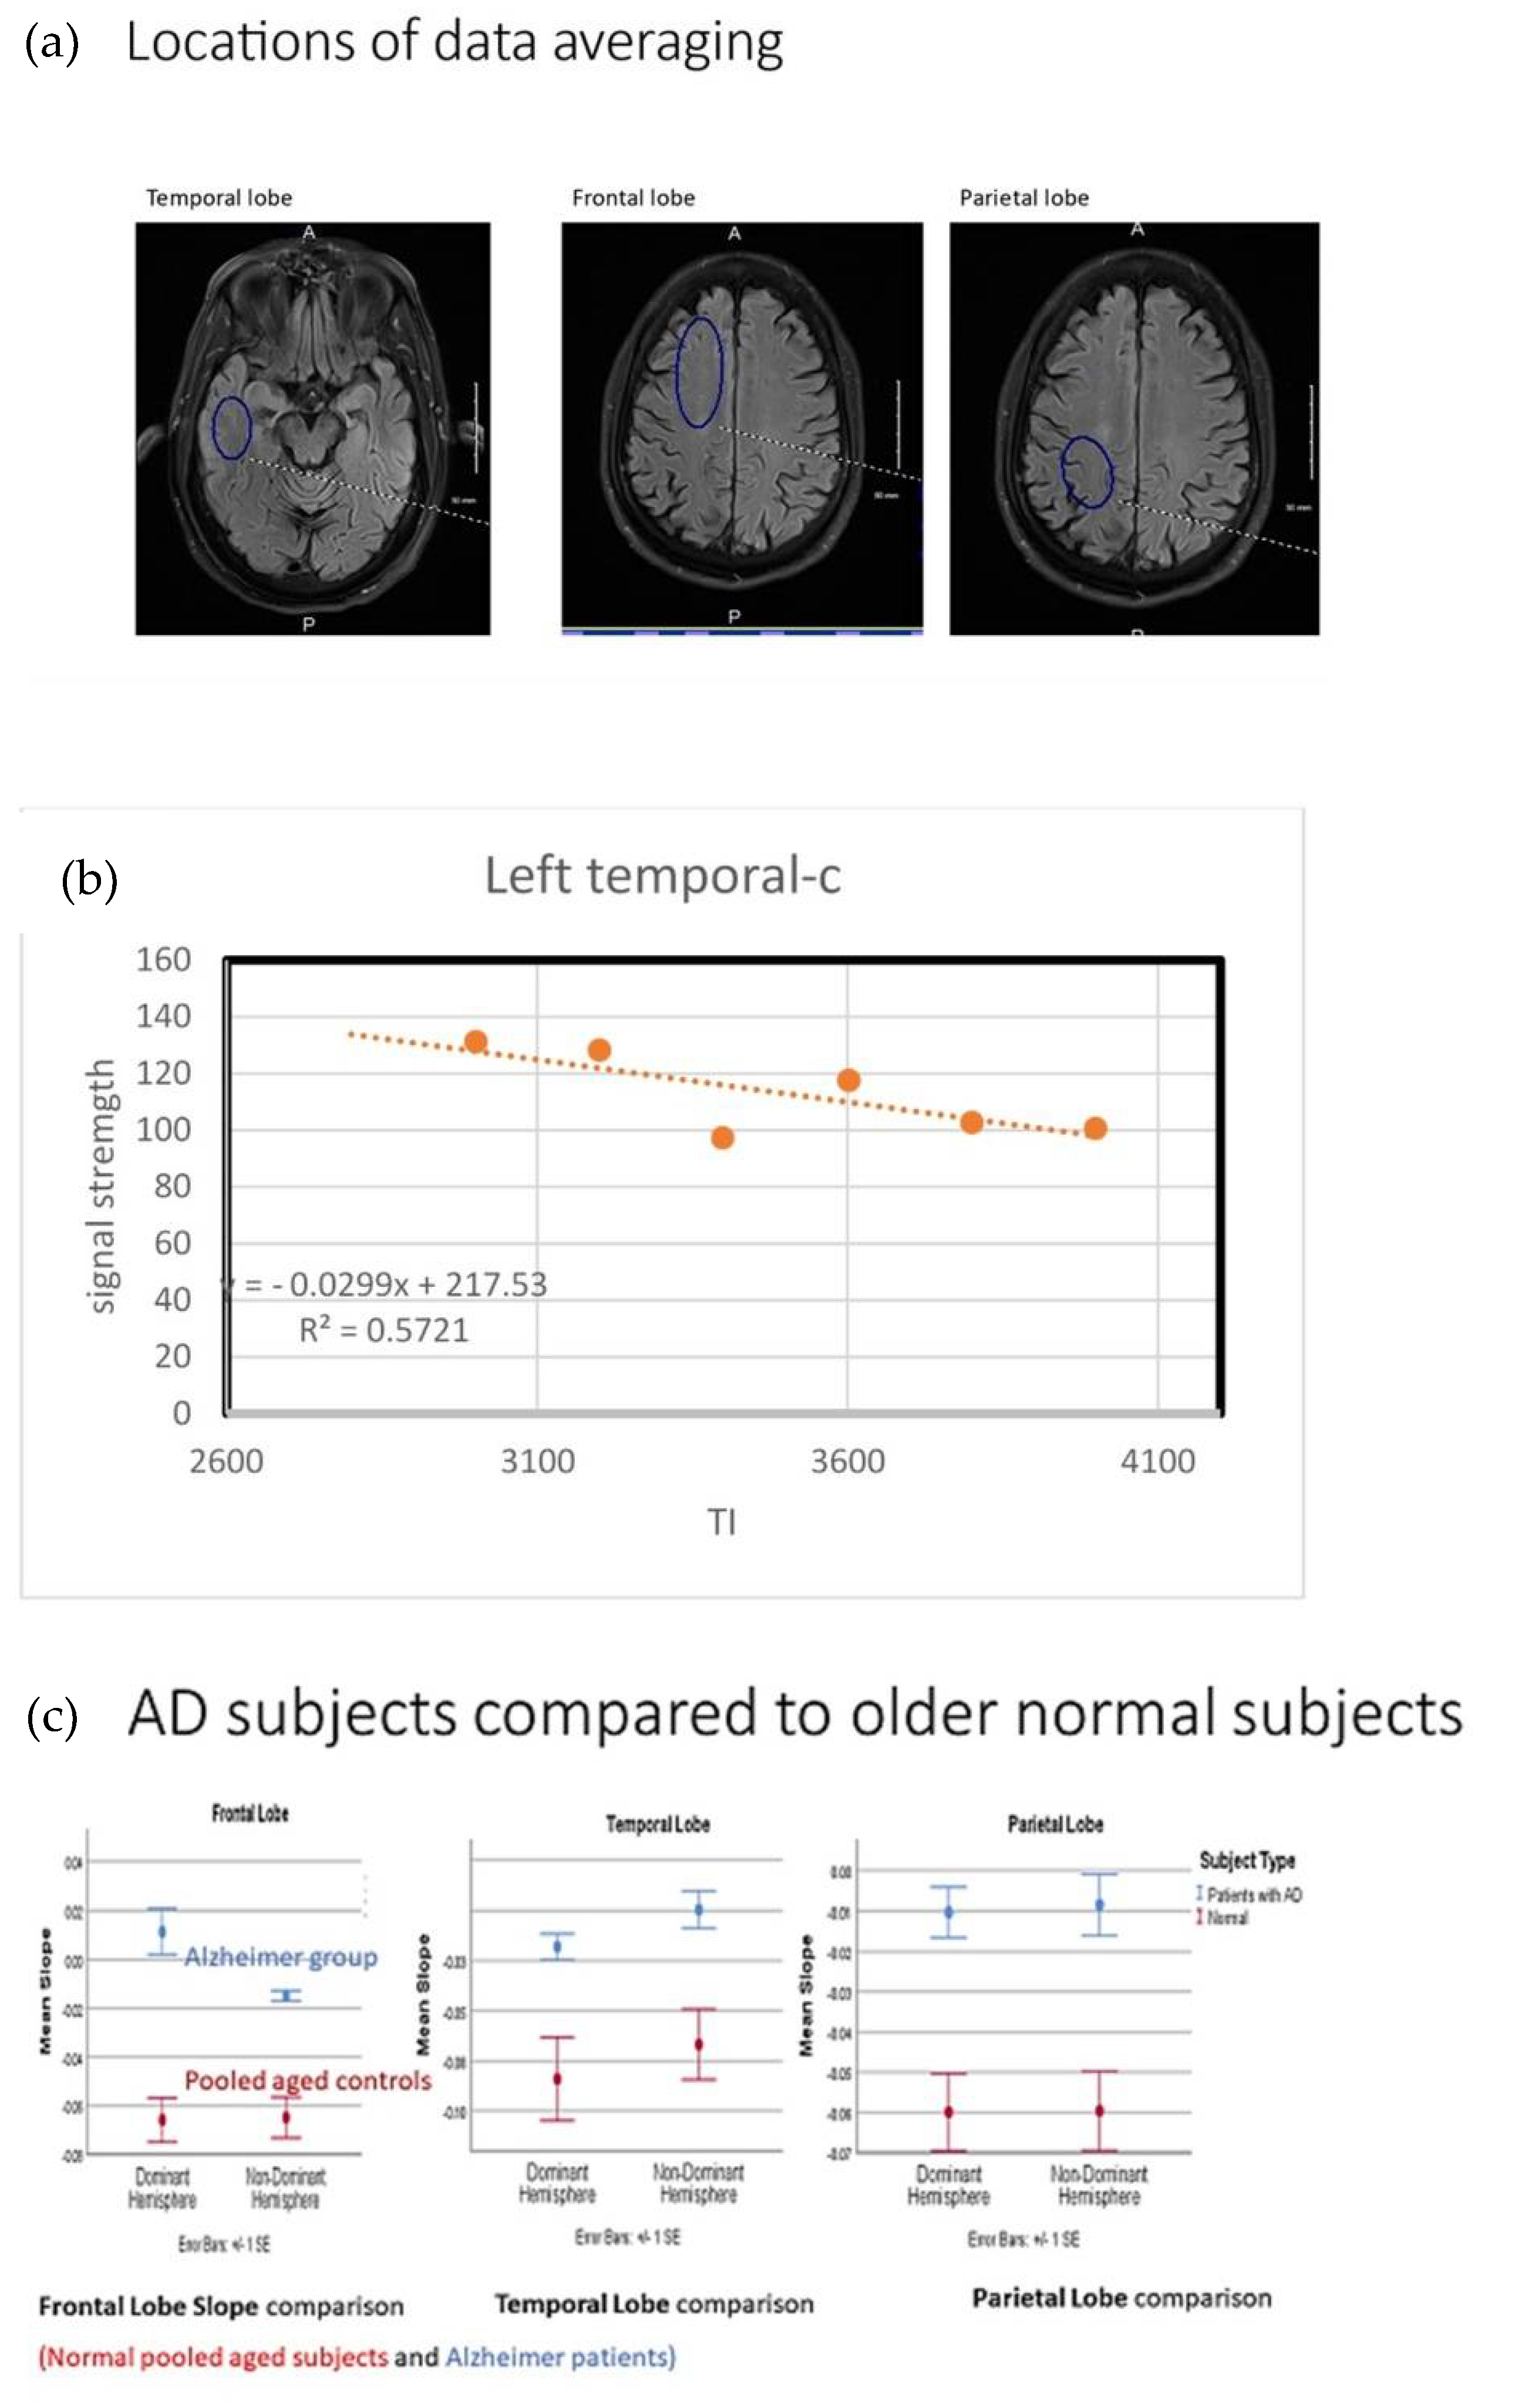
4. Results
5. Discussion
Funding
Institutional Review Board Statement
Informed Consent Statement
Data Availability Statement
Acknowledgments
Conflicts of Interest
References
- Montagne, A.; Barnes, S.R.; Sweeney, M.D.; Halliday, M.R.; Sagare, A.P.; Zhao, Z.; Toga, A.W.; Jacobs, R.E.; Liu, C.Y.; Amezcua, L.; et al. Blood-Brain barrier breakdown in the aging human hippocampus. Neuron 2015, 85, 296–302. [Google Scholar] [CrossRef] [Green Version]
- Erickson, M.A.; Banks, W.A. Age-Associated Changes in the Immune System and Blood–Brain Barrier Functions. Int. J. Mol. Sci. 2019, 20, 1632. [Google Scholar] [CrossRef] [Green Version]
- Wan, W.; Cao, L.; Liu, L.; Zhang, C.; Kalionis, B.; Tai, X.; Li, Y.; Xia, S. Aβ1–42 oligomer-induced leakage in an in vitro blood–brain barrier model is associated with up-regulation of RAGE and metalloproteinases, and down-regulation. J. Neurochem. 2015, 134, 382–393. [Google Scholar] [CrossRef] [PubMed]
- Fulop, T.; Larbi, A.; Dupuis, G.; Le Page, A.; Frost, E.H.; Cohen, A.A.; Witkowski, J.M.; Franceschi, C. Immunosenescence and Inflamm-Aging As Two Sides of the Same Coin: Friends or Foes? Front. Immunol. 2018, 8, 1960. [Google Scholar] [CrossRef] [PubMed] [Green Version]
- Abbott, N.J. Inflammatory Mediators and Modulation of Blood–Brain Barrier Permeability. Cell. Mol. Neurobiol. 2000, 20, 131–147. [Google Scholar] [CrossRef] [PubMed]
- Thomsen, M.S.; Routhe, L.J.; Moos, T. The vascular basement membrane in the healthy and pathological brain. J. Cereb. Blood Flow Metab. 2017, 37, 3300–3317. [Google Scholar] [CrossRef] [PubMed]
- Tarantini, S.; Tran, C.H.T.; Gordon, G.R.; Ungvari, Z.; Csiszar, A. Impaired neurovascular coupling in aging and Alzheimer’s disease: Contribution of astrocyte dysfunction and endothelial impairment to cognitive decline. Exp. Gerontol. 2017, 94, 52–58. Available online: https://www.sciencedirect.com/science/article/pii/S0531556516303990 (accessed on 22 July 2021). [CrossRef]
- Erdő, F.; Denes, L.; de Lange, E. Age-associated physiological and pathological changes at the blood–brain barrier: A review. J. Cereb. Blood Flow Metab. 2017, 37, 4–24. [Google Scholar] [CrossRef] [Green Version]
- Ge, X.; Li, W.; Huang, S.; Yin, Z.; Xu, X.; Chen, F.; Kong, X.; Wang, H.; Zhang, J.; Lei, P. The pathological role of NLRs and AIM2 inflammasome-mediated pyroptosis in damaged blood-brain barrier after traumatic brain injury. Brain Res. 2018, 1697, 10–20. [Google Scholar] [CrossRef]
- Lukiw, W.J. Bacteroides fragilis Lipopolysaccharide and Inflammatory Signaling in Alzheimer’s disease. Front. Microbiol. 2016, 7, 1544. [Google Scholar] [CrossRef] [Green Version]
- Welcome, M.O.; Mastorakis, N.E. Stress-induced blood brain barrier disruption: Molecular mechanisms and signaling pathways. Pharmacol. Res. 2020, 157, 104769. [Google Scholar] [CrossRef]
- Streit, W.J.; Khoshbouei, H.; Bechmann, I. Dystrophic microglia in late-onset Alzheimer’s disease. Glia 2020, 68, 845–854. [Google Scholar] [CrossRef]
- Johnson, E.C.B.; Dammer, E.B.; Duong, D.M.; Ping, L.; Zhou, M.; Yin, L.; Higginbotham, L.A.; Guajardo, A.; White, B.; Troncoso, J.C.; et al. Large-scale proteomic analysis of Alzheimer’s disease brain and cerebrospinal fluid reveals early changes in energy metabolism associated with microglia and astrocyte activation. Nat. Med. 2020, 26, 769–780. [Google Scholar] [CrossRef] [PubMed]
- Arellano, J.J.R.; Verkhratsky, A. Neuroglial Roots of Neurodegenerative Diseases? Mol. Neurobiol. 2010, 43, 87–96. [Google Scholar]
- Kettenmann, H.; Verkhratsky, A. Neuroglia, der lebende Nervenkitt. Fortschr. Neurol. Psychiatr. 2011, 79, 588–597. [Google Scholar] [CrossRef] [PubMed]
- Liu, C.Y.; Yang, Y.; Ju, W.N.; Wang, X.; Zhang, H.L. Emerging roles of astrocytes in neuro-vascular unit and the tripartite synapse with emphasis on reactive gliosis in the context of alzheimer’s disease. Front. Cell. Neurosci. 2018, 12, 193. [Google Scholar] [CrossRef] [Green Version]
- Cohen-Salmon, M.; Slaoui, L.; Mazaré, N.; Gilbert, A.; Oudart, M.; Alvear-Perez, R.; Elorza-Vidal, X.; Chever, O.; Boulay, A. Astrocytes in the regulation of cerebrovascular functions. Glia 2020, 69, 817–841. [Google Scholar] [CrossRef] [PubMed]
- Zenaro, E.; Piacentino, G.; Constantin, G. The blood-brain barrier in Alzheimer’s disease. Neurobiol. Dis. 2016, 107, 41–56. [Google Scholar] [CrossRef] [Green Version]
- Zenaro, E.; Pietronigro, E.; Della Bianca, V.; Piacentino, G.; Marongiu, L.; Budui, S.; Turano, E.; Rossi, B.; Angiari, S.; Dusi, S.; et al. Neutrophils promote Alzheimer’s disease–like pathology and cognitive decline via LFA-1 integrin. Nat. Med. 2015, 21, 880–886. [Google Scholar] [CrossRef]
- Tosun, D.; Landau, S.; Aisen, P.S.; Petersen, R.C.; Mintun, M.; Jagust, W.; Weiner, M.W.; Alzheimer’s Disease Neuroimaging Initiative. Association between tau deposition and antecedent amyloid accumulation rates in normal and early symptomatic individuals. Brain 2017, 140, 1499–1512. [Google Scholar] [CrossRef]
- Jucker, M.; Walker, L. Self-propagation of pathogenic protein aggregates in neurodegenerative diseases. Nature 2013, 501, 45–51. [Google Scholar] [CrossRef] [Green Version]
- Nisbet, R.; Polanco, J.C.; Ittner, L.M.; Götz, J. Tau aggregation and its interplay with amyloid-β. Acta Neuropathol. 2014, 129, 207–220. [Google Scholar] [CrossRef] [Green Version]
- Iqbal, K.; Liu, F.; Gong, C.-X. Tau and neurodegenerative disease: The story so far. Nat. Rev. Neurol. 2015, 12, 15–27. [Google Scholar] [CrossRef]
- Montagne, A.; Zhao, Z.; Zlokovic, B.V. Alzheimer’s disease: A matter of blood–brain barrier dysfunction? J. Exp. Med. 2017, 214, 3151–3169. [Google Scholar] [CrossRef]
- Joseph, C.R. Novel MRI Techniques Identifying Vascular Leak and Paravascular Flow Reduction in Early Alzheimer Disease. Biomedicines 2020, 8, 228. [Google Scholar] [CrossRef]
- Hersi, M.; Irvine, B.; Gupta, P.; Gomes, J.; Birkett, N.; Krewski, D. Risk factors associated with the onset and progression of Alzheimer’s disease: A systematic review of the evidence. NeuroToxicology 2017, 61, 143–187. [Google Scholar] [CrossRef] [PubMed]
- Crous-Bou, M.; Minguillón, C.; Gramunt, N.; Molinuevo, J.L. Alzheimer’s disease prevention: From risk factors to early intervention. Alzheimer’s Res. Ther. 2017, 9, 71. [Google Scholar] [CrossRef]
- Stocker, H.; Möllers, T.; Perna, L.; Brenner, H. The genetic risk of Alzheimer’s disease beyond APOE ε4: Systematic review of Alzheimer’s genetic risk scores. Transl. Psychiatry 2018, 8, 166. [Google Scholar] [CrossRef] [PubMed]
- Montemurro, N.; Perrini, P.; Rapone, B. Clinical risk and overall survival in patients with diabetes mellitus, hyperglycemia and glioblastoma multiforme. A review of the current literature. Int. J. Environ. Res. Public Health 2020, 17, 8501. [Google Scholar] [CrossRef] [PubMed]
- Armstrong, R.A.; Richard, P.; Armstrong, A. Risk factors for Alzheimer’s disease. Folia Neuropathol. 2019, 57, 87–105. [Google Scholar] [CrossRef] [Green Version]
- Tosto, G.; Bird, T.D.; Tsuang, D.; Bennett, D.A.; Boeve, B.F.; Cruchaga, C.; Faber, K.; Foroud, T.M.; Farlow, M.; Goate, A.M.; et al. Polygenic risk scores in familial Alzheimer disease. Neurology 2017, 88, 1180–1186. [Google Scholar] [CrossRef] [Green Version]
- Bell, R.D.; Winkler, E.A.; Singh, I.; Sagare, A.P.; Deane, R.; Wu, Z.; Holtzman, D.M.; Betsholtz, C.; Armulik, A.; Sállström, J.; et al. Apolipoprotein E controls cerebrovascular integrity via cyclophilin A. Nature 2012, 485, 512–516. [Google Scholar] [CrossRef]
- Chappell, M.A.; McConnell, F.A.K.; Golay, X.; Günther, M.; Hernandez-Tamames, J.A.; van Osch, M.J.; Asllani, I. Partial volume correction in arterial spin labeling perfusion MRI: A method to disentangle anatomy from physiology or an analysis step too far? NeuroImage 2021, 238, 118236. [Google Scholar] [CrossRef] [PubMed]
- Sweeney, M.D.; Sagare, A.P.; Zlokovic, B.V. Blood–brain barrier breakdown in Alzheimer disease and other neurodegenerative disorders. Nat. Rev. Neurol. 2018, 14, 133–150. [Google Scholar] [CrossRef] [PubMed]
- Kisler, K.; Nelson, A.R.; Montagne, A.; Zlokovic, B.V. Cerebral blood flow regulation and neurovascular dysfunction in Alzheimer disease. Nat. Rev. Neurosci. 2017, 18, 419–434. [Google Scholar] [CrossRef] [PubMed] [Green Version]
- Ivanidze, J.; Mackay, M.; Hoang, A.; Chi, J.; Cheng, K.; Aranow, C.; Volpe, B.; Diamond, B.; Sanelli, P. Dynamic Contrast-Enhanced MRI Reveals Unique Blood-Brain Barrier Permeability Characteristics in the Hippocampus in the Normal Brain. Am. J. Neuroradiol. 2019, 40, 408–411. [Google Scholar] [CrossRef] [PubMed] [Green Version]
- Van De Haar, H.J.; Jansen, J.F.; Jeukens, C.R.; Burgmans, S.; Van Buchem, M.A.; Muller, M.; Hofman, P.A.; Verhey, F.R.; Van Osch, M.J.; Backes, W.H. Subtle blood-brain barrier leakage rate and spatial extent: Considerations for dynamic contrast-enhanced MRI. Med. Phys. 2017, 44, 4112–4125. [Google Scholar] [CrossRef] [PubMed]
- Manning, C.; Stringer, M.; Dickie, B.; Clancy, U.; Hernandez, M.C.V.; Wiseman, S.J.; Garcia, D.J.; Sakka, E.; Backes, W.H.; Ingrisch, M.; et al. Sources of systematic error in DCE-MRI estimation of low-level blood-brain barrier leakage. Magn. Reson. Med. 2021, 86, 1888–1903. [Google Scholar] [CrossRef]
- Moon, W.J.; Lim, C.; Ha, I.H.; Kim, Y.; Moon, Y.; Kim, H.J.; Han, S.H. Hippocampal blood–brain barrier permeability is related to the APOE4 mutation status of elderly individuals without dementia. J. Cereb. Blood Flow Metab. 2021, 41, 1351–1361. [Google Scholar] [CrossRef]
- Ha, I.H.; Lim, C.; Kim, Y.; Moon, Y.; Han, S.-H.; Moon, W.-J. Regional Differences in Blood-Brain Barrier Permeability in Cognitively Normal Elderly Subjects: A Dynamic Contrast-Enhanced MRI-Based Study. Korean J. Radiol. 2021, 22, 1152–1162. [Google Scholar] [CrossRef]
- Gordon, Y.; Partovi, S.; Müller-Eschner, M.; Amarteifio, E.; Baeuerle, T.; Weber, M.-A.; Kauczor, H.-U.; Rengier, F. Dynamic contrast-enhanced magnetic resonance imaging: Fundamentals and application to the evaluation of the peripheral perfusion. Cardiovasc. Diagn. Ther. 2014, 4, 147. [Google Scholar] [CrossRef] [PubMed]
- Barnes, S.R.; Ng, T.S.C.; Montagne, A.; Law, M.; Zlokovic, B.V.; Jacobs, R.E. Optimal acquisition and modeling parameters for accurate assessment of low Ktrans blood-brain barrier permeability using dynamic contrast-enhanced MRI. Magn. Reson. Med. 2016, 75, 1967–1977. [Google Scholar] [CrossRef] [PubMed] [Green Version]
- Barnes, S.R.; Ng, T.S.C.; Santa-Maria, N.; Montagne, A.; Zlokovic, B.V.; Jacobs, R.E. ROCKETSHIP: A flexible and modular software tool for the planning, processing and analysis of dynamic MRI studies. BMC Med. Imaging 2015, 15, 19. [Google Scholar] [CrossRef] [PubMed] [Green Version]
- Bokkers, R.P.; Bremmer, J.P.; Van Berckel, B.N.; Lammertsma, A.A.; Hendrikse, J.; Pluim, J.P.; Kappelle, L.J.; Boellaard, R.; Klijn, C.J. Arterial Spin Labeling Perfusion MRI at Multiple Delay Times: A Correlative Study with H215O Positron Emission Tomography in Patients with Symptomatic Carotid Artery Occlusion. Br. J. Pharmacol. 2009, 30, 222–229. [Google Scholar] [CrossRef] [PubMed] [Green Version]
- Joseph, C.R.; Benhatzel, C.M.; Stern, L.J.; Hopper, O.M.; Lockwood, M.D. Pilot study utilizing MRI 3D TGSE PASL (arterial spin labeling) differentiating clearance rates of labeled protons in the CNS of patients with early Alzheimer disease from normal subjects. Magn. Reson. Mater. Phys. Biol. Med. 2020, 33, 559–586. [Google Scholar] [CrossRef]
- Petcharunpaisan, S.; Ramalho, J.; Castillo, M.; Carmichael, O. Arterial spin labeling in neuroimaging. World J. Radiol. 2010, 2, 384–398. [Google Scholar] [CrossRef]
- MacDonald, M.E.; Berman, A.J.L.; Mazerolle, E.L.; Williams, R.J.; Pike, G.B. Modeling hyperoxia-induced bold signal dynamics to estimate cerebral blood flow, volume and mean transit time. NeuroImage 2018, 178, 461–474. [Google Scholar] [CrossRef]
- Okubo, G.; Okada, T.; Yamamoto, A.; Fushimi, Y.; Okada, T.; Murata, K.; Togashi, K. Relationship between aging and T1 relaxation time in deep gray matter: A voxel-based analysis. J. Magn. Reson. Imaging 2017, 46, 724–731. [Google Scholar] [CrossRef] [Green Version]
- Lu, H.; Clingman, C.; Golay, X.; Peter, M.R. Determining the longitudinal relaxation time (T1) of blood at 3.0 Tesla. Magn. Reson. Med. 2004, 52, 679–682. Available online: https://onlinelibrary.wiley.com/doi/abs/10.1002/mrm.20178 (accessed on 22 July 2021). [CrossRef]
- Woods, J.G.; Chappell, M.A.; Okell, T.W. A general framework for optimizing arterial spin labeling MRI experiments. Magn. Reson. Med. 2019, 81, 2474–2488. [Google Scholar] [CrossRef]
- Liu, Y.; Zhu, X.; Feinberg, D.; Guenther, M.; Gregori, J.; Weiner, M.W.; Schuff, N. Arterial Spin Labeling MRI Study of Age and Gender Effects on Brain Perfusion Hemodynamics. Magn. Reson. Med. 2012, 68, 912–922. [Google Scholar] [CrossRef]
- Alsop, D.C.; Detre, J.A.; Golay, X.; Günther, M.; Hendrikse, J.; Hernandez-Garcia, L.; Lu, H.; MacIntosh, B.; Parkes, L.M.; Smits, M.; et al. Recommended implementation of arterial spin-labeled perfusion MRI for clinical applications: A consensus of the ISMRM perfusion study group and the European consortium for ASL in dementia. Magn. Reson. Med. 2015, 73, 102–116. [Google Scholar] [CrossRef] [Green Version]
- Kim, S.G.; Tsekos, N.V. Perfusion imaging by a flow-sensitive alternating inversion recovery (fair) technique: Application to functional brain imaging. Magn. Reson. Med. 1997, 37, 425–435. [Google Scholar] [CrossRef]
- Noguchi, K.; Kuwayama, N.; Kubo, M.; Kamisaki, Y.; Kameda, K.; Tomizawa, G.; Kawabe, H.; Seto, H. Flow-sensitive alternating inversion recovery (fair) imaging for retrograde cortical venous drainage related to intracranial dural arteriovenous fistula. Neuroradiology 2011, 53, 153–158. [Google Scholar] [CrossRef]
- Noguchi, T.; Nishihara, M.; Hara, Y.; Hirai, T.; Egashira, Y.; Azama, S.; Irie, H. A Technical Perspective for Understanding Quantitative Arterial Spin-labeling MR Imaging using Q2TIPS. Magn. Reson. Med Sci. 2015, 14, 1–12. [Google Scholar] [CrossRef] [Green Version]
- Aoike, S.; Sugimori, H.; Fujima, N.; Suzuki, Y.; Shimizu, Y.; Suwa, A.; Ishizaka, K.; Kudo, K. Three-dimensional pseudo-continuous arterial spin-labeling using turbo-spin echo with pseudo-steady state readout: A comparison with other major readout methods. Magn. Reson. Med. Sci. 2019, 18, 170–177. [Google Scholar] [CrossRef] [Green Version]
- Mansfield, P. Multi-planar image formation using NMR spin echoes. J. Phys. C Solid State Phys 1977, 10, L55–L58. [Google Scholar] [CrossRef]
- Wolf, R.L.; Detre, J.A. Clinical Neuroimaging Using Arterial Spin-Labeled Perfusion Magnetic Resonance Imaging. Neurotherapeutics 2007, 4, 346–359. [Google Scholar] [CrossRef] [PubMed]
- Lin, Z.; Sur, S.; Liu, P.; Li, Y.; Jiang, D.; Hou, X.; Darrow, J.; Pillai, J.J.; Yasar, S.; Rosenberg, P.; et al. Blood–Brain Barrier Breakdown in Relationship to Alzheimer and Vascular Disease. Ann. Neurol. 2021, 90, 227–238. [Google Scholar] [CrossRef]
- Breton, A.; Casey, D.; Arnaoutoglou, N.A. Cognitive tests for the detection of mild cognitive impairment (MCI), the prodromal stage of dementia: Meta-analysis of diagnostic accuracy studies. Int. J. Geriatr. Psychiatry 2019, 34, 233–242. [Google Scholar] [CrossRef] [PubMed]


| MRI Sequence Type | Contrast Agent | Information Sought | Duration of Sequence Acquisition | Duration of Study | Artifact Type | Reproducibility | Cost/Scan |
|---|---|---|---|---|---|---|---|
| Dynamic Contrast Imaging (DCI) | Exogenous Gadolinium | Presence of BBB leaked contrast Ktransfer coefficient | 16 min per sequence | 30+ min for two sequences | Motion artifact, intercompartment contrast equilibrium determination | Yes | High due to need for contrast agent |
| 3D Arterial Spin Labeling (3D ASL) | Endogenous Proton labeling | Delay of labeled proton clearance | 2 min per sequence | 15 min for seven sequences | Low S/N, susceptibility artifact | Yes | Low |
Publisher’s Note: MDPI stays neutral with regard to jurisdictional claims in published maps and institutional affiliations. |
© 2021 by the author. Licensee MDPI, Basel, Switzerland. This article is an open access article distributed under the terms and conditions of the Creative Commons Attribution (CC BY) license (https://creativecommons.org/licenses/by/4.0/).
Share and Cite
Joseph, C.R. Utilizing 3D Arterial Spin Labeling to Identify Cerebrovascular Leak and Glymphatic Obstruction in Neurodegenerative Disease. Diagnostics 2021, 11, 1888. https://doi.org/10.3390/diagnostics11101888
Joseph CR. Utilizing 3D Arterial Spin Labeling to Identify Cerebrovascular Leak and Glymphatic Obstruction in Neurodegenerative Disease. Diagnostics. 2021; 11(10):1888. https://doi.org/10.3390/diagnostics11101888
Chicago/Turabian StyleJoseph, Charles R. 2021. "Utilizing 3D Arterial Spin Labeling to Identify Cerebrovascular Leak and Glymphatic Obstruction in Neurodegenerative Disease" Diagnostics 11, no. 10: 1888. https://doi.org/10.3390/diagnostics11101888
APA StyleJoseph, C. R. (2021). Utilizing 3D Arterial Spin Labeling to Identify Cerebrovascular Leak and Glymphatic Obstruction in Neurodegenerative Disease. Diagnostics, 11(10), 1888. https://doi.org/10.3390/diagnostics11101888