Article

Hyperpolarized 129Xe Time-of-Flight MR Imaging of Perfusion and Brain Function

1
Chemistry and Materials Science Program, Lakehead University, 955 Oliver Rd., Thunder Bay, ON P7B 5E1, Canada
2
Thunder Bay Regional Health Research Institute, 980 Oliver Rd., Thunder Bay, ON P7B 5E1, Canada
3
Chemistry Department, Lakehead University, 955 Oliver Rd., Thunder Bay, ON P7B 5E1, Canada
4
Thunder Bay Regional Health Sciences Centre, 980 Oliver Rd., Thunder Bay, ON P7B 6V4, Canada
5
Northern Ontario School of Medicine, 955 Oliver Rd., Thunder Bay, ON P7B 5E1, Canada
*
Author to whom correspondence should be addressed.
Diagnostics 2020, 10(9), 630; https://doi.org/10.3390/diagnostics10090630
Submission received: 11 August 2020 / Revised: 22 August 2020 / Accepted: 23 August 2020 / Published: 25 August 2020
(This article belongs to the Section Medical Imaging and Theranostics)

Abstract

:
Perfusion measurements can provide vital information about the homeostasis of an organ and can therefore be used as biomarkers to diagnose a variety of cardiovascular, renal, and neurological diseases. Currently, the most common techniques to measure perfusion are 15O positron emission tomography (PET), xenon-enhanced computed tomography (CT), single photon emission computed tomography (SPECT), dynamic contrast enhanced (DCE) MRI, and arterial spin labeling (ASL) MRI. Here, we show how regional perfusion can be quantitively measured with magnetic resonance imaging (MRI) using time-resolved depolarization of hyperpolarized (HP) xenon-129 (129Xe), and the application of this approach to detect changes in cerebral blood flow (CBF) due to a hemodynamic response in response to brain stimuli. The investigated HP 129Xe Time-of-Flight (TOF) technique produced perfusion images with an average signal-to-noise ratio (SNR) of 10.35. Furthermore, to our knowledge, the first hemodynamic response (HDR) map was acquired in healthy volunteers using the HP 129Xe TOF imaging. Responses to visual and motor stimuli were observed. The acquired HP TOF HDR maps correlated well with traditional proton blood oxygenation level-dependent functional MRI. Overall, this study expands the field of HP MRI with a novel dynamic imaging technique suitable for rapid and quantitative perfusion imaging.

1. Introduction

Perfusion measurements can provide vital information about the homeostasis of an organ [1] and can therefore be used as biomarkers to diagnose cardiovascular [2,3], renal [4], and neurological [5,6,7] diseases. Currently, the most commonly used techniques to measure perfusion are 15O positron emission tomography (PET) [8,9,10], xenon-enhanced computed tomography (CT) [11,12], single photon emission computed tomography (SPECT) [3,8,13], and arterial spin labeling (ASL) magnetic resonance imaging (MRI) [1,14,15,16,17,18]. In addition, dynamic susceptibility contrast (DSC) and dynamic contrast enhanced (DCE) MRI are frequently used for perfusion imaging [19,20,21]. Although these techniques are well-established, each has some serious drawbacks. CT requires high-dose ionizing radiation, PET and SPECT rely on injection of radioactive contrast agents and the acquired PET images are of low resolution, and the signal-to-noise ratio (SNR) and contrast of ASL images is low. DSC and DCE MRI require injection of contrast agents, most of which contain gadolinium, which was recently associated with a certain amount of toxicity [22,23]. In addition, the most commonly used gadolinium-based contrast agents are uncapable of crossing the blood–brain barrier [24,25,26], which makes cerebral perfusion imaging with these agents more challenging.
Hyperpolarized (HP) xenon-129 (129Xe) MRI is a powerful MRI approach used mainly for lung imaging and for the study of lung disorders [27,28]. A hyperpolarized (HP) metastable state is produced by spin exchange optical pumping [29,30,31], and is characterized by up to 105 larger longitudinal magnetization compared to thermal polarization [27]. Therefore, the magnetic resonance signal of HP nuclei can be up to 105 times stronger than at thermal equilibrium. Due to the ability of HP 129Xe to dissolve in blood and travel to highly perfused organs, HP 129Xe MRI was recently used to study the brain [6,32,33,34] and kidneys [35]. The last achievements in the field of HP 129Xe MRI allowed the investigation of cerebral perfusion changes associated with Alzheimer’s disease [34] and stroke [6].
Since HP 129Xe dissolves in the blood [36] and has extreme sensitivity to chemical environments [27], it can be used as a contrast agent to study blood flow and conduct perfusion measurements in tissues. Since the HP state is a nonequilibrium, metastable state, the longitudinal magnetization is not restored by spin-lattice relaxation once a radiofrequency (RF) pulse irradiates the nuclei. After irradiation of a volume element containing HP 129Xe dissolved in tissue or blood with a 90° RF pulse, the HP state is completely destroyed and the dissolved HP 129Xe does not produce any significant amount of signal. If there is continuous flow into the volume of dissolved 129Xe, and if the MR measurement is conducted following a prescribed time delay (time-of-flight (TOF) time), the MR signal is determined mainly by the amount of 129Xe washed into the selected volume. We hypothesize that it is possible to measure the blood flow and tissue perfusion quantitatively by creating a dynamic imaging technique which measures the 129Xe signal evolution with change in TOF. The proposed perfusion imaging technique has the potential to open a new pathway for imaging and diagnostics of perfusion-related diseases.
In this proof-of-concept study, we develop a novel HP 129Xe time-of-flight perfusion imaging pulse sequence and evaluate the performance of this technique in vitro and in vivo. The first quantitative HP cerebral perfusion images were acquired using the proposed technique in healthy volunteers. Furthermore, the HP 129Xe TOF technique was used for hemodynamic response detection and was corroborated by conventional proton (1H) blood oxygenation level-dependent (BOLD) fMRI.

2. Materials and Methods

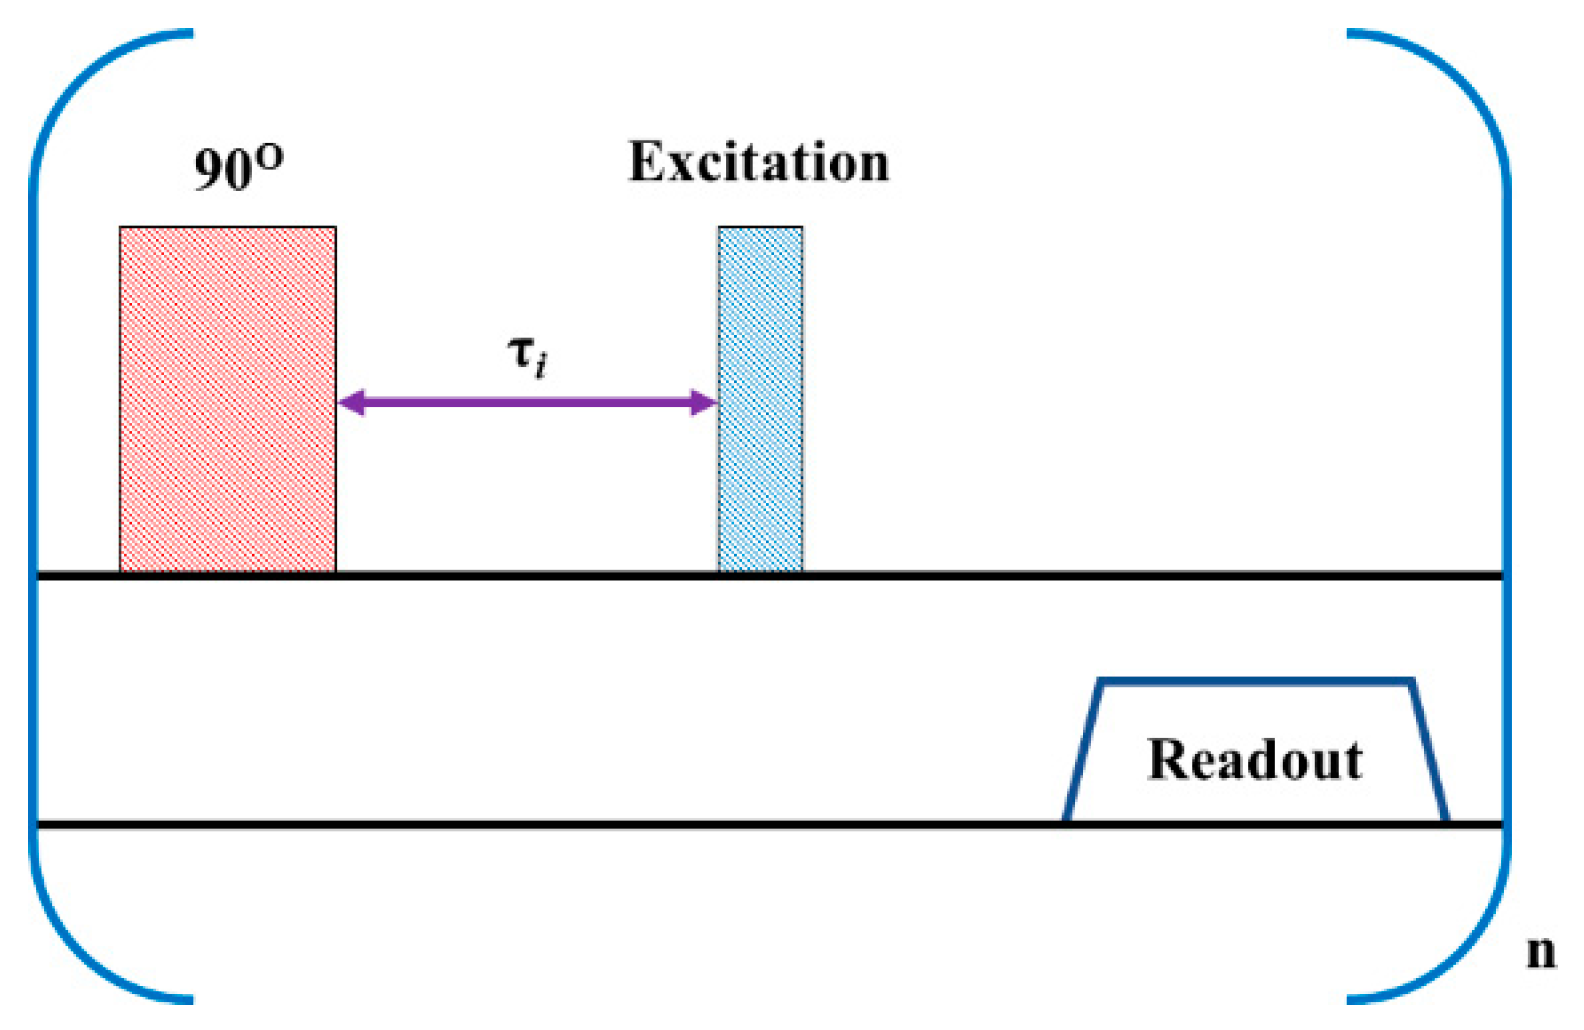
2.1. Pulse Sequence Design

The Chemical Shift Saturation Recovery (CSSR) pulse sequence is typically used to study the time course of hyperpolarized (HP) 129Xe gas exchange in the lungs [37,38]. We modified the CSSR sequence for cerebral perfusion imaging using HP 129Xe to create the 129Xe TOF used in this study (Figure 1). The first 90° block pulse has a time duration of 0.5 ms, which yields a bandwidth (BW) of 2 kHz (56.5 ppm). This pulse is broad enough to saturate the HP 129Xe in all brain tissues and the Xe dissolved in blood. After termination of the saturation pulse, the unsaturated 129Xe from the lungs flows into the brain during time τ. The image pulse sequence is then initiated. Here, the broad-band excitation pulse of spredrex shape was used for imaging. The image was acquired using a Gradient Echo (GRE) pulse sequence with a Cartesian read-out. The TOF pulse sequence was repeated three times with different recovery times τ (Figure 1). To detect hemodynamic response to a visual stimulus, we used the following delay times: τ0 = 1 s, τ1 = 6.5 s, τ2 = 8 s. To detect hemodynamic response to a motor task, the TOF delays were equal to 2.5 s, 6.8 s, and 7.1 s.

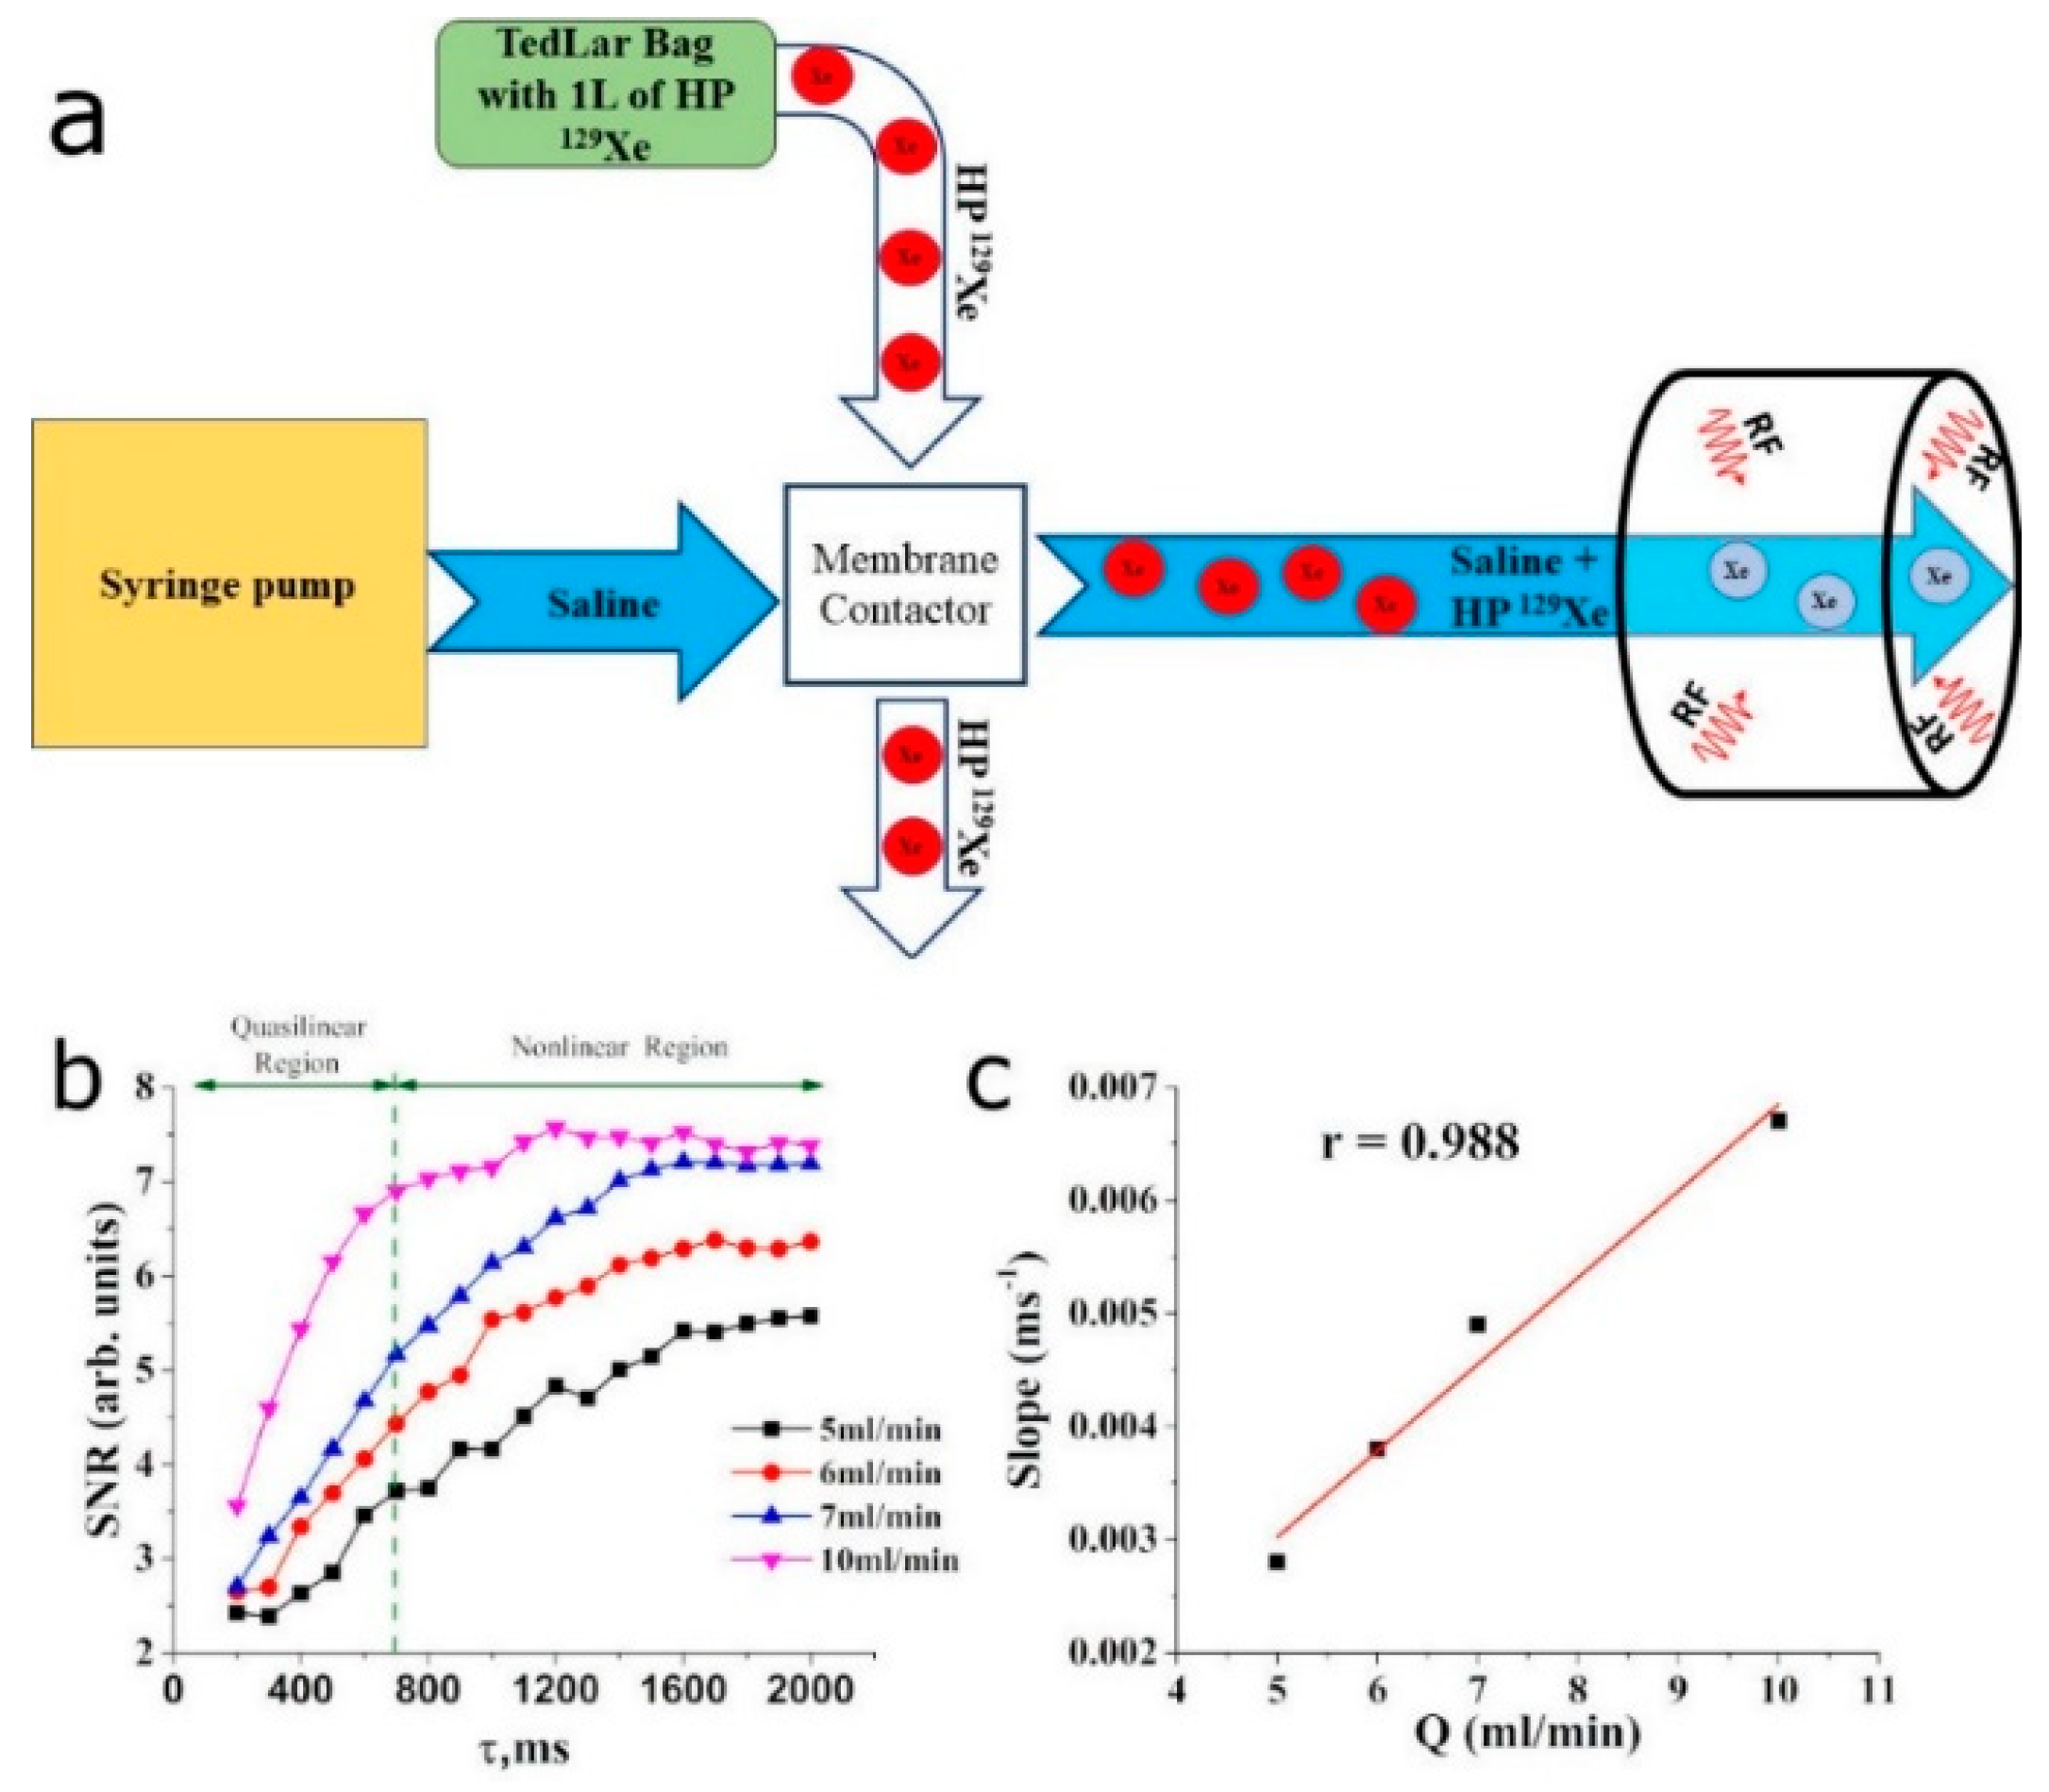
2.2. In Vitro Flow Measurements

The flow phantom used in this study is shown in Figure 2a. The 3.175 mm tube was connected to the syringe pump (Kent Scientific Co, Torrington, CT, USA). A 30 mL syringe was filled with saline and loaded into the pump. One liter of natural abundant 129Xe (~26%) was polarized up to 52% using the Xemed xenon polarizer and dispensed into a TedLar bag. A TedLar bag and a saline tube were connected to the membrane contactor (3M Liqui-Cel MM-0.5 × 1 Series) to mix HP Xe with saline. The outlet of the membrane contactor was connected to the 3.175 mm tube and the end of the tube was placed into the custom-built quadrature coil tuned to the Xe resonance frequency at 3T (35.33 MHz). A saline flow rate was set to 5 mL/min, 6 mL/min, 7 mL/min, and 10 mL/min.
The 129Xe TOF GRE imaging was conducted using 20 TOF recovery times that varied from 200 ms to 2000 ms, with a step of 100 ms. The following parameters were used for imaging: TR/TE = 104.16 ms/1.22 ms, FA = 12.5°, FOV = 100 × 100 mm2.

2.3. In Vivo Cerebral Perfusion Measurements in Healthy Volunteers

This research study was approved (Jan. 28, 2019) by the research ethics boards (REB) at Lakehead University (LU) and the Thunder Bay Regional Health Sciences Centre (TBRHSC) (REB file number RP-307) and conducted in accordance with the Tri-Council Policy Statement-2 (TCPS-2). Nine healthy volunteers between the ages of 21 and 77 were recruited from the community for this study. All participants signed an informed consent form. All participants were cognitively normal and consented to the data obtained from them being disseminated in this report.

2.3.1. 1H Magnetic Resonance Imaging

Participants were placed into a dual tuned 1H/129Xe head coil in a Philips Achieva 3T clinical MRI scanner. T2-weighted 1H MRI were acquired using a turbo-spin echo (TSE) sequence with a Cartesian readout. The high-resolution anatomical proton images were acquired in axial and sagittal views. The sagittal images were acquired using a field-of-view equal to 250 × 250 × 46 mm3 and a voxel size of 0.98 × 1.04 × 6 mm3. The repetition time was set to 3 s and the echo time was equal to 80 s. The flip angle of excitation radiofrequency pulse was equal to 90°. Five slices were acquired, separated by 6 mm gaps. The axial scans were acquired using similar parameters. The only difference was in voxel size, which was equal to 0.98 × 0.99 × 6 mm3 in the axial scans.

2.3.2. 129Xe Perfusion Mapping Using Time of Flight (TOF)

Enriched 129Xe (83%) was polarized to ~50% using a Xemed xenon polarizer and dispensed into 1 L Tedlar bags. The participant breathed in the gas and held their breath for 20 s. The dynamic 129Xe TOF imaging pulse sequence with a Cartesian gradient echo readout was initiated simultaneously with a breath-hold. Three dynamic projection brain images were acquired during the breath-hold. The TOF recovery delays were equal to 2.5 s, 6.7 s, and 7.1 s. The field of view of gradient echo pulse sequence parameters was equal to 250 × 250 mm2 and the acquisition matrix was set to 20 × 20. The excitation pulse flip angle was set to 20°. The repetition time was equal to 4 ms, the eco time was equal to 0.71 ms, and the bandwidth per pixel was 382 Hz.
To conduct hemodynamic response mapping, each participant was given two Xe MRI scans, one while staring at a gray screen (baseline) and another while exposed to an external stimulus, such as a flashing visual pattern (the visual stimulus used in this study can be downloaded from the link presented in the Supplementary Material S3) or s rapid left fist squeeze (motor stimulus). Exposure to the visual stimulus started approximately 7 s prior to image acquisition. Immediately prior to image acquisition, the participant inhaled 1 L of the HP 129Xe gas and held their breath for a period of 20 s.
A dynamic 129Xe TOF imaging pulse sequence with a Cartesian gradient echo readout was initiated simultaneously with a breath-hold using the following parameters: FOV = 250 × 250 mm2, TR/TE = 4 ms/0.71 ms, FA = 20°, BW = 382 Hz, acquisition matrix = 20 × 20. Three dynamic projection brain images were acquired during the breath-hold. The TOF recovery delays were equal to 2.5 s, 6.7 s, and 7.1 s for axial projections and 1 s, 6.5 s, and 7.1 s for the sagittal view. 129Xe TOF perfusion-weighted images were acquired in aial view with a slice thickness of 70 mm and in sagittal view with a slice thickness of 300 mm.

2.3.3. 129Xe Perfusion Mapping Image Processing

Briefly, 129Xe images were zero-padded in k-space to a 32 × 32 matrix and a Fast Fourier transform (FFT) was applied to create MR images. SNR maps were created by dividing each pixel by the standard deviation of the noise region. Based on Killian’s model of dissolved Xe18, the mathematical theory was generalized and applied for HP 129Xe perfusion mapping (for a detailed explanation, see Supplementary Material S1). Three SNR maps created from TOF images and acquired with different recovery times were fitted pixel-by-pixel using the linear equation of the SNR delay time dependence (see Supplementary Material S2), and slope maps were created. The slope maps were further recalculated into perfusion maps using the developed model (see Supplementary Material S1). The SNR of the perfusion images was calculated as the ratio of the mean pixel intensity value from the brain region to the standard deviation of the selected square region from the background. The measured SNR values were compared to the average ASL SNR at 3T published in [39] using one-sample t-test. Xe hemodynamic response maps were created by subtracting the baseline slope map from the task slope map. An Xe functional brain map was overlaid on top of the high-resolution, T2-weighted proton image. Additional image processing information can be found in the Supplementary Material S4.

2.3.4. BOLD fMRI Image Acquisition

Participants were placed into an eight-channel Philips SENSE coil tuned to the 1H nucleus. 180 dynamic multi-slice echo-planar imaging (EPI) scans were acquired using the following parameters: FOV = 250 × 250 × 119 mm3, acquisition matrix = 64 × 64, voxel size = 3.91 × 3.91 × 4 mm3, TR/TE = 2 s/30 ms, FA = 90°, 24 slices with a 1 mm slice gap. Participants were subjected to the stimuli described above for the first 20 s and then a rest period for 20 s. Overall, 18 stimulus/rest repetitions were presented during the BOLD fMRI scans.
For anatomical localization purposes, high-resolution, T2-weighted, axial images were acquired using a turbo-spin echo (TSE) pulse sequence using the following parameters: FOV = 250 × 250 × 119 mm3, voxel size = 0.98 × 0.99 × 4 mm3, TR/TE = 3 s/80 ms, FA = 90°, 24 slices of 4 mm thickness separated by 1 mm gaps.

2.3.5. BOLD fMRI Image Processing

BOLD fMRI and T2-weighted anatomical images were converted from Philips PAR into Analyze format, and multivolume images were segmented into multiple 3D hdr files using MRIcro 1.40 (by Chris Rorden). The first 20 EPI scans (first complete cycle) were discarded to avoid T1 effects. fMRI data were processed using SPM12 [40] software using MATLAB R2018b (The Mathworks, Inc, Natick, MA, USA). Following manual alignment of the structural T2 image to the average canonical T2 image, the EPI image was manually aligned to the processed structural image. Using the SPM12 software, the obtained aligned EPI images were realigned and only the mean image was resliced. After slice timing and co-registration (an estimate), segmentation of the anatomical T2 image was performed and the final image was corrected to remove the spatially varying artifact (modulation of the image signal intensity). The functional and anatomical images were normalized using a saved deformation field with specification of the voxel size. Smoothing of the functional images was done with Full Width at Half Maximum (FWHM) set to 6 mm in all directions. The positive t-contrast (stimulus > rest) was calculated for the final functional image. The p-value was adjusted to 0.05 with a Family-Wise Error (FWE) correction. No masking or thresholding were applied during the image processing. Statistical maps were overlaid on volume-rendered brain images provided by SPM12.
Signal enhancement was estimated using the MarsBar extension for SPM12 (by Matthew Brett, available at http://marsbar.sourceforge.net/). The region of interest (ROI) was specified for the cluster with the highest intensity from SPM results file. This was viewed and exported as an image with the base space.

3. Results

3.1. In Vitro Evaluation of HP 129Xe TOF Pulse Sequence

The 129Xe TOF pulse sequence (Figure 1) was programmed on a Philips 3.0T Achieva MRI scanner and tested using a flow phantom (Figure 2a). A previously developed model of Xe uptake in the brain [41] was modified to facilitate quantitative perfusion measurements using 129Xe TOF imaging. The complete analytical function, which describes the signal evolution in a brain voxel (see Supplementary Material S1), is difficult to implement practically and, therefore, a simplified model for the 129Xe wash-in phase was developed by employing several assumptions. First, 129Xe relaxation in blood [32,41,42,43,44,45] is the predominant factor of polarization decay during the wash-in phase. Second, the value of the sum of the tissue perfusion-to-partition coefficient ratio plus the relaxivity of HP 129Xe in the tissue is small. With these two assumptions, the SNR evolution during the TOF imaging sequence can be expressed as a linear function (for the detailed mathematical derivation please see Supplementary Information), where the slope of the line is directly proportional to the sum of perfusion of all tissues in the voxel. This approach is valid only for short recovery times and can be easily used in practice, albeit yielding an underestimation of the slope of the TOF recovery curves for longer TOF delay times.
The flow rates were set to 5 mL/min, 6 mL/min, 7 mL/min, and 10 mL/min. The signal-to-noise ratio (SNR) increased linearly at small recovery times, followed by a nonlinear transition (intermediate recovery times) up until saturation (long recovery times) (Figure 2b). The nonlinear dynamic at intermediate recovery times can be explained by a nonlinear 129Xe velocity distribution in saline flow cross-sections. The signal became saturated earlier for the fastest flow rate, whereas a slight signal saturation was observed for the slowest flow rate. The slopes of the TOF recovery curves were calculated, and a strong Pearson’s correlation (r = 0.988, p < 0.05) between the flow rate and the signal recovery rate was observed (Figure 2c). A difference of 1 mL/min in flow caused the observed change in the recovery rate.

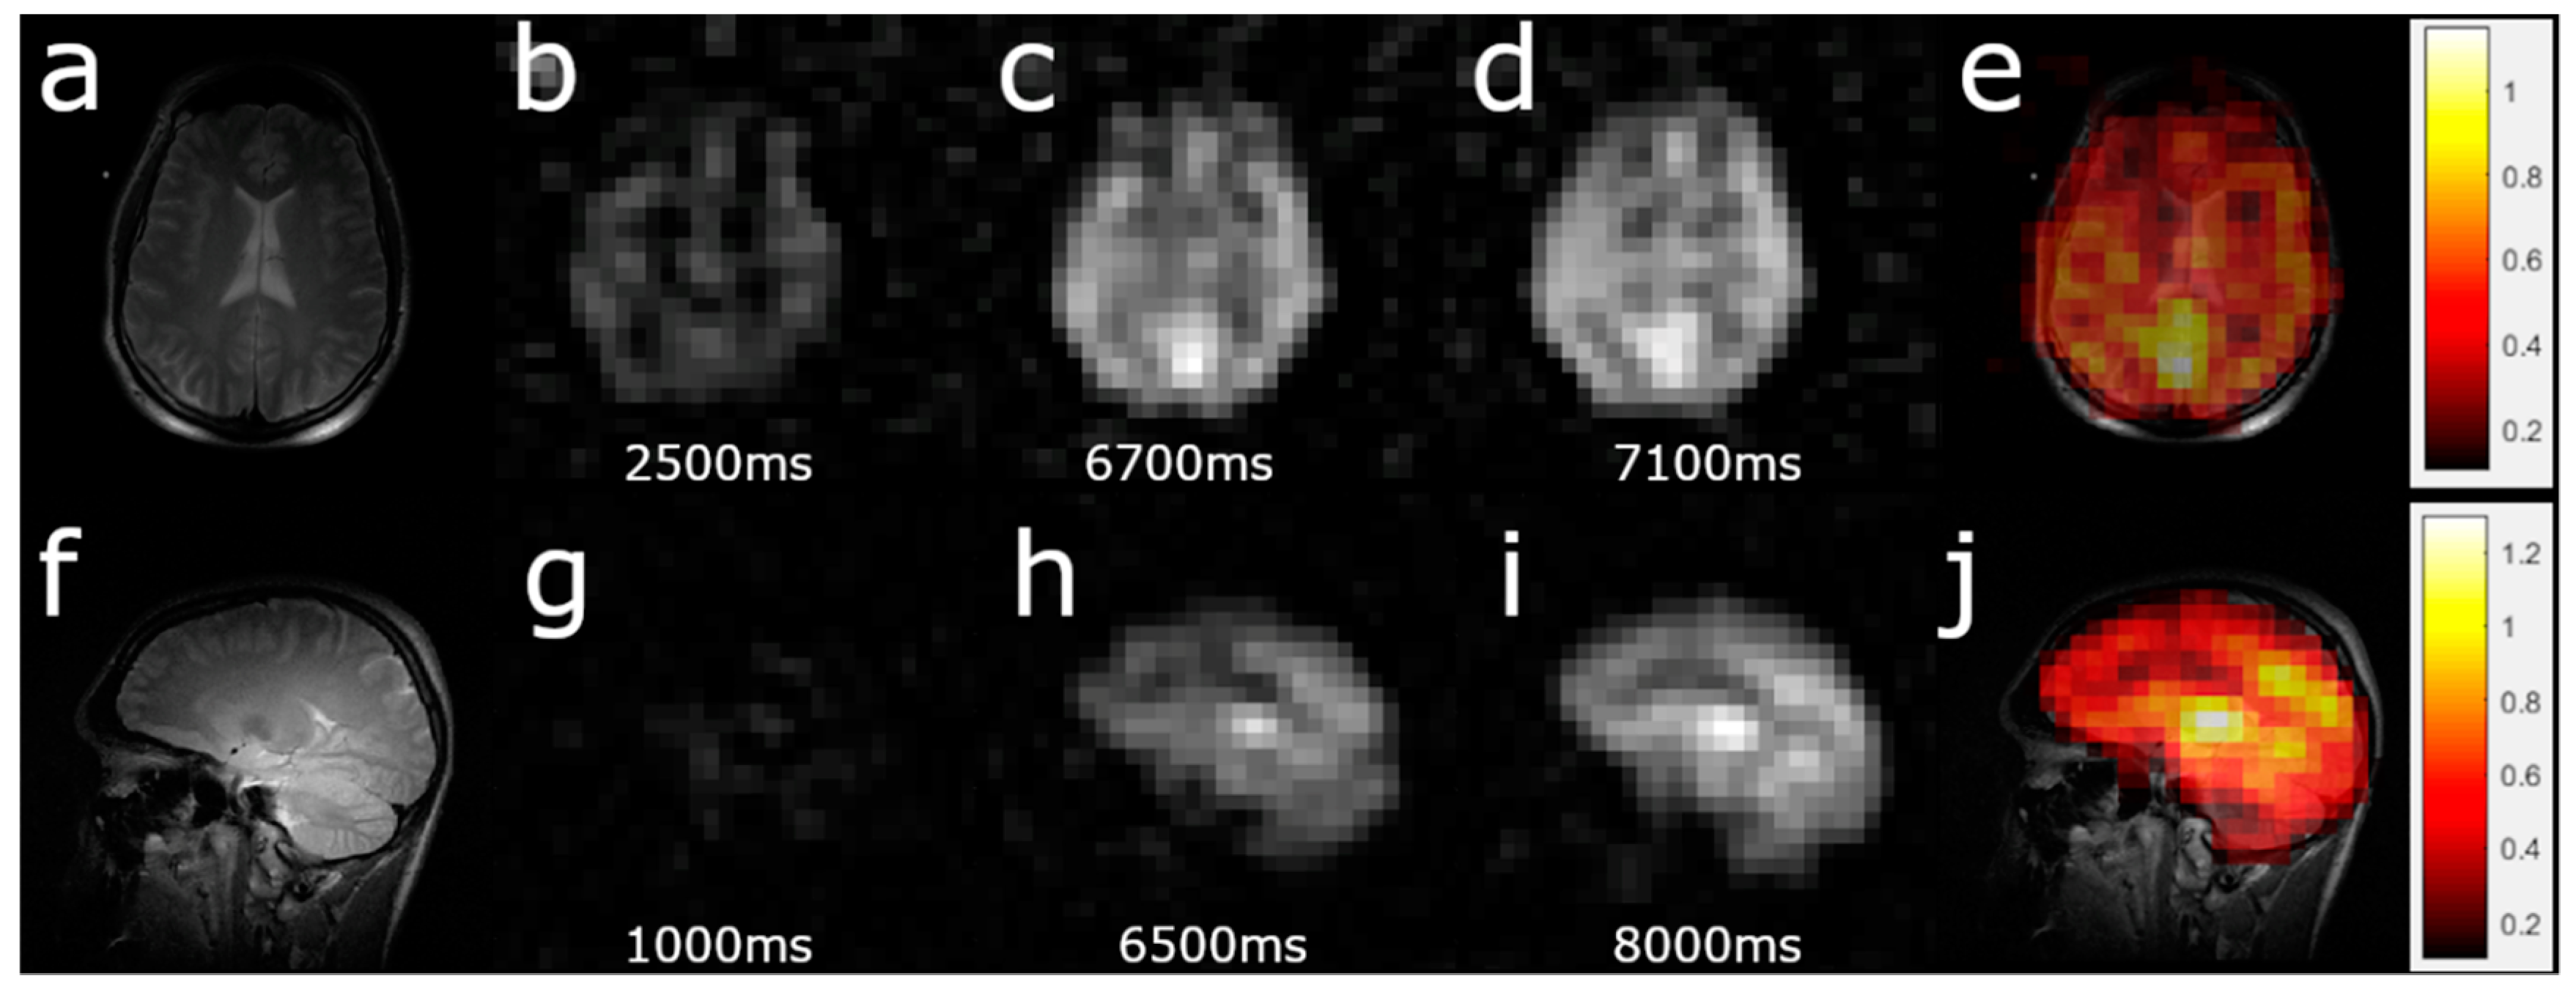
3.2. HP 129Xe TOF Cerebral Perfusion Imaging

Human imaging experiments were approved by the research ethics boards at Lakehead University and the Thunder Bay Regional Health Science Centre and conducted in accordance with the Tri-Council Policy Statement 2. All participants signed an informed consent form. During human imaging, the changes in the volunteers’ blood oxygen saturation levels were within the normal range. All images were acquired during a single breath-hold after inhalation of 1 L of HP 129Xe. The obtained images were converted from radiological to anatomical views.
Figure 3a,f demonstrate the high-resolution, T2-weighted proton images which were used for brain localization. Figure 3b–d show 129Xe TOF images acquired in the axial view after TOF of 2.5, 6.5, and 7.1 s. HP 129Xe TOF sagittal images (Figure 3g–i) were acquired following 1 s, 6.5 s, and 8 s TOF delays. Following pixel-by-pixel calculations of the TOF slope, the corresponding 129Xe TOF perfusion-weighted images were reconstructed in both the axial and sagittal projections. The average SNR of the reconstructed, perfusion-weighted images was equal to 11.2 ± 2.9 (in the sagittal projection) and 9.5 ± 2.9 (in the axial projection). Using the theoretical calculations shown in the Supplementary Information, the slope maps were transformed into net perfusion maps (Figure 3e,j). Although the 129Xe TOF pulse sequence is similar to the ASL pulse sequence, the manipulation of the magnetization is fundamentally different. The contrast of perfusion-weighted ASL images comes from the difference between control and spin-tagged images, whereas the contrast of TOF perfusion maps comes directly from the velocity of incoming blood flow.

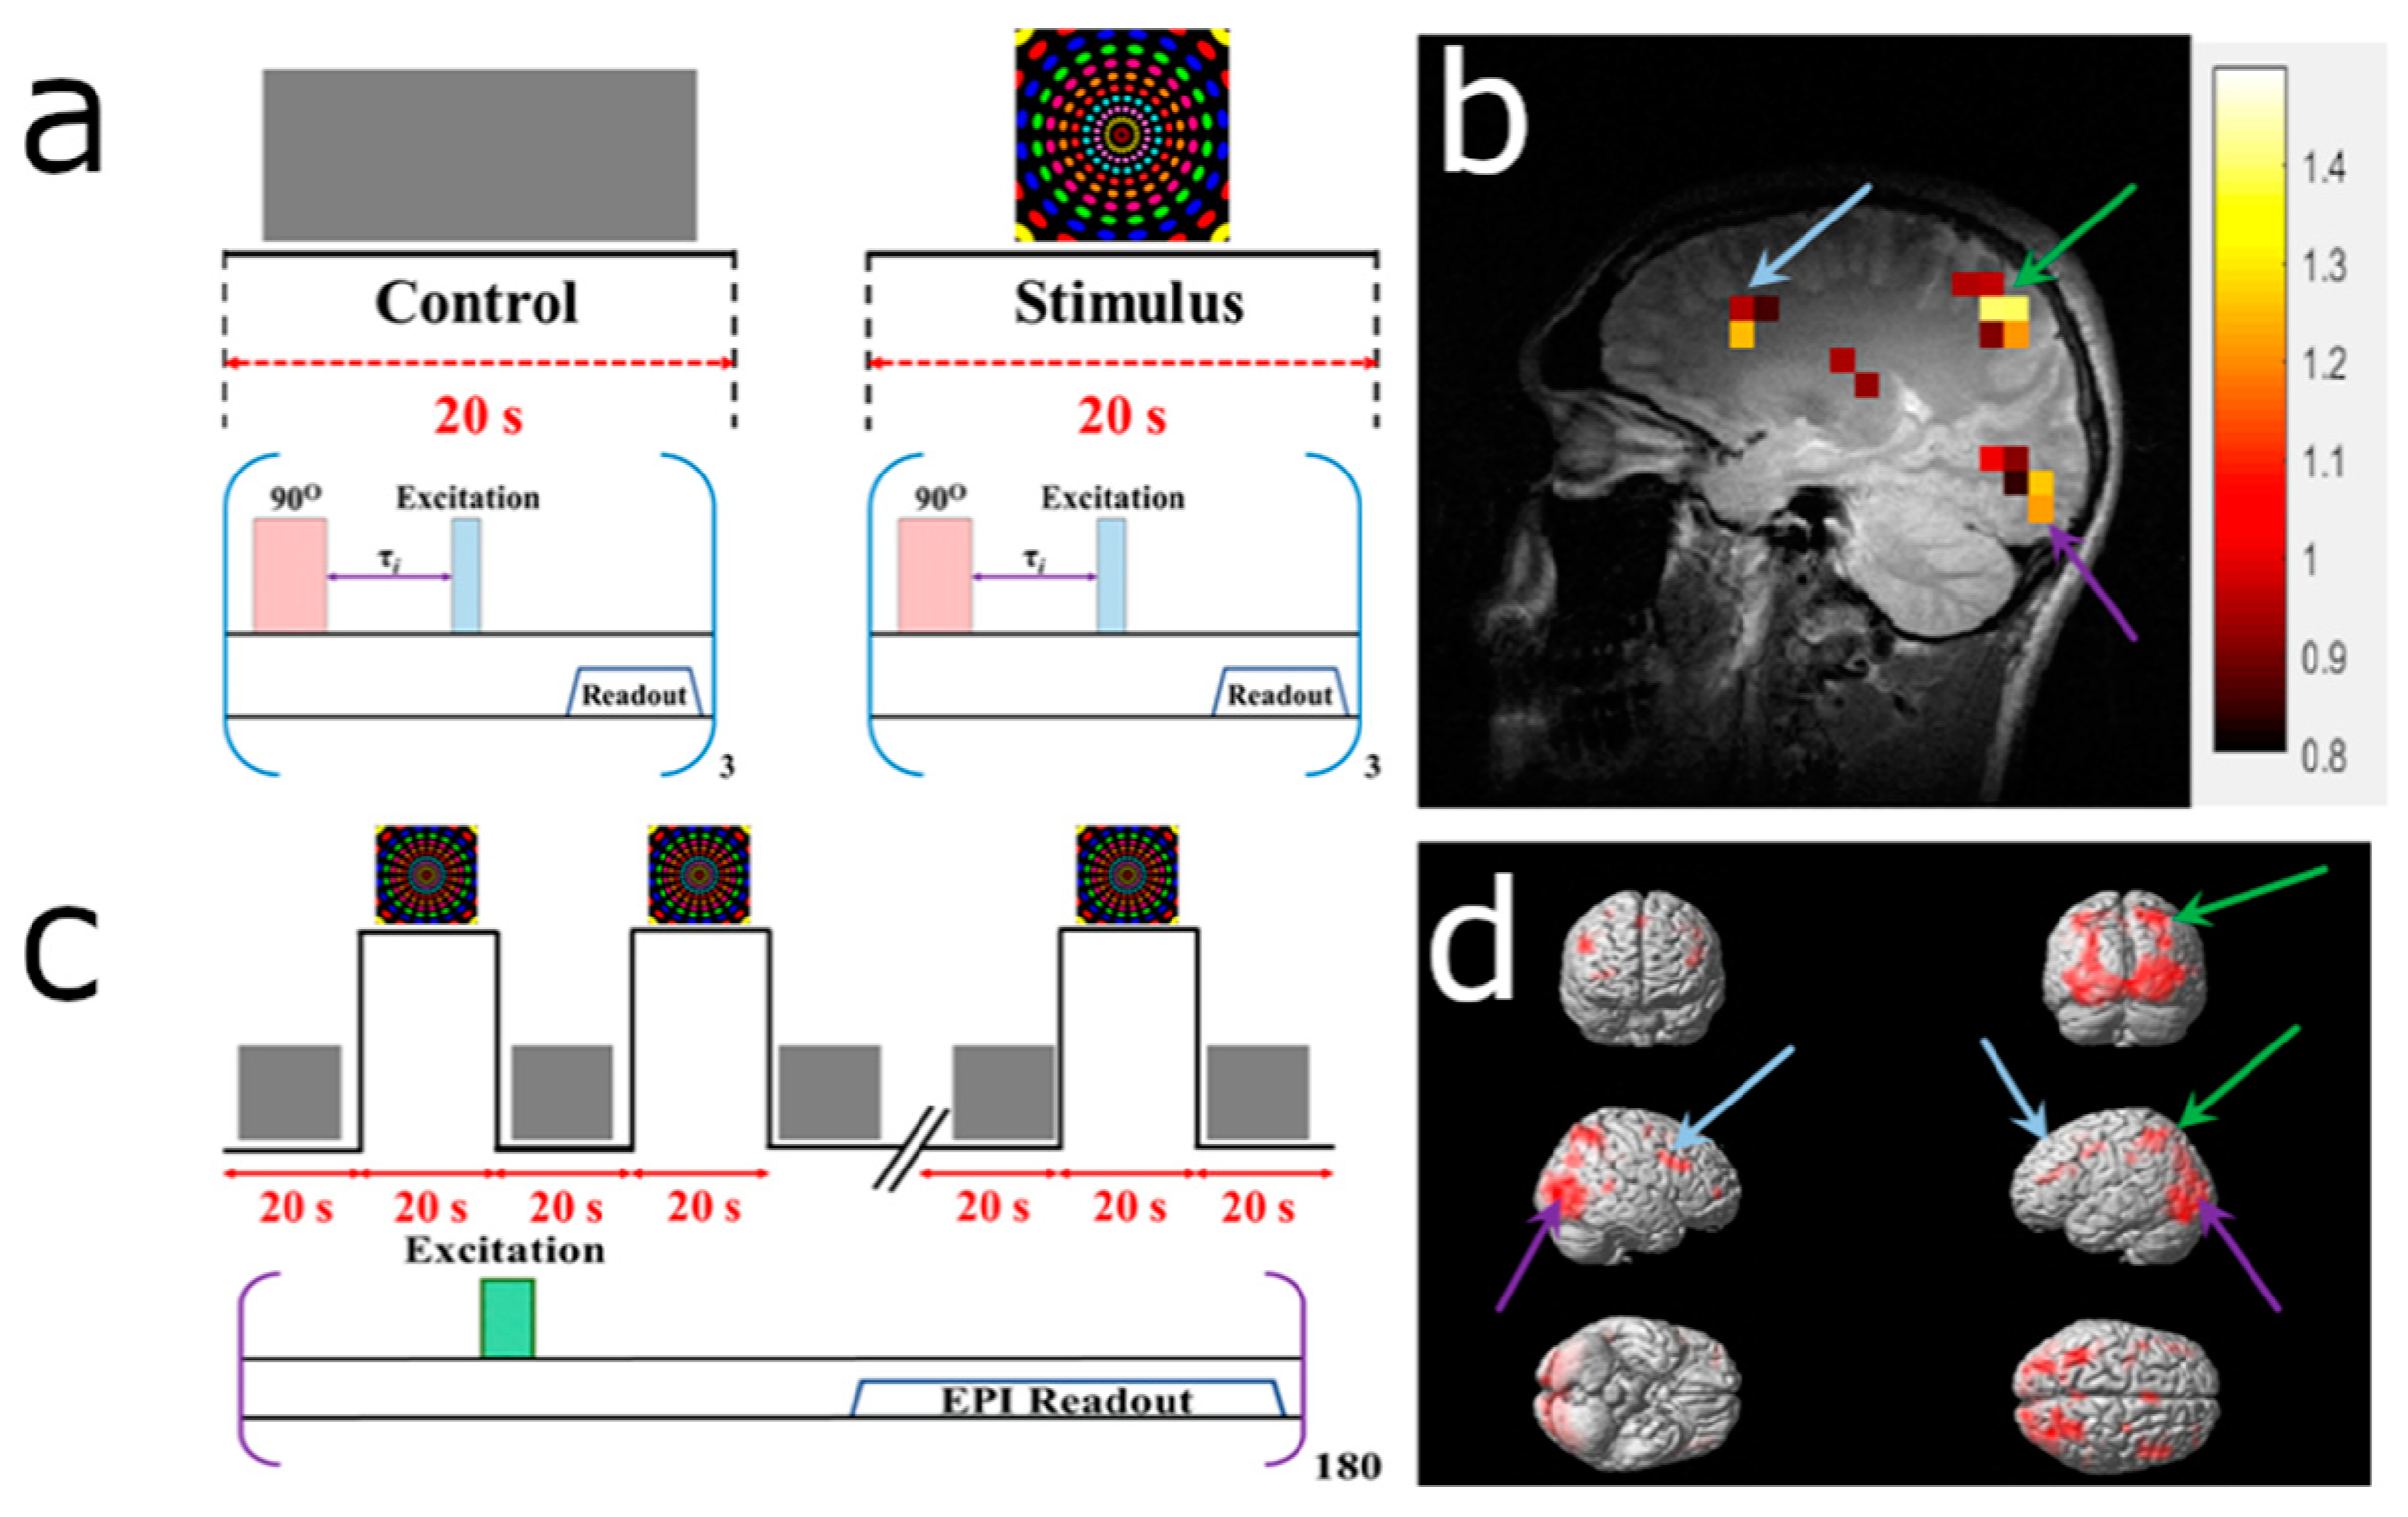
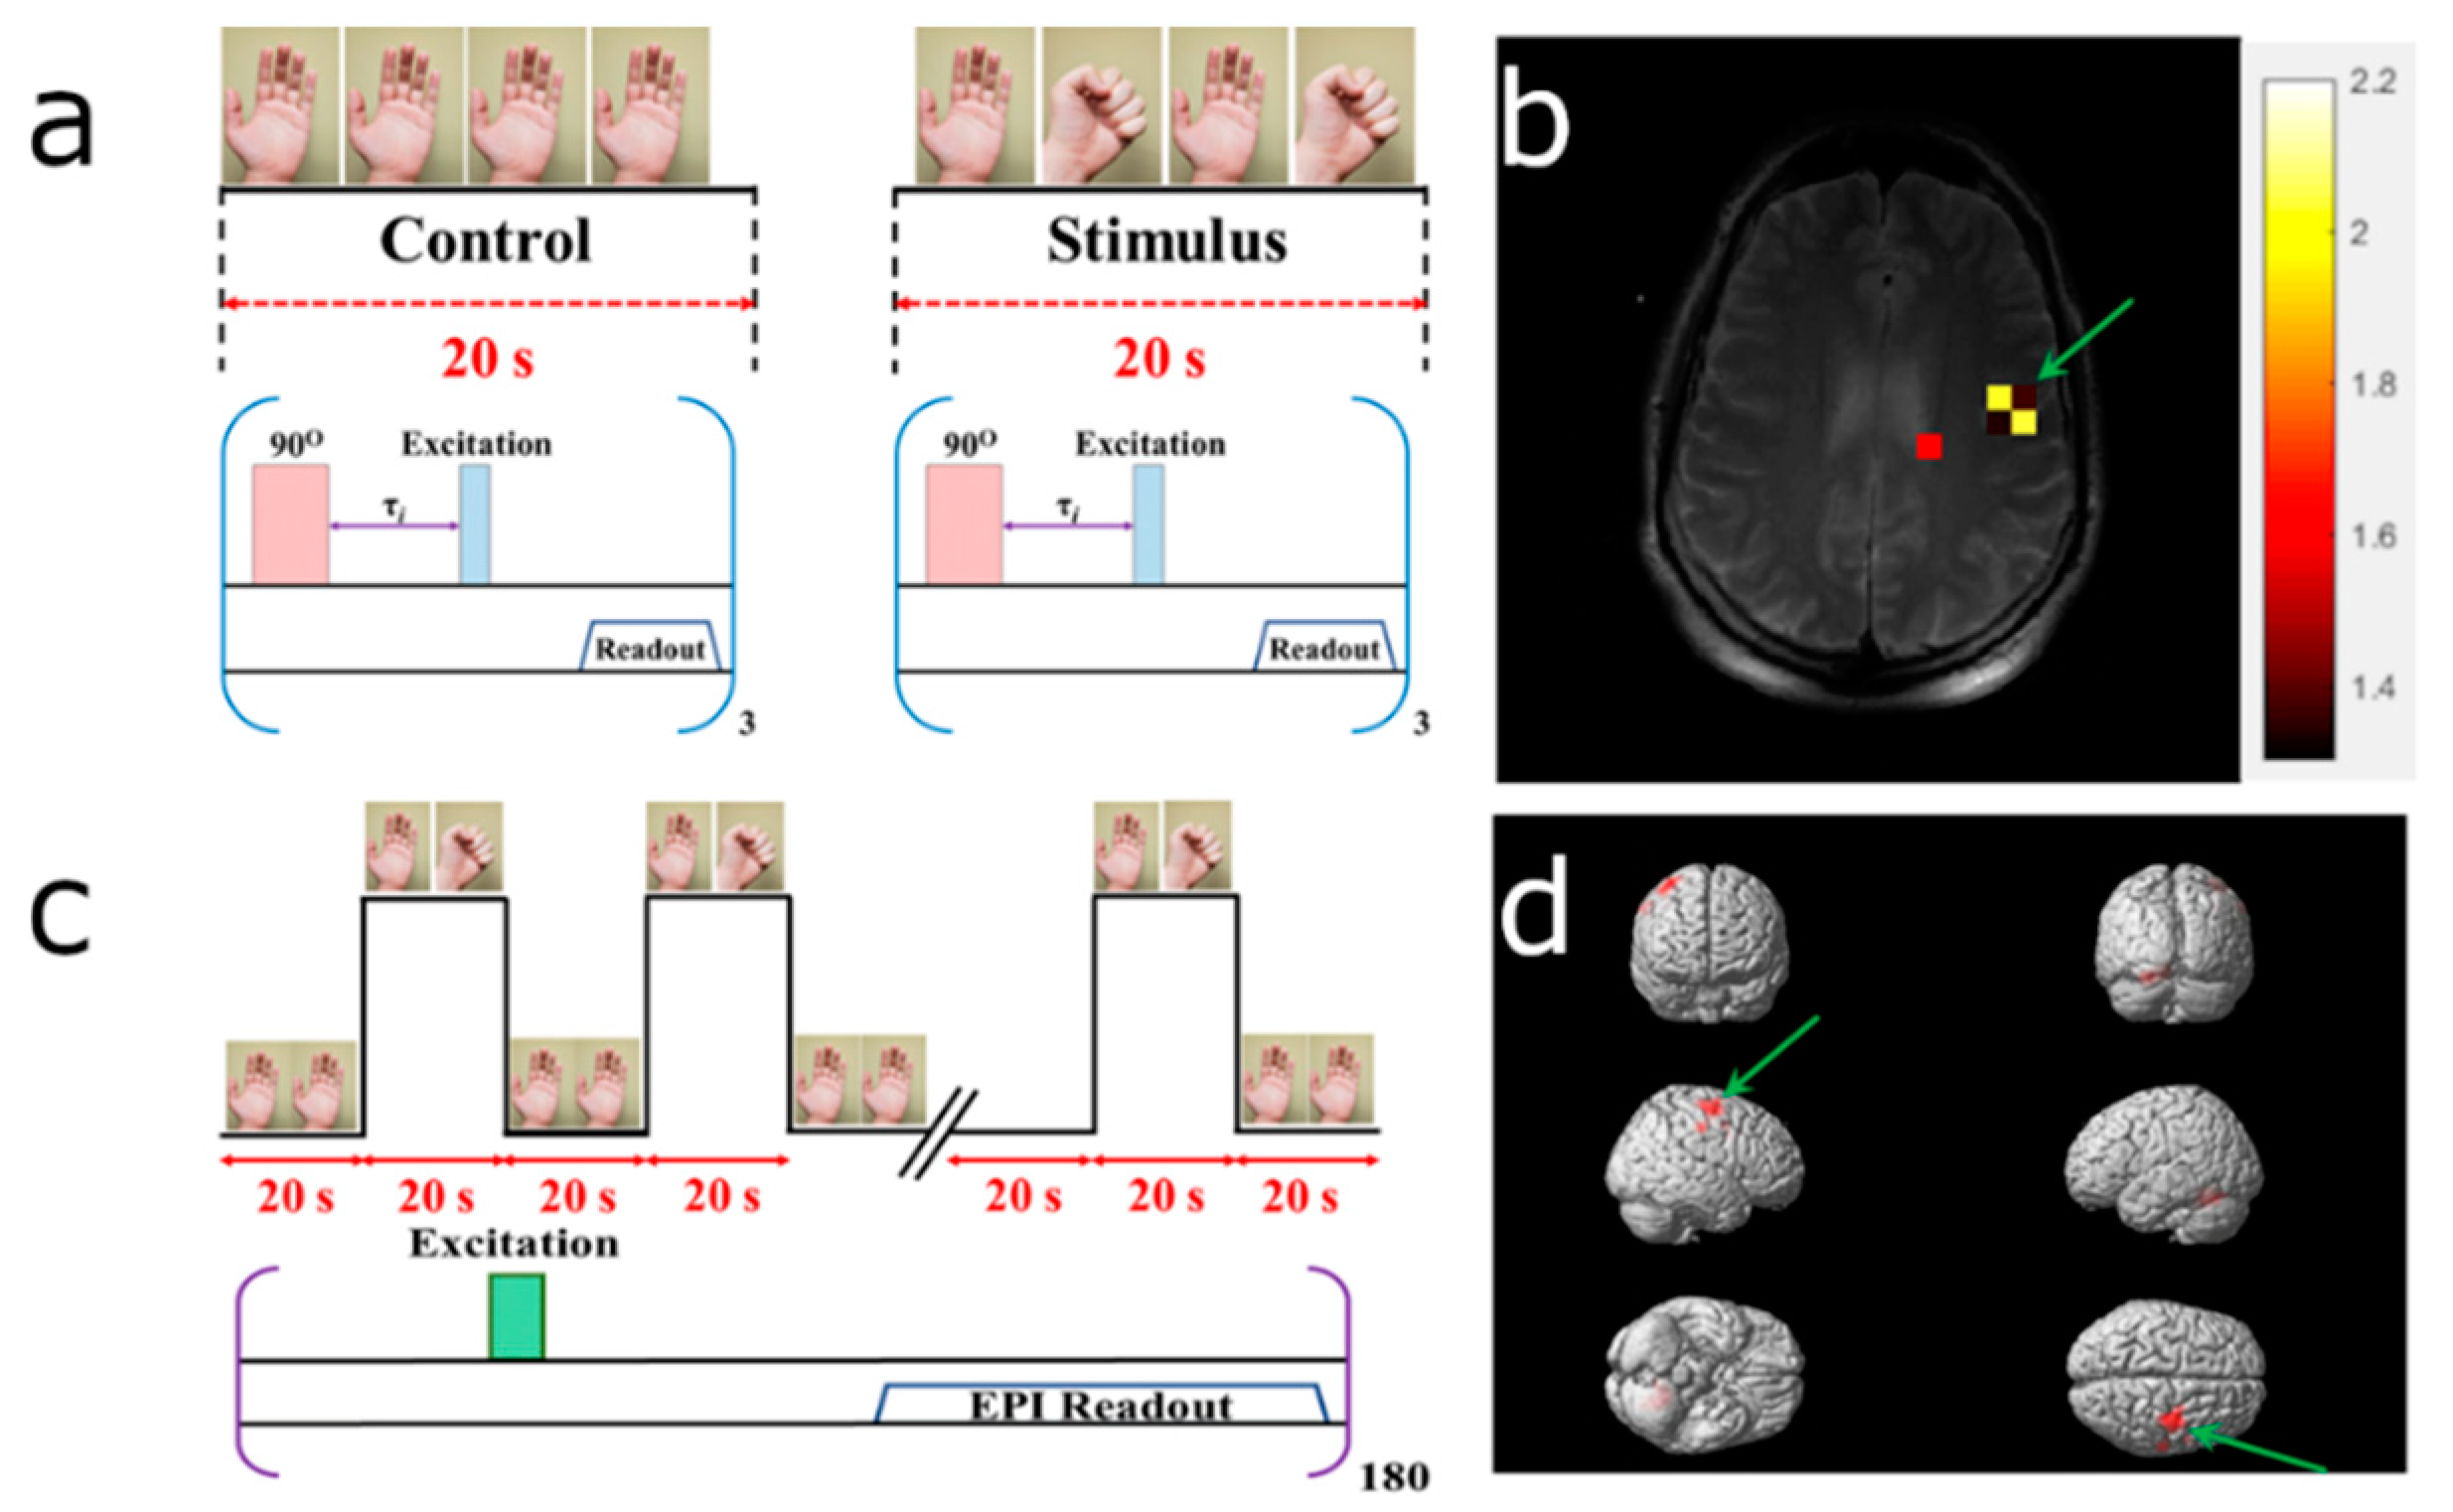
3.3. HP 129Xe Hemodynamic Response Detection

The blood-flow changes due to the hemodynamic response (HDR) to visual and motor stimuli (see Supplementary Material S3) ertr detected using 129Xe TOF perfusion imaging. The experimental designs for HP 129Xe TOF and 1H BOLD fMRI are shown in Figure 4a,c and Figure 5a,c. The reconstructed HDR maps nicely correlated with 1H BOLD fMRI and demonstrated the activation of the same brain regions. Activation areas demonstrated on 129Xe HDR maps agreed with previously published results [47,48,49,50].
Figure 4 illustrates the results obtained after subjecting the volunteer to the colorful rotating dotted visual stimulation. HP 129Xe TOF detected activation of the visual cortex (occipital lobe), superior parietal lobe, and frontal gyrus (Figure 4b). These results completely agreed with 1H BOLD fMRI images acquired by 129Xe TOF image (Figure 4d).
Figure 5 illustrated the experimental design (a,c) and obtained 129Xe TOF HDR maps (b) and 1H BOLD fMRI images (d) of the representative volunteers subjected to the motor stimulus. Both approaches detected activation of the motor cortex contralaterally to the clenched fist.

4. Discussion

There is no HP MRI approach currently available which is suitable for quantitative perfusion imaging. Recently, HP MRI was used to detect cerebral perfusion changes caused by stroke [35] and Alzheimer’s disease [34]. Since HP 129Xe freely dissolves in the blood and travels to highly perfused organs, it can be used as a contrast agent for quantitative imaging of perfusion and blood flow. Therefore, HP 129Xe TOF blood flow mapping is a possible next step in blood flow and perfusion measurement.
Previous works focused on the dynamic acquisition of multiple brain projection images during a breath-hold and the following wash-out time of 129Xe from the brain [6,33,34]. Acquired images were subsequently averaged [6,33] or postprocessed to characterize the wash-out process of 129Xe from the brain [34]. These approaches were strongly dependent on variations in the breath-hold period and the individual lung capacities of the subjects. There is typically some signal variation in the 129Xe images acquired from the same subject from different breath-holds due to individual variation in the amount of inhaled gas, the amount of gas actually in the alveolar lung space, and the amount of gas remaining in the trachea and larynx. Therefore, a proper comparison of images acquired from different breath-holds is challenging and requires proper signal normalization.
The HP 129Xe TOF technique is the first differential HP MRI technique, to our knowledge, that relies on 129Xe signal recovery rate calculation. This imaging approach is fundamentally different from all other MRI methods for blood flow mapping and relies on the special properties of HP MRI. An initial depolarization radiofrequency pulse applied to the imaging region provides the necessary reference for accurate imaging and makes the obtained perfusion-weighted images independent of individual lung capacity and breath-hold variations. In addition, the HP 129Xe TOF approach allows quantitative perfusion mapping using the derived theory (see Supplementary Material S1).
Although HP 129Xe blood flow mapping is similar to ASL in terms of pulse sequences, this technique overcomes the issue of low signal-to-noise ratio, which is typical for ALS perfusion images (the mean SNR of the Xe perfusion maps was approximately double compared to values acquired for ASL [39] (p < 0.05)) [1,51]. The obtained 129Xe perfusion maps (Figure 3e,j) looked similar to results previously obtained from healthy volunteers acquired using ASL MRI [52]. With the additional separation of the HP 129Xe signals originating from various brain tissues from the signal of 129Xe dissolved in blood (either via different phase separation methods or using chemical shift selective imaging), it should be possible to quantitively map the perfusion of each tissue in a region of interest. Signal separation of the dissolved 129Xe phases may allow the use of an exact mathematical solution for perfusion map calculations (see Supplementary Material S1), which would eliminate any potential underestimation of perfusion caused by using an approximate linear model.
Recently, multiple advances in ASL perfusion imaging were achieved by developing a pseudo-continuous ASL (pCASL), resulting in an SNR increase compared to conventional ASL [16,17,18,53]. pCASL perfusion images have higher spatial resolution compared to the present HP 129Xe TOF images, mainly due to their significantly better developed hardware (multichannel coils used for parallel imaging during perfusion imaging) and software available for conducting proton ASL MRI. By using a parallel imaging approach, compressed sensing, nonCartesian k-space trajectories, and by developing multichannel 129Xe coils, it should be possible to acquire HP 129Xe perfusion maps with a spatial resolution comparable to pCASL resolution and with a significantly higher SNR.
Although the scan time for acquiring a single brain perfusion map was ~20 s, it could be shortened to ~10 s by reducing TOF recovery time delays. The scan time could be shortened further for kidney perfusion measurements, since the reasonably high SNR of HP 129Xe dissolved in the kidneys can be acquired in less than 4 s [35].
As one practical application, the HP 129Xe perfusion mapping technique could be used for functional imaging of the human brain, which would allow direct hemodynamic response mapping. HP 129Xe functional brain maps can be acquired significantly faster compared to traditional BOLD functional images. In addition, this approach requires less postprocessing than the BOLD technique, which makes it less ambiguous in terms of data processing. Although BOLD fMRI and HP 129Xe perfusion mapping are two fundamentally different techniques and quantitative comparisons between them are challenging, the estimated percent signal enhancement of the functional maps obtained by HP 129Xe perfusion mapping was up to two orders of magnitude larger than the BOLD fMRI images. Xenon gas is used in clinics as a general inhalation anesthetic with continuous breathing over several minutes at a total lung concentration greater than 50% [54]. Previous studies demonstrated an acceptably low incidence of adverse effects caused by inhalation of xenon with an overall alveolar concentration below 32% [55]. The concentration of inhaled HP 129Xe in our study was 20–25% (considering a lung volume of 4–5 L), and there were no side effects observed after multiple inhalations and breath-holds.
A major limitation of the approach demonstrated for 129Xe TOF functional imaging is the requirement of acquiring projection images instead of multislice images due to the limited quantity of HP 129Xe that is transported to the brain. This issue can be overcome by using parallel imaging and compressed sensing techniques, which allow for faster acquisition with higher SNR per TOF image. Therefore, a larger number of slices can be scanned during a single breath-hold. Another limitation of HP 129Xe perfusion mapping, in terms of its clinical relevance, is the ability of a participant to hold their breath. Although the short scan time required allows perfusion mapping in patients with lung diseases who can only tolerate short breath-hold periods, this technique is not possible for participants who cannot hold their breath for at least eight seconds. As an alternative, continuous breathing of an HP 129Xe mixture with oxygen could be considered. A continuous breathing protocol has so far only been utilized for animal lung studies [56,57]. Translation of this breathing protocol to HP perfusion imaging might be challenging due to the oxygen-induced T1 shortening of HP 129Xe and subsequent decrease in the 129Xe MRI signal. On the other hand, this approach could allow for multiple signal averaging and expand the application of HP 129Xe TOF perfusion imaging. As a particular example, patients who are not able to hold their breath for eight seconds could be scanned using continuous breathing. Moreover, this might allow for HP 129Xe perfusion imaging during clinical procedures when patients are under HP 129Xe-induced anesthesia. Since the 129Xe TOF technique is based on selective depolarization of 129Xe nuclei, the MRI scanner needs to be properly calibrated, otherwise there will be an additional contribution to the signal from partially depolarized nuclei. Another potential limitation for some HP perfusion imaging applications is the time needed for 129Xe polarization. The polarizer used in this study requires about 15 min to polarize 1 L of 129Xe. Therefore, as a diagnostic tool, HP 129Xe TOF might not be suitable for urgent imaging purposes. On the other hand, Xe was shown to demonstrate neuroprotective properties [58], indicating a potential use of this modality for cerebral perfusion imaging in stroke patients, for example. Finally, the other limitations of this technique are the high cost of enriched 129Xe gas and the polarizer instrument. It should be noted that the use of enriched 129Xe is required by an overall low HP 129Xe signal in the brain. With further hardware development, the use of naturally abundant 129Xe, which is substantially less expensive, is expected to become more feasible.
Overall, HP 129Xe perfusion mapping is a novel HP MRI method which, we believe, could expand future knowledge in the field of perfusion imaging and functional brain mapping. It may also be a useful tool for the detection of perfusion changes in different organs and for further diagnostics regarding perfusion-related diseases.

5. Patents

Based on the results of this work, the provisional patent entitled “Method to Detect Brain Functional Activities Using Hyperpolarized 129Xe MR” was filed.

Supplementary Materials

The following are available online at https://www.mdpi.com/2075-4418/10/9/630/s1.

Author Contributions

Conceptualization, Y.S., F.T.H., T.L., A.H., and M.S.A.; methodology, Y.S., F.T.H., and V.G.; software, Y.S.; theoretical calculations, Y.S.; validation, Y.S., F.T.H, V.G., and T.L.; formal analysis, Y.S. and V.G; investigation, Y.S., F.T.H, V.G., and T.L.; resources, T.L. and F.T.H.; data curation, Y.S., F.T.H, V.G., and T.L.; writing—original draft preparation, Y.S; writing—review and editing, Y.S., F.T.H., V.G., T.L., A.H., and M.S.A; visualization, Y.S., F.T.H, V.G., and T.L.; supervision, A.H. and M.S.A; project administration, F.T.H., Y.S., M.S.A., and A.H.; funding acquisition, M.A and F.T.H. All authors have read and agreed to the published version of the manuscript.

Funding

This research was funded by the Ontario Research Fund (ORF RE 09 029) and the Northern Ontario Academic Medical Association (A-18-05). Y.S. received partial funding from the Mathematics of Information Technology and Complex Systems (Mitacs) Accelerate grant (IT10555) and an Ontario Graduate Scholarship. F.T.H. held postdoctoral fellowships from the BrightFocus Foundation (A2015344F) and the Canadian Institute for Health Research (358549). V.G. was supported by an Ontario Trillium Scholarship.

Acknowledgments

The authors would like to thank the numerous administrative and technical staff that assisted in conducting these experiments, including Martina Agostino, Nikka Stoger, Elizabeth Turubchuk, Kendra Rhys, Erin Venn, Sue Wright, James McNabb, Crystal Forsyth, Jane Lawrence-Dewar, and Karl Granberg. This project would not have been possible without the diligent assistance of these individuals. The authors would like to thank Dilip Balamore and Ariel Avilion for their valuable suggestions regarding the manuscript. The authors also thank Martina Agostino for her contributions to manuscript editing. M.S.A. would like to thank Dilip Balamore and Marcus Couch for stimulating discussions on this topic. The authors thank a reviewer of a previous draft of the manuscript for their insights on the topic of Xe perfusion imaging.

Conflicts of Interest

The authors declare no conflict of interest.

References

  1. Petersen, E.T.; Zimine, I.; Ho, Y.C.L.; Golay, X. Non-invasive measurement of perfusion: A critical review of arterial spin labelling techniques. Br. J. Radiol. 2006, 79, 688–701. [Google Scholar] [CrossRef] [PubMed]
  2. Lubbers, M.; Coenen, A.; Kofflard, M.; Bruning, T.; Kietselaer, B.; Galema, T.; Kock, M.; Niezen, A.; Das, M.; van Gent, M.; et al. Comprehensive Cardiac CT With Myocardial Perfusion Imaging Versus Functional Testing in Suspected Coronary Artery Disease: The Multicenter, Randomized CRESCENT-II Trial. JACC Cardiovasc. Imaging 2018, 11, 1625–1636. [Google Scholar] [CrossRef] [PubMed]
  3. Mori, H.; Isobe, S.; Suzuki, S.; Unno, K.; Morimoto, R.; Kano, N.; Okumura, T.; Yasuda, Y.; Kato, K.; Murohara, T. Prognostic value of left ventricular dyssynchrony evaluated by gated myocardial perfusion imaging in patients with chronic kidney disease and normal perfusion defect scores. J. Nucl. Cardiol. 2019, 26, 288–297. [Google Scholar] [CrossRef] [PubMed]
  4. Gillis, K.A.; McComb, C.; Patel, R.K.; Stevens, K.K.; Schneider, M.P.; Radjenovic, A.; Morris, S.T.W.; Roditi, G.H.; Delles, C.; Mark, P.B. Non-Contrast Renal Magnetic Resonance Imaging to Assess Perfusion and Corticomedullary Differentiation in Health and Chronic Kidney Disease. Nephron 2016, 133, 183–192. [Google Scholar] [CrossRef] [PubMed] [Green Version]
  5. Greenberg, D.A.; Jin, K. From angiogenesis to neuropathology. Nature 2005, 438, 954–959. [Google Scholar] [CrossRef] [PubMed]
  6. Rao, M.R.; Norquay, G.; Stewart, N.J.; Hoggard, N.; Griffiths, P.D.; Wild, J.M. Assessment of brain perfusion using hyperpolarized 129Xe MRI in a subject with established stroke. J. Magn. Reson. Imaging 2019, 50, 1002–1004. [Google Scholar] [CrossRef]
  7. Hu, W.T.; Wang, Z.; Lee, M.-Y.; Trojanowski, J.Q.; Detre, J.A.; Grossman, M. Distinct cerebral perfusion patterns in FTLD and AD. Neurology 2010, 75, 881–888. [Google Scholar] [CrossRef] [Green Version]
  8. Ito, H.; Inoue, K.; Goto, R.; Kinomura, S.; Taki, Y.; Okada, K.; Sato, K.; Sato, T.; Kanno, I.; Fukuda, H. Database of normal human cerebral blood flow measured by SPECT: I. Comparison between 1-123-IMP, Tc-99m-HMPAO, and Tc-99m-ECD as referred with O-15 labeled water PET and voxel-based morphometry. Ann. Nucl. Med. 2006, 20, 131–138. [Google Scholar] [CrossRef]
  9. Okazawa, H.; Higashino, Y.; Tsujikawa, T.; Arishima, H.; Mori, T.; Kiyono, Y.; Kimura, H.; Kikuta, K. ichiro Noninvasive method for measurement of cerebral blood flow using O-15 water PET/MRI with ASL correlation. Eur. J. Radiol. 2018, 105, 102–109. [Google Scholar] [CrossRef]
  10. Kamath, A.; Smith, W.S.; Powers, W.J.; Cianfoni, A.; Chien, J.D.; Videen, T.; Lawton, M.T.; Finley, B.; Dillon, W.P.; Wintermark, M. Perfusion CT compared to H215O/O15O PET in patients with chronic cervical carotid artery occlusion. Neuroradiology 2008, 50, 745–751. [Google Scholar] [CrossRef] [Green Version]
  11. Yonas, H.; Darby, J.M.; Marks, E.C.; Durham, S.R.; Maxwell, C. CBF Measured by Xe-CT: Approach to Analysis and Normal Values. J. Cereb. Blood Flow Metab. 1991, 11, 716–725. [Google Scholar] [CrossRef] [PubMed] [Green Version]
  12. Johnson, U.; Engquist, H.; Howells, T.; Nilsson, P.; Ronne-Engström, E.; Lewén, A.; Rostami, E.; Enblad, P. Bedside Xenon-CT Shows Lower CBF in SAH Patients with Impaired CBF Pressure Autoregulation as Defined by Pressure Reactivity Index (PRx). Neurocrit. Care 2016, 25, 47–55. [Google Scholar] [CrossRef] [PubMed]
  13. Fukuda, T.; Ogasawara, K.; Kobayashi, T.; Komoribayashi, N.; Endo, H.; Inoue, T.; Kuzu, Y.; Nishimoto, H.; Terasaki, K.; Ogawa, A. Measurement of cerebral hemodynamics with perfusion-weighted MR imaging: Comparison with pre- and post-acetazolamide 133Xe-SPECT in occlusive carotid disease. AJNR Am. J. Neuroradiol. 2001, 22, 248–254. [Google Scholar]
  14. Golay, X.; Petersen, E.T. Arterial Spin Labeling: Benefits and Pitfalls of High Magnetic Field. Neuroimaging Clin. N. Am. 2006, 16, 259–268. [Google Scholar] [CrossRef] [PubMed]
  15. Nery, F.; Gordon, I.; Thomas, D. Non-Invasive Renal Perfusion Imaging Using Arterial Spin Labeling MRI: Challenges and Opportunities. Diagnostics 2018, 8, 2. [Google Scholar] [CrossRef] [PubMed] [Green Version]
  16. Vidorreta, M.; Wang, Z.; Chang, Y.V.; Wolk, D.A.; Fernández-Seara, M.A.; Detre, J.A. Whole-brain background-suppressed pCASL MRI with 1D-accelerated 3D RARE Stack-Of-Spirals readout. PLoS ONE 2017, 12, e0183762. [Google Scholar] [CrossRef]
  17. Kilroy, E.; Apostolova, L.; Liu, C.; Yan, L.; Ringman, J.; Wang, D.J.J. Reliability of two-dimensional and three-dimensional pseudo-continuous arterial spin labeling perfusion MRI in elderly populations: Comparison with 15o-water positron emission tomography. J. Magn. Reson. Imaging 2014, 39, 931–939. [Google Scholar] [CrossRef] [Green Version]
  18. Harteveld, A.A.; de Boer, A.; Franklin, S.L.; Leiner, T.; van Stralen, M.; Bos, C. Comparison of multi-delay FAIR and pCASL labeling approaches for renal perfusion quantification at 3T MRI. Magn. Reson. Mater. Phys. Biol. Med. 2020, 33, 81–94. [Google Scholar] [CrossRef] [Green Version]
  19. Ni, L.; Li, J.; Li, W.; Zhou, F.; Wang, F.; Schwarz, C.G.; Liu, R.; Zhao, H.; Wu, W.; Zhang, X.; et al. The value of resting-state functional MRI in subacute ischemic stroke: Comparison with dynamic susceptibility contrast-enhanced perfusion MRI. Sci. Rep. 2017, 7, 1–8. [Google Scholar] [CrossRef]
  20. Hashido, T.; Saito, S.; Ishida, T. A radiomics-based comparative study on arterial spin labeling and dynamic susceptibility contrast perfusion-weighted imaging in gliomas. Sci. Rep. 2020, 10, 6121. [Google Scholar] [CrossRef] [Green Version]
  21. Sourbron, S.; Ingrisch, M.; Siefert, A.; Reiser, M.; Herrmann, K. Quantification of cerebral blood flow, cerebral blood volume, and blood-brain-barrier leakage with DCE-MRI. Magn. Reson. Med. 2009, 62, 205–217. [Google Scholar] [CrossRef] [PubMed]
  22. Yerram, P.; Saab, G.; Karuparthi, P.R.; Hayden, M.R.; Khanna, R. Nephrogenic systemic fibrosis: A mysterious disease in patients with renal failure—Rrole of gadolinium-based contrast media in causation and the beneficial effect of intravenous sodium thiosulfate. Clin. J. Am. Soc. Nephrol. 2007, 2, 258–263. [Google Scholar] [CrossRef] [PubMed]
  23. Perazella, M.A. Nephrogenic systemic fibrosis, kidney disease, and gadolinium: Is there a link? Clin. J. Am. Soc. Nephrol. 2007, 2, 200–202. [Google Scholar] [CrossRef] [PubMed] [Green Version]
  24. Liu, X.; Madhankumar, A.B.; Miller, P.A.; Duck, K.A.; Hafenstein, S.; Rizk, E.; Slagle-Webb, B.; Sheehan, J.M.; Connor, J.R.; Yang, Q.X. MRI contrast agent for targeting glioma: Interleukin-13 labeled liposome encapsulating gadolinium-DTPA. Neuro. Oncol. 2016, 18, 691–699. [Google Scholar] [CrossRef] [PubMed] [Green Version]
  25. Le Mignon, M.M.; Chambon, C.; Warrington, S.; Davies, R.; Bonnemain, B. Gd-DOTA. Pharmacokinetics and tolerability after intravenous injection into healthy volunteers. Investig. Radiol. 1990, 25, 933–937. [Google Scholar] [CrossRef]
  26. Runge, V.M.; Clanton, J.A.; Price, A.C.; Wehr, C.J.; Herzer, W.A.; Leon Partain, C.; James, E. The Use of Gd dtpa as a Perfusion Agent and Marker of Blood-Brain Barrier Disruption. Mqnnrrrc Krsonance Imaging 1985, 3, 43–55. [Google Scholar] [CrossRef]
  27. Albert, M.S.; Cates, G.D.; Driehuys, B.; Happer, W.; Saam, B.; Springer, C.S.; Wishnia, A. Biological Magnetic Resonance Imaging Using Laser-Polarized 129Xe. Nature 1994, 370, 199–201. [Google Scholar] [CrossRef]
  28. Kruger, S.J.; Nagle, S.K.; Couch, M.J.; Ohno, Y.; Albert, M.; Fain, S.B. Functional imaging of the lungs with gas agents. J. Magn. Reson. Imaging 2016, 43, 295–315. [Google Scholar] [CrossRef] [Green Version]
  29. Norquay, G.; Collier, G.J.; Rao, M.; Stewart, N.J.; Wild, J.M. Xe 129 -Rb Spin-Exchange Optical Pumping with High Photon Efficiency. Phys. Rev. Lett. 2018, 121, 153201. [Google Scholar] [CrossRef]
  30. Skinner, J.G.; Ranta, K.; Whiting, N.; Coffey, A.M.; Nikolaou, P.; Rosen, M.S.; Chekmenev, E.Y.; Morris, P.G.; Barlow, M.J.; Goodson, B.M. High Xe density, high photon flux, stopped-flow spin-exchange optical pumping: Simulations versus experiments. J. Magn. Reson. 2020, 312, 106686. [Google Scholar] [CrossRef]
  31. Ruset, I.C.; Ketel, S.; Hersman, F.W. Optical pumping system design for large production of hyperpolarized 129Xe. Phys. Rev. Lett. 2006, 96, 053002. [Google Scholar] [CrossRef] [PubMed]
  32. Rao, M.; Stewart, N.J.; Norquay, G.; Griffiths, P.D.; Wild, J.M. High Resolution Spectroscopy and Chemical Shift Imaging of Hyperpolarized 129Xe Dissolved in the Human Brain In Vivo at 1.5 Tesla. Magn. Reson. Med. 2016, 75, 2227–2234. [Google Scholar] [CrossRef] [PubMed] [Green Version]
  33. Rao, M.R.; Stewart, N.J.; Griffiths, P.D.; Norquay, G.; Wild, J.M. Imaging Human Brain Perfusion with Inhaled Hyperpolarized 129Xe MR Imaging. Radiology 2017, 286, 659–665. [Google Scholar] [CrossRef] [PubMed] [Green Version]
  34. Hane, F.T.; Li, T.; Plata, J.-A.; Hassan, A.; Granberg, K.; Albert, M.S. Inhaled Xenon Washout as a Biomarker of Alzheimer’s Disease. Diagnostics 2018, 8, 41. [Google Scholar] [CrossRef] [Green Version]
  35. Chacon-Caldera, J.; Maunder, A.; Rao, M.; Norquay, G.; Rodgers, O.I.; Clemence, M.; Puddu, C.; Schad, L.R.; Wild, J.M. Dissolved hyperpolarized xenon-129 MRI in human kidneys. Magn. Reson. Med. 2019. [Google Scholar] [CrossRef] [Green Version]
  36. Chang, Y.V. MOXE: A model of gas exchange for hyperpolarized 129Xe magnetic resonance of the lung. Magn. Reson. Med. 2013, 69, 884–890. [Google Scholar] [CrossRef]
  37. Fox, M.S.; Ouriadov, A.; Thind, K.; Hegarty, E.; Wong, E.; Hope, A.; Santyr, G.E. Detection of radiation induced lung injury in rats using dynamic hyperpolarized 129Xe magnetic resonance spectroscopy. Med. Phys. 2014, 41, 72302. [Google Scholar] [CrossRef]
  38. Driehuys, B.; Cofer, G.P.; Pollaro, J.; Mackel, J.B.; Hedlund, L.W.; Johnson, G.A. Imaging alveolar-capillary gas transfer using hyperpolarized 129Xe MRI. Proc. Natl. Acad. Sci. USA 2006, 103, 18278–18283. [Google Scholar] [CrossRef] [Green Version]
  39. Hare, H.V.; Blockley, N.P.; Gardener, A.G.; Clare, S.; Bulte, D.P. Investigating the field-dependence of the Davis model: Calibrated fMRI at 1.5, 3 and 7T. Neuroimage 2015, 112, 189–196. [Google Scholar] [CrossRef] [Green Version]
  40. Ashburner, J.; Barnes, G.; Chen, C.C.; Daunizeau, J.; Flandin, G.; Friston, K.; Jafarian, A.; Kiebel, S.; Litvak, V.; Moran, R.; et al. SPM (Statistical Parametric Mapping); Wellcome Trust Centre for Neuroimaging: London, UK, 2014. [Google Scholar]
  41. Kilian, W.; Seifert, F.; Rinneberg, H. Dynamic NMR Spectroscopy of Hyperpolarized 129Xe in Human Brain Analyzed by an Uptake Model. Magn. Reson. Med. 2004, 51, 843–847. [Google Scholar] [CrossRef]
  42. Zhou, X.; Mazzanti, M.L.; Chen, J.J.; Tzeng, Y.S.; Mansour, J.K.; Gereige, J.D.; Venkatesh, A.K.; Sun, Y.; Mulkern, R.V.; Albert, M.S. Reinvestigating hyperpolarized 129Xe longitudinal relaxation time in the rat brain with noise considerations. NMR Biomed. 2008, 21, 217–225. [Google Scholar] [CrossRef] [PubMed]
  43. Wolber, J.; Cherubini, A.; Leach, M.O.; Bifone, A. On the oxygenation-dependent 129 Xe T 1 in blood. NMR Biomed. 2000, 13, 234–237. [Google Scholar] [CrossRef]
  44. Albert, M.S.; Kacher, D.F.; Balamore, D.; Venkatesh, A.K.; Jolesz, F.A. T 1 of 129 Xe in Blood and the Role of Oxygenation. J. Magn. Reson. 1999, 140, 264–273. [Google Scholar] [CrossRef] [PubMed]
  45. Norquay, G.; Leung, G.; Stewart, N.J.; Tozer, G.M.; Wolber, J.; Wild, J.M. Relaxation and exchange dynamics of hyperpolarized 129Xe in human blood. Magn. Reson. Med. 2015, 74, 303–311. [Google Scholar] [CrossRef]
  46. Peled, S.; Jolesz, F.A.; Tseng, C.-H.; Nascimben, L.; Albert, M.S.; Walsworth, R.L. Determinants of tissue delivery for 129Xe magnetic resonance in humans. Magn. Reson. Med. 1996, 36, 340–344. [Google Scholar] [CrossRef] [PubMed]
  47. Neale, C.; Johnston, P.; Hughes, M.; Scholey, A. Functional Activation during the Rapid Visual Information Processing Task in a Middle Aged Cohort: An fMRI Study. PLoS ONE 2015, 10, e0138994. [Google Scholar] [CrossRef] [PubMed] [Green Version]
  48. Liu, Y.; Shen, H.; Zhou, Z.; Hu, D. Sustained Negative BOLD Response in Human fMRI Finger Tapping Task. PLoS ONE 2011, 6, e23839. [Google Scholar] [CrossRef] [Green Version]
  49. Turesky, T.K.; Olulade, O.A.; Luetje, M.M.; Eden, G.F. An fMRI study of finger tapping in children and adults. Hum. Brain Mapp. 2018, 39, 3203–3215. [Google Scholar] [CrossRef] [Green Version]
  50. Gountouna, V.E.; Job, D.E.; McIntosh, A.M.; Moorhead, T.W.J.; Lymer, G.K.L.; Whalley, H.C.; Hall, J.; Waiter, G.D.; Brennan, D.; McGonigle, D.J.; et al. Functional Magnetic Resonance Imaging (fMRI) reproducibility and variance components across visits and scanning sites with a finger tapping task. Neuroimage 2010, 49, 552–560. [Google Scholar] [CrossRef]
  51. Zhao, L.; Fielden, S.W.; Feng, X.; Wintermark, M.; Mugler, J.P.; Meyer, C.H. Rapid 3D dynamic arterial spin labeling with a sparse model-based image reconstruction. Neuroimage 2015, 121, 205–216. [Google Scholar] [CrossRef] [Green Version]
  52. Cui, Y.; Liang, X.; Gu, H.; Hu, Y.; Zhao, Z.; Yang, X.Y.; Qian, C.; Yang, Y.; Teng, G.J. Cerebral perfusion alterations in type 2 diabetes and its relation to insulin resistance and cognitive dysfunction. Brain Imaging Behav. 2017, 11, 1248–1257. [Google Scholar] [CrossRef] [PubMed] [Green Version]
  53. Dai, W.; Garcia, D.; De Bazelaire, C.; Alsop, D.C. Continuous flow-driven inversion for arterial spin labeling using pulsed radio frequency and gradient fields. Magn. Reson. Med. 2008, 60, 1488–1497. [Google Scholar] [CrossRef] [PubMed] [Green Version]
  54. Luttropp, H.H.; Thomasson, R.; Dahm, S.; Persson, J. Clinical experience with minimal flow xenon anesthesia. Acta Anaesihessiol. Scand. 1994, 38, 121–125. [Google Scholar] [CrossRef] [PubMed]
  55. Latchaw, R.E.; Yonas, H.; Pentheny, S.; Gur, D. Adverse Reactions to Xenon-enhanced CT Cerebral Blood Flow Determination. Radiology 1987, 163, 251–254. [Google Scholar] [CrossRef]
  56. Imai, H.; Matsumoto, H.; Miyakoshi, E.; Okumura, S.; Fujiwara, H.; Kimura, A. Regional fractional ventilation mapping in spontaneously breathing mice using hyperpolarized 129Xe MRI. NMR Biomed. 2015, 28, 24–29. [Google Scholar] [CrossRef]
  57. Loza, L.A.; Kadlecek, S.J.; Pourfathi, M.; Hamedani, H.; Duncan, I.F.; Ruppert, K.; Rizi, R.R. Quantification of Ventilation and Gas Uptake in Free-Breathing Mice With Hyperpolarized 129Xe MRI. IEEE Trans. Med. Imaging 2019, 38, 2081–2091. [Google Scholar] [CrossRef]
  58. Homi, H.M.; Yokoo, N.; Ma, D.; Warner, D.S.; Franks, N.P.; Maze, M.; Ch, M.B.B.; Grocott, H.P. The Neuroprotective Effect of Xenon Administration during Transient Middle Cerebral Artery Occlusion in Mice. Anesthesiology 2003, 99, 876–881. [Google Scholar] [CrossRef]
Figure 1. 129Xe time-of-flight (TOF) perfusion imaging pulse sequence diagram. The 90° pulse with narrow bandwidth (in pink) is applied first. After the recovery time delay, τ (the purple arrow), the imaging pulse sequence is initiated. The excitation pulse is represented by the blue rectangle. This pulse sequence is repeated n times. Index i corresponds to the delay time with an index number i.
Diagnostics 10 00630 g001
Figure 2. In vitro phantom design and obtained time-of-flight (TOF) 129Xe curves with Pearson’s correlation coefficient. (a) Schematic diagram of the flow phantom used in this study. A syringe pump provided four different flow rates, i.e., 5 mL/min, 6 mL/min, 7 mL/min, and 10 mL/ min. (b) 129Xe TOF recovery curves were measured using the TOF imaging approach. A difference in flow rate of 1 mL/min created well-detected differences in the TOF curves. A quasilinear region was observed between 200 ms and 700 ms. A nonlinear recovery appeared for longer recovery times, followed by a steady state. (c) Pearson’s linear correlation between the flow rate and the slopes of the TOF curves was calculated at the quasilinear region. A strong positive correlation (r ≈ 0.988) was observed, indicating the potential to use this slope for flow mapping.
Diagnostics 10 00630 g002
Figure 3. Example of perfusion map acquisition. (a,f) High-resolution, T2-weighted 1H scans for brain localization. (bd) Three dynamic HP 129Xe TOF images acquired 2.5 s, 6.8 s, and 7.1 s after the application of a depolarization radiofrequency pulse in the axial projection. The image artifact in the top left corner in b is from excess gaseous 129Xe at the end of the inhalation tube connected to the TedLar bag. The gradual signal-to-noise ratio increase can be observed with increasing wash-in time. The slope map was created by a pixel-by-pixel linear fit of the 129Xe brain images. (e) The perfusion map (measured in mL of blood per mL of tissue per min) created by the pixel-by-pixel recalculation of the TOF slope was used to calculate the sum of the perfusion rates of gray and white matter superimposed on top of a high-resolution proton brain image. The calculated values of perfusion agreed with previously observed values [41,46]. (gi) Three dynamic TOF images acquired after 1s, 6.5 s, and 8 s TOF in the sagittal view. (j) Perfusion map in the sagittal view. Similar to e, the intensity values were the net sum of the white and gray matter perfusion rates.
Diagnostics 10 00630 g003
Figure 4. Detection of a hemodynamic response from a colorful visual stimulus using HP 129Xe perfusion mapping validated by blood oxygenation level-dependent (BOLD) functional brain MRI (fMRI). (a) Experimental design used for hemodynamic response detection. Two separate perfusion maps were acquired during the control (gray screen) and visual stimulation. (b) Hemodynamic response map created by subtracting the control perfusion map from the stimulated perfusion map and overlaid on top of a high-resolution proton scan. Activation of the occipital lobe, superior parietal lobe, and frontal gyrus was observed. (c) BOLD fMRI experimental design for validation of the HP 129Xe technique. (d) BOLD fMRI 3D activation maps demonstrate a correlation with a 129Xe hemodynamic response map. The activated areas are indicated by colored arrows. The matched activated areas on the Xe image are indicated with arrows of the corresponding color.
Diagnostics 10 00630 g004
Figure 5. Detection of the hemodynamic response to a motor stimulus using HP 129Xe perfusion mapping corroborated by blood oxygenation level-dependent (BOLD) functional brain MRI (fMRI). (a) Experimental design used for hemodynamic response detection. Two separate perfusion maps were acquired during the control (calm rest) and motor stimulation (left fist clenching) stages. (b) Hemodynamic response map created by subtracting the control perfusion map from the stimulated perfusion map and overlaid on top of the high-resolution proton scan. Activation of the right posterior precentral gyrus (i.e., the motor cortex) was observed. (c) BOLD fMRI experimental design for validation of the HP 129Xe technique. (d) BOLD fMRI 3D activation maps. Activation was observed from the motor cortex (green arrow); this result correlated with the HP 129Xe hemodynamic response map.
Diagnostics 10 00630 g005

