Prognostic Impact of Parameters of Metabolic Acidosis in Critically Ill Children with Acute Kidney Injury: A Retrospective Observational Analysis Using the PIC Database

 , , ,
, , ,
Abstract
1. Introduction
2. Materials and Methods
2.1. Source of Data
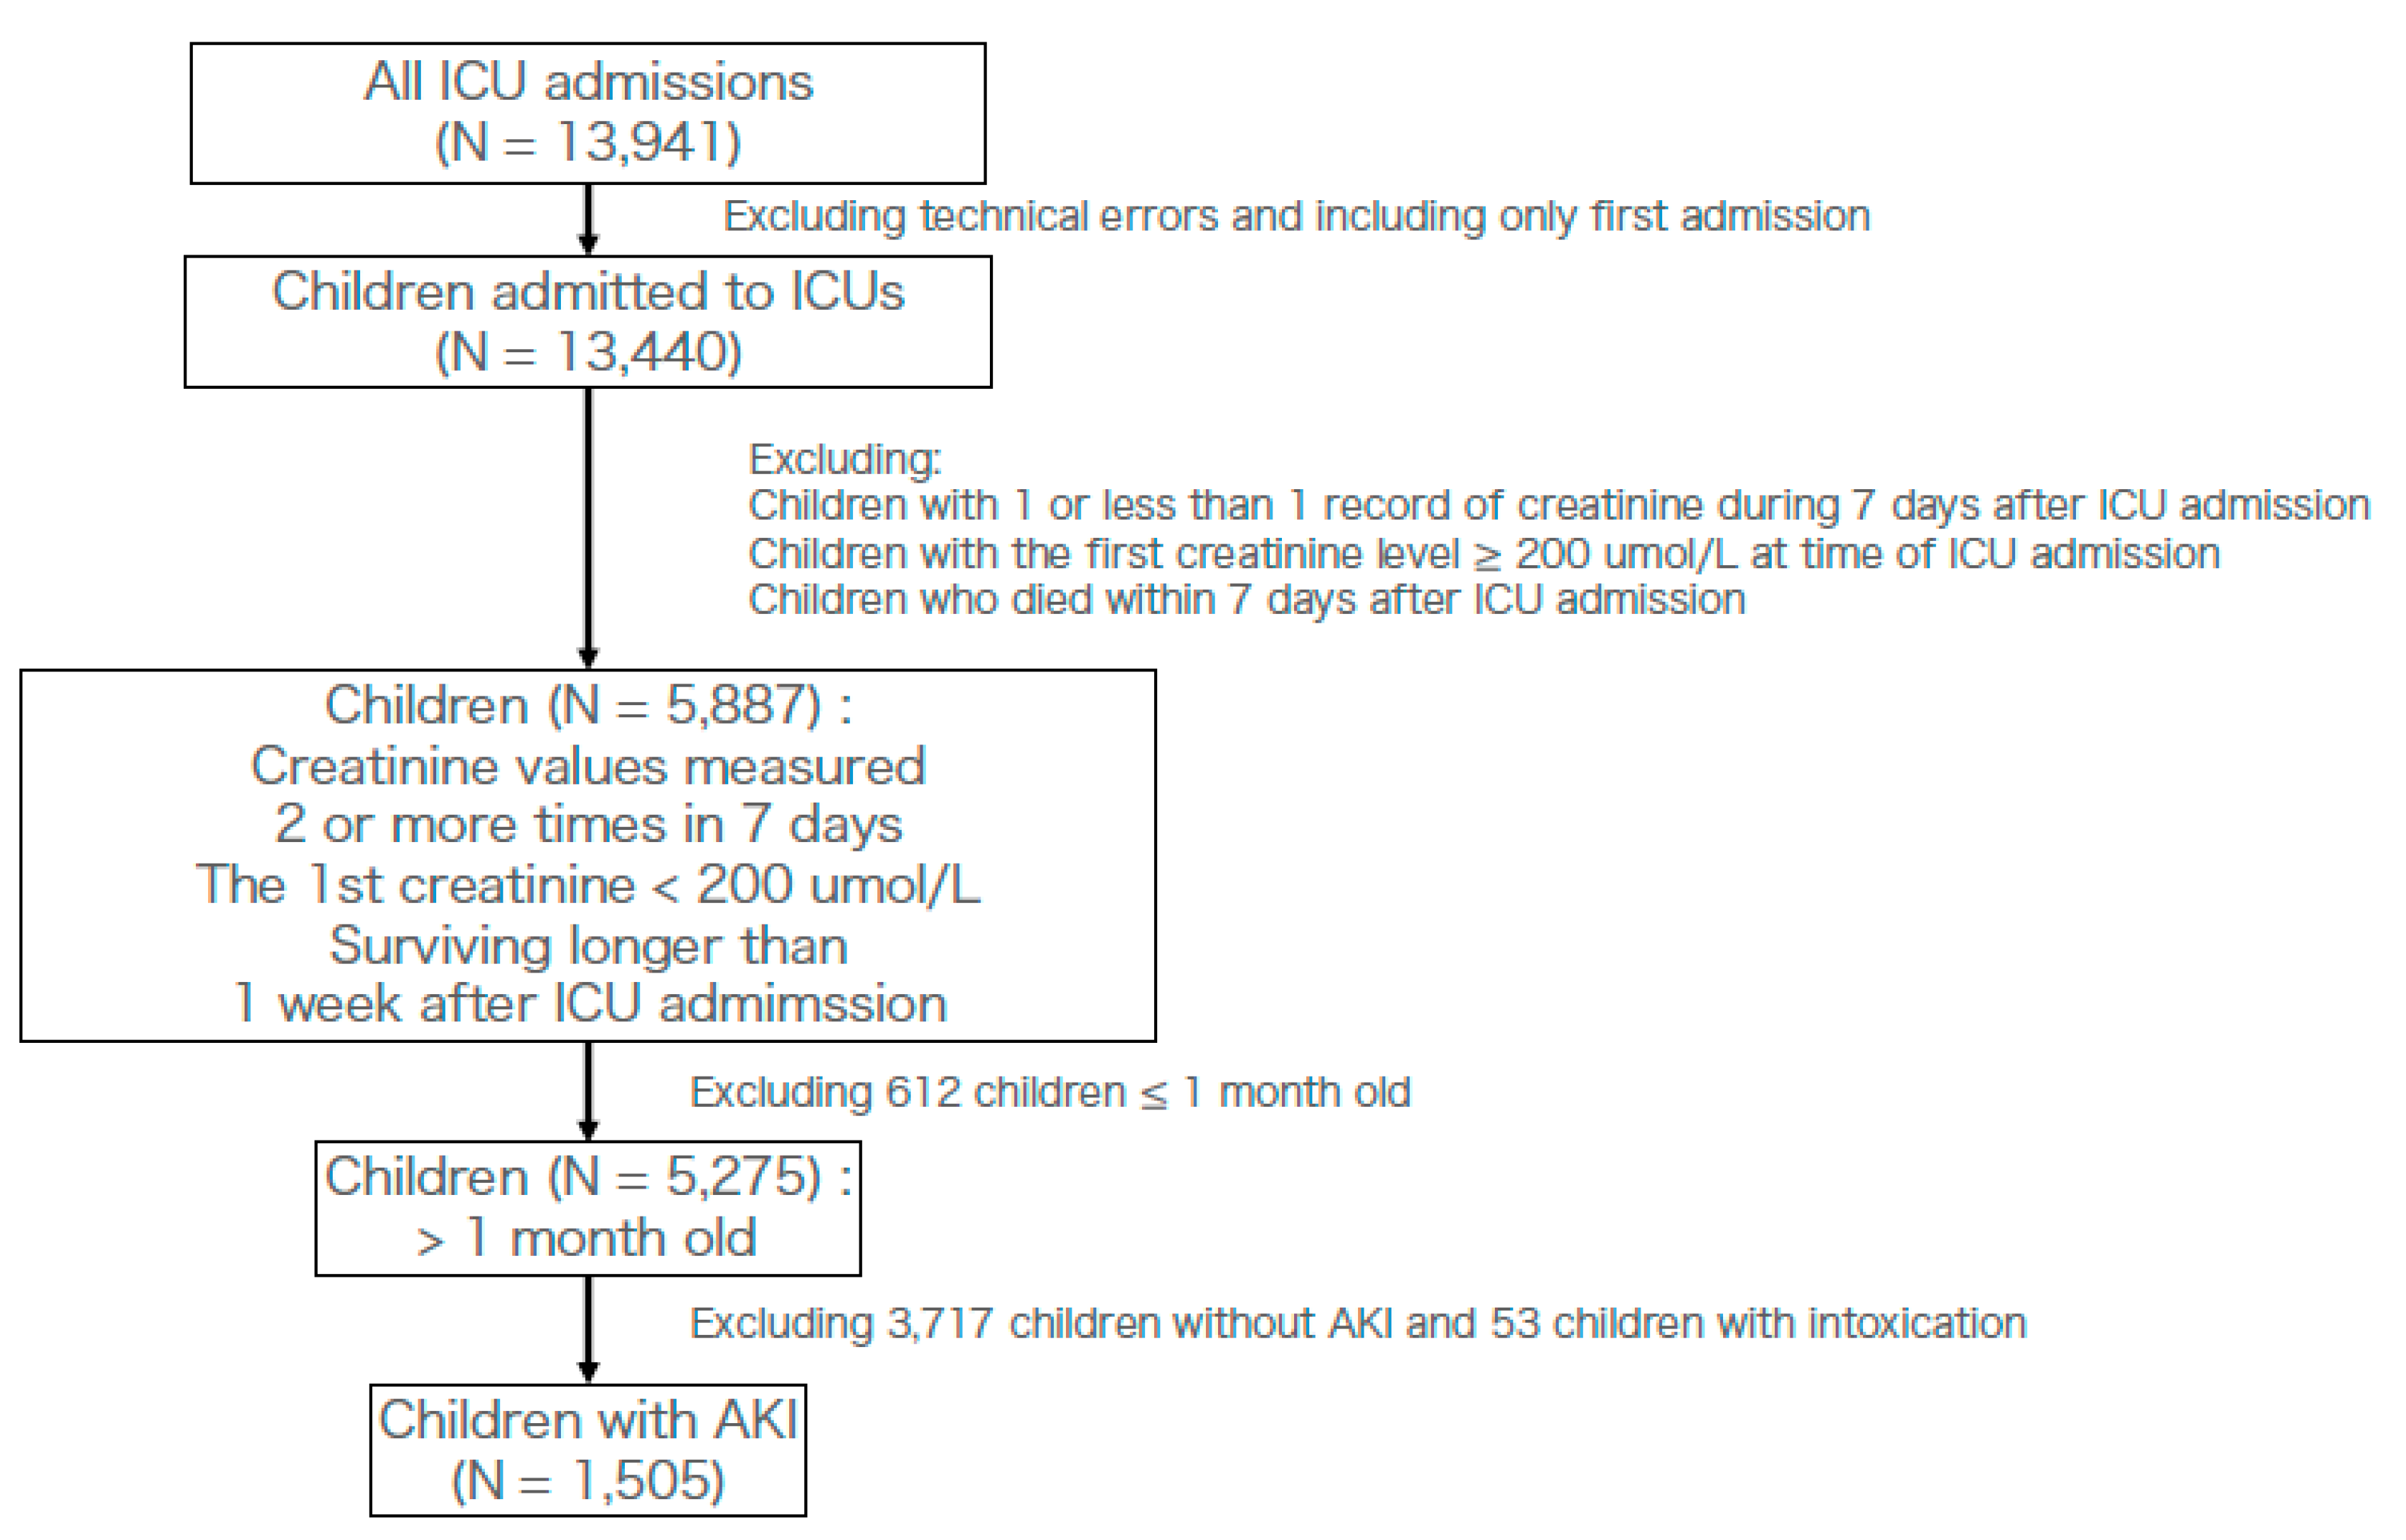
2.2. Participants
2.3. Diagnosis of AKI
2.4. Defining a Cohort with Infection at the Time of ICU Admission
2.5. Laboratory Data
2.6. Cutoff Values
2.7. Outcome
2.8. Statistics
3. Results
3.1. Baseline Characteristics
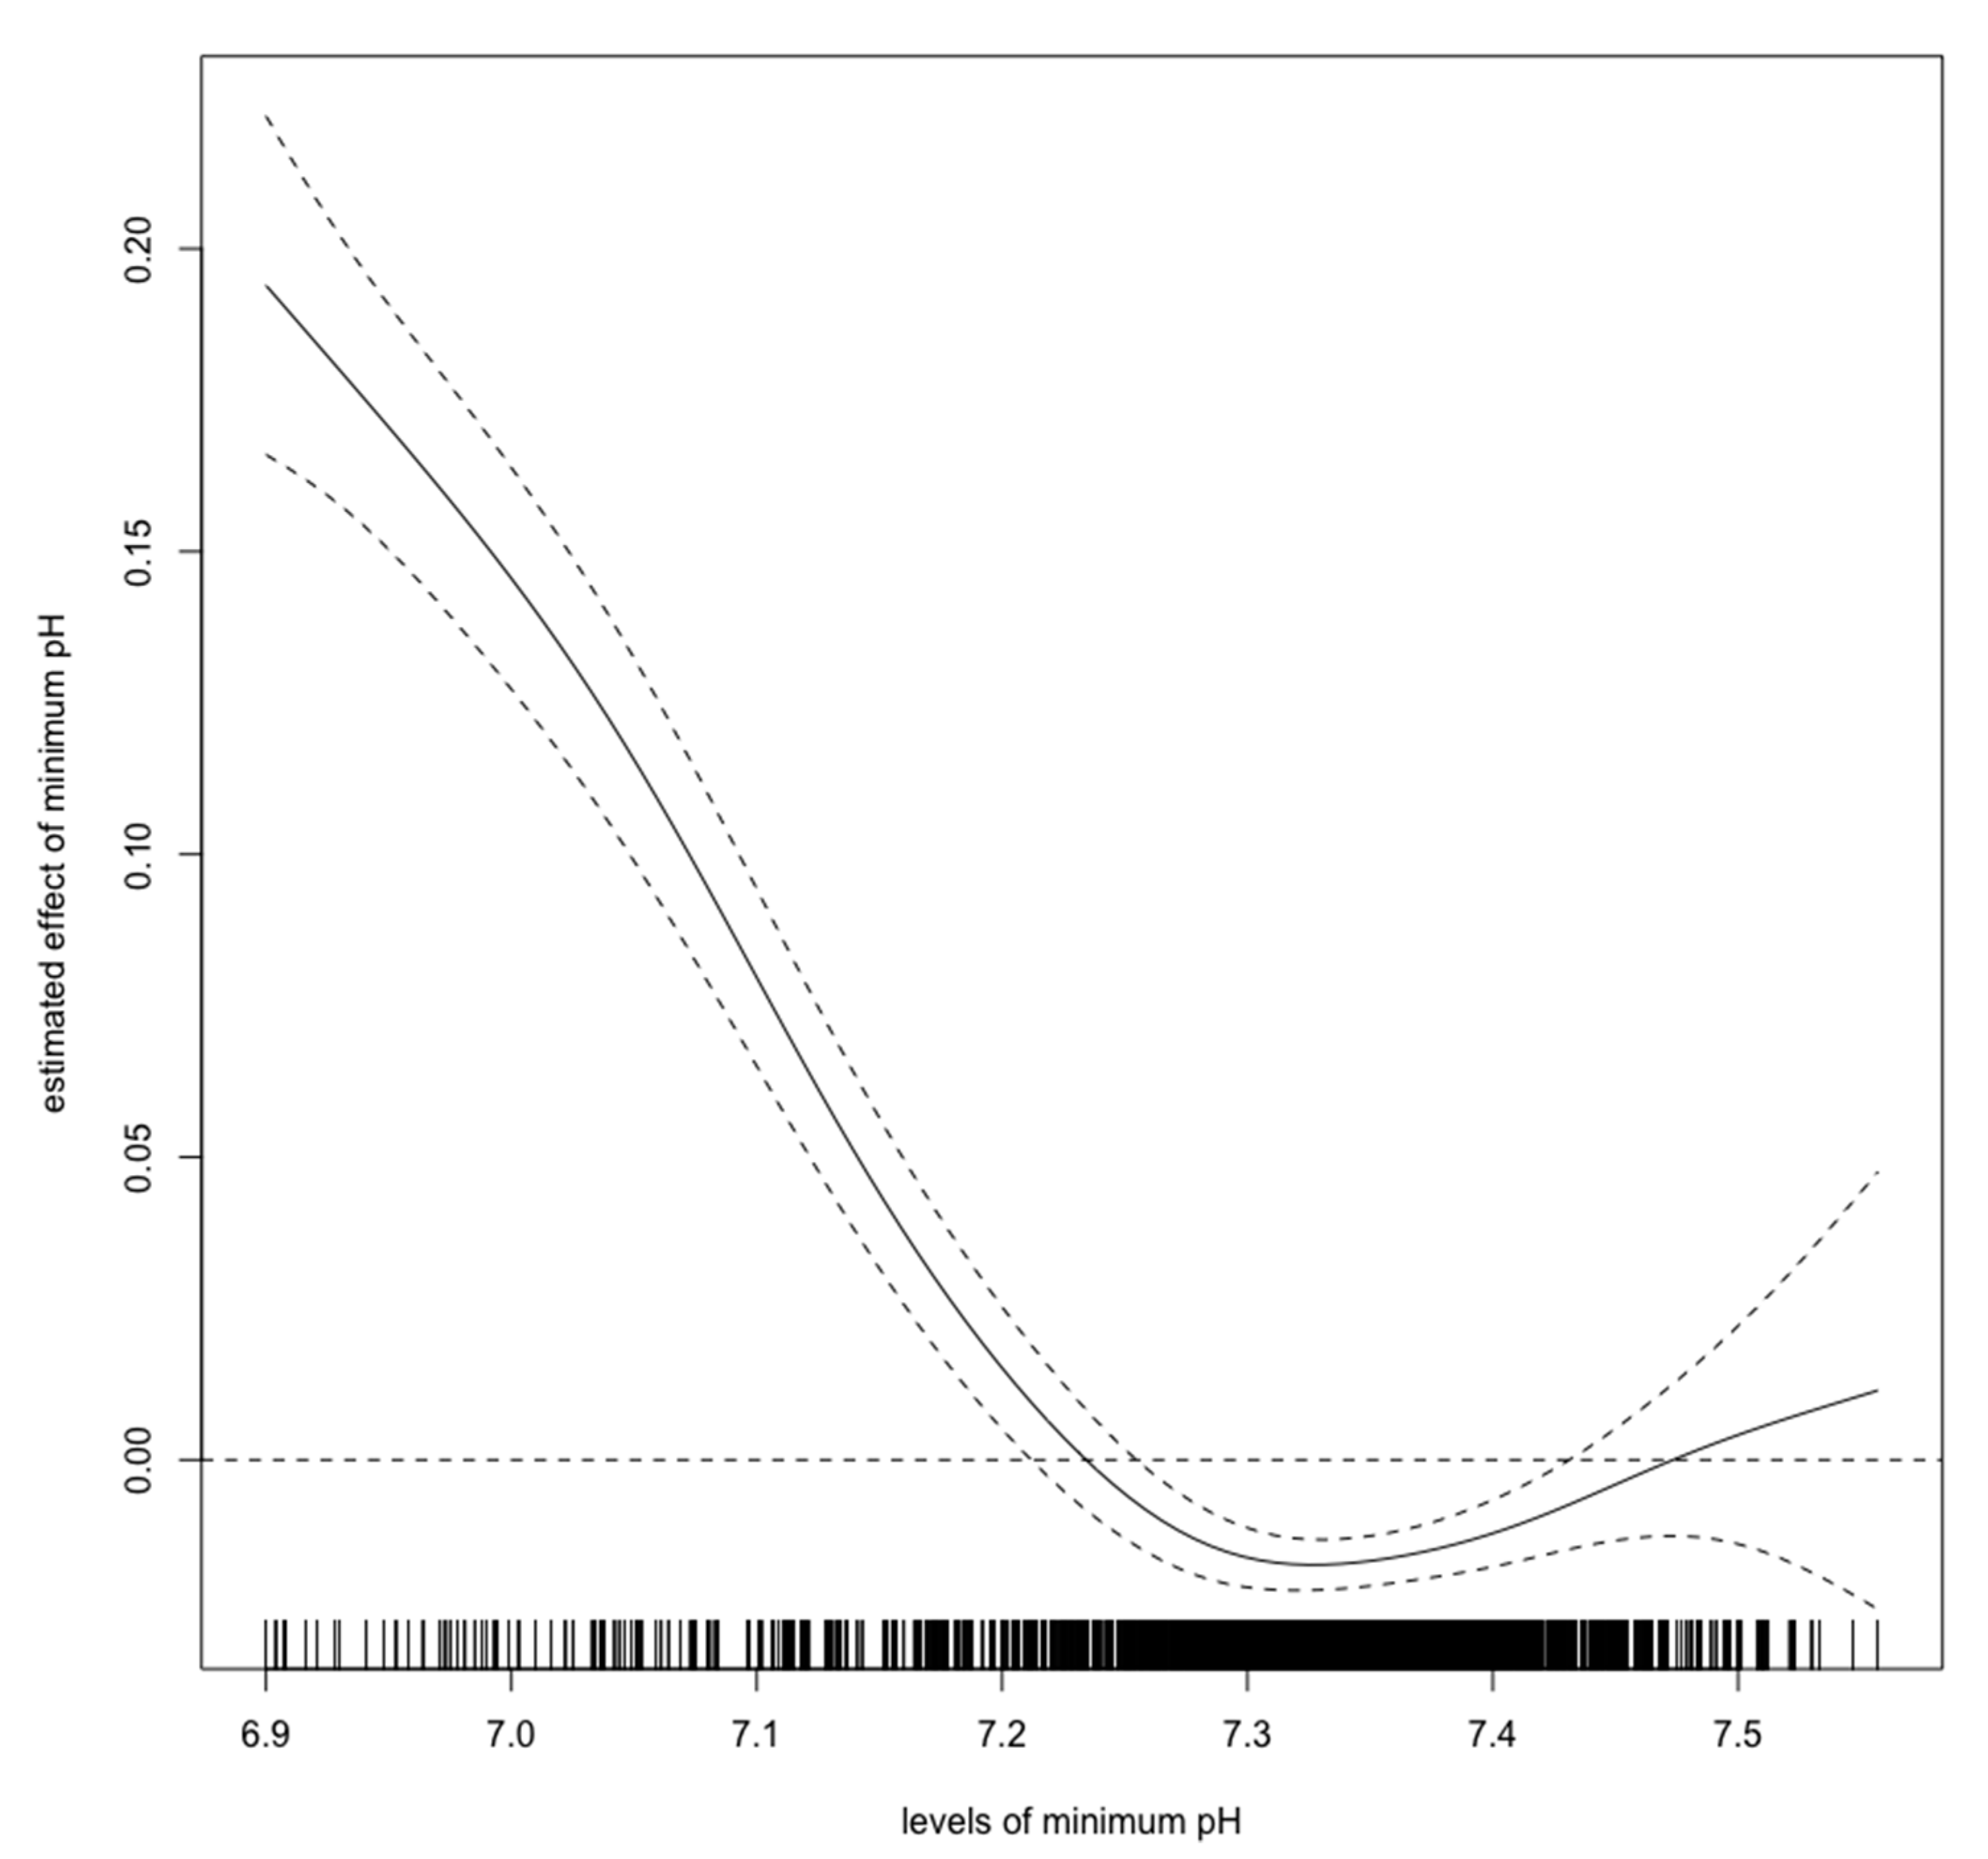
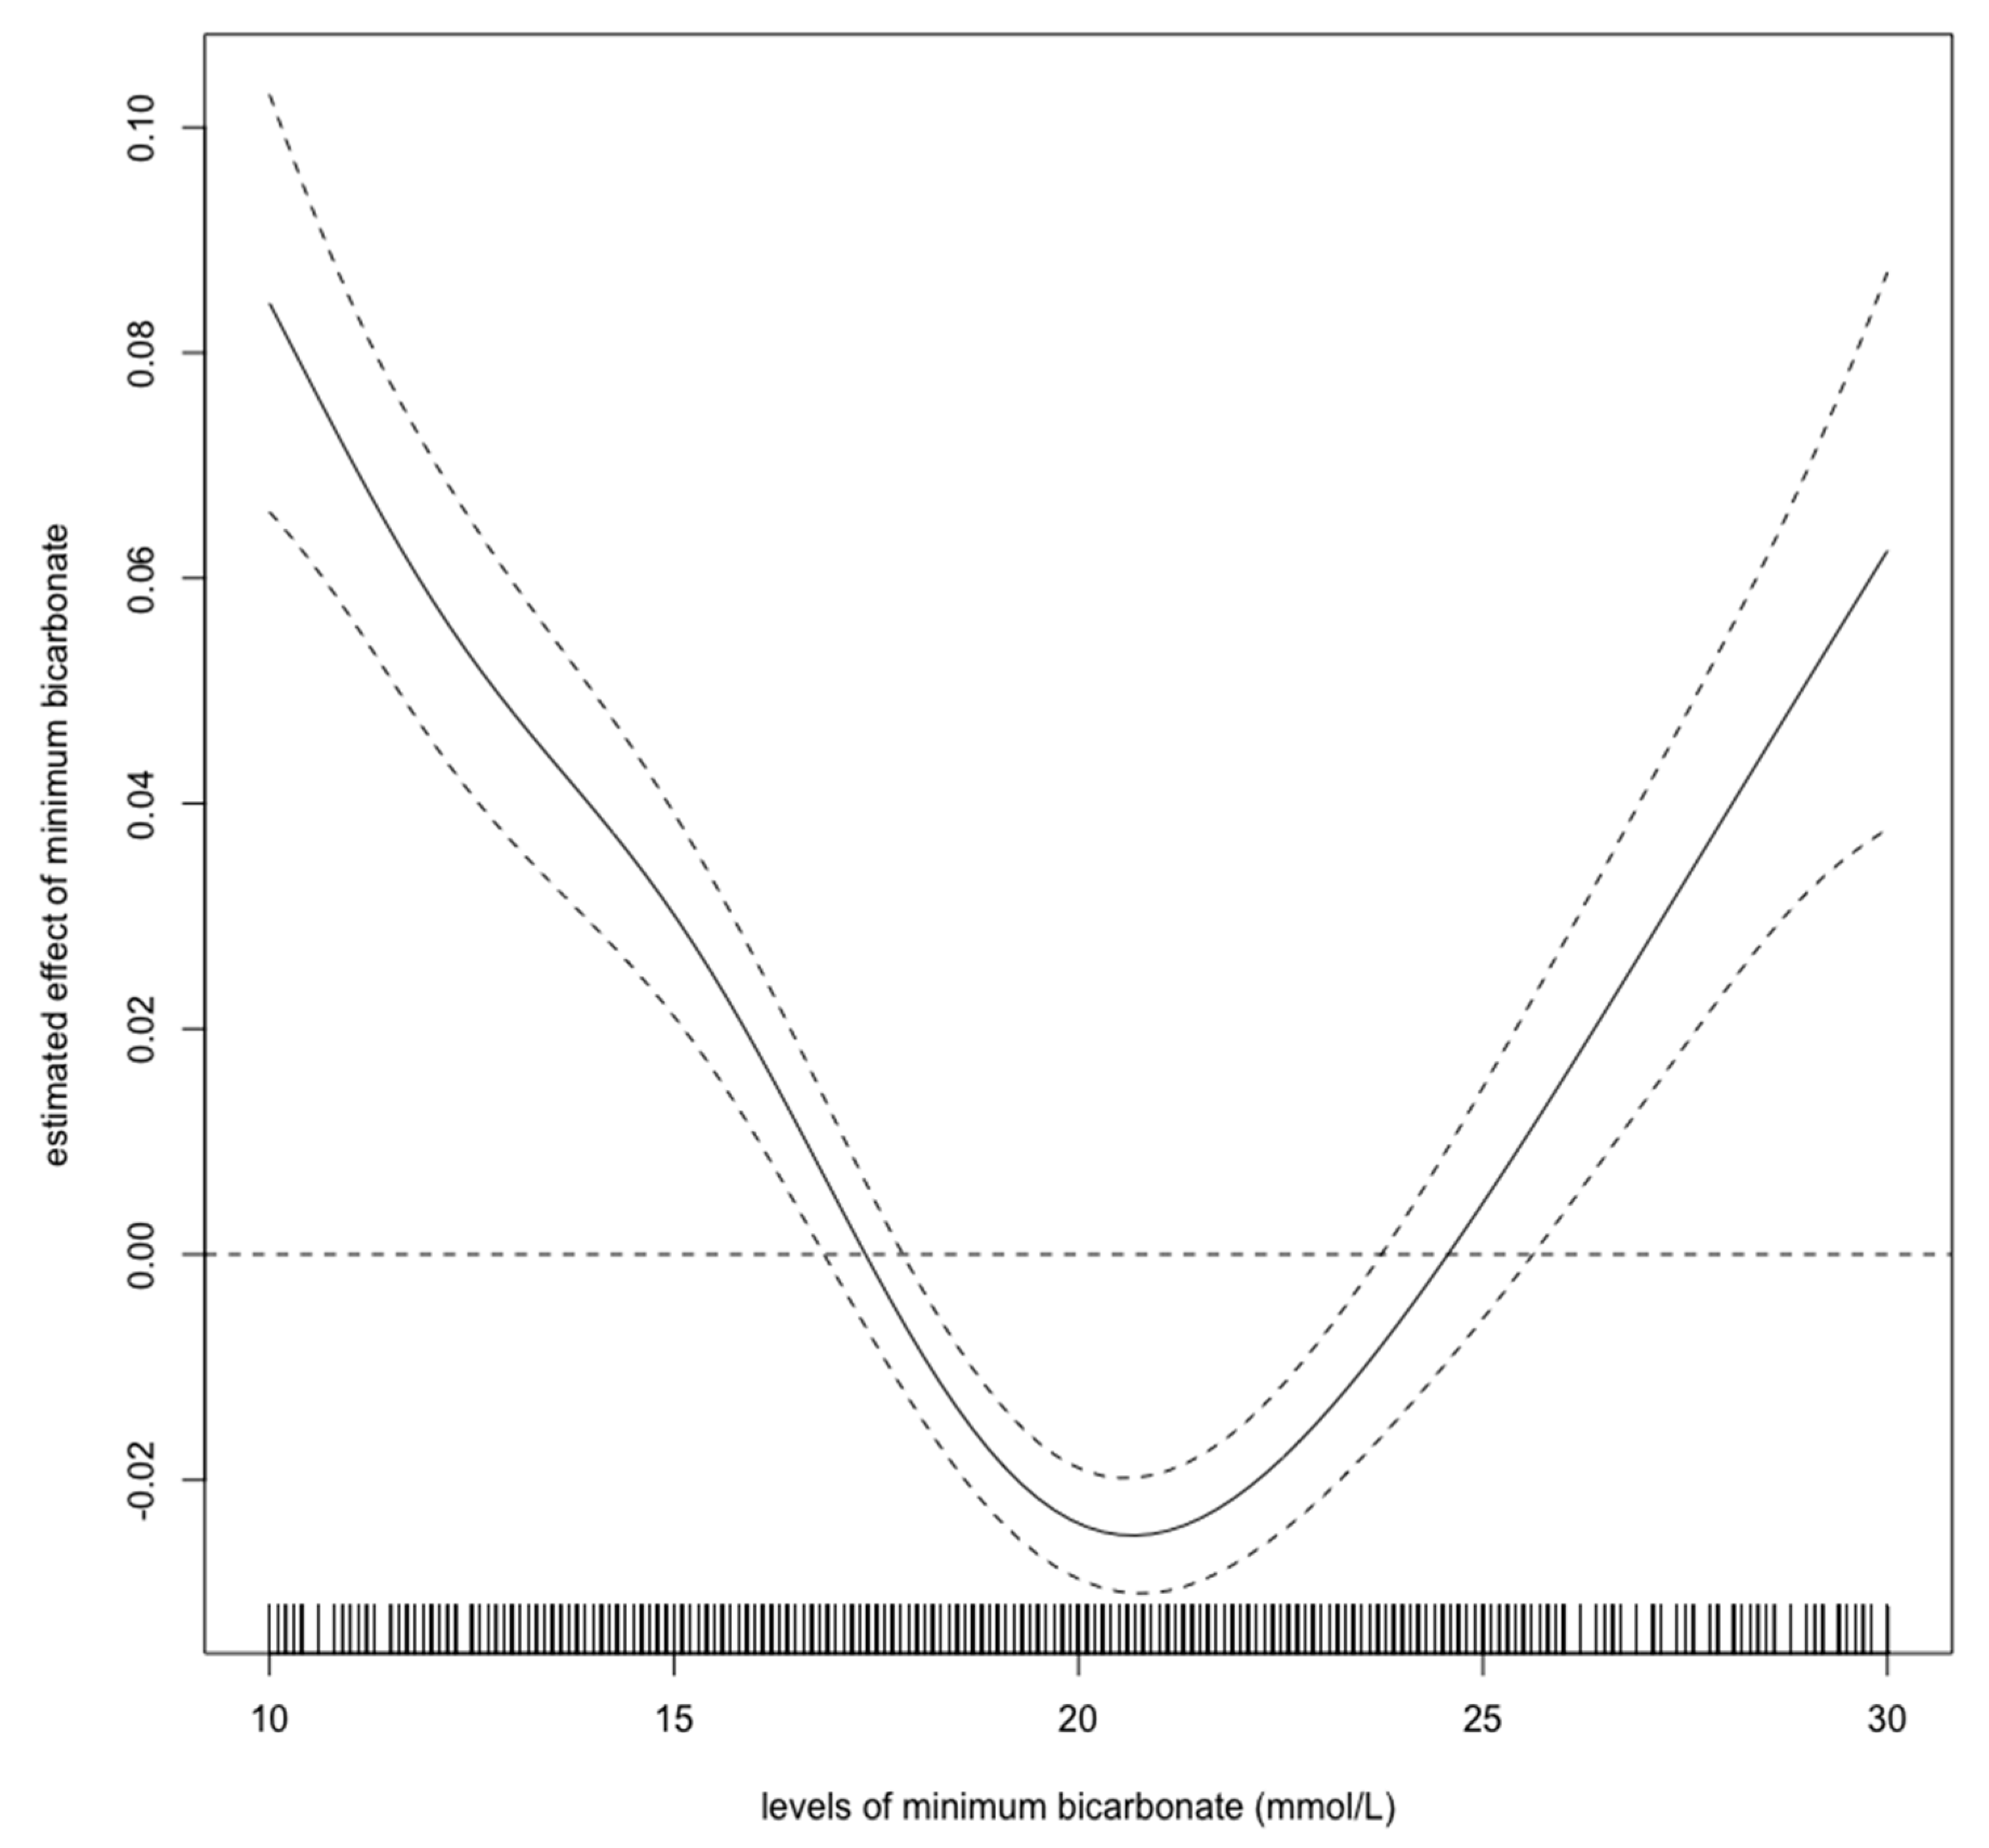
3.2. Cut-Off Values
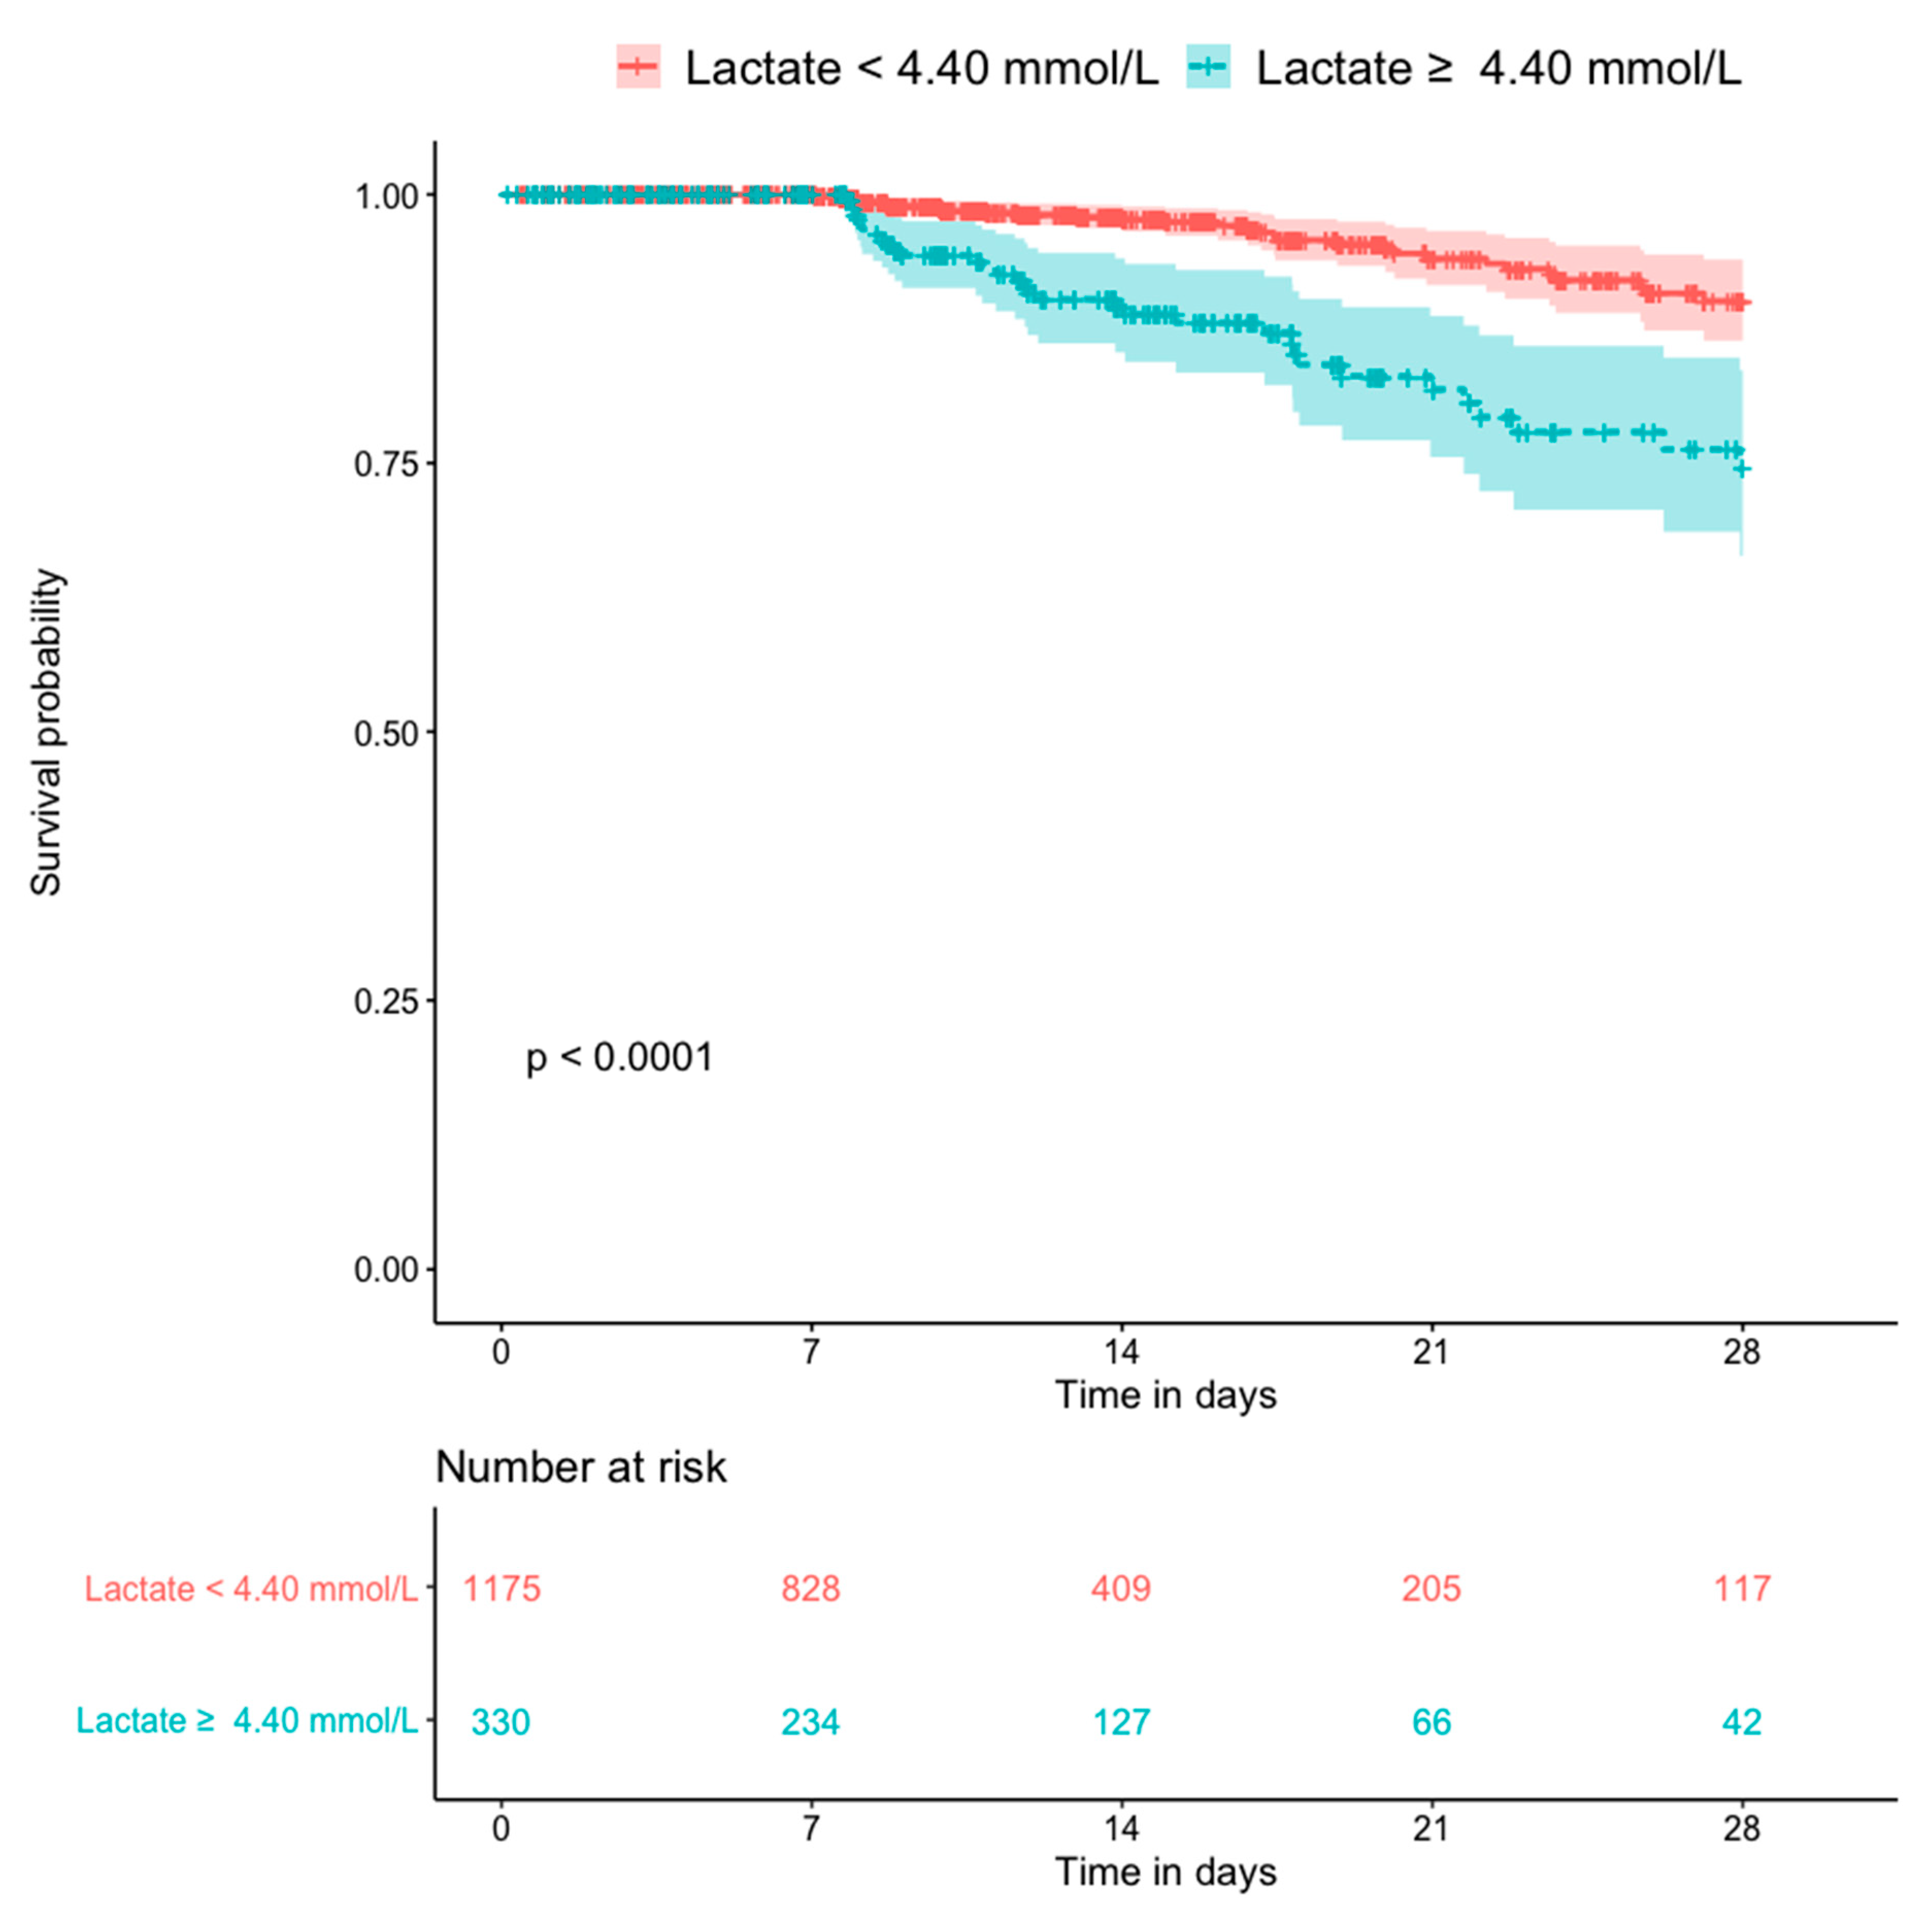
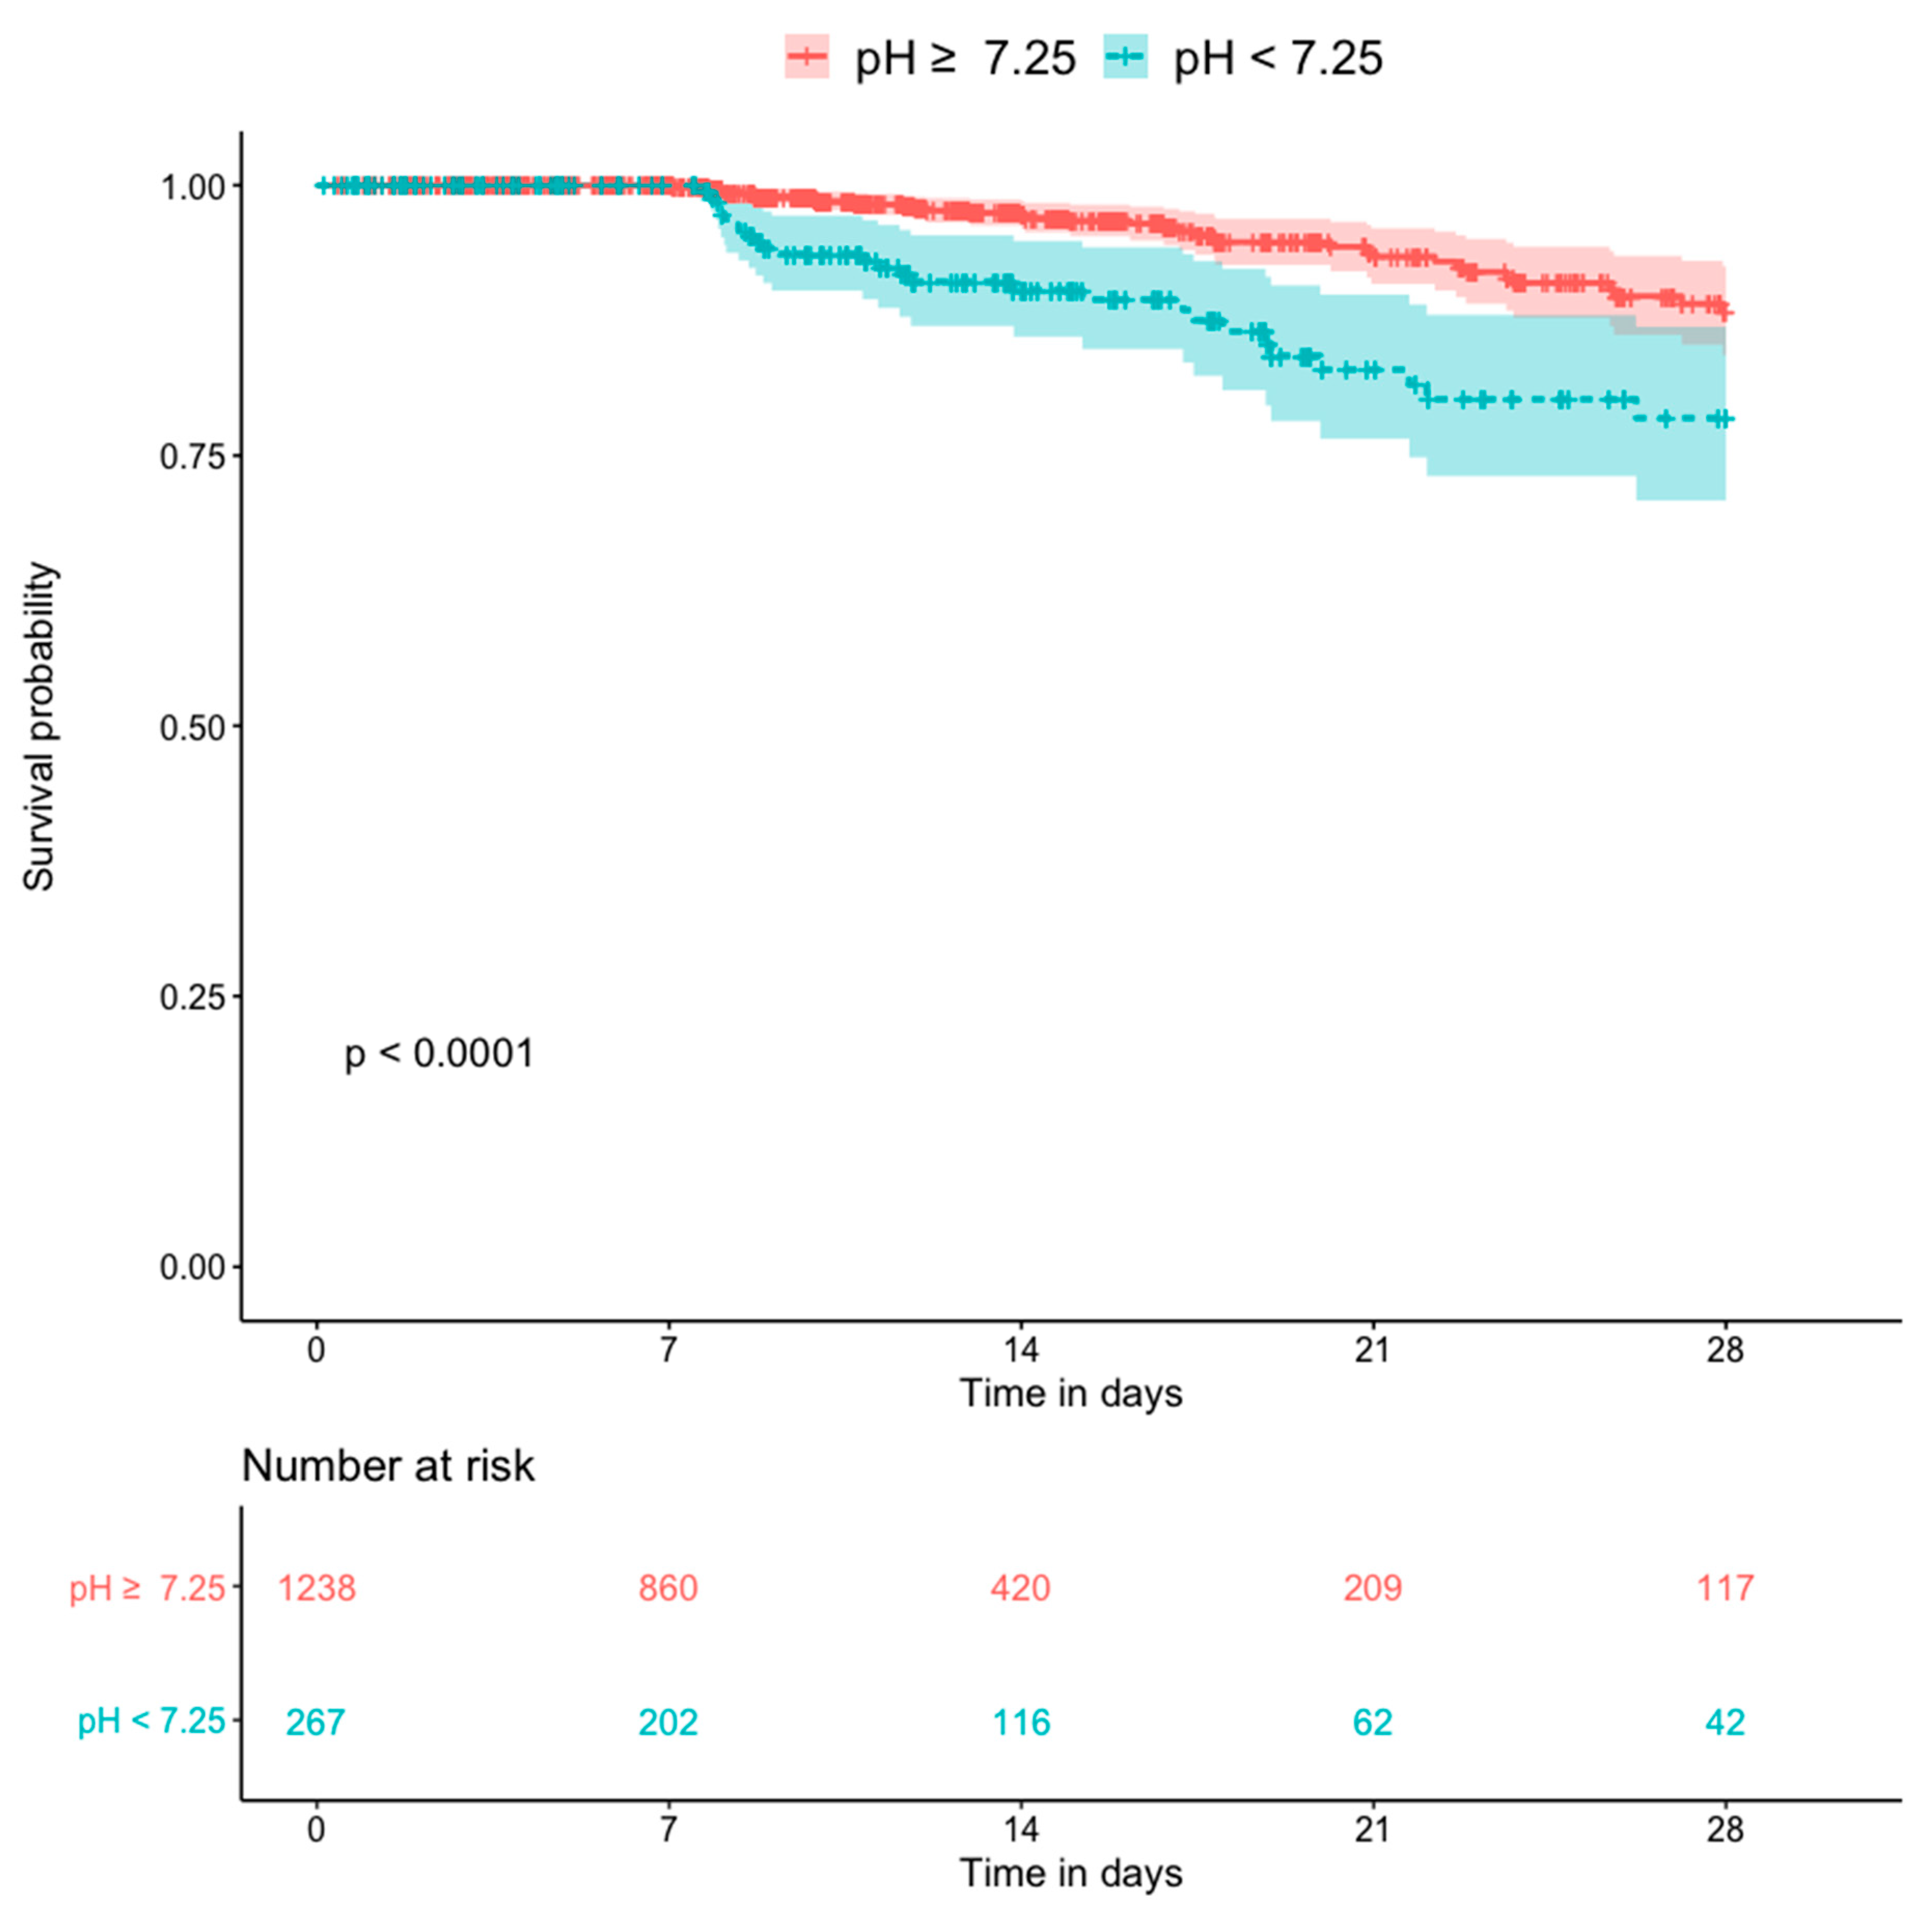
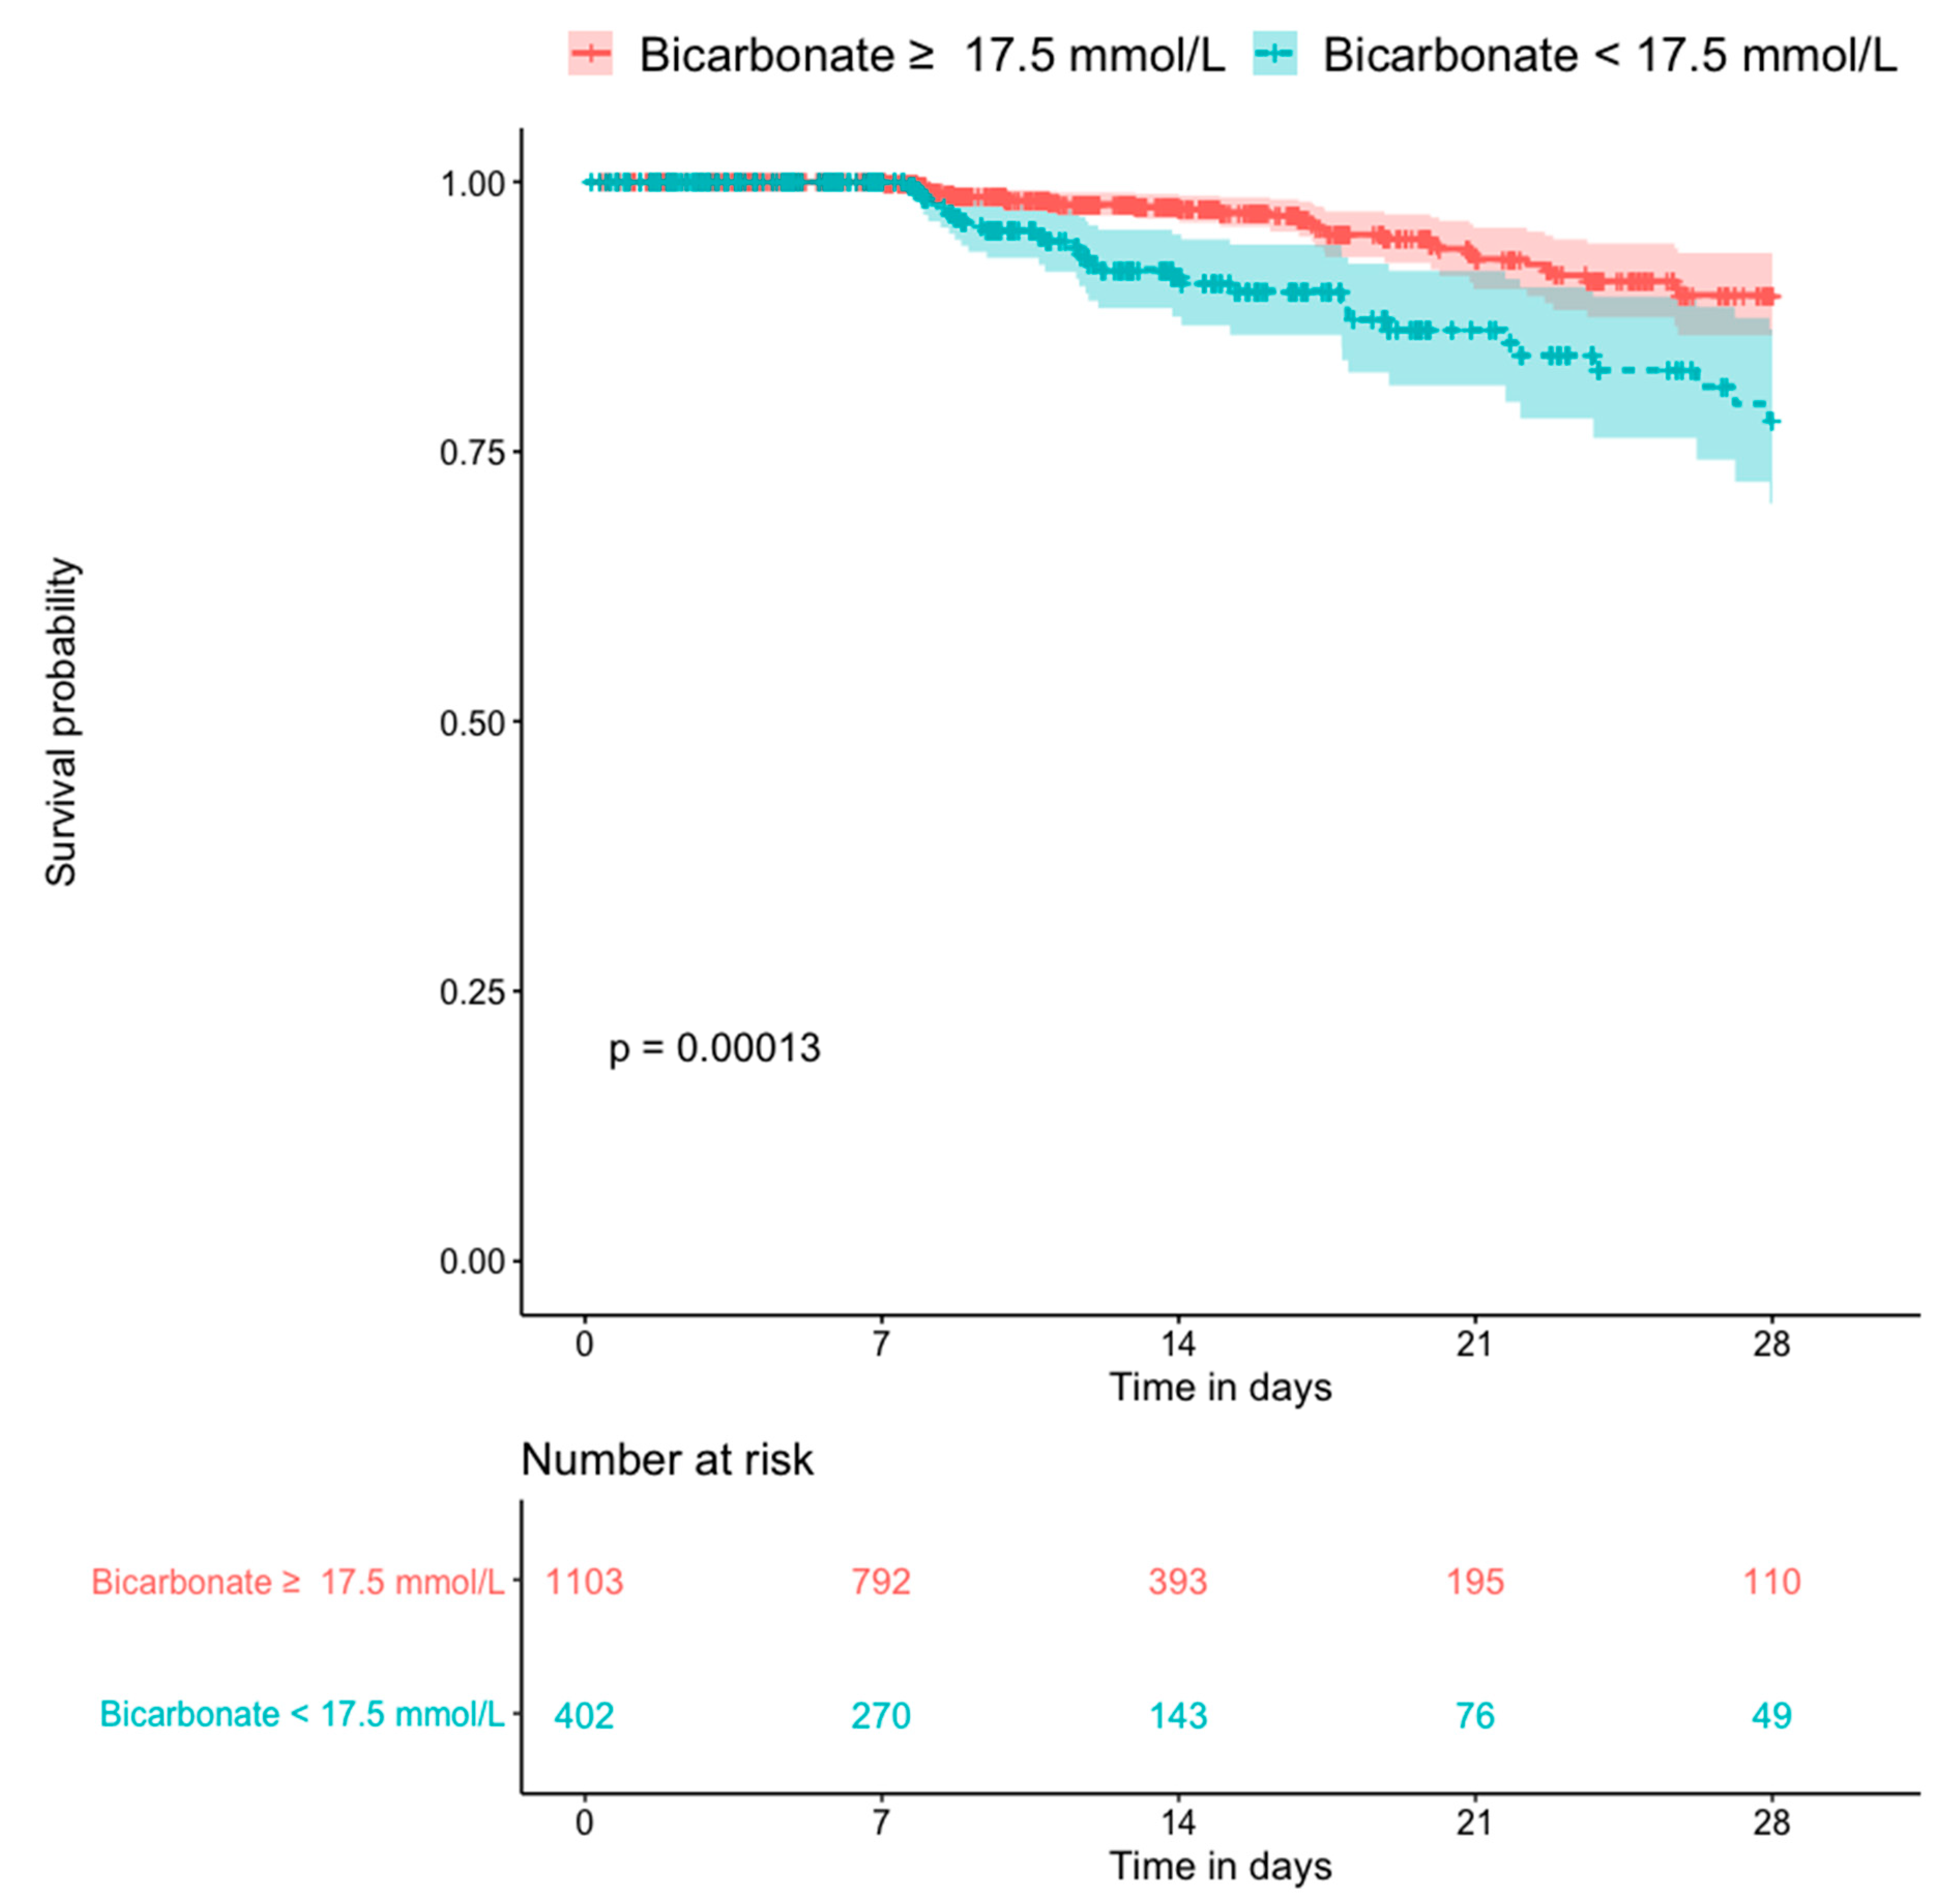
3.3. Mortality
3.4. Logistic Regression
4. Discussion
5. Conclusions
6. Ethics Approval and Consent to Participate
Supplementary Materials
Author Contributions
Funding
Conflicts of Interest
References
- Kaddourah, A.; Basu, R.K.; Bagshaw, S.M.; Goldstein, S.L. Epidemiology of acute kidney injury in critically ill children and young adults. N. Engl. J. Med. 2017, 376, 11–20. [Google Scholar] [CrossRef] [PubMed]
- Susantitaphong, P.; Cruz, D.N.; Cerda, J.; Abulfaraj, M.; Alqahtani, F.; Koulouridis, I.; Jaber, B.L. Acute Kidney Injury Advisory Group of the American Society of Nephrology. World incidence of AKI: A meta-analysis. Clin. J. Am. Soc. Nephrol. 2013, 8, 1482–1493. [Google Scholar] [CrossRef] [PubMed]
- McGregor, T.L.; Jones, D.P.; Wang, L.; Danciu, I.; Bridges, B.C.; Fleming, G.M.; Shirey-Rice, J.; Chen, L.; Byrne, D.W.; Van Driest, S.L. Acute kidney injury incidence in noncritically ill hospitalized children, adolescents, and young adults: A retrospective observational study. Am. J. Kidney Dis. 2016, 67, 384–390. [Google Scholar] [CrossRef] [PubMed]
- Volpon, L.C.; Sugo, E.K.; Consulin, J.C.; Tavares, T.L.; Aragon, D.C.; Carlotti, A.P. Epidemiology and outcome of acute kidney injury according to pediatric risk, injury, failure, loss, end-stage renal disease and kidney disease: Improving global outcomes criteria in critically ill children-a prospective study. Pediatr. Crit. Care Med. 2016, 17, e229–e238. [Google Scholar] [CrossRef] [PubMed]
- Xu, X.; Nie, S.; Zhang, A.; Jianhua, M.; Liu, H.; Xia, H.; Xu, H.; Liu, Z.; Feng, S.; Zhou, W.; et al. A new criterion for pediatric AKI based on the reference change value of serum creatinine. J. Am. Soc. Nephrol. 2018, 29, 2432–2442. [Google Scholar] [CrossRef] [PubMed]
- Selewski, D.T.; Cornell, T.T.; Heung, M.; Troost, J.P.; Ehrmann, B.J.; Lombel, R.M.; Blatt, N.B.; Luckritz, K.; Hieber, S.; Gajarski, R.; et al. Validation of the KDIGO acute kidney injury criteria in a pediatric critical care population. Intensive Care Med. 2014, 40, 1481–1488. [Google Scholar] [CrossRef] [PubMed]
- Zappitelli, M.; Parikh, C.R.; Akcan-Arikan, A.; Washburn, K.K.; Moffett, B.S.; Goldstein, S.L. Ascertainment and epidemiology of acute kidney injury varies with definition interpretation. Clin. J. Am. Soc. Nephrol. 2008, 3, 948–954. [Google Scholar] [CrossRef]
- Akcan-Arikan, A.; Zappitelli, M.; Loftis, L.L.; Washburn, K.K.; Jefferson, L.S.; Goldstein, S.L. Modified RIFLE criteria in critically ill children with acute kidney injury. Kidney Int. 2007, 71, 1028–1035. [Google Scholar] [CrossRef]
- Khwaja, A. KDIGO clinical practice guidelines for acute kidney injury. Nephron Clin. Pract. 2012, 120, c179–c184. [Google Scholar] [CrossRef]
- Hsu, Y.C.; Hsu, C.W. Septic acute kidney injury patients in emergency department: The risk factors and its correlation to serum lactate. Am. J. Emerg Med. 2019, 37, 204–208. [Google Scholar] [CrossRef]
- Bagshaw, S.M.; Uchino, S.; Bellomo, R.; Morimatsu, H.; Morgera, S.; Schetz, M.; Tan, I.; Bouman, C.; Macedo, E.; Gibney, N.; et al. Timing of renal replacement therapy and clinical outcomes in critically ill patients with severe acute kidney injury. J. Crit. Care 2009, 24, 129–140. [Google Scholar] [CrossRef] [PubMed]
- Singer, M.; Deutschman, C.S.; Seymour, C.W.; Shankar-Hari, M.; Annane, D.; Bauer, M.; Bellomo, R.; Bernard, G.R.; Chiche, J.D.; Coopersmith, C.M.; et al. The Third International Consensus Definitions for Sepsis and Septic Shock (Sepsis-3). JAMA 2016, 315, 801–810. [Google Scholar] [CrossRef] [PubMed]
- Andersen, L.W.; Mackenhauer, J.; Roberts, J.C.; Berg, K.M.; Cocchi, M.N.; Donnino, M.W. Etiology and therapeutic approach to elevated lactate levels. Mayo Clin. Proc. 2013, 88, 1127–1140. [Google Scholar] [CrossRef] [PubMed]
- Duzova, A.; Bakkaloglu, A.; Kalyoncu, M.; Poyrazoglu, H.; Delibas, A.; Ozkaya, O.; Peru, H.; Alpay, H.; Soylemezoglu, O.; Gur-Guven, A.; et al. Etiology and outcome of acute kidney injury in children. Pediatr. Nephrol. 2010, 25, 1453–1461. [Google Scholar] [CrossRef]
- Bai, Z.; Zhu, X.; Li, M.; Hua, J.; Li, Y.; Pan, J.; Wang, J.; Li, Y. Effectiveness of predicting in-hospital mortality in critically ill children by assessing blood lactate levels at admission. BMC Pediatr. 2014, 14, 83. [Google Scholar] [CrossRef]
- Magalhães, P.A.; de Brito, T.S.; Freire, R.S.; da Silva, M.T.B.; dos Santos, A.A.; Vale, M.L.; de Menezes, D.B.; Martins, A.M.C.; Liborio, A.B. Metabolic acidosis aggravates experimental acute kidney injury. Life Sci. 2016, 146, 58–65. [Google Scholar] [CrossRef]
- Zeng, X.; Yu, G.; Lu, Y.; Tan, L.; Wu, X.; Shi, S.; Duan, H.; Shu, Q.; Li, H. PIC, a paediatric-specific intensive care database. Sci. Data 2020, 7, 14. [Google Scholar] [CrossRef]
- Zivetz, L. The ICD-10 Classification of Mental and Behavioural Disorders: Clinical Descriptions and Diagnostic Guidelines; World Health Organization: Geneva, Switzerland, 1992. [Google Scholar]
- Zhang, Z. Multiple imputation with multivariate imputation by chained equation (MICE) package. Ann. Transl. Med. 2016, 4, 30. [Google Scholar] [CrossRef]
- van Buuren, S.; Groothuis-Oudshoorn, K. Mice: Multivariate imputation by chained equations in R. J. Stat. Softw. 2011, 45, 1–67. [Google Scholar] [CrossRef]
- Wood, S.N. Just another Gibbs addictive modeler: Interfacing JAGS and mgcv. J. Stat. Softw. 2016, 75, 1–15. [Google Scholar] [CrossRef]
- Tanemoto, M. Calculated bicarbonate for acid-base disorders. Am. J. Med. 2017, 130, 1135–1136. [Google Scholar] [CrossRef] [PubMed][Green Version]
- Nagata, I.; Uchino, S.; Tokuhira, N.; Ohnuma, T.; Namba, Y.; Katayama, S.; Kawarazaki, H.; Toki, N.; Takeda, K.; Yasuda, H.; et al. Sepsis may not be a risk factor for mortality in patients with acute kidney injury treated with continuous renal replacement therapy. J. Crit. Care 2015, 30, 998–1002. [Google Scholar] [CrossRef] [PubMed]
- Po, H.N.; Senozan, N.M. The Henderson-Hasselbalch equation: Its history and limitations. J. Chem. Educ. 2001, 78, 1499–1503. [Google Scholar] [CrossRef]
- Rocktaeschel, J.; Morimatsu, H.; Uchino, S.; Goldsmith, D.; Poutsie, S.; Story, D.; Gutteridge, G.; Bellomo, R. Acid-base status of critically ill patients with acute renal failure: Analysis based on Stewart-Figge methodology. Crit Care 2003, 7, R60. [Google Scholar] [CrossRef] [PubMed]
- Edemekong, P.F.; Annamaraju, P.; Haydel, M.J. Health Insurance Portability and Accountability Act, (HIPAA). StatPearls. 2020. Available online: https://www.ncbi.nlm.nih.gov/books/NBK500019/ (accessed on 11 October 2020).


| Male, n (%) | 827 (55.0) |
| Age, month, median (IQR) | 22 (7–65) |
| AKI severity a, n (%) | |
| Stage 1 | 1186 (78.8) |
| Stage 2 | 172 (911.4) |
| Stage 3 | 147 (9.8) |
| Primary diagnosis on ICU admission b, n (%) | |
| Hematological | 60 (4.0) |
| Circulation | 146 (9.7) |
| Congenital | 450 (29.9) |
| Digestive | 77 (5.1) |
| Endocrinology | 39 (2.6) |
| Genitourinary | 27 (1.8) |
| Infectious | 10 (0.7) |
| Musculoskeletal | 13 (0.9) |
| Neoplasm | 15 (1.0) |
| Respiratory | 173 (11.5) |
| Others | 495 (32.9) |
| Infectious etiology of AKI, n (%) | 413 (27.4) |
| Laboratory data c | |
| Albumin, g/L, median (IQR) | 38.10 (33.40–42.00) |
| Alanine transaminase, U/L, median (IQR) | 33.00 (23.00–58.00) |
| Aspartate transaminase, U/L, median (IQR) | 78.00 (41.00–150.00) |
| Total bilirubin, µmol/L, median (IQR) | 12.20 (7.20–24.90) |
| Potassium, mmol/L, median (IQR) | 3.30 (2.90–3.60) |
| Chloride, mmol/L, median (IQR) | 112.00 (108.00–116.00) |
| Sodium, mmol/L, median (IQR) | 136.00 (133.00–139.00) |
| Phosphate, mmol/L, median (IQR) | 1.61 (1.28–2.12) |
| Base Excess, mmol/L, median (IQR) | −4.80 (-7.60–-2.50) |
| Creatinine, μmol/L, median (IQR) | 51.00 (42.00–64.00) |
| Urea, mmol/L, median (IQR) | 4.34 (3.14–6.13) |
| White blood cell, ×109/L, median (IQR) | 12.66 (8.69–17.57) |
| Hemoglobin, g/L, median (IQR) | 101.00 (88.00–113.00) |
| Platelets, ×109/L, median (IQR) | 191.00 (109.00–282.00) |
| Prothrombin time, second, median (IQR) | 14.30 (12.60–17.10) |
| Partial pressure of oxygen, mmHg, median (IQR) | 83.50 (47.80–132.00) |
| Lactate, mmol/L, median (IQR) | 2.60 (1.70–4.00) |
| pH, median (IQR) | 7.33 (7.28–7.38) |
| Bicarbonate, mmol/L, median (IQR) | 19.70 (17.20–22.00) |
| Length of ICU stay, day, median (IQR) | 4.84 (1.87–11.15) |
| Length of hospital stay, day, median (IQR) | 10.87 (6.75–17.34) |
| 28-day mortality, n (%) | 65 (4.3) |
| Crude OR (95% CI) | Adjusted OR (95% CI) | p Value | |
|---|---|---|---|
| Lactate ≧ 4.40 mmol/L | 3.97 (2.40–6.56) | 3.06 (1.78–5.26) | <0.01 |
| pH < 7.25 | 3.55 (2.13–5.93) | 2.77 (1.60–4.81) | <0.01 |
| Bicarbonate < 17.5 mmol/L | 2.63 (1.59–4.34) | 2.09 (1.23–3.54) | <0.01 |
| OR (95% CI) | p Value | |
|---|---|---|
| Interactions between parameters and infection | ||
| Lactate × infection | 0.66 (0.23–1.88) | 0.44 |
| pH × infection | 0.54 (0.19–1.59) | 0.27 |
| Bicarbonate × infection | 0.50 (0.18–1.42) | 0.19 |
| Interactions between parameters and AKI severity | ||
| Lactate × pROCK | 1.07 (0.59–1.95) | 0.83 |
| pH × pROCK | 0.52 (0.28–0.96) | 0.04 |
| Bicarbonate × pROCK | 0.51 (0.29–0.91) | 0.02 |
Publisher’s Note: MDPI stays neutral with regard to jurisdictional claims in published maps and institutional affiliations. |
© 2020 by the authors. Licensee MDPI, Basel, Switzerland. This article is an open access article distributed under the terms and conditions of the Creative Commons Attribution (CC BY) license (http://creativecommons.org/licenses/by/4.0/).
Share and Cite
Morooka, H.; Kasugai, D.; Tanaka, A.; Ozaki, M.; Numaguchi, A.; Maruyama, S. Prognostic Impact of Parameters of Metabolic Acidosis in Critically Ill Children with Acute Kidney Injury: A Retrospective Observational Analysis Using the PIC Database. Diagnostics 2020, 10, 937. https://doi.org/10.3390/diagnostics10110937
Morooka H, Kasugai D, Tanaka A, Ozaki M, Numaguchi A, Maruyama S. Prognostic Impact of Parameters of Metabolic Acidosis in Critically Ill Children with Acute Kidney Injury: A Retrospective Observational Analysis Using the PIC Database. Diagnostics. 2020; 10(11):937. https://doi.org/10.3390/diagnostics10110937
Chicago/Turabian StyleMorooka, Hikaru, Daisuke Kasugai, Akihito Tanaka, Masayuki Ozaki, Atsushi Numaguchi, and Shoichi Maruyama. 2020. "Prognostic Impact of Parameters of Metabolic Acidosis in Critically Ill Children with Acute Kidney Injury: A Retrospective Observational Analysis Using the PIC Database" Diagnostics 10, no. 11: 937. https://doi.org/10.3390/diagnostics10110937
APA StyleMorooka, H., Kasugai, D., Tanaka, A., Ozaki, M., Numaguchi, A., & Maruyama, S. (2020). Prognostic Impact of Parameters of Metabolic Acidosis in Critically Ill Children with Acute Kidney Injury: A Retrospective Observational Analysis Using the PIC Database. Diagnostics, 10(11), 937. https://doi.org/10.3390/diagnostics10110937