3.1. Influence of Mg2+ Concentration on Ligase Ribozyme Activity
We first examined the influence of Mg
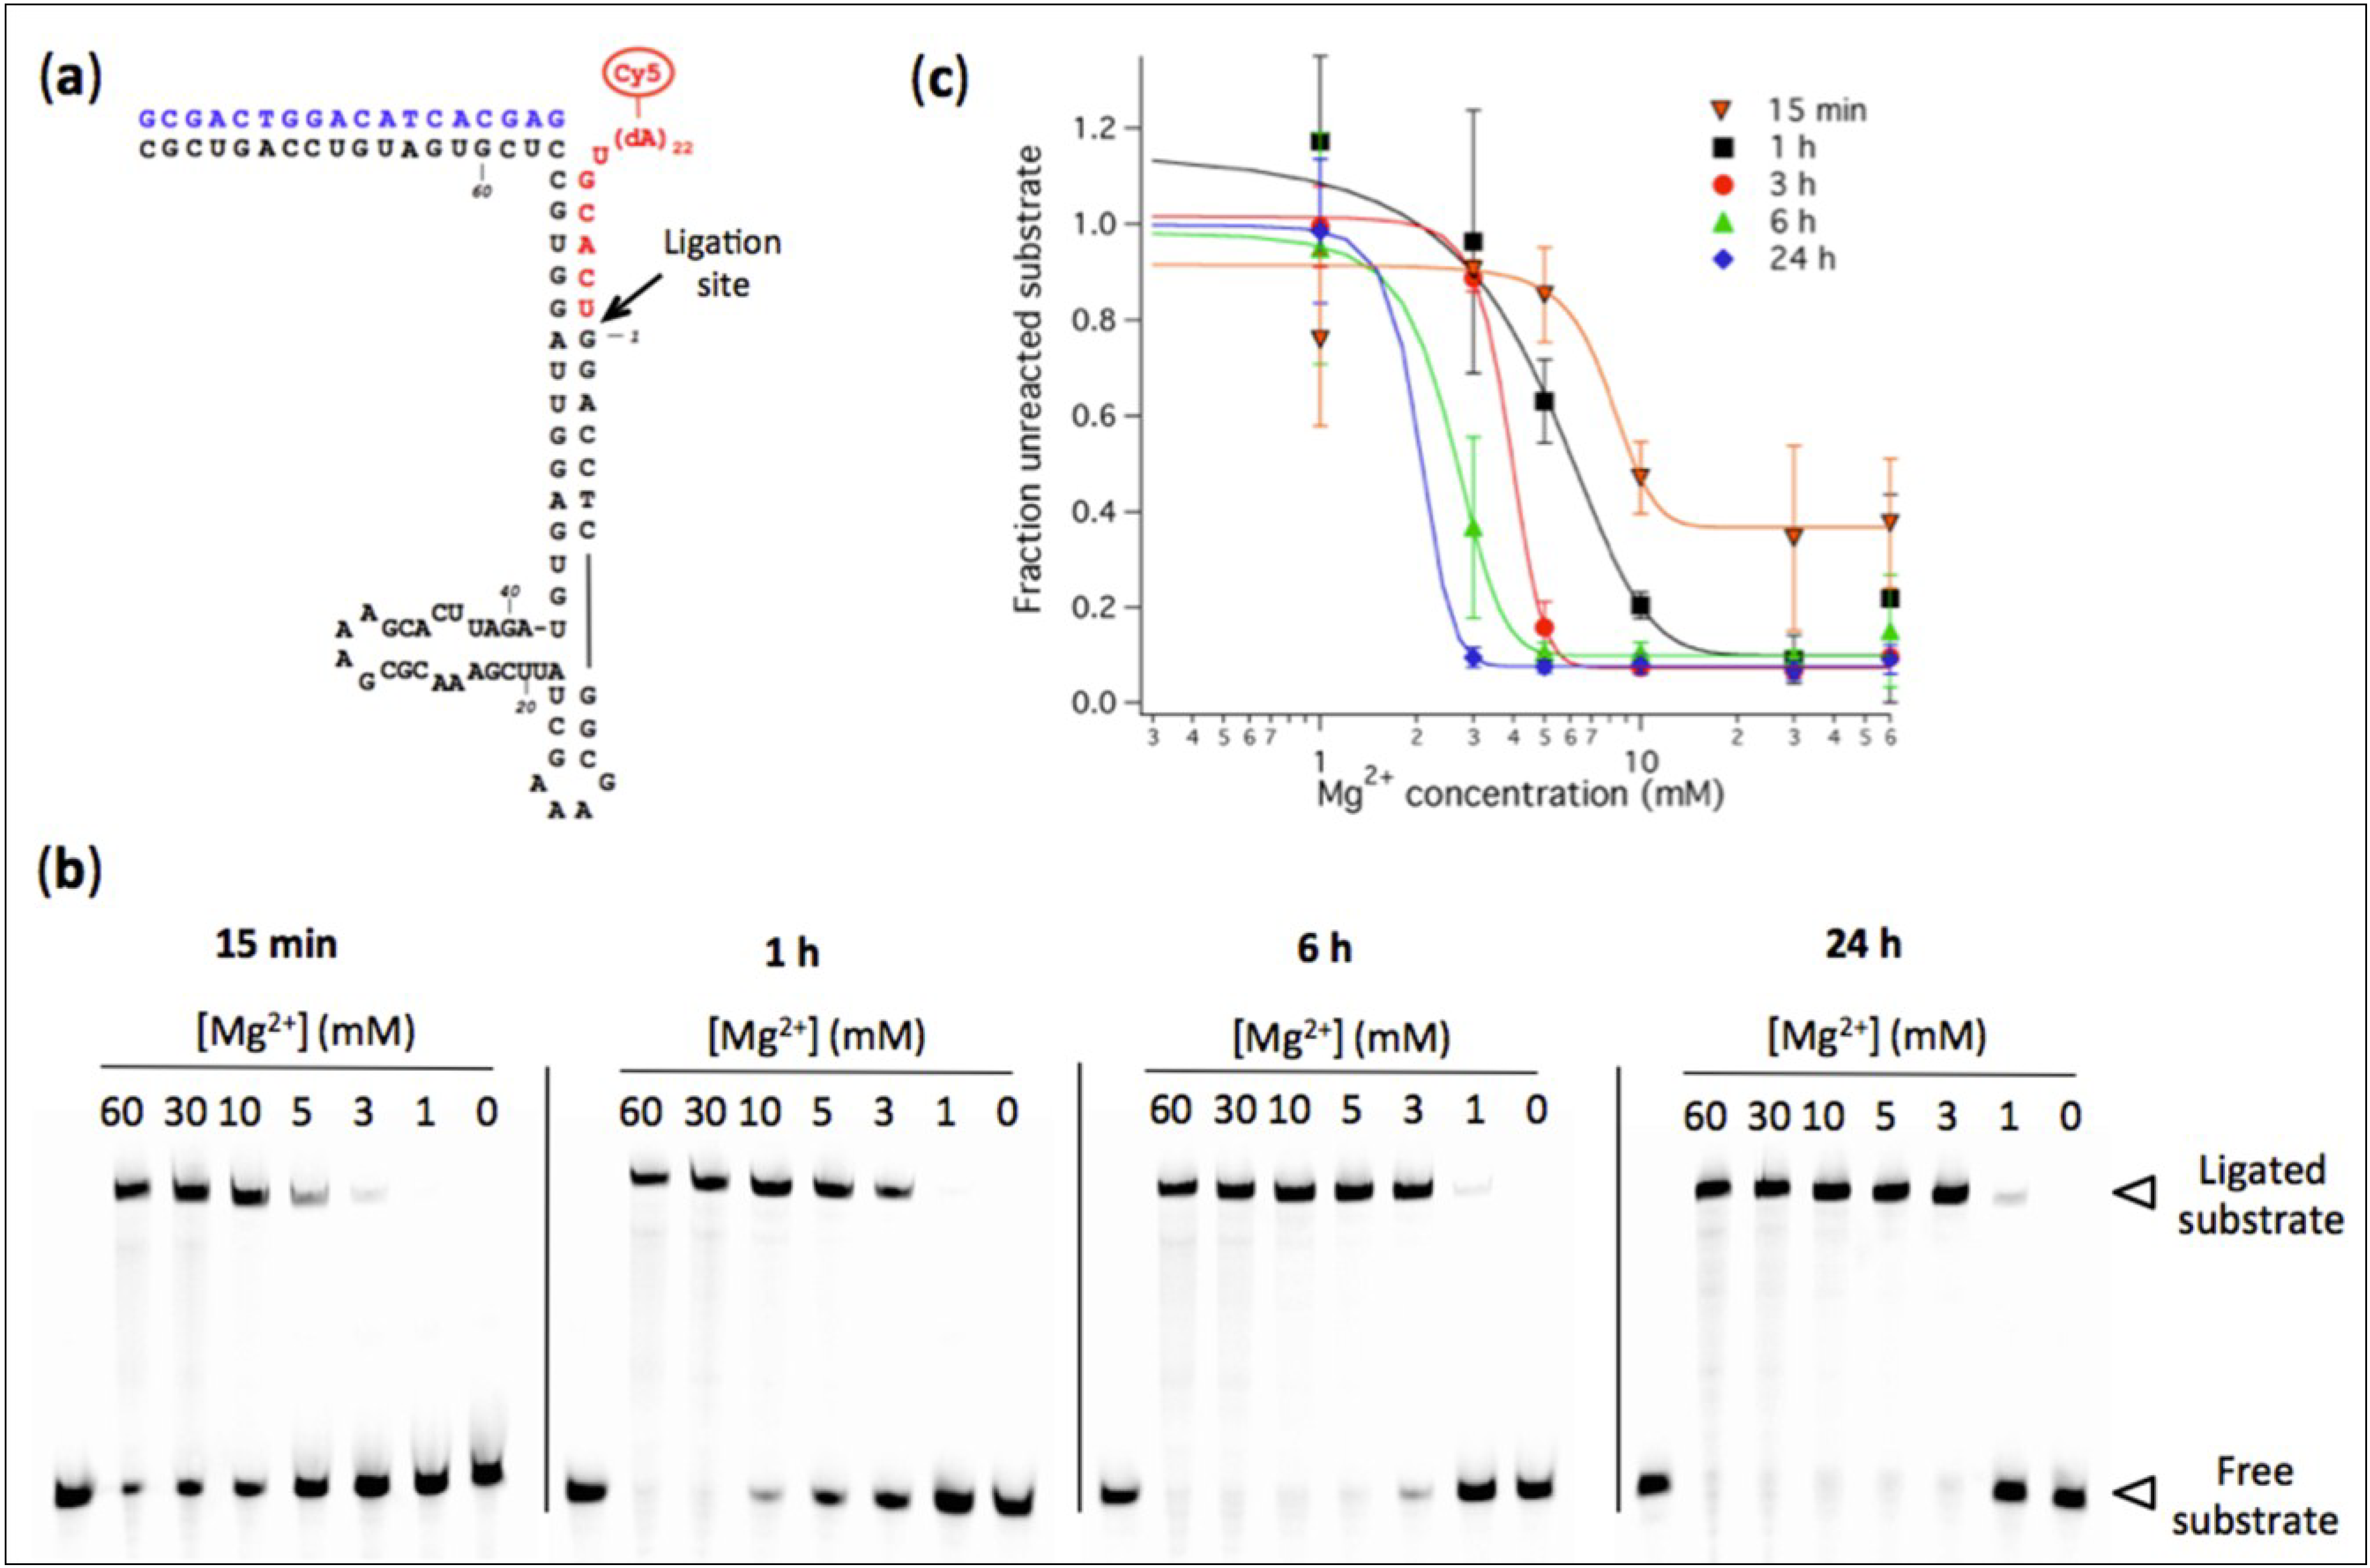
2+ concentration on the ligation rate of the R8-9 ribozyme. The conversion of oligonucleotide substrate into a longer ligation product by pre-assembled ribozyme-effector complexes was measured using a fluorescence-based band-shift assay (
Figure 1). The ligase ribozyme activity, expressed as the fraction of remaining (unreacted) substrate, was quantified at varying amount of Mg
2+ and different reaction times. Decreasing Mg
2+ concentration from 60 mM to 1 mM is accompanied by a decrease in ligase activity (
Figure 1b). The concentrations of Mg
2+ corresponding to half-maximal activity are 8.0 ± 1.7 mM (15 min), 4.6 ± 1.4 mM (1 h), 3.9 ± 0.2 mM (3 h), 2.6 ± 0.8 mM and 2.0 ± 1.7 mM (24 h). After 48 h and 72 h reaction, a small fraction of substrate could be ligated even at 1 mM Mg
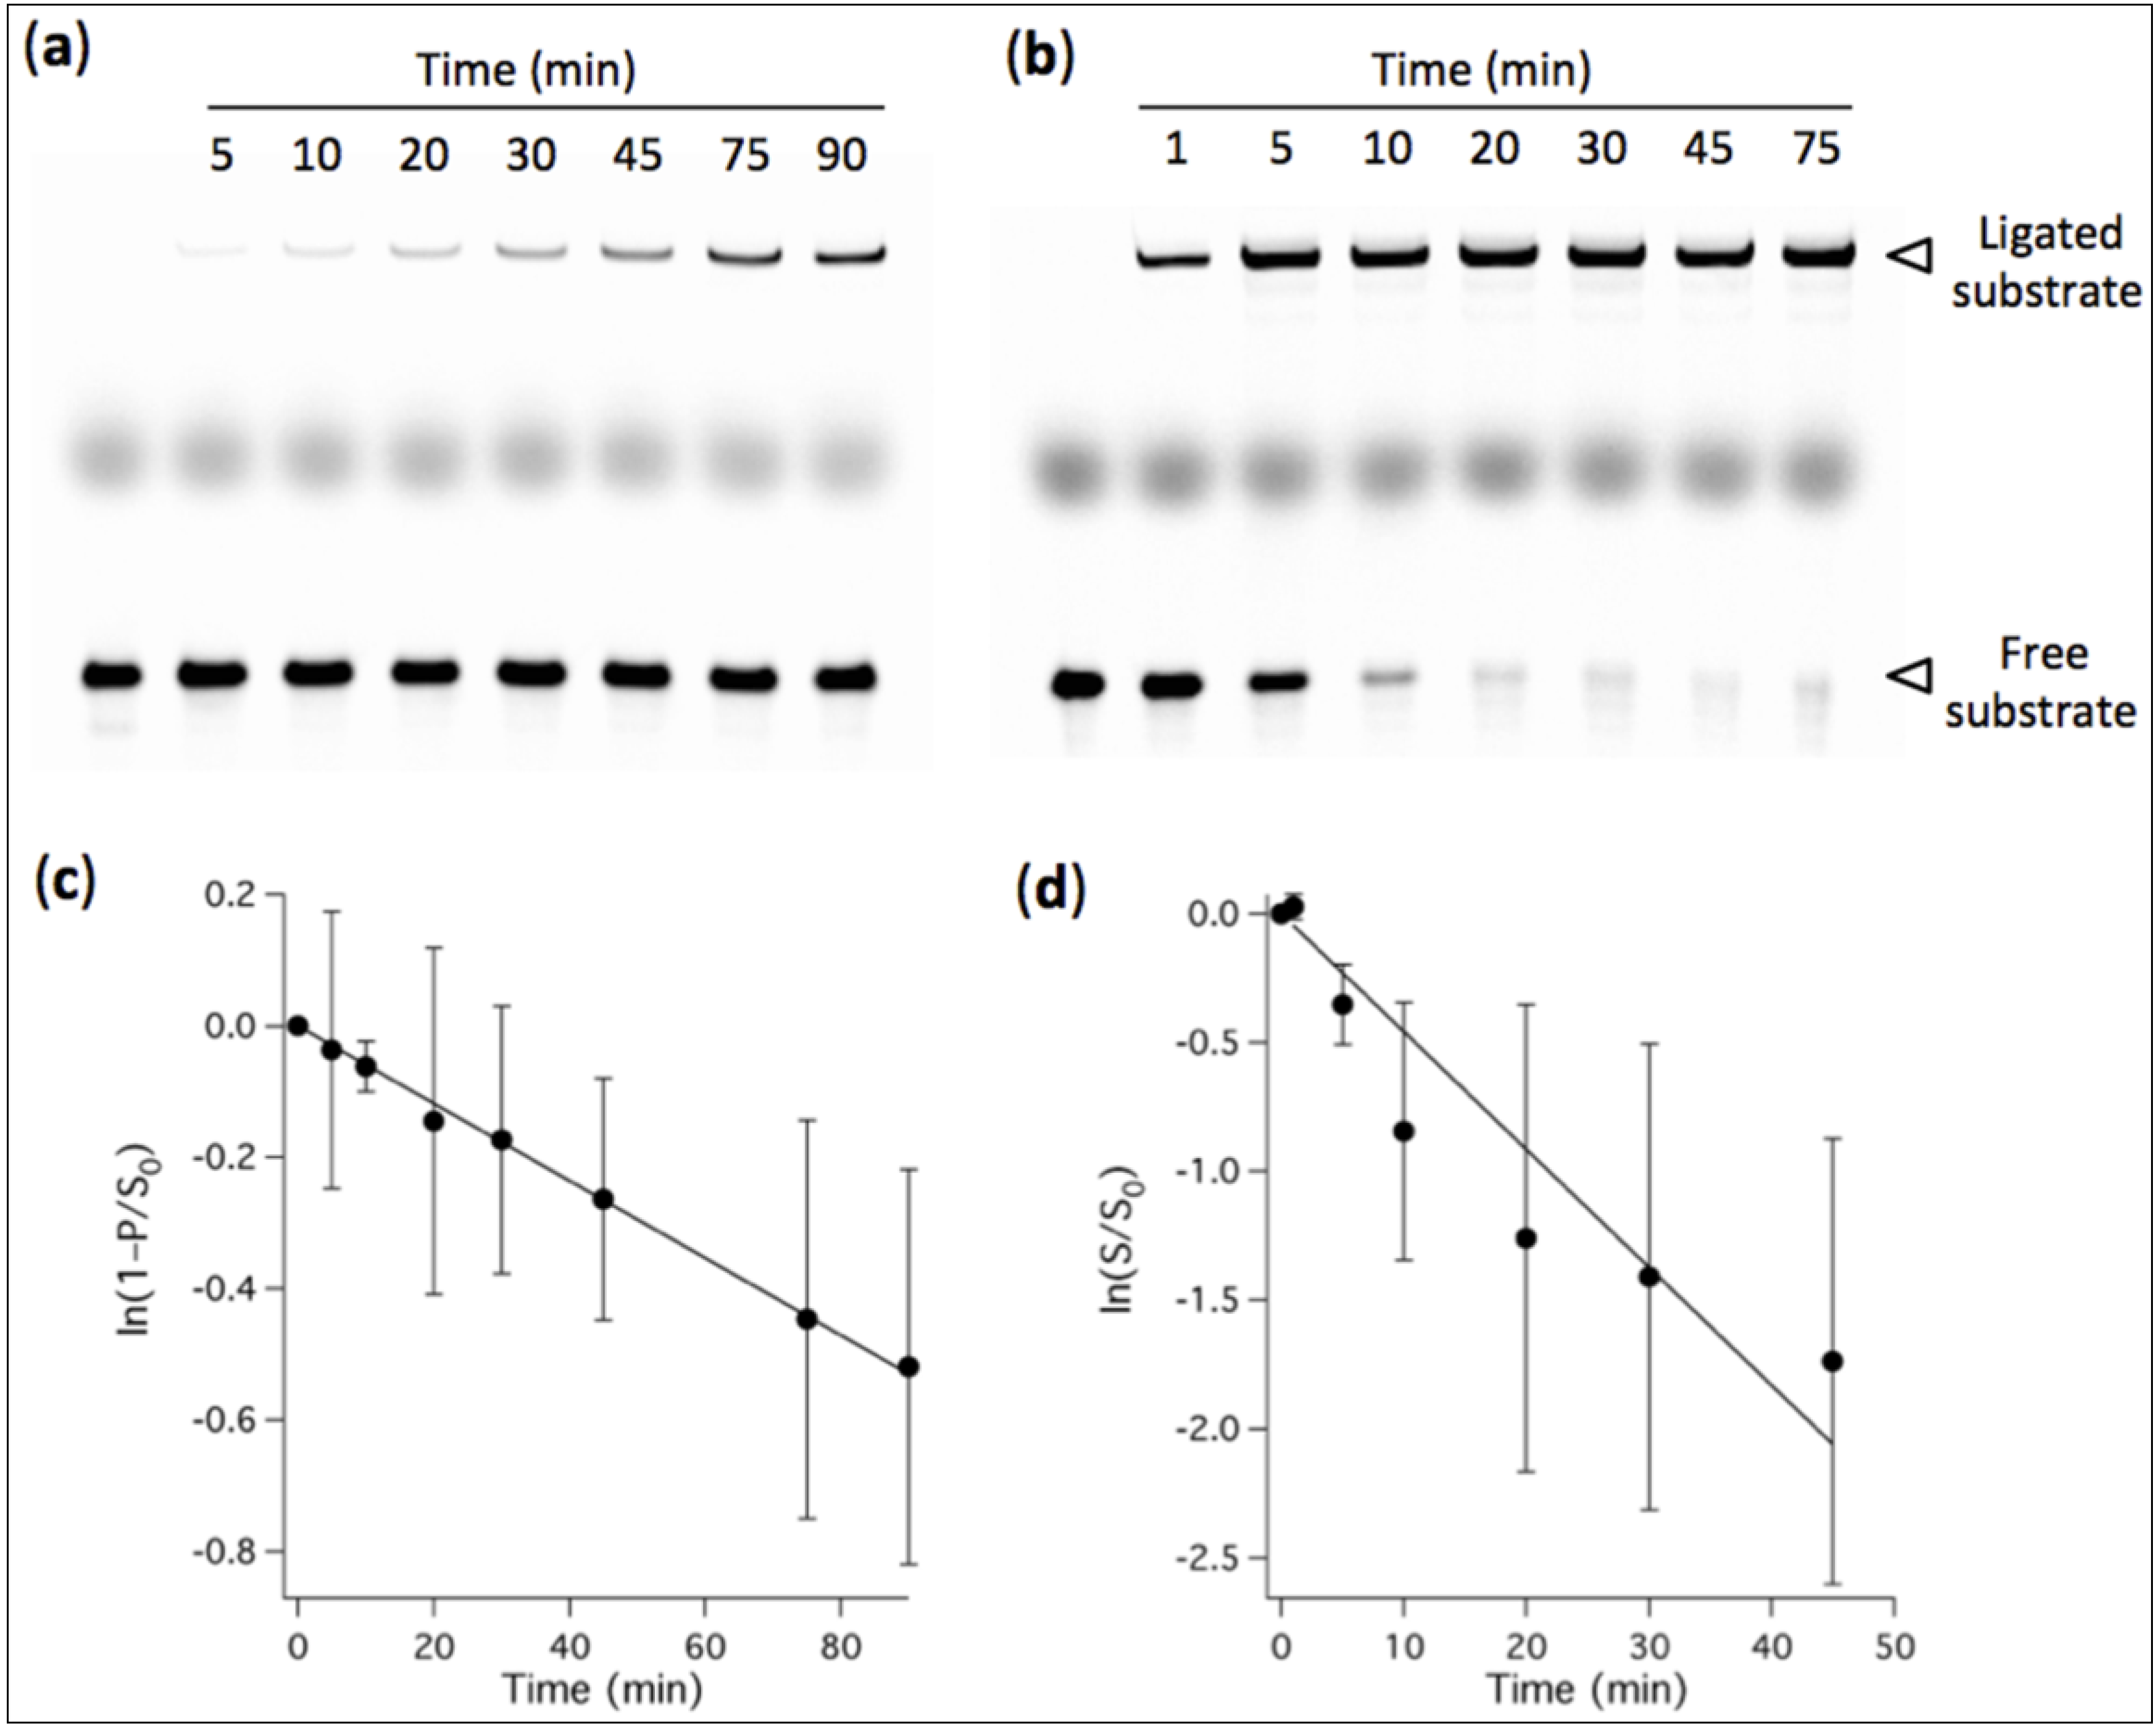
2+: 16% ± 4% after 48 h and 25% ± 12% after 72 h, respectively, corresponding to 40 nM and 62 nM of ligation product starting from 250 nM substrate (not shown on gel). The observed ligation rate constant was determined in the presence of 60 mM and 3 mM of Mg
2+, and values of 2.8 ± 0.8 h
−1 and 0.35 ± 0.01 h
−1 were obtained, respectively (
Figure 2).
Therefore, our results indicate that even under low-Mg2+ conditions (<5 mM) ribozyme-catalyzed ligation can occur, though its rate is markedly lower. The extent to which the rate of ribozyme-assisted reactions could have been limiting in the context of an “RNA world” remains to be investigated.
To assess the possible influence of Cl− on the Mg2+-dependent ligation rate, we conducted a few ribozyme activity experiments in which Cl− was substituted with acetate as a counter ion of Na+. We found that the yield of the ligation reaction is very similar for Cl− and acetate anions over the full range of Mg2+ concentrations tested (not shown).
Note that the indicated Mg2+ concentration corresponds to the total concentration in the solution. Because the ligation buffer contains 1 mM EDTA the concentration of free Mg2+ available to participate to ribozyme folding and catalytic reaction is lower than the indicated value.
Through the specific example of the R8-9 ligase ribozyme, these results suggest that ribozymes with ligase activity may have lower Mg
2+ requirements than previously expected [
14]. This extends the range of ionic compositions compatible with fatty acid vesicle integrity.
Figure 1.
(a) Predicted secondary structure of the R8-9 L1 ligase. The body ribozyme is colored black, the effector oligonucleotide is in blue, and the substrate oligonucleotide conjugated to a poly(dA) tail terminated by a Cy5 dye is in red. The RNA ligase catalyzes the formation of a phosphodiester bond between the substrate and the body ribozyme as depicted by the arrow; (b) Polyacrylamide gel electrophoresis analysis of R8-9 ribozyme-catalyzed substrate ligation performed at the indicated Mg2+ concentrations and reaction times. [Ribozyme] = 1 µM, [Effector] = 2 µM, [Substrate] = 0.25 µM. The reaction buffer used was 200 mM NaCl, 30 mM Tris-HCl, 1 mM EDTA, 0.1% NP40, pH 7.7. The first lane of each gel corresponds to a substrate-only solution and the band intensity was used as the total amount of substrate S0 for normalization; (c) Quantitation of ligation efficiency expressed as the fraction of unreacted substrate derived from PAGE analysis. The solid lines indicate sigmoidal curve fits. Two to three independent experiments were performed for each condition; error bars represent standard deviations.
![Life 04 00929 g001]()
Figure 2.
PAGE analysis of ligation kinetics performed in the presence of 3 mM Mg2+ (a) or 60 mM Mg2+ (b). [Ribozyme] = 1 µM, [Effector] = 2 µM, [Substrate] = 0.25 µM. The reaction buffer used was 200 mM NaCl, 30 mM Tris-HCl, 1 mM EDTA, 0.1% NP40, pH 7.7. The first lane of each gel corresponds to a substrate-only solution and the band intensity was used as the total amount of substrate S0 for normalization. The thick middle band corresponds to the loading dye. (c, d) Quantitative analysis of the ligation rate. (c) The fraction of ligated substrate under 3-mM-Mg2+ condition was measured. (d) The fraction of remaining substrate under 60-mM-Mg2+ condition was calculated. (c, d) Solid lines indicate linear fits whose slopes give the apparent ligation rate constants. Three independent experiments were performed for each condition; error bars represent standard deviations calculated as described in the experimental section.
3.2. Influence of Mg2+ Concentration on the Formation of MA Vesicles
Though the detrimental effect of Mg2+ on fatty acid vesicle stability has long been demonstrated, the precise Mg2+ concentration tolerated strongly depends on the global ionic composition of the aqueous medium, in particular on the concentration of monovalent inorganic ions, such as Na+ and Cl−. Therefore, we investigated the formation and stability and MA vesicles exposed to different concentrations of Mg2+ in the modified ribozyme reaction buffer (30 mM Tris-HCl, pH 7.7, 100 mM NaCl, 1 mM EDTA). Note that the NP40 surfactant has been omitted to avoid interference with vesicle self-assembly.
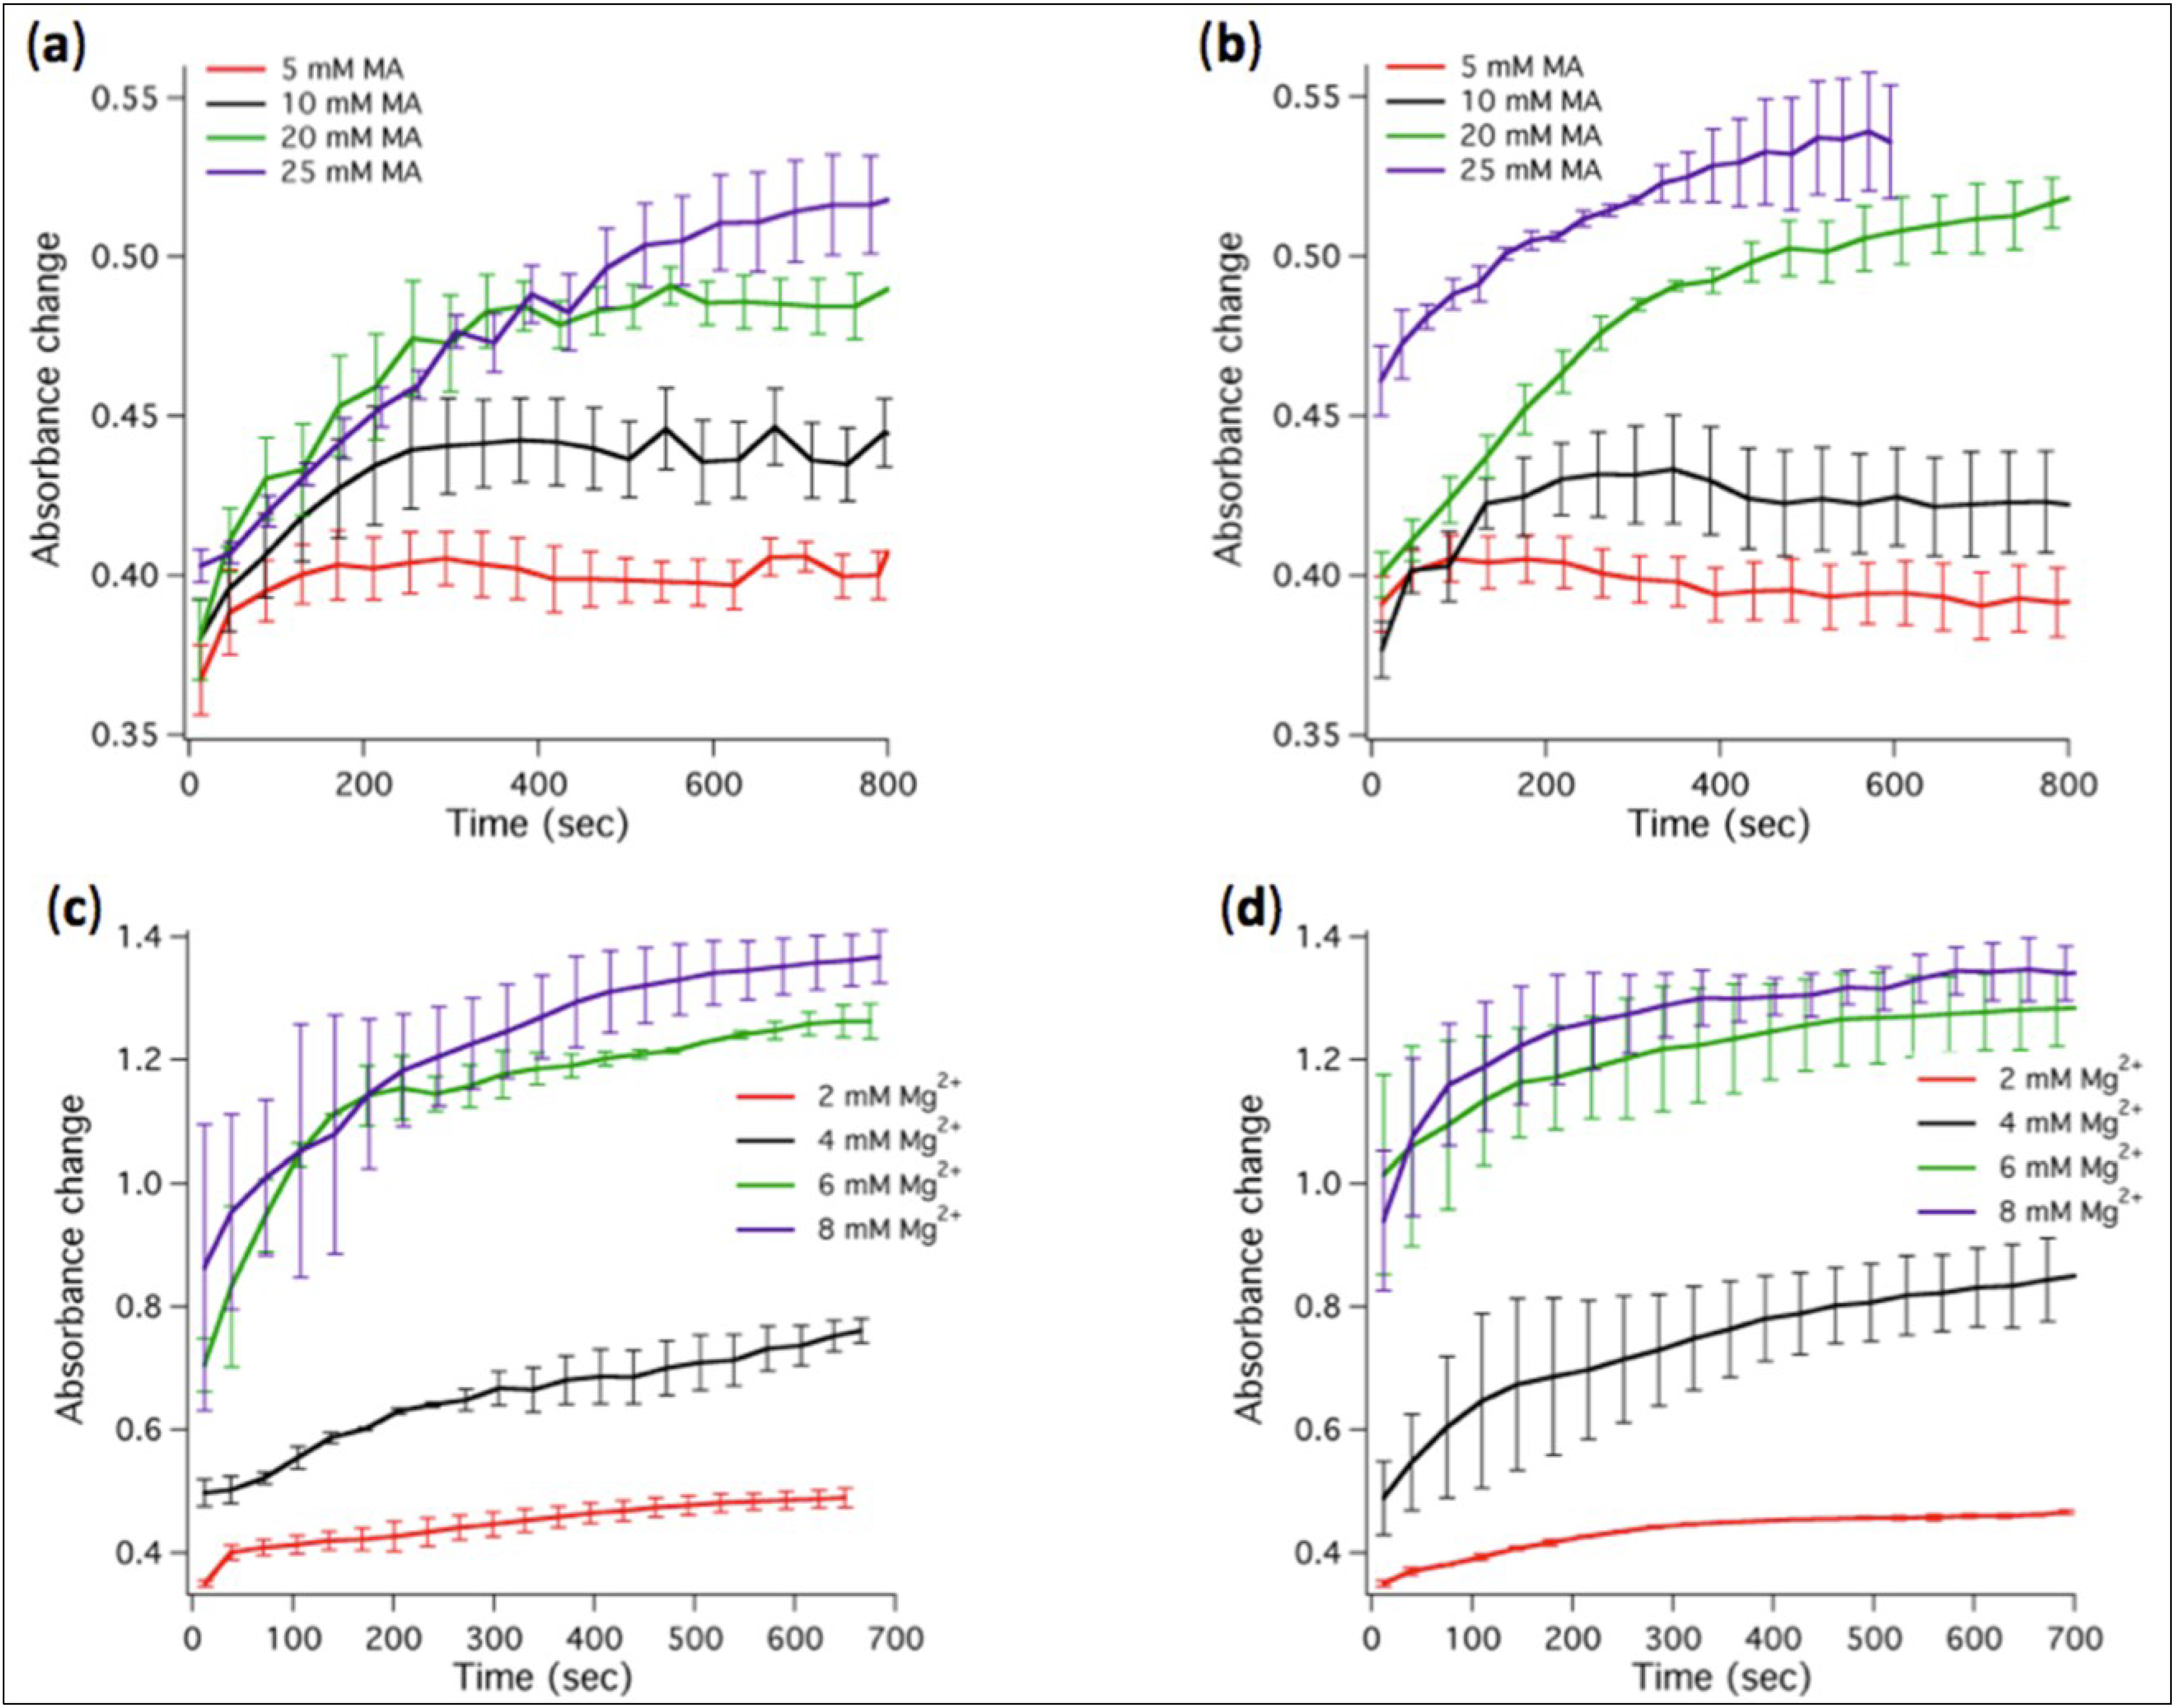
The transfer of MA from micelles to vesicles was monitored as turbidity changes over time. We found that stable vesicles could self-assemble at MA concentrations between 5 mM and 25 mM in the presence of 2 mM Mg
2+ (
Figure 3a). Increasing Mg
2+ concentration above 4 mM causes MA (20 or 25 mM) to precipitate as indicated by the large rise in absorbance (
Figure 3c) and by the visible increase of the turbidity of the solution.
Figure 3.
Kinetics of absorbance changes associated to micelle-vesicle transition or fatty acid precipitation. (a) Absorbance changes for varying MA concentrations in the modified ligation buffer containing 2 mM Mg2+. (b) Same as in (a) except that 1 µM ribozyme was present in the ligation buffer. (c) Absorbance changes for varying Mg2+ concentrations in the presence of 20 mM MA. (d) Same as in (c) except that 1 µM ribozyme was present. Two to three independent experiments were performed for each condition; error bars represent standard deviations. The indicated Mg2+ concentrations correspond to total concentrations.
We also studied the micelle-to-vesicle transition and Mg
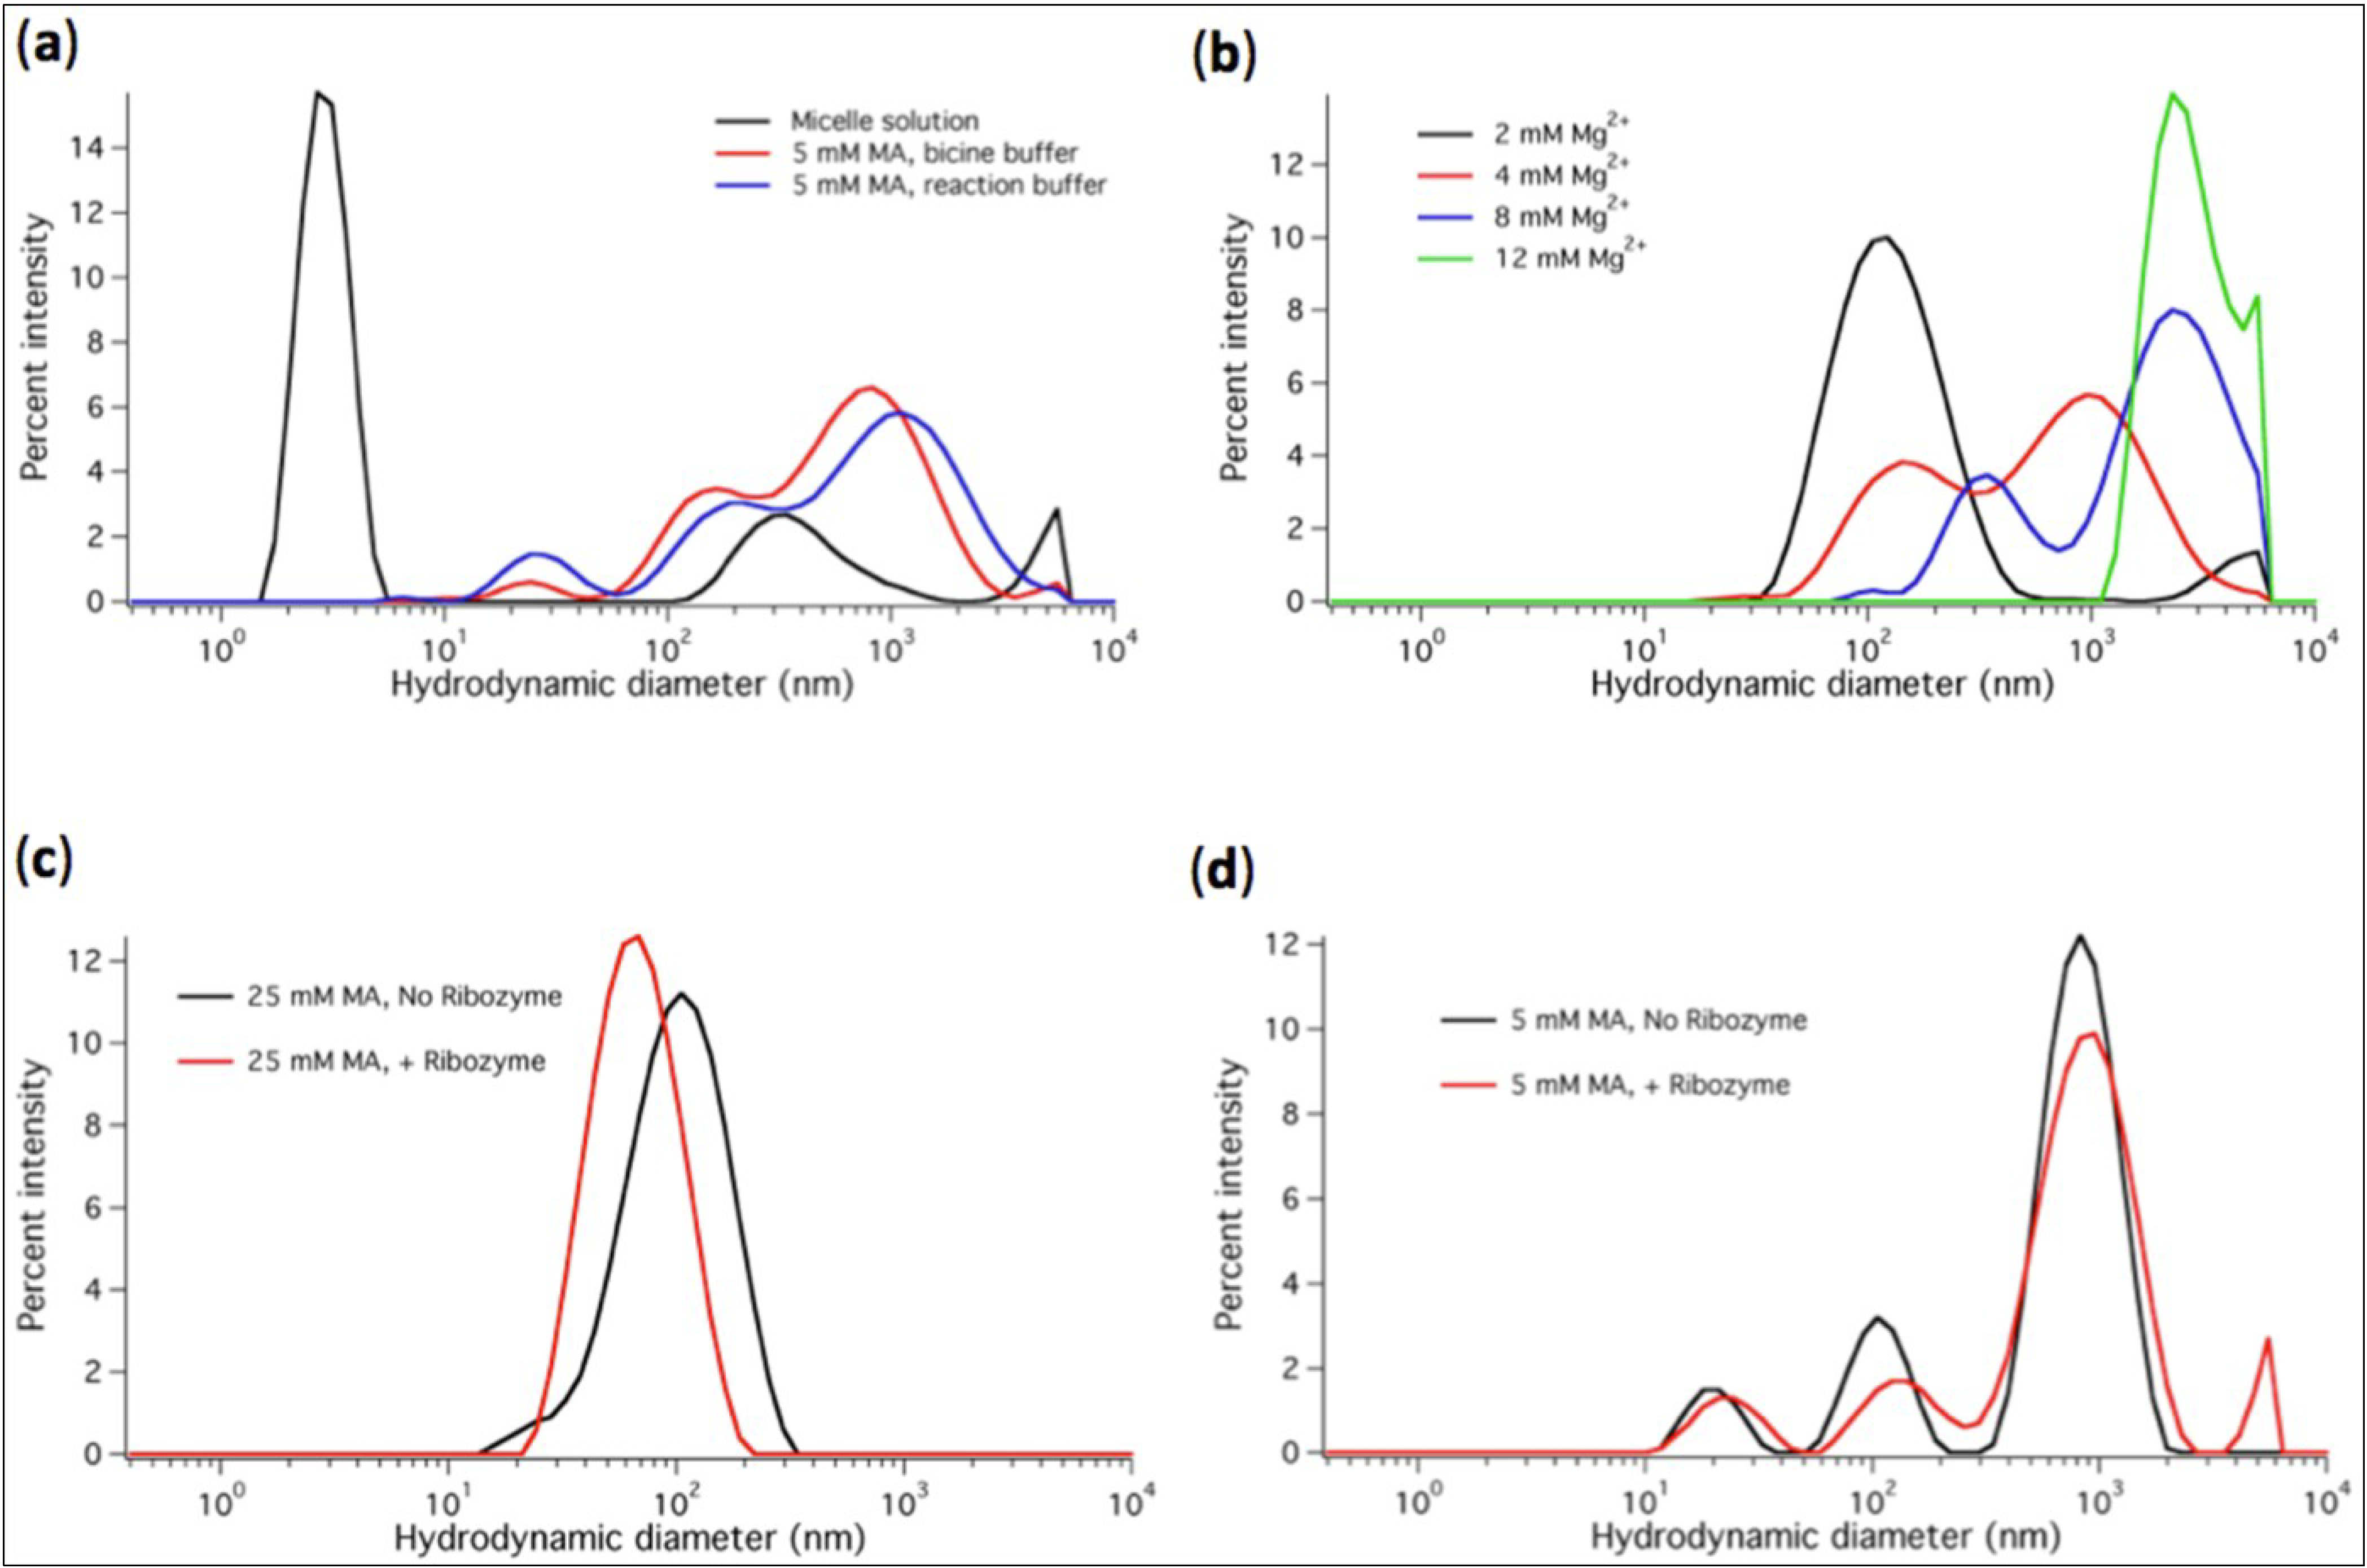
2+-dependent precipitation of liposomes using DLS. A characteristic peak centered at 3-nm hydrodynamic diameter was observed for the micelle solution (
Figure 4a). The particle size distribution was shifted to diameters ranging between 0.1 and 3 µm when MA was suspended at 5 mM (or higher) concentration in bicine buffer (used as a typical medium for MA vesicle assembly) or in the modified ligase buffer containing 2 mM Mg
2+ (
Figure 4a,c,d). When Mg
2+ reached concentrations higher than 4 mM the size distribution was further shifted to bigger particle diameters, consistent with vesicle disruption and MA precipitation (
Figure 4b). Given that vesicles can agglutinate into larger scattering particles (
Figure 5a), it is important to realize that the measured (apparent) hydrodynamic diameter profile does not effectively reflect the size of individual vesicles. Agglomerated vesicles contribute to the multimodal intensity distributions and leads to substantial variability even between consecutive runs on the same biological sample. Besides, DLS data are very sensitive to sample preparation, in particular when vesicles are formed from micelles. Nonetheless, the presence of either micelles, vesicles at 5 mM MA, vesicles at 20–25 mM MA or Mg
2+-induced aggregates could unambiguously be identified and discriminated.
Figure 4.
DLS measurements performed at varying conditions are displayed as percent intensity vs apparent hydrodynamic diameter. (a) Diameter profiles of MA micelles (80 mM MA in NaOH solution) and MA vesicles formed in the bicine buffer and ligation buffer containing 2 mM Mg2+. In the micelle sample, minor peaks around 300 nm and above 5 µm reflect the presence of a very small fraction of larger aggregates. However, these peaks are not observed in every measurements and the fraction of micelles is clearly prominent with a consistently low polydispersity index (<0.3) of the distribution. (b) Size distributions in aqueous solutions containing 20 mM MA and varying Mg2+ concentrations. (c) Vesicle diameter profiles in solutions containing 25 mM MA and 2 mM Mg2+, and without or with 1 µM ribozyme. (d) Vesicle diameter profiles in solutions containing 5 mM MA and 2 mM Mg2+, and without or with 1 µM ribozyme. Vesicles were formed starting from micelles diluted in the indicated buffer. For each condition a representative profile from at least two independent experiments (three runs each) is shown. Note that the differences in the curves with and without ribozyme (c, d) are within the variability range of the DLS measurements and cannot be attributed to ligase-specific effects.
![Life 04 00929 g004]()
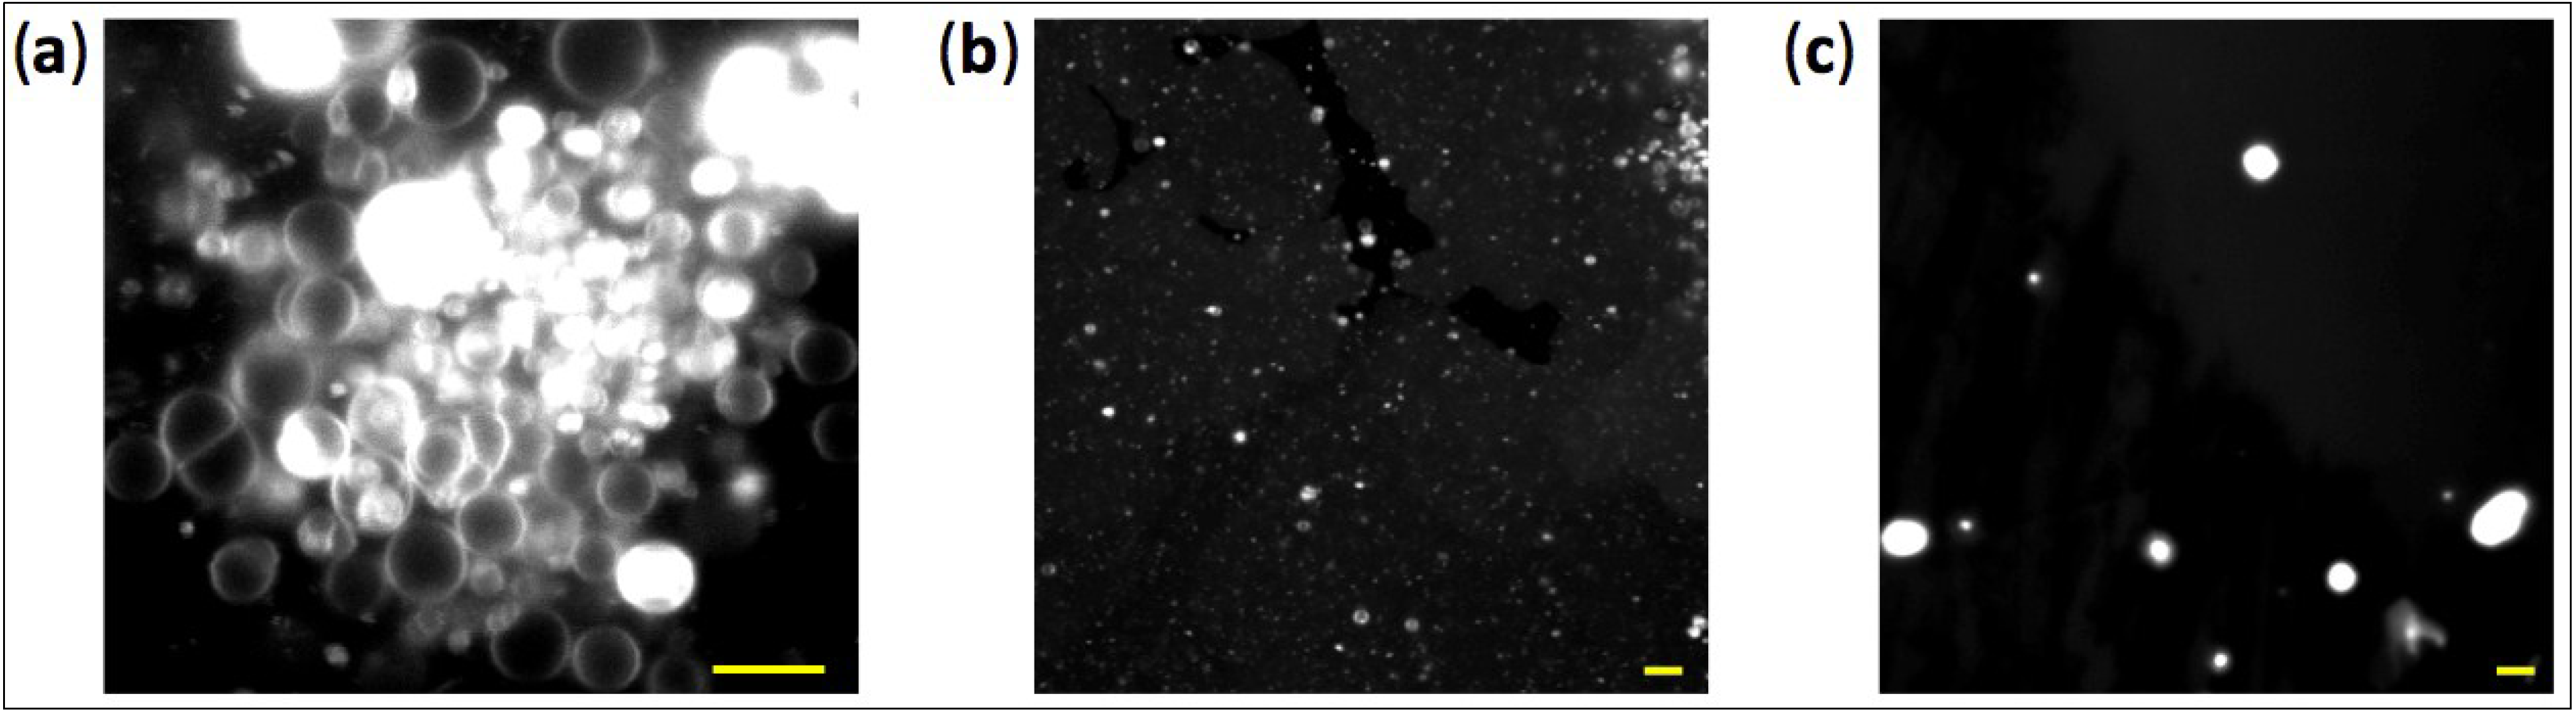
To have more direct insights on vesicle properties and on the effects of Mg
2+ concentration we visualized the structures formed by 5 mM MA doped with a small fraction of the fluorescent dye rhodamine 6G using confocal microscopy. Intact spherical vesicles are clearly observed in the presence of 2 mM Mg
2+ (
Figure 5a,b), whereas larger aggregates are formed at 8 mM Mg
2+ (
Figure 5c), in agreement with both turbidity and DLS measurements.
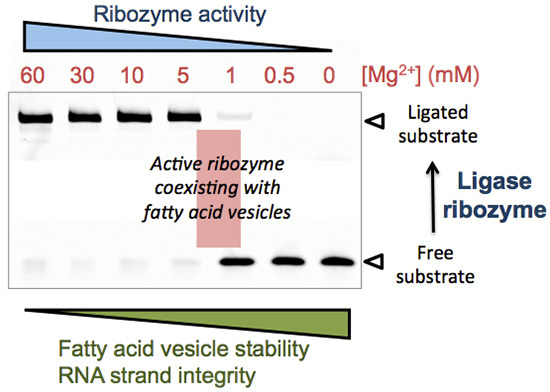
Taken together, these data suggest that an Mg2+ concentration of 1 to 3 mM offers a good compromise between MA vesicle integrity and L1 ligase activity.
Figure 5.
Fluorescence confocal images of MA vesicles. The vesicle solution contains 2 mM (a, b) or 8 mM (c) Mg2+. MA concentration was 5 mM. Scale bars represent 6 µm. In panel (a), the white areas are multilamellar vesicles whose fluorescence signal saturates. We chose to show a fluorescence image of a cluster of large vesicles sedimented on the glass surface to have a sufficiently large number of spatially-resolved liposomes in one field of view (a). Vesicles dispersed in the solution are also observed but their low density and motion make the imaging more complicated (b). Note that the size of vesicles below around 300 nm in diameter cannot be accurately determined due to the optical diffraction limit of the microscope.
3.4. High Concentration of MA Vesicles Impairs Ribozyme-Catalyzed Ligation
Having established that stable vesicles can form at 2 mM Mg
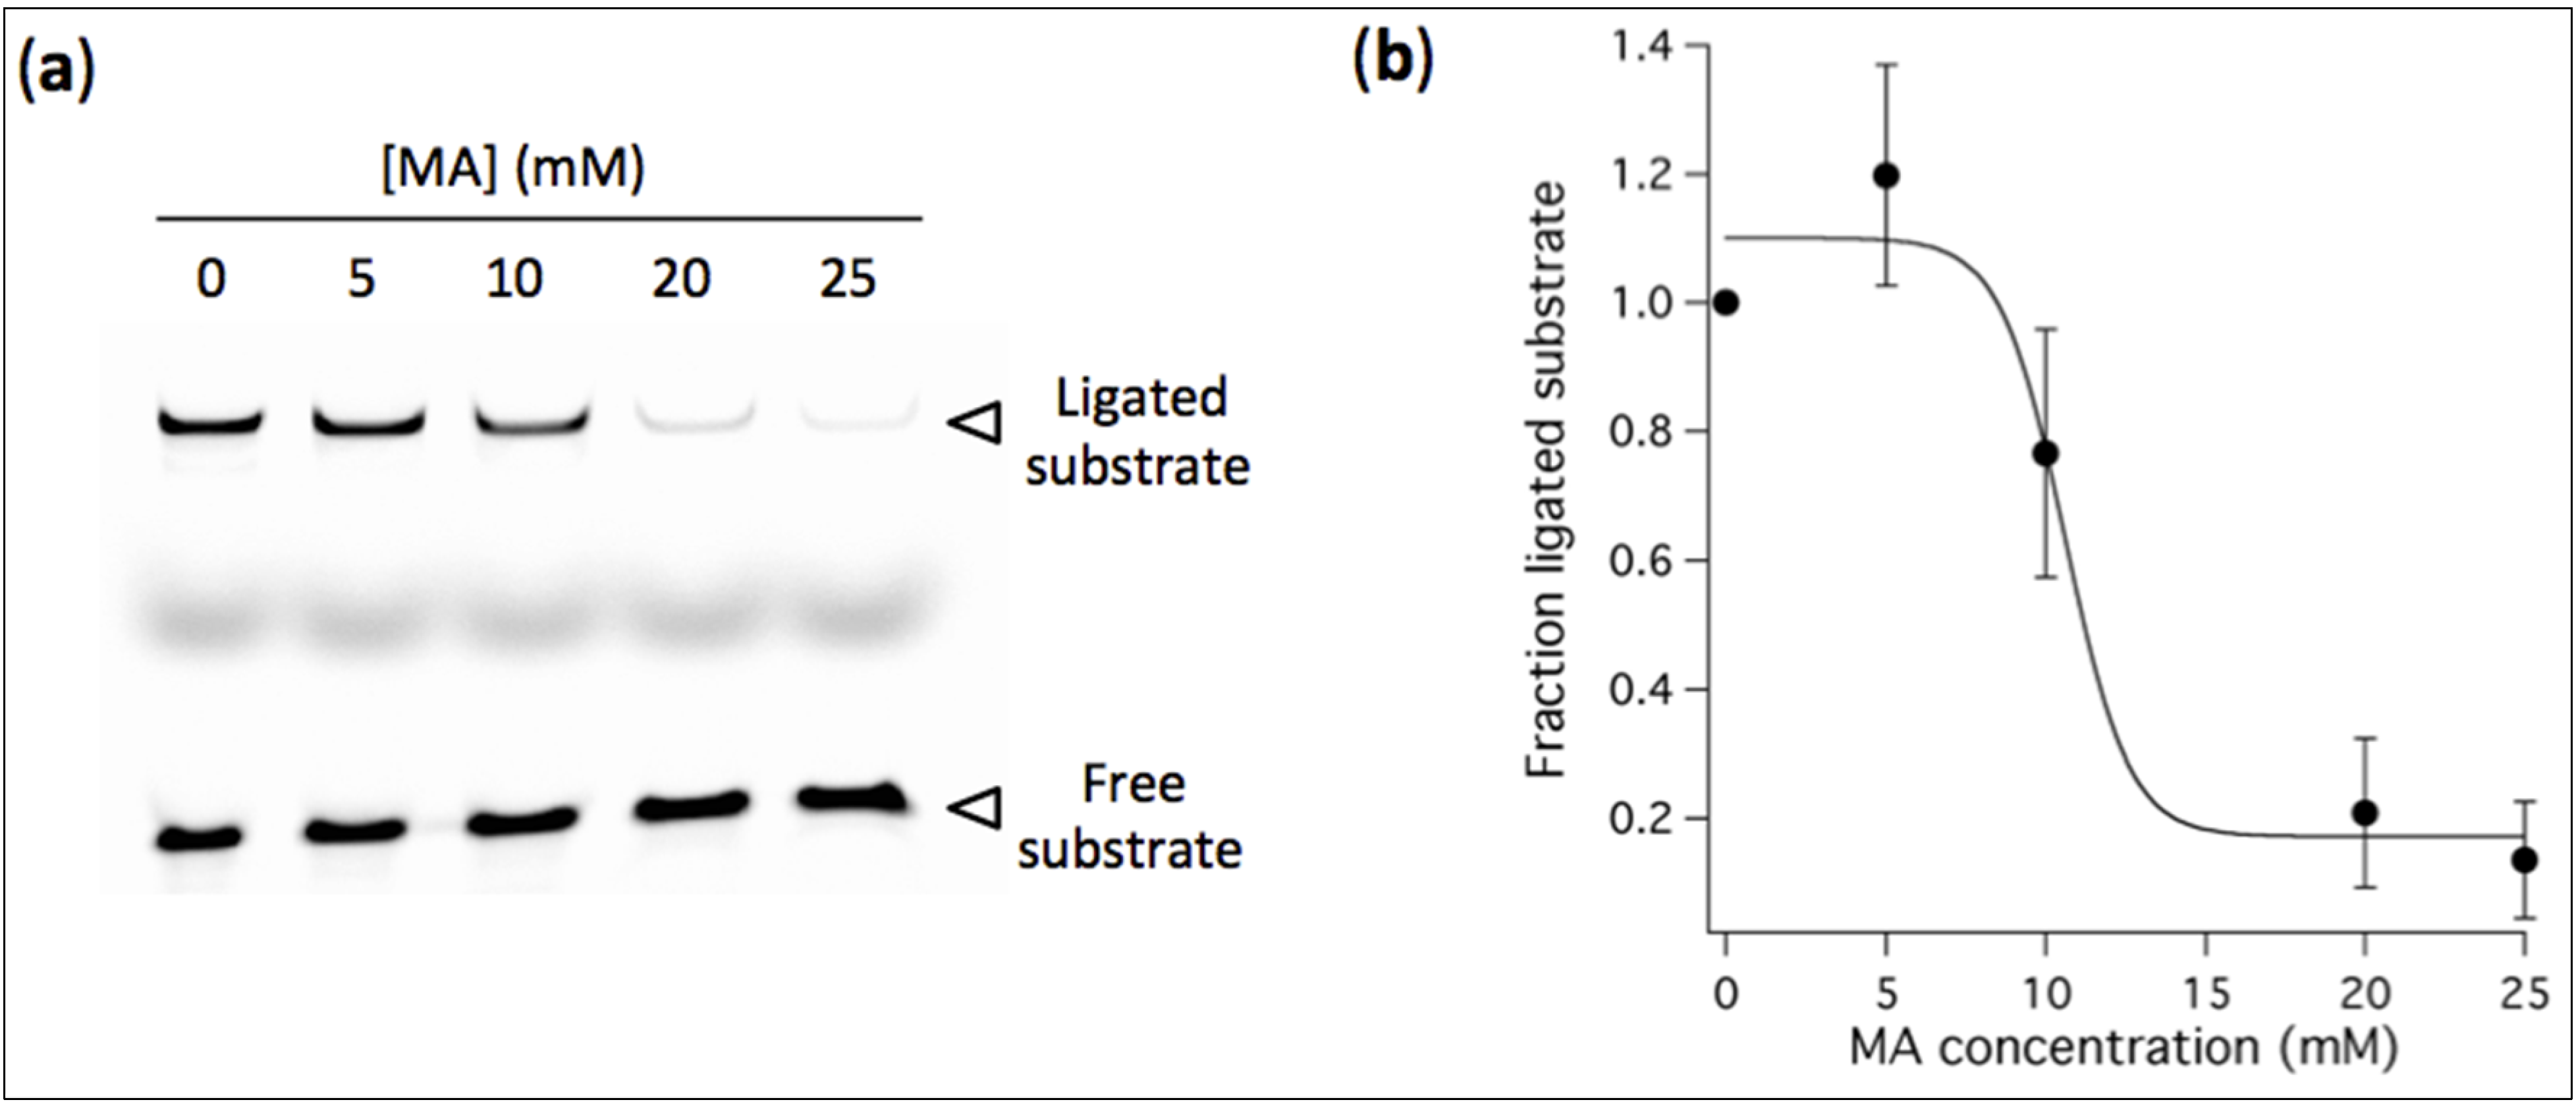
2+ in buffered solution compatible with L1 ligase ribozyme activity, we examined the influence of preformed vesicles at varying MA concentrations on the yield of ligation. After 40 h reaction, the amount of ligated substrate decreases as a result of increasing concentration of MA (
Figure 6). An estimation of the MA concentration corresponding to half-maximal ligation efficiency compared to MA-free reaction is 10 mM. These experiments demonstrate that a suspension of fatty acid vesicles composed of 5 mM MA in an ion-rich aqueous medium including 2 mM Mg
2+ (comprising an EDTA-bound fraction), 100 mM NaCl, pH 7.7, by retaining full ribozyme activity, offers compromising conditions for simultaneous R8-9 ligase-catalyzed reaction and MA vesicle stability.
Factors that could affect ribozyme activity under exposure to MA vesicles include Mg
2+ depletion through fatty acid association and RNA adsorption to the vesicle membrane. The amount of free Mg
2+ in solution is likely reduced in the presence of MA vesicles because of its association to the fraction of negatively charged fatty acids [
12,
14], thereby reducing ribozyme activity. On the other hand, adsorption of ribozyme to the fatty acid membrane might hamper the RNA catalytic activity through misfolding or unfavorable association with the oligonucleotide substrate. The interaction of the hammerhead ribozyme N15min7 to MA-containing vesicles has previously been studied and only a small fraction of RNA was found adsorbed to the membrane [
14]. Therefore, we attribute the loss of ribozyme activity primarily to MA-based depletion of Mg
2+, whose free concentration becomes limiting for the ligation reaction. Further experiments are required to examine R8-9 ligase adsorption to MA bilayers.
Figure 6.
(a) Ligation assay performed in the presence of preformed vesicles at indicated MA concentrations. [Ribozyme] = 1 µM, [Effector] = 2 µM, [Substrate] = 0.25 µM. The reaction occurred in aqueous solution containing 100 mM NaCl, 30 mM Tris-HCl, pH 7.7, 1 mM EDTA and 2 mM Mg2+, and was incubated for 40 h. (b) Fraction of ligated substrate calculated as the band intensity of ligated substrate with MA normalized to that without fatty acid. Three independent titration experiments were performed; error bars represent standard deviations. The solid line is a sigmoidal curve fit.
3.5. Low-Mg2+ Concentration Increases the Lifetime of Active Ligase Ribozyme
Figure 7.
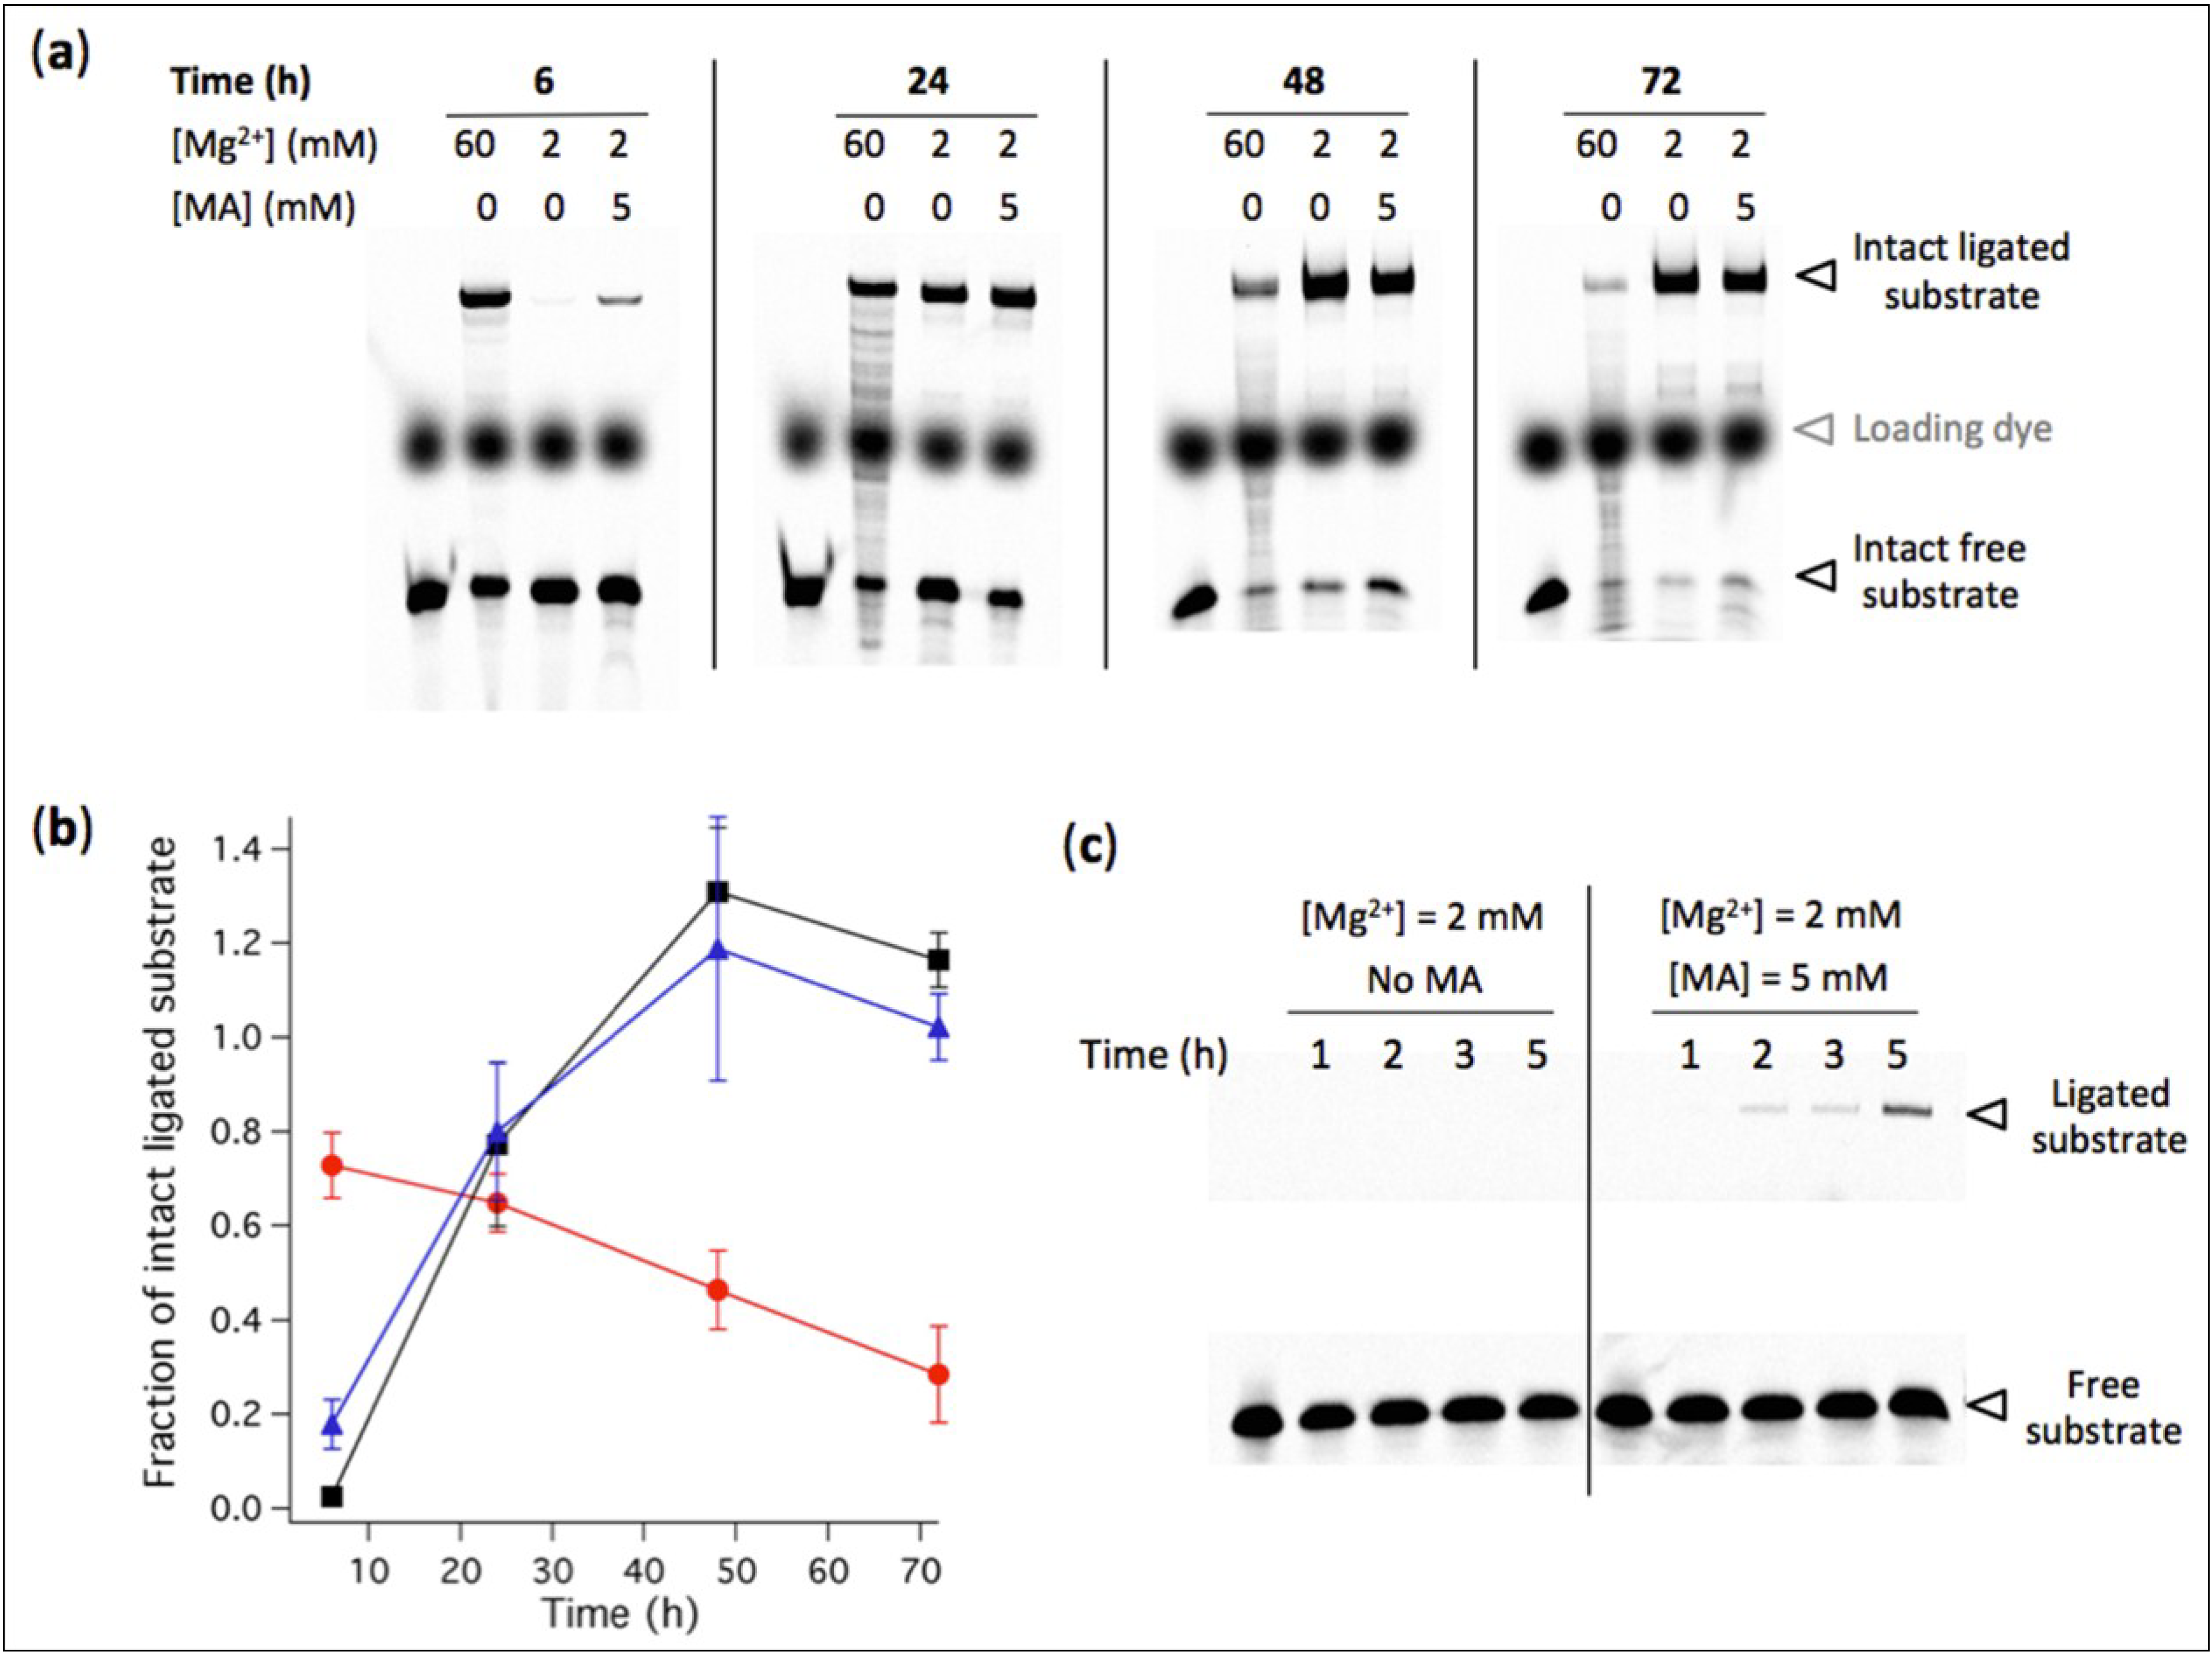
(a) Effects of Mg2+ concentration and MA vesicles on the degradation rate of RNA ligase. [Ribozyme] = 1 µM, [Effector] = 2 µM, [Substrate] = 0.25 µM. The reaction was performed at 37 ºC in aqueous medium containing 100 mM NaCl, 30 mM Tris-HCl, pH 7.7, 1 mM EDTA and the indicated concentrations of Mg2+ and MA. The reaction time is also indicated. Degradation bands of both ligated and free substrates are visible. In the first lane of each gel, a solution containing the substrate only was freshly added before loading the gel and was used as a reference for the total amount of substrate S0. (b) The fraction of intact ligated substrate was determined for each condition as the amount of intact ligated substrate measured on gel divided by S0. Red symbols, 60 mM Mg2+; black symbols, 2 mM Mg2+; Blue symbols, 2 mM Mg2+ and 5 mM MA vesicles. Two independent kinetics experiments were performed; error bars represent standard deviations. (c) Kinetics of R8-9 ribozyme-catalyzed ligation at 2 mM Mg2+ with or without 5 mM MA vesicles. Reaction conditions are identical as in (a), except the ligation durations.
Figure 7.
(a) Effects of Mg2+ concentration and MA vesicles on the degradation rate of RNA ligase. [Ribozyme] = 1 µM, [Effector] = 2 µM, [Substrate] = 0.25 µM. The reaction was performed at 37 ºC in aqueous medium containing 100 mM NaCl, 30 mM Tris-HCl, pH 7.7, 1 mM EDTA and the indicated concentrations of Mg2+ and MA. The reaction time is also indicated. Degradation bands of both ligated and free substrates are visible. In the first lane of each gel, a solution containing the substrate only was freshly added before loading the gel and was used as a reference for the total amount of substrate S0. (b) The fraction of intact ligated substrate was determined for each condition as the amount of intact ligated substrate measured on gel divided by S0. Red symbols, 60 mM Mg2+; black symbols, 2 mM Mg2+; Blue symbols, 2 mM Mg2+ and 5 mM MA vesicles. Two independent kinetics experiments were performed; error bars represent standard deviations. (c) Kinetics of R8-9 ribozyme-catalyzed ligation at 2 mM Mg2+ with or without 5 mM MA vesicles. Reaction conditions are identical as in (a), except the ligation durations.
![Life 04 00929 g007]()
Mg
2+-induced RNA hydrolysis, by incapacitating ribozyme activity, is a major obstacle to a viable ribozyme-based protocell. Taking advantage of the tolerance of the R8-9 ligase ribozyme to operate at 2 mM Mg
2+, we then asked whether the amount of intact ligated substrate could become higher under lower Mg
2+ condition when RNA degradation becomes preponderant. We hypothesized that, despite higher ligation rate at 60 mM Mg
2+, the RNA degradation propensity under such high concentration of Mg
2+ ions would inactivate the ligase upon strand truncation and reduce the lifetime of substrate-ligated ribozyme. To test this possibility we quantified the amount of intact (full-length) ligated substrate at 2 mM and 60 mM Mg
2+ after different reaction periods at 37 ºC (
Figure 7). RNA fragments are seen as extra bands of smaller size below the intact ligation product and free substrate. The results show that after 24 h incubation the yield of ligated substrate becomes higher at low Mg
2+ concentration, a consequence of the faster RNA fragmentation under high-Mg
2+ ion condition which outcompetes the benefit of the higher ligation rate.
This finding suggests that low-Mg2+ conditions, by extending the lifetime of oligonucleotide substrate, active ribozyme and reaction product, provide higher evolutionary advantage.
