Article

Progression of Rare Inherited Retinal Dystrophies May Be Monitored by Adaptive Optics Imaging

by
Katarzyna Samelska
1,2,*,
Jacek Paweł Szaflik
1,2,
Barbara Śmigielska
1,2 and
Anna Zaleska-Żmijewska
1,2
1
Department of Ophthalmology, Medical University of Warsaw, 02-091 Warsaw, Poland
2
SPKSO Ophthalmic University Hospital, 00-576 Warsaw, Poland
*
Author to whom correspondence should be addressed.
Life 2023, 13(9), 1871; https://doi.org/10.3390/life13091871
Submission received: 4 August 2023 / Revised: 2 September 2023 / Accepted: 3 September 2023 / Published: 5 September 2023
(This article belongs to the Collection New Diagnostic and Therapeutic Developments in Eye Diseases)

Abstract

:
Inherited retinal dystrophies (IRDs) are bilateral genetic conditions of the retina, leading to irreversible vision loss. This study included 55 eyes afflicted with IRDs affecting the macula. The diseases examined encompassed Stargardt disease (STGD), cone dystrophy (CD), and cone–rod dystrophy (CRD) using adaptive optics (Rtx1™; Imagine Eyes, Orsay, France). Adaptive optics facilitate high-quality visualisation of retinal microstructures, including cones. Cone parameters, such as cone density (DM), cone spacing (SM), and regularity (REG), were analysed. The best corrected visual acuity (BCVA) was assessed as well. Examinations were performed twice over a 6-year observation period. A significant change was observed in DM ( 1282.73 /mm 2 vs. 10,073.42/mm 2 , p < 0.001) and SM (9.83 μ m vs. 12.16 μ m, p < 0.001) during the follow-up. BCVA deterioration was also significant ( 0.16 vs. 0.12 , p = 0.001), albeit uncorrelated with the change in cone parameters. No significant difference in REG was detected between the initial examination and the follow-up (p = 0.089).

1. Introduction

1.1. Inherited Retinal Dystrophies

Inherited retinal dystrophies (IRDs) comprise a heterogeneous group of rare diseases that result in bilateral, irreversible vision loss. Although IRDs are genetic conditions, they represent a diverse group with varying inheritance patterns. The most-common IRD is rod–cone dystrophy (RCD), e.g., retinitis pigmentosa (RP), which primarily affects rods, with cone degeneration in RP originating in the outer retina.
Among the IRDs primarily affecting the macula, Stargardt disease (STGD) is the most-prevalent, with an incidence rate of approximately 1 in 10,000. Its manifestations include central vision loss, dyschromatopsia, and macular abnormalities, forming a “bull’s eye” pattern. This maculopathy results from abnormal accumulation of lipofuscin deposits in the central macula, with degeneration primarily affecting the retinal pigment epithelium (RPE) in the macular region. STGD symptoms typically emerge in the second decade of life. Cone–rod dystrophy (CRD) and cone dystrophy (CD) are IRDs less common than Stargardt disease, affecting approximately 1 in 30,000 to 1 in 40,000 individuals. CRD involves the degeneration of both cones and rods, while CD affects only cones; both of these conditions are progressive. These dystrophies primarily affect the macula and disturb central vision. Clinically, both CD and CRD present similarly, with bull’s eye maculopathy and bone spicule cells in the outer retina. The inheritance of the aforementioned IRDs may be autosomal dominant, autosomal recessive, X-linked, or unresolved [1,2,3].
Numerous genes have been identified with mutations that can lead to various IRDs, making genetic testing complex. The most-common gene mutation in STGD is autosomal recessive, involving the ABCA4 gene, which encodes the ATP-binding cassette transporter protein found in photoreceptors. Over 900 ABCA4 disease-causing sequences have been identified, most of which are autosomal recessive. Some of the ABCA4 mutations are responsible for the occurrence of RCD, CD, and CRD [4,5]. Other genes implicated in STGD include ELOVL4 and PROM1.
Pathogenic mutations leading to CD and CRD can be located in genes encoding proteins involved in photoreception and the phototransduction cascade, such as OPN1MW and OPN1LW (encoding cone opsins) or in variants of PDE6C, PDE6H, CNGA3, and CNGB3 (encoding transporters involved in controlling cGMP intracellular concentration). Other mutations may occur in genes involved in photoreceptor outer segment morphogenesis, intraflagellar transport, and neurotransmitter release. Of the 32 gene mutations leading to CD or CRD, 6 exhibit a predilection for CD and 22 tend to result in CRD, but most mutations overlap. There are also forms of CD and CRD associated with mutations in ABCA4—the most-common gene affected in STGD—as well as mutations in RPGR, which most commonly leads to RCD [2]. A comprehensive list of genetic mutations leading to different IRDs can be found on RetNet (https://web.sph.uth.edu/RetNet/home.htm, accessed on 4 August 2023).

1.2. Diagnostic Methods in Inherited Retinal Dystrophies

A clinical diagnosis of an IRD is typically made based on the clinical image of the eye fundus, the patient’s history of vision loss in the first and second decades of life, and family history. Ancillary tests that aid in diagnosing IRDs include optical coherent tomography (OCT) of the macula, OCT angiography (OCTA), perimetry, electrophysiological testing (e.g., electroretinography (ERG)), fundus autofluorescence (FAF), and fluorescein angiography (FA) [5,6,7,8,9].
Monitoring of IRDs is challenging, and in most cases, universal guidelines for patient management are lacking.
The emergence of new methods for IRD evaluation is ongoing. These include emerging technologies such as adaptive optics (AO), adaptive optics OCT (AO-OCT), optoretinography, laser speckle flowgraphy, retinal oximetry, and functional magnetic resonance imaging [9,10]. Optoretinography maps the optical signal in response to a stimulus, whereas laser speckle flowgraphy enables real-time visualisation of circulation within ocular fundus structures. Retinal oximetry provides measurements of oxygen metabolism and oxygen diffusion from the choroidal circulation. Functional magnetic resonance imaging is a neuroimaging technique that records responses from the visual cortex. Adaptive optics, a ground-breaking technology, enables non-invasive imaging of retinal photoreceptors at the cellular level, making it a potent tool for visualising retinal pathologies. AO-OCT improves the quality of OCT imaging by correcting aberrations and mitigating quality degradation [9,10].

1.3. Therapy Perspectives in Inherited Retinal Dystrophies

Potential therapeutic techniques under development include gene supplementation, gene editing, antisense nucleotides, optogenetics, and stem-cell-based therapies. There is particular optimism for the successful treatment of IRDs with gene therapy [10]. The aim of these potential therapies is to slow down the degeneration of photoreceptors or improve their function.
The only currently available treatment for IRDs is gene therapy with voretigene neparvovec-rzyl (Luxturna®), approved by the Food and Drug Administration (FDA) in 2017 and the European Commission in 2018. Luxturna® targets the RPE65 gene, which is primarily responsible for Leber congenital amaurosis (LCA).
In STGD, a human treatment trial targeting the ABCA4 gene was initiated, but it was later halted by the sponsor (ClinicalTrials.gov ID: NCT01367444). Another active trial involves optogenetic therapy incorporating the injection of multi-characteristic opsin in eyes with STGD (NCT05417126). The results of gene therapy trials in RCD targeting the RPGR, RHO, PDE6A, PDE6B, and MCO genes are still awaited (NCT03252847, NCT03116113, NCT03316560, NCT05748873, NCT04945772). To our knowledge, there are no human clinical trials targeting CD and CRD listed on ClinicalTrials.gov. However, several trials target the CNGA3 and CNGB3 gene mutations in another IRD, achromatopsia (ACHM) (NCT03278873, NCT02610582).

1.4. The Use of Adaptive Optics in Ophthalmology

Adaptive optics (AO) is an imaging technique initially developed for precise visualisation in astronomy, where it corrected atmospheric irregularities. The aberration-correcting system provides high-quality imaging of distant objects [11,12]. This high-quality visualisation is used in ophthalmology to evaluate the microstructures of the human retina with the precision to visualise a single cell. The AO retinal exam is quick and non-invasive. The assessment of the rods, cones, and retinal pigment endothelium cells has found its application in the management of diabetic retinopathy, age-related macular degeneration, glaucoma, and IRDs. Another possible application of AO in ophthalmology is the visualisation and measurement of the parameters of retinal microvessels: veins and arteries, which may be useful in diabetic retinopathy, prediabetes, hypertension, and glaucoma [13,14,15]. When combined with OCT, AO enables 3D imaging of retinal structures such as photoreceptors and retinal pigment epithelium [9].
The characteristics of cone mosaic parameters in a healthy eye have been defined [16]. Cone density in the healthy adult population averages 19,453/mm 2 ; cone spacing is 7.96 μ m; Voronoi analysis of cones (which is the percentage of hexagonal cells) is 46.7%.
Adaptive optics retinal images depicting a healthy eye, CD, CRD, and STGD are presented in Figure 1, Figure 2, Figure 3 and Figure 4.
Figure 1 depicts the photoreceptor mosaic in a healthy eye. The image is taken paracentrally (2 ° superiorly) due to the limited ability of foveal image acquisition by Rtx™ [17]. By changing the focus point, the quality of an acquired image provides the assessment of photoreceptor parameters in parafoveal cones. The aberration and noise found in Figure 2, Figure 3 and Figure 4 are considered to be the result of poor fixation in eyes with impaired central vision in the course of macular disease. This issue has been addressed in our study. The assessment of factors predisposing for obtaining inadequate image quality was taken into consideration further in this article.
Cone mosaic disruption is an abnormality typical of IRDs. The cone and rod spacing is increased in IRDs compared to healthy retinas [18]. Additionally, poor image quality, likely resulting from inadequate fixation in eyes with low visual acuity, is a problem that, in some cases, makes image acquisition impossible [19,20]. In STGD, as well as in other IRDs, the “dark spaces” depicting areas of disrupted cone structure and abnormal cone reflectance have been described [21,22].
Rtx1™ (Imagine Eyes, Orsay, France) is an adaptive optics flood-illuminated ophthalmoscope (AOFIO) that uses infrared light (850 nm wavelength) with a 1.6 μm resolution. The image dimensions are 4 ° × 4 ° , which corresponds to approximately 1.2 mm × 1.2 mm of the retina. The observation of foveal cones in Rtx™ is limited, as mentioned above [17], so images of the extrafoveal retina are typically acquired. Researchers working with this device often bypass this limitation by choosing a parafoveal region for the analysis. The examined position can be selected (e.g., 2 ° superior, inferior, temporal, or nasal—as in our study). The image acquisition in a single position lasts 2–4 s, during which 40 individual images are acquired [13,23,24,25]. The Rtx1™ software provides two programs for data evaluation: AO Detect for the analysis of photoreceptors parameters and AO Detect Artery for the analysis of vessel parameters.
AO enables the visualisation of rods and cones, the two types of retinal photoreceptors. The parameters that adaptive optics can measure include: cone density, cone spacing, Voronoi analysis of hexagonal cells, reflectivity, regularity, metrics for the preferred orientation of cones, and local spatial anisotropy [6,16,17,26].
In our study, we analysed cone parameters: cone density (DM), cone spacing (SM), and cone regularity (REG). The abbreviations DM, SM, and REG are used by the AO Detect program and are further used in this article.
DM is expressed in 1/mm 2 ; it is inversely correlated with SM, which measures the neighbour distance of each cone. REG (expressed in %) is important for providing the exclusion of inaccuracies caused by cell identification errors [17]. Our study focused on the use of AO in IRDs, specifically CD, CRD, and STGD, over a 6-year observation period. We performed AO retinal examinations twice over a 6-year observation period.

2. Materials and Methods

The study included 56 eyes from 28 patients who had been diagnosed with Stargardt disease (STGD) (38 eyes of 19 patients), cone dystrophy (CD) (10 eyes of 5 patients), or cone–rod dystrophy (CRD) (8 eyes of 4 patients). One eye, belonging to a female patient diagnosed with CD, was excluded from the analysis of photoreceptor parameters because it was not possible to obtain a good-quality image in any quadrant during the follow-up check. However, this eye was included in the analysis of factors that could potentially lead to incomplete data acquisition.
The examinations occurred in 2015 and were repeated in 2021, conducted at the Department of Ophthalmology, Medical University of Warsaw, in the SPKSO Ophthalmic University Hospital.
Each patient received his/her respective diagnosis of CD, CRD, or STGD through an evaluation that incorporated the clinical appearance of the eye fundus, FAF, AF, perimetry, and electrophysiological testing. Genetic testing was carried out in 20 patients, 13 of whom with STGD tested positive for ABCA4 mutations. In the remaining patients, no mutation causing their conditions was found.
The exclusion criteria for the study encompassed other ocular pathologies such as glaucoma, cataract, previous ocular surgeries, history of uveitis, obesity (body mass index (BMI) > 30 kg/m 2 ), and diabetes. Each participant, and parents of those under 18, provided written consent. This study adhered to the tenets of the Declaration of Helsinki and secured approval from the bioethics committee of the Medical University of Warsaw (KB/87/2015).
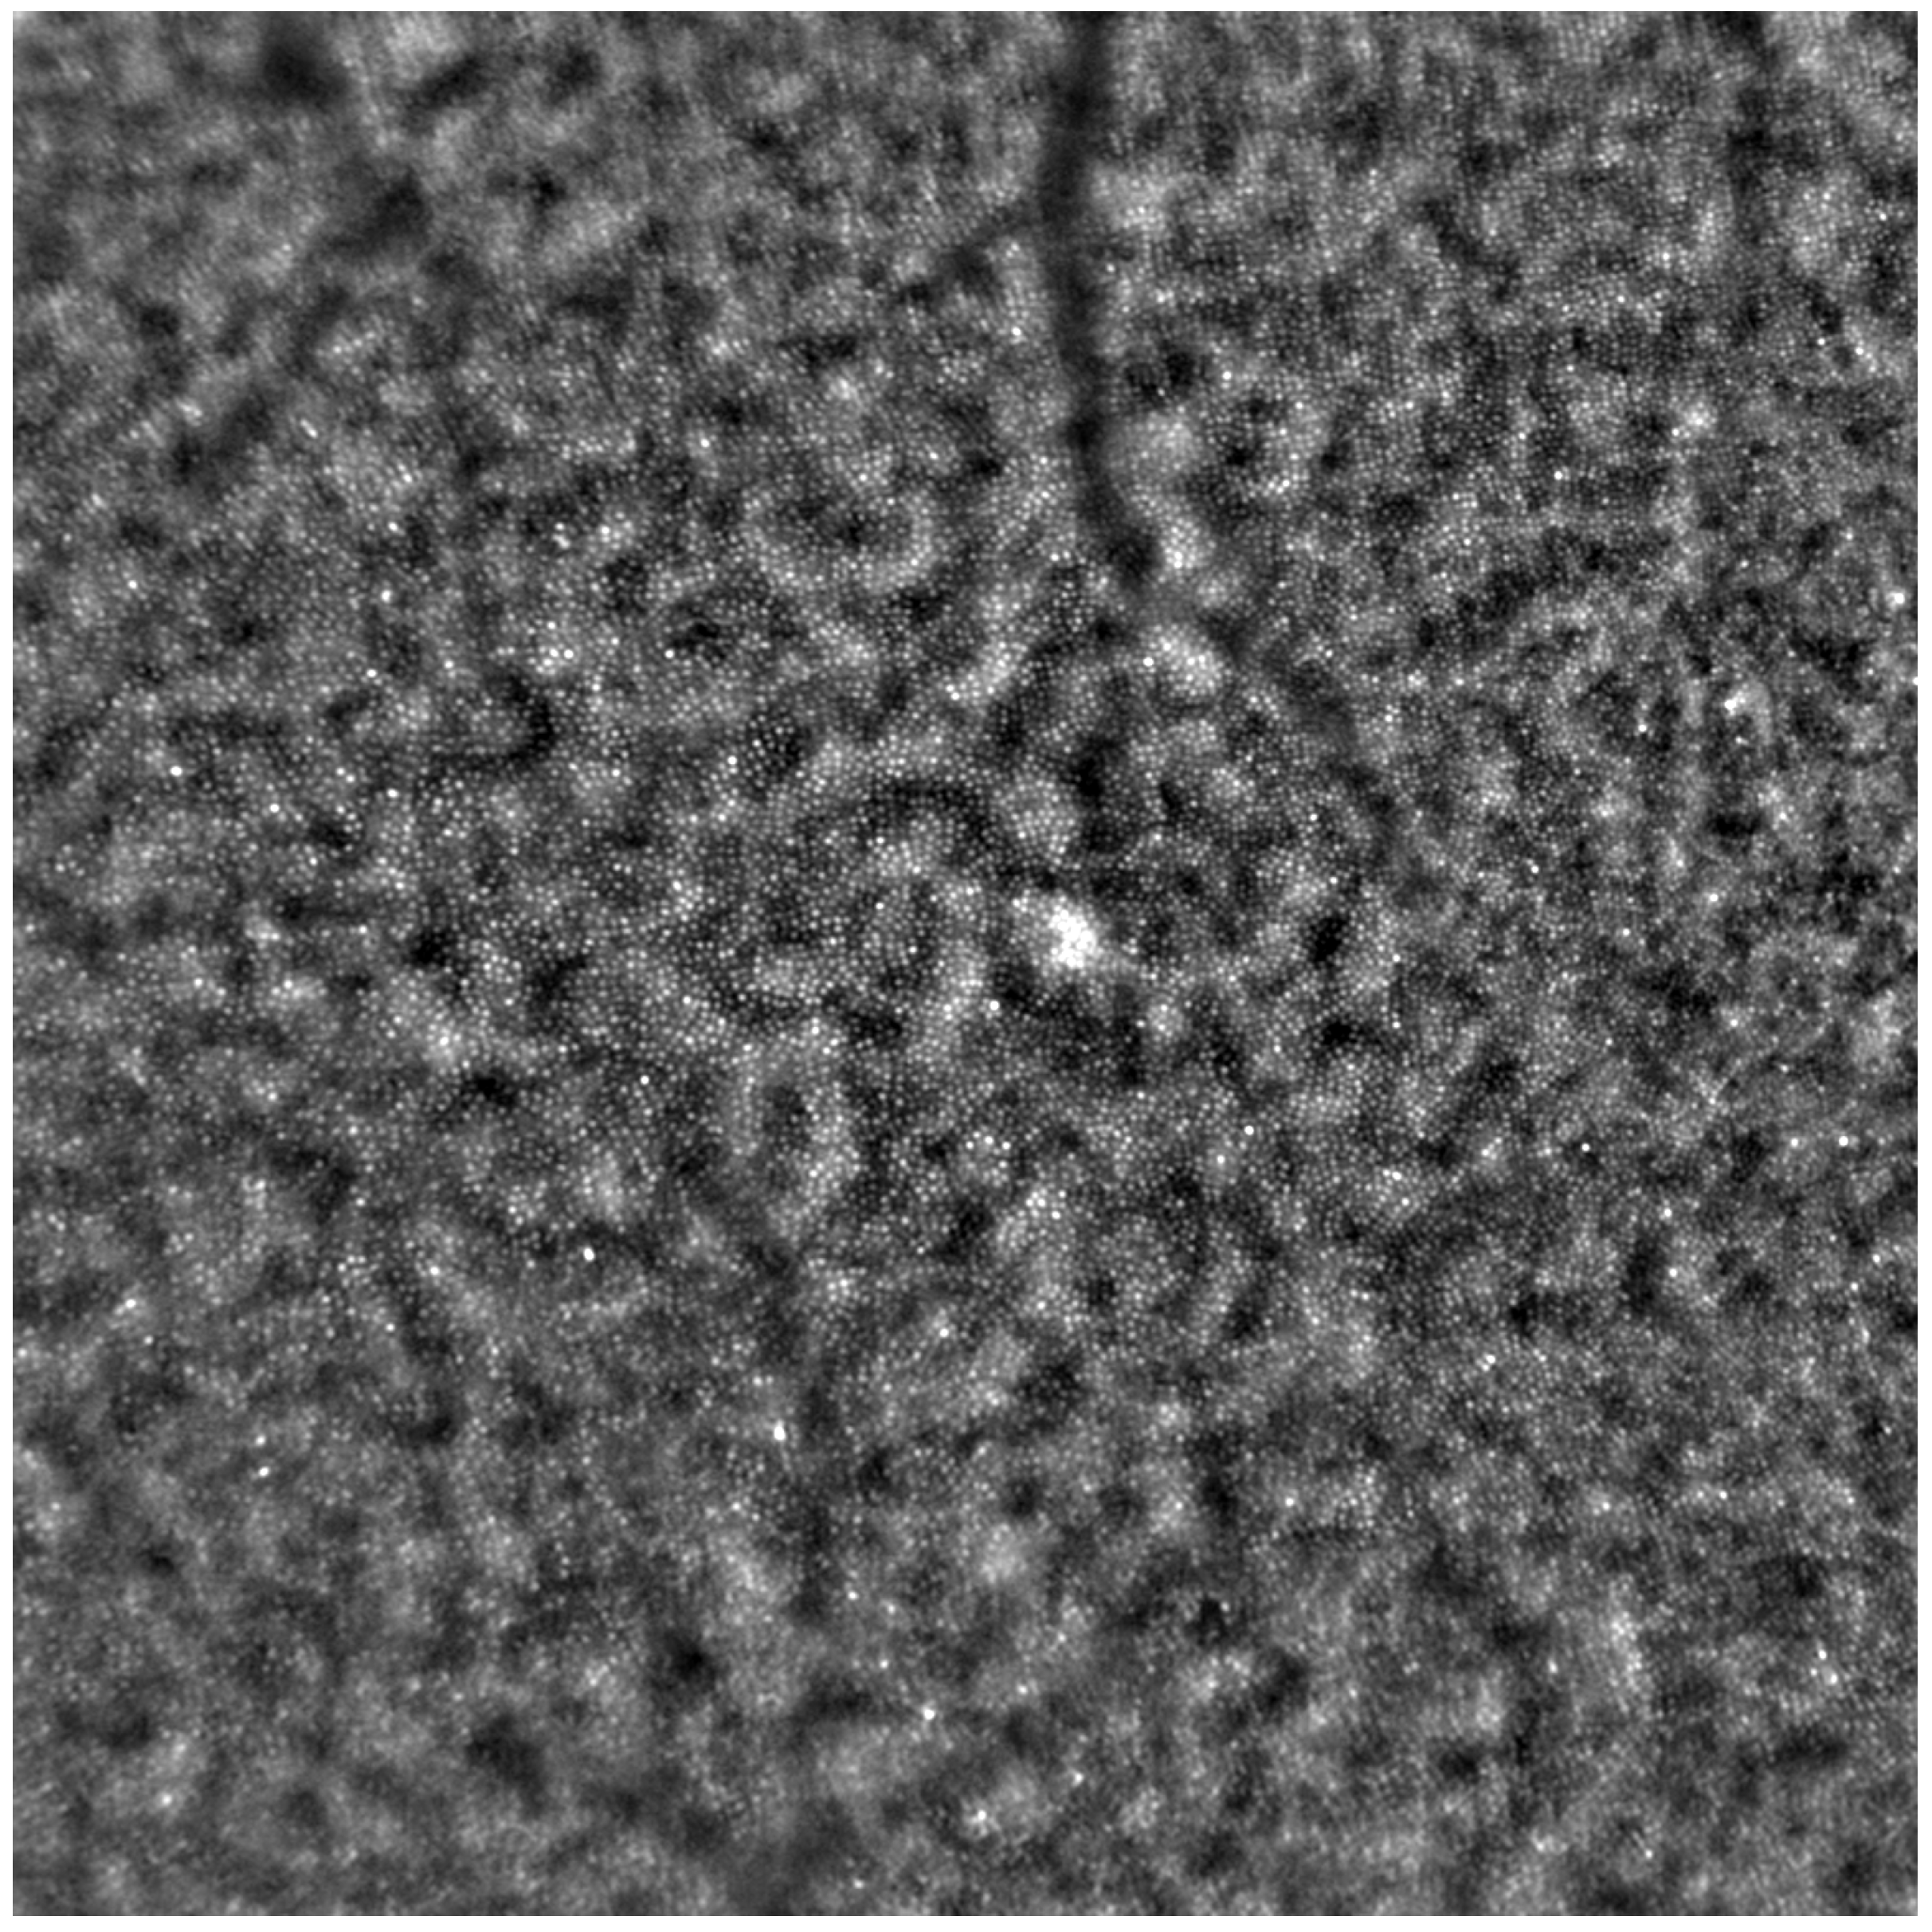
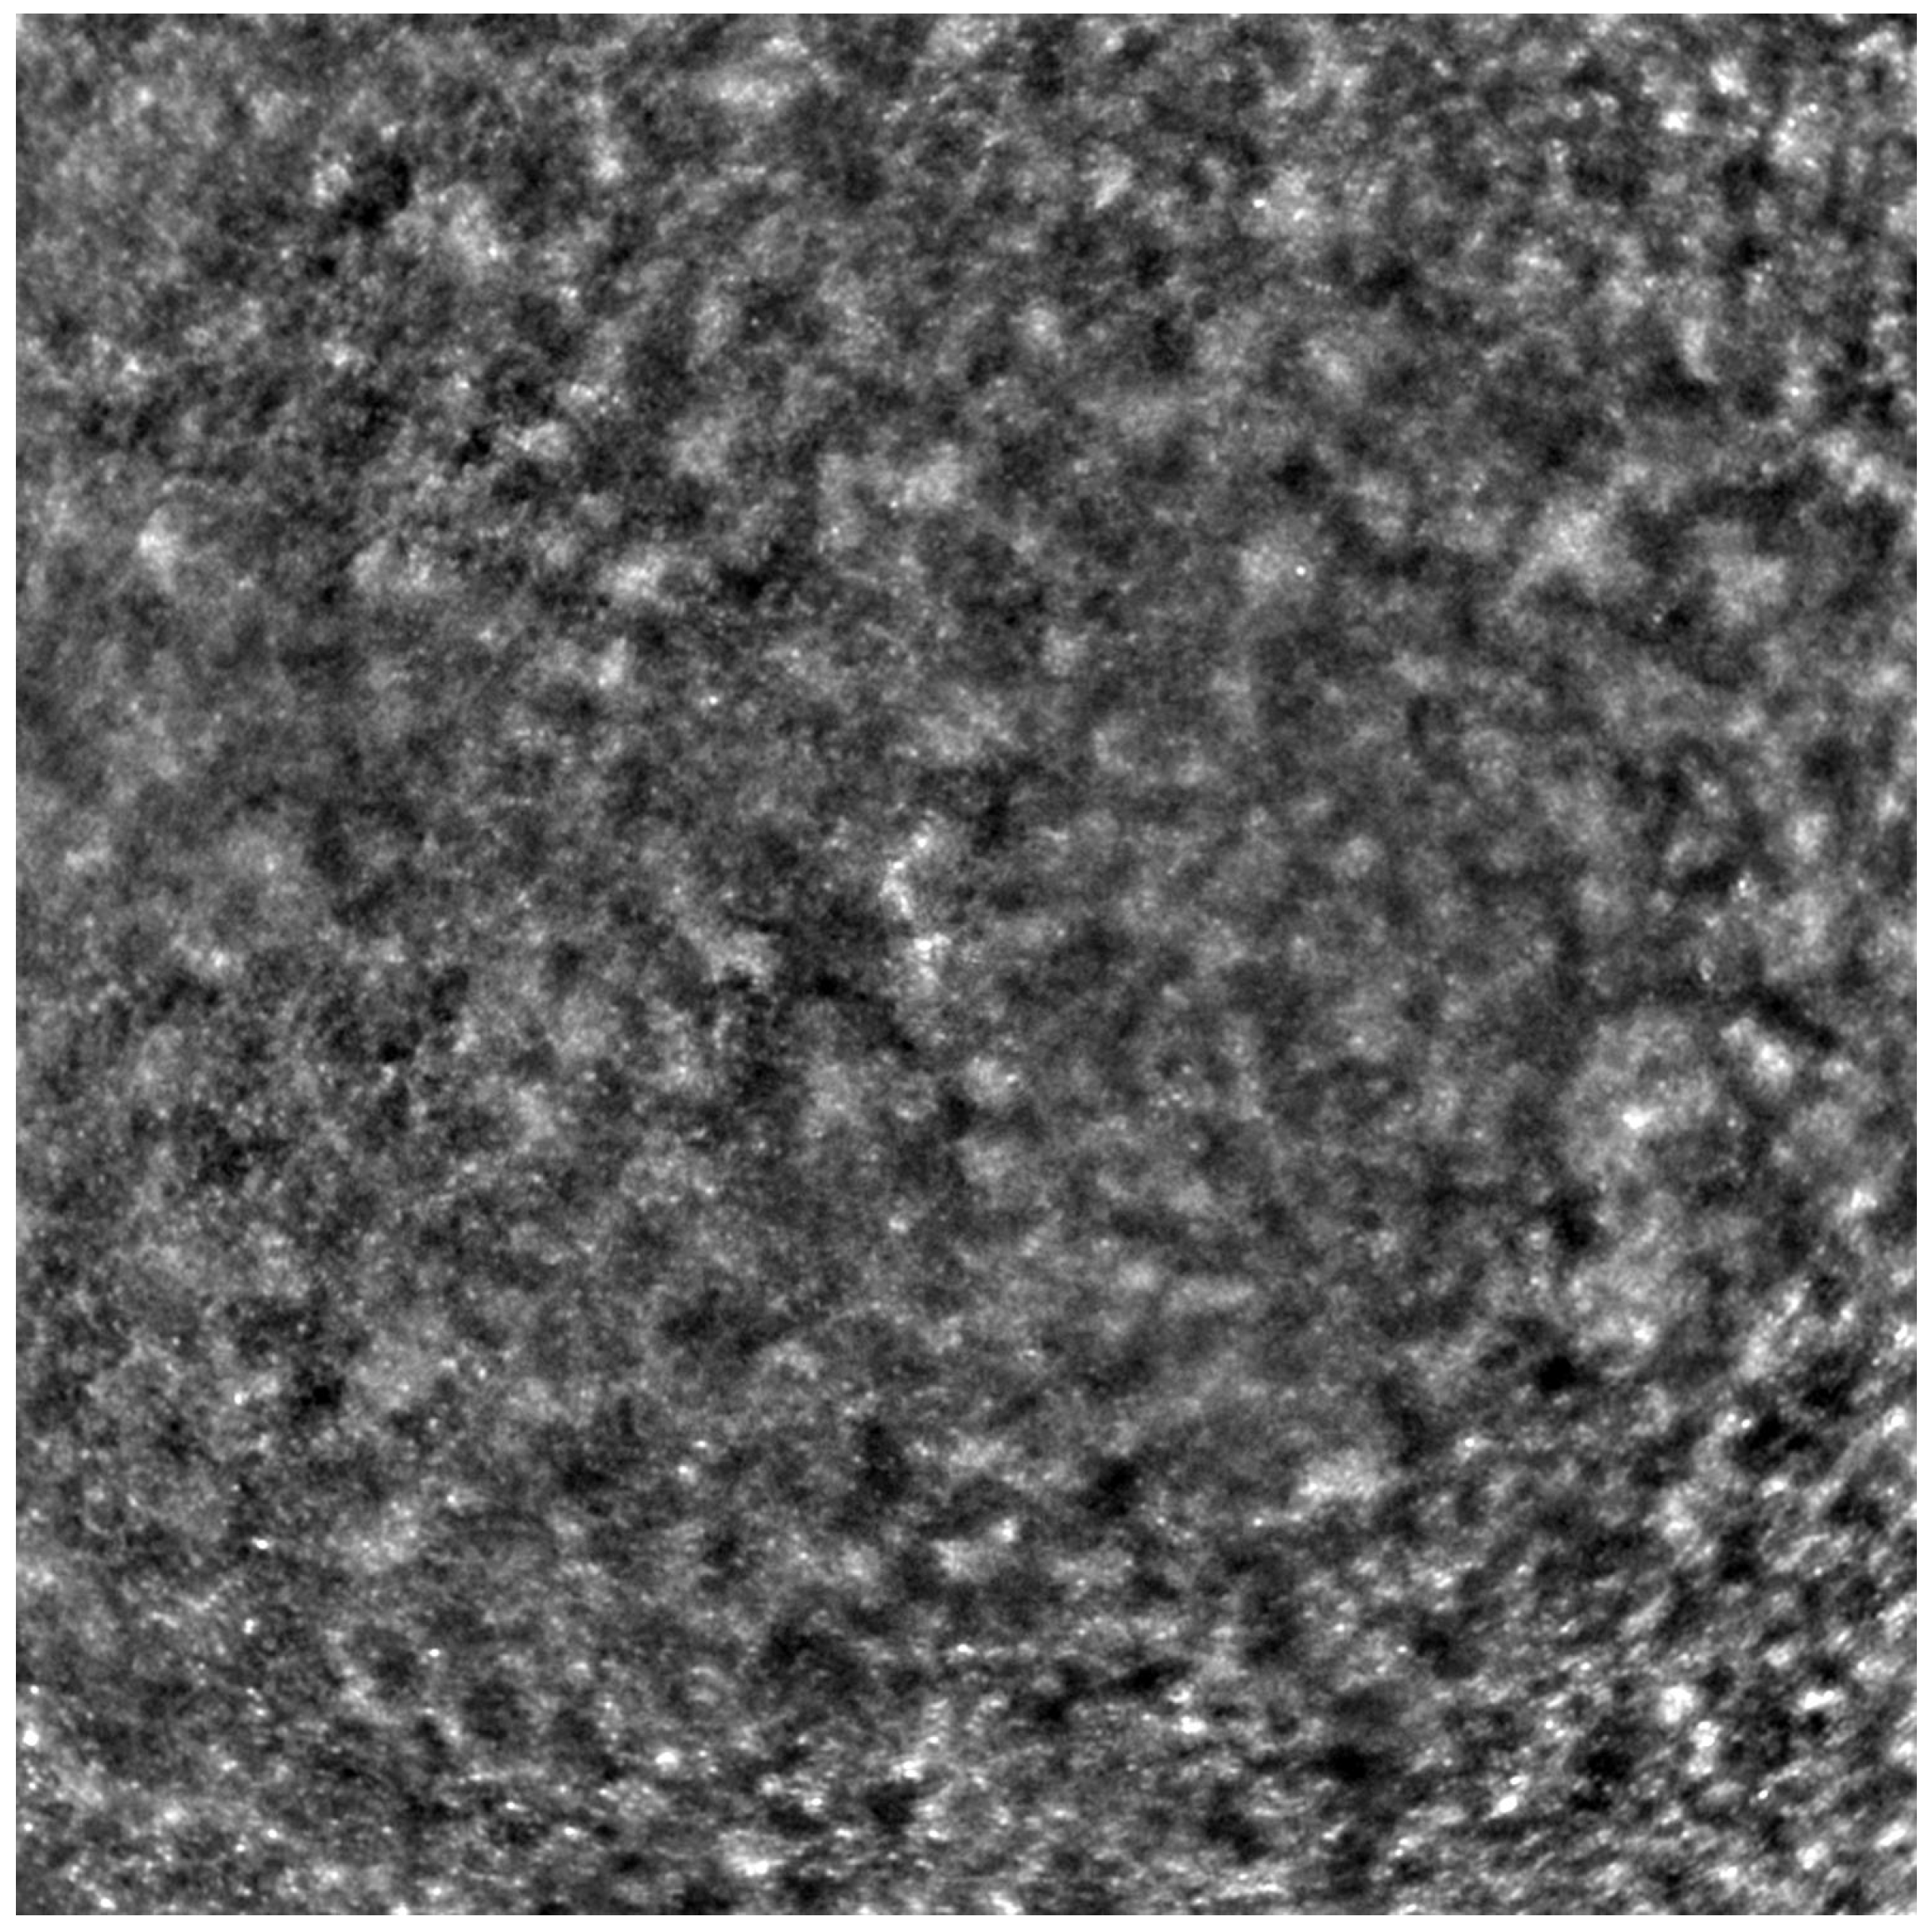
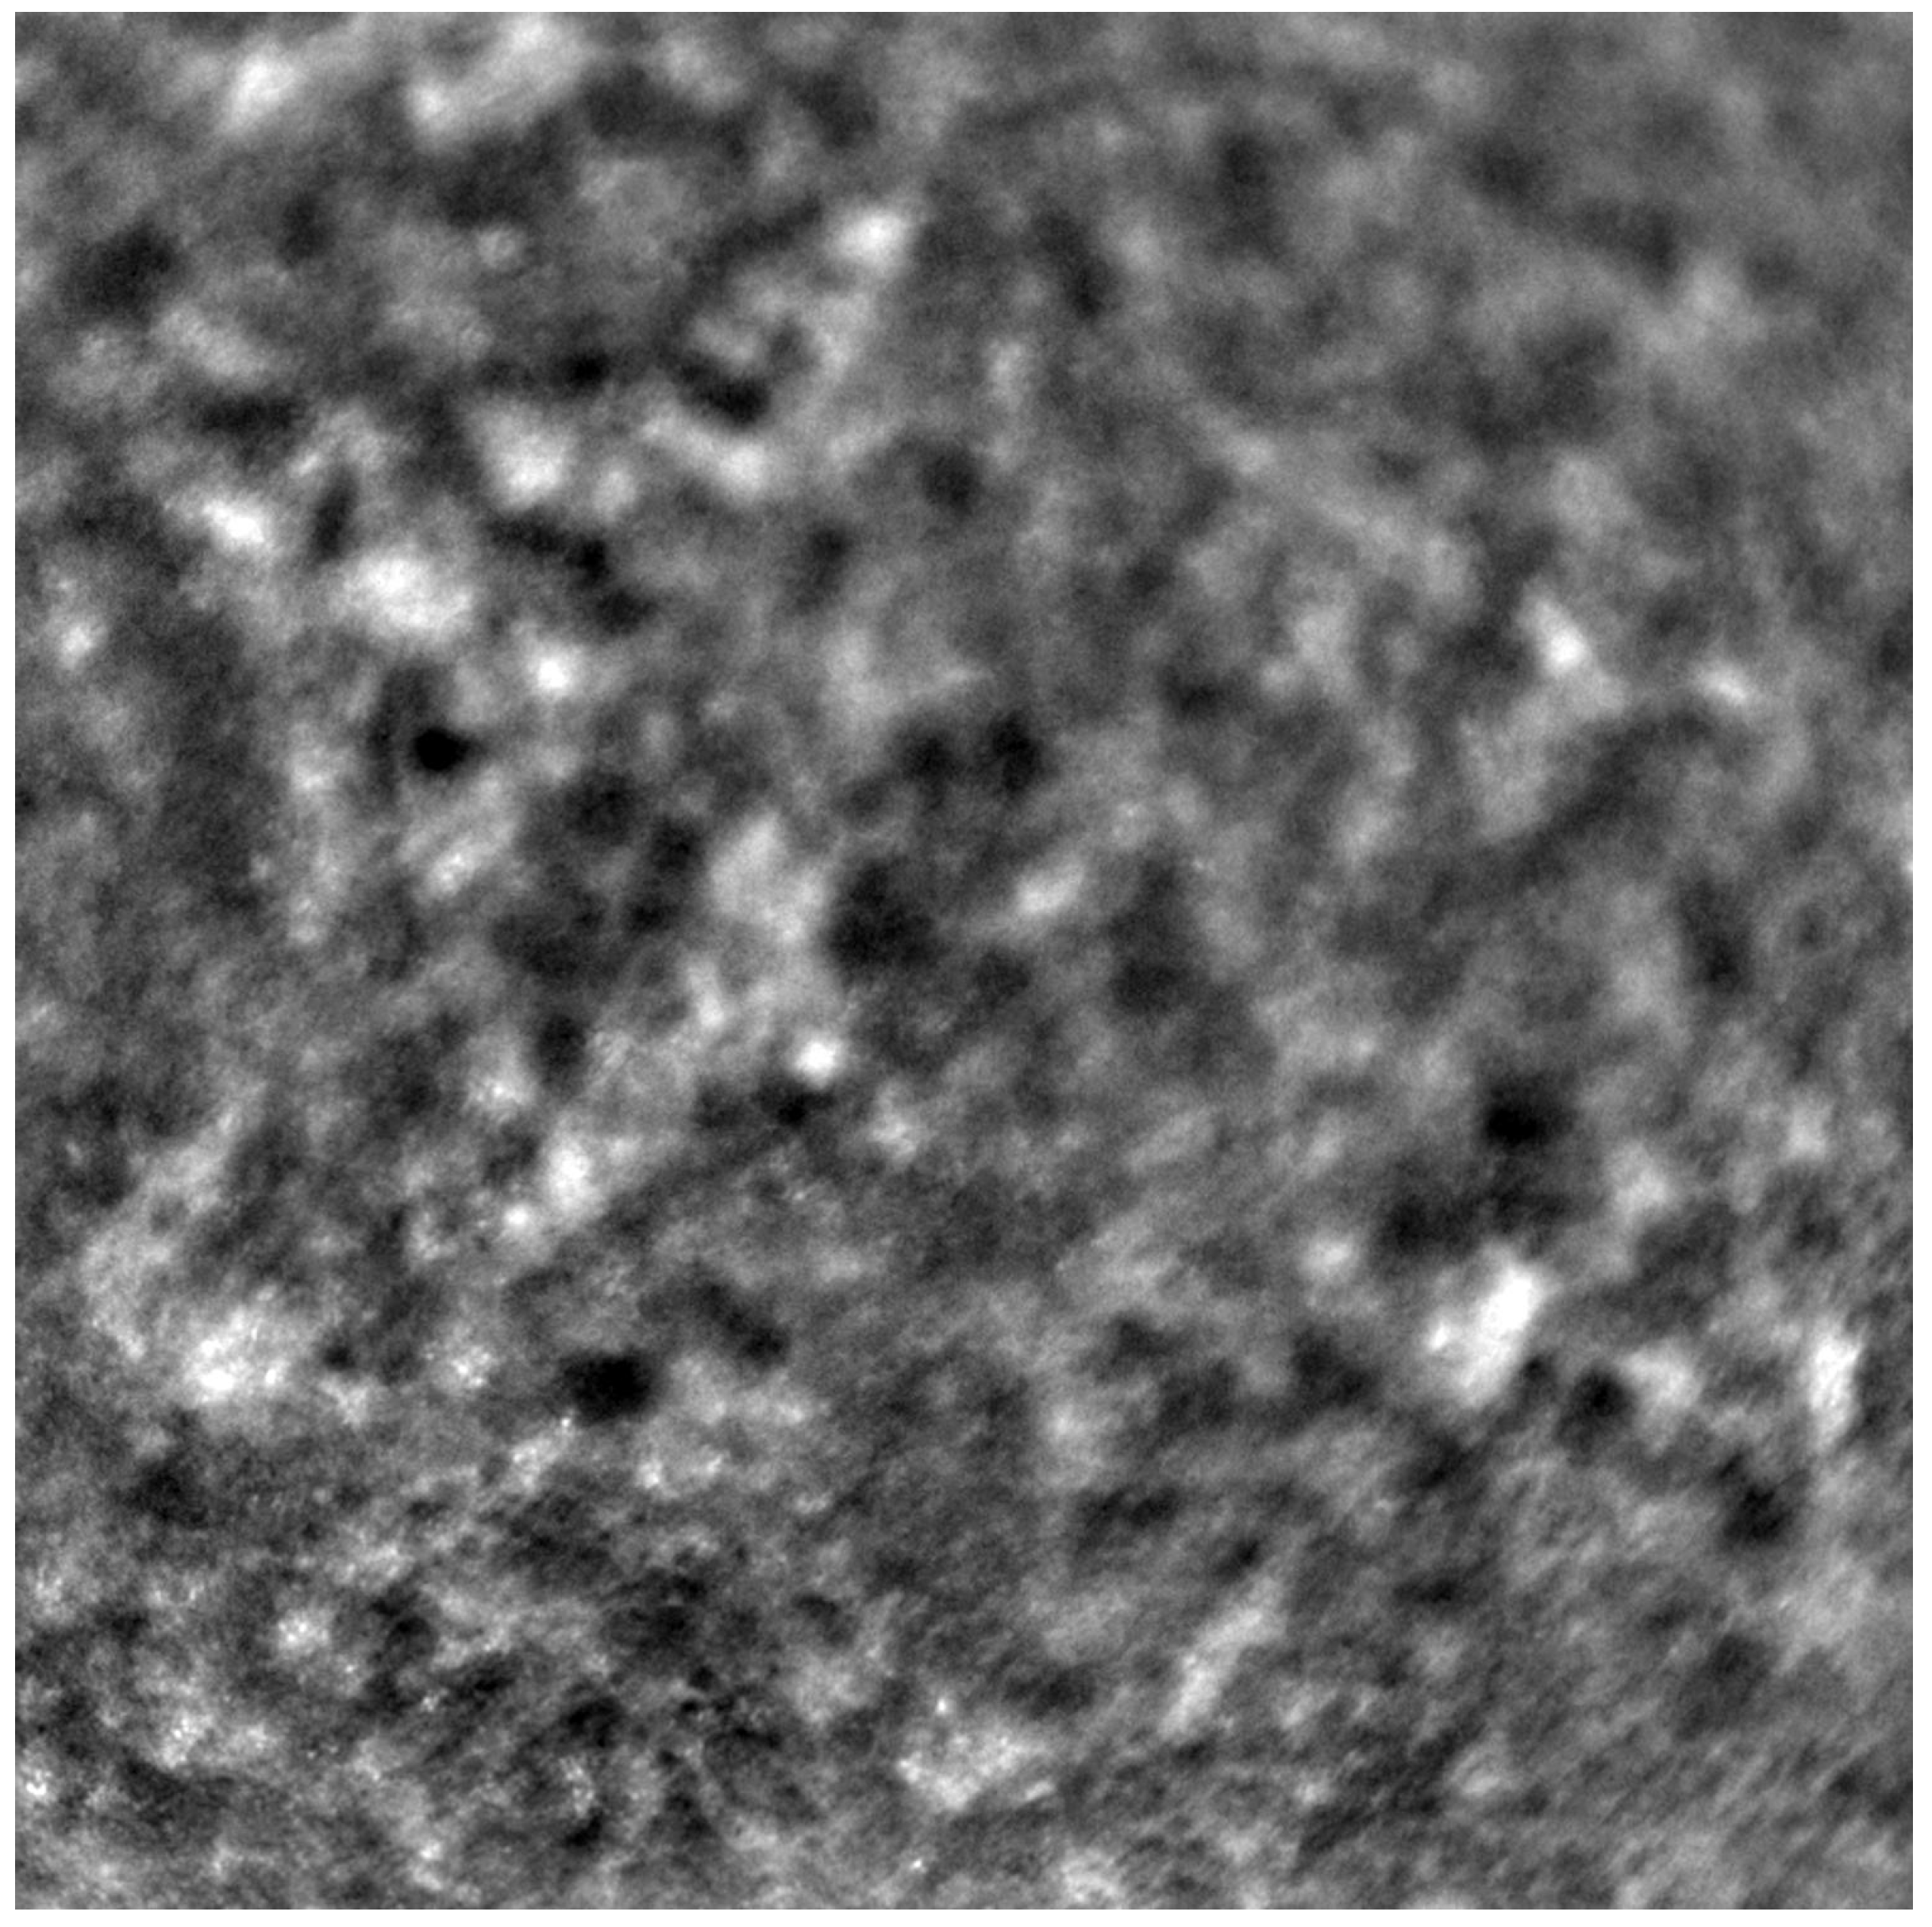
Before each examination, the best corrected visual acuity (BCVA) was checked using a Snellen chart, and the axial length of each eye was measured (LS 900; Haag-Streit; Koeniz, Switzerland). After mydriasis was induced using one drop of 1% tropicamide administered into each eye, the Rtx1™ (Imagine Eyes, France) test was performed. The acquired images were processed with the AO Detect program (version 3.4, also known as AO Image 3.4, Imagine Eyes, Orsay, France), providing numeric values for photoreceptor parameters: DM, cone density; SM, cone spacing; REG, cone regularity.
Each patient’s eyes were examined using Rtx1™ (Imagine Eyes, France), measuring four positions in each eye: 2 ° away from the fixation point in the superior, inferior, temporal, and nasal quadrants. The area selected for analysis was taken from within the examined frame, specifically in a location where the image quality was adequate for conducting a quantitative analysis.
Due to the poor quality of some scans, the image positions were not considered for subsequent statistical analysis. Instead, we computed the average values from all positions where image acquisition was possible.
Demographic data for patients at initial presentation are detailed in Table 1. The values of BCVA, DM, SM, and cone regularity are shown in Table 2 for the initial check and in Table 3 for the follow-up check.
Data underwent normal distribution testing using the Shapiro–Wilk test. For normal distributions, Student’s t-test was used to compare the mean values of independent variables. If the normality assumption was violated, we employed the non-parametric Mann–Whitney U-test to compare continuous variables between two groups of observations. For comparisons involving more than two groups (as in our case, where three diagnosis types existed), we used one-way ANOVA (for parametric tests) or the Kruskal–Wallis test (for non-parametric tests). These tests were followed by either the HSD Tukey’s post hoc test (ANOVA) or Dunn’s post hoc test (Kruskal–Wallis), with results adjusted using the Bonferroni method. For this analysis, we set the level of statistical significance to p = 0.05. All calculations were carried out in R (Version 4.0.2).

3. Outcomes

3.1. BCVA Change during the 6-Year Observation Period

There was a significant change in BCVA observed between the examinations in 2015 and 2021: 0.16 vs. 0.12 (p = 0.001), as shown in Table 4. This change was also observed when analysing the right eyes (p = 0.024, Table 5) and left eyes (p = 0.021, Table 6) separately.
BCVA was not found to differ significantly between diagnoses in the initial examination (p = 0.102, Table 2), nor in the follow-up (p = 0.111, Table 3). Moreover, the BCVA change over the 6-year follow-up was not correlated with the diagnosis (p = 0.705, Table 7).

3.2. Change in DM and SM during the 6-Year Observation Period

During the 6-year observation period, there was a significant decrease in DM (−3008.25/ mm 2 , SD = 3059.45/ mm 2 , p < 0.001) and an increase in SM (2.5 μ m, SD = 4.13 μ m, p < 0.001), as shown in Table 4. This significance was consistent when the calculations were performed separately for the right (p = 0.006 for DM and p = 0.002 for SM) and left eyes (p < 0.001 for both DM and SM), as shown in Table 5 and Table 6.

3.3. Correlation between Cone Parameters and Diagnosis

The lowest mean DM and highest mean SM were found in patients with STGD. Both the DM and REG parameters differed significantly between eyes with a different diagnoses (p = 0.032 for DM (Kruskal–Wallis test), p < 0.001 for REG (Kruskal–Wallis test) in the initial examination (Table 2). However, these findings were not confirmed in the follow-up exam (Table 3).
Regarding the change in cone parameters over the 6-year observation period, the highest DM change was noted in the CD group (−3697.39/ mm 2 ), compared to the STGD (−3092.98/ mm 2 ) and CRD (−1883.46/ mm 2 ) groups. The highest SM change was observed in the STGD group (2.8 μ m), compared to the CD (1.96 μ m) and CRD (1.87 μ m) groups. However, the intergroup difference in the DM and SM change was not significant (p = 0.338 for DM change, p = 0.308 for SM change), as shown in Table 7.

3.4. Change in REG during 6-Year Observation Period

No significant difference was observed between REG values from the initial and follow-up checks (86.44% vs. 84.37%, p = 0.089 for both eyes; 86.0% vs. 83.25%, p = 0.160 for right eyes only; 86.92% vs. 85.57%, p = 0.182 for left eyes only), as shown in Table 4, Table 5 and Table 6.

3.5. Correlation between BCVA Change, Cone Parameters Change, and Patient’s Sex

The decrease in the DM and increase in the SM parameters were significantly higher in females than in males, as depicted in Figure 5 and Figure 6 and Table 8. Changes in DM and SM varied between the sexes. The mean DM change was (−1908.26/ mm 2 ) for males and (−3804.8/ mm 2 ) for females (p = 0.025). The mean SM change was 1.46 μ m for males and 3.25 μ m for females (p = 0.021). The changes in BCVA (−0.03 in males vs. −0.05 in females) and REG (−1.54% in males vs. −2.86% in females) were not significantly correlated with sex (p = 0.748 for BCVA change, p = 0.507 for REG change).

3.6. Correlation of DM Change over 6-Year Observation with BCVA and AO Parameters

The investigation aimed to ascertain whether the decrease in DM during the observation correlated with a functional parameter: BCVA. The Spearman analysis revealed no correlation between DM change from the initial measurement to the follow-up and either initial BCVA (p = 0.302) or BCVA change over the 6-year observation (p = 0.847), as illustrated in Table 9. However, a significant correlation was noted between DM change and REG deterioration over the observation period (p = 0.036). A robust correlation was also found between DM and SM change (correlation coefficient (r) = −0.856, p < 0.001), which stems from the definition of SM and DM.

3.7. Correlation of Cone Parameters with Patients’ Age

There was no observed correlation between patients’ age and either DM (p = 0.290) or SM (p = 0.185), as demonstrated in Table 10. Additionally, there was no correlation between DM change during the observation period and patients’ age (p = 0.223), as shown in Table 9.

3.8. Analysis of Factors Augmenting the Probability of Incomplete Data Acquisition

As previously mentioned, it was sometimes impossible to acquire an image of sufficient quality for analysis in all four examined quadrants. We conducted an analysis to identify the factors that increase the probability of incomplete data acquisition. The results of this analysis are presented in Table 11 and Table 12.
The ratio of incomplete data collection was 50% during the initial check and 33.9% during the follow-up. Factors such as patients’ age, sex, diagnosis, and BCVA were not found to be correlated with incomplete data acquisition. However, incomplete data collection was significantly associated with low DM (p < 0.001 during the initial check, p = 0.004 during the follow-up) and high SM (p < 0.001 during the initial check, p = 0.013 during the follow-up). Low REG was also identified as a factor contributing to incomplete data collection during the initial check (p < 0.001), but not during the follow-up (p = 0.357).

4. Discussion

Our study corroborates that the progression of CD, CRD, and STGD can be accurately tracked based on cone parameters with AO. We observed a deterioration in visual acuity (BCVA), a loss of cone density (DM), and an increase in cone spacing (SM) over a 6-year observation period. However, the changes in cone parameters did not correlate with the loss of BCVA in our study. We hypothesise that, due to the low standard deviation of the functional parameter used in our study (BCVA), the correlation of the morphological and functional parameters cannot be stated. The development of advancements in electrophysiology testing, such as multifocal electroretinography, as well as assessing the patients in early stages of disease, might be crucial for determining the real dependence of anatomical changes in photoreceptors on visual function.
Our goal was to discern whether differences existed in the adaptive optics cone parameters in eyes diagnosed with CD, CRD, and STGD. In both the initial exam of the study described in this article and in our other study [20], we found differences in DM, SM, and REG among the different diagnosis groups. However, these differences were not confirmed in the follow-up of our current study. We also did not find significant differences among the groups in terms of the DM, SM, and REG changes over time. This observation underscores the need for further longitudinal research on AO visualisation in eyes with IRDs, which would validate our findings.
The correlation between DM change and REG change may suggest a loss of quality in AO data with the progression of photoreceptor loss. However, since REG did not differ significantly between the initial check and the follow-up, we can infer that the quality of the obtained images of the cones was consistent across both examinations. More research is still required to confirm this correlation.
The highest BCVA was noted in the CRD group (0.32 on initial check, 0.28 on follow-up) and the lowest in the STGD group (0.13 on initial check, 0.09 on follow-up). The BCVA in the CD group was 0.17 on the initial check and 0.15 at the follow-up. Other clinical studies have confirmed that vision deterioration proceeds more slowly in CRD than in CD. Furthermore, nyctalopia is less common in patients with CRD [2,27]. However, in our study, BCVA deterioration over a 6-year period was not correlated with the diagnosis of CD, CRD, or STGD.
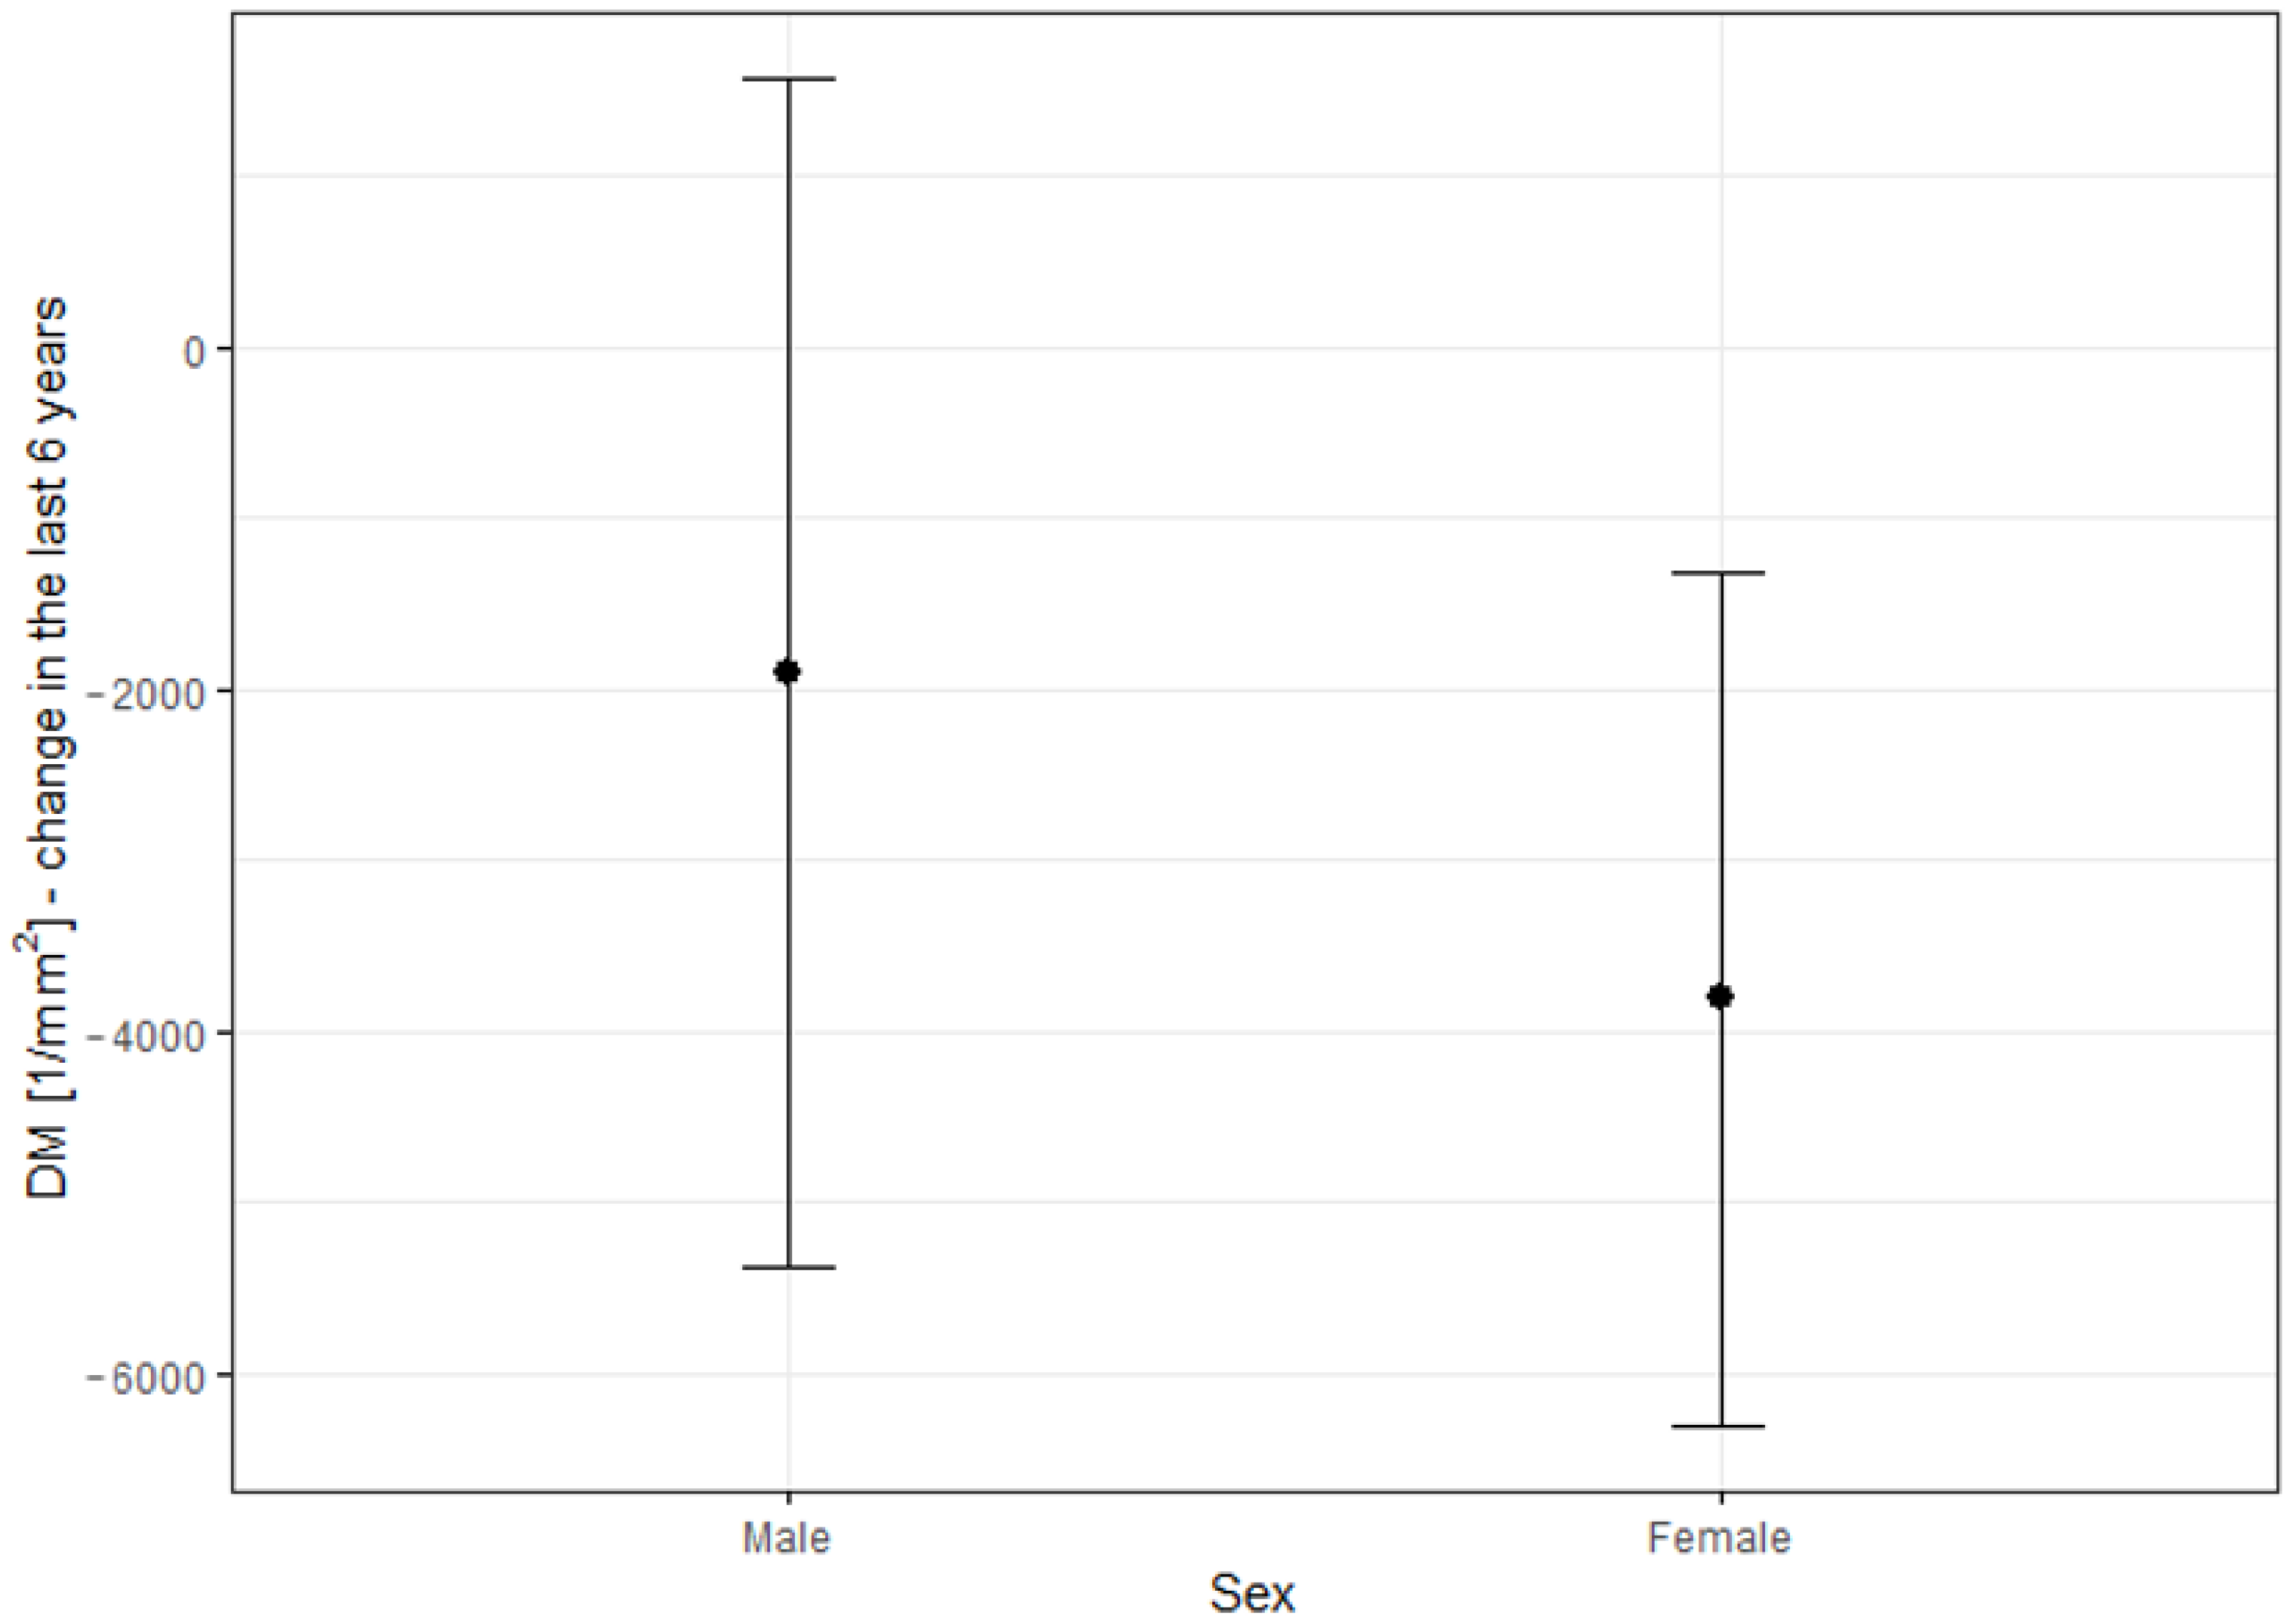
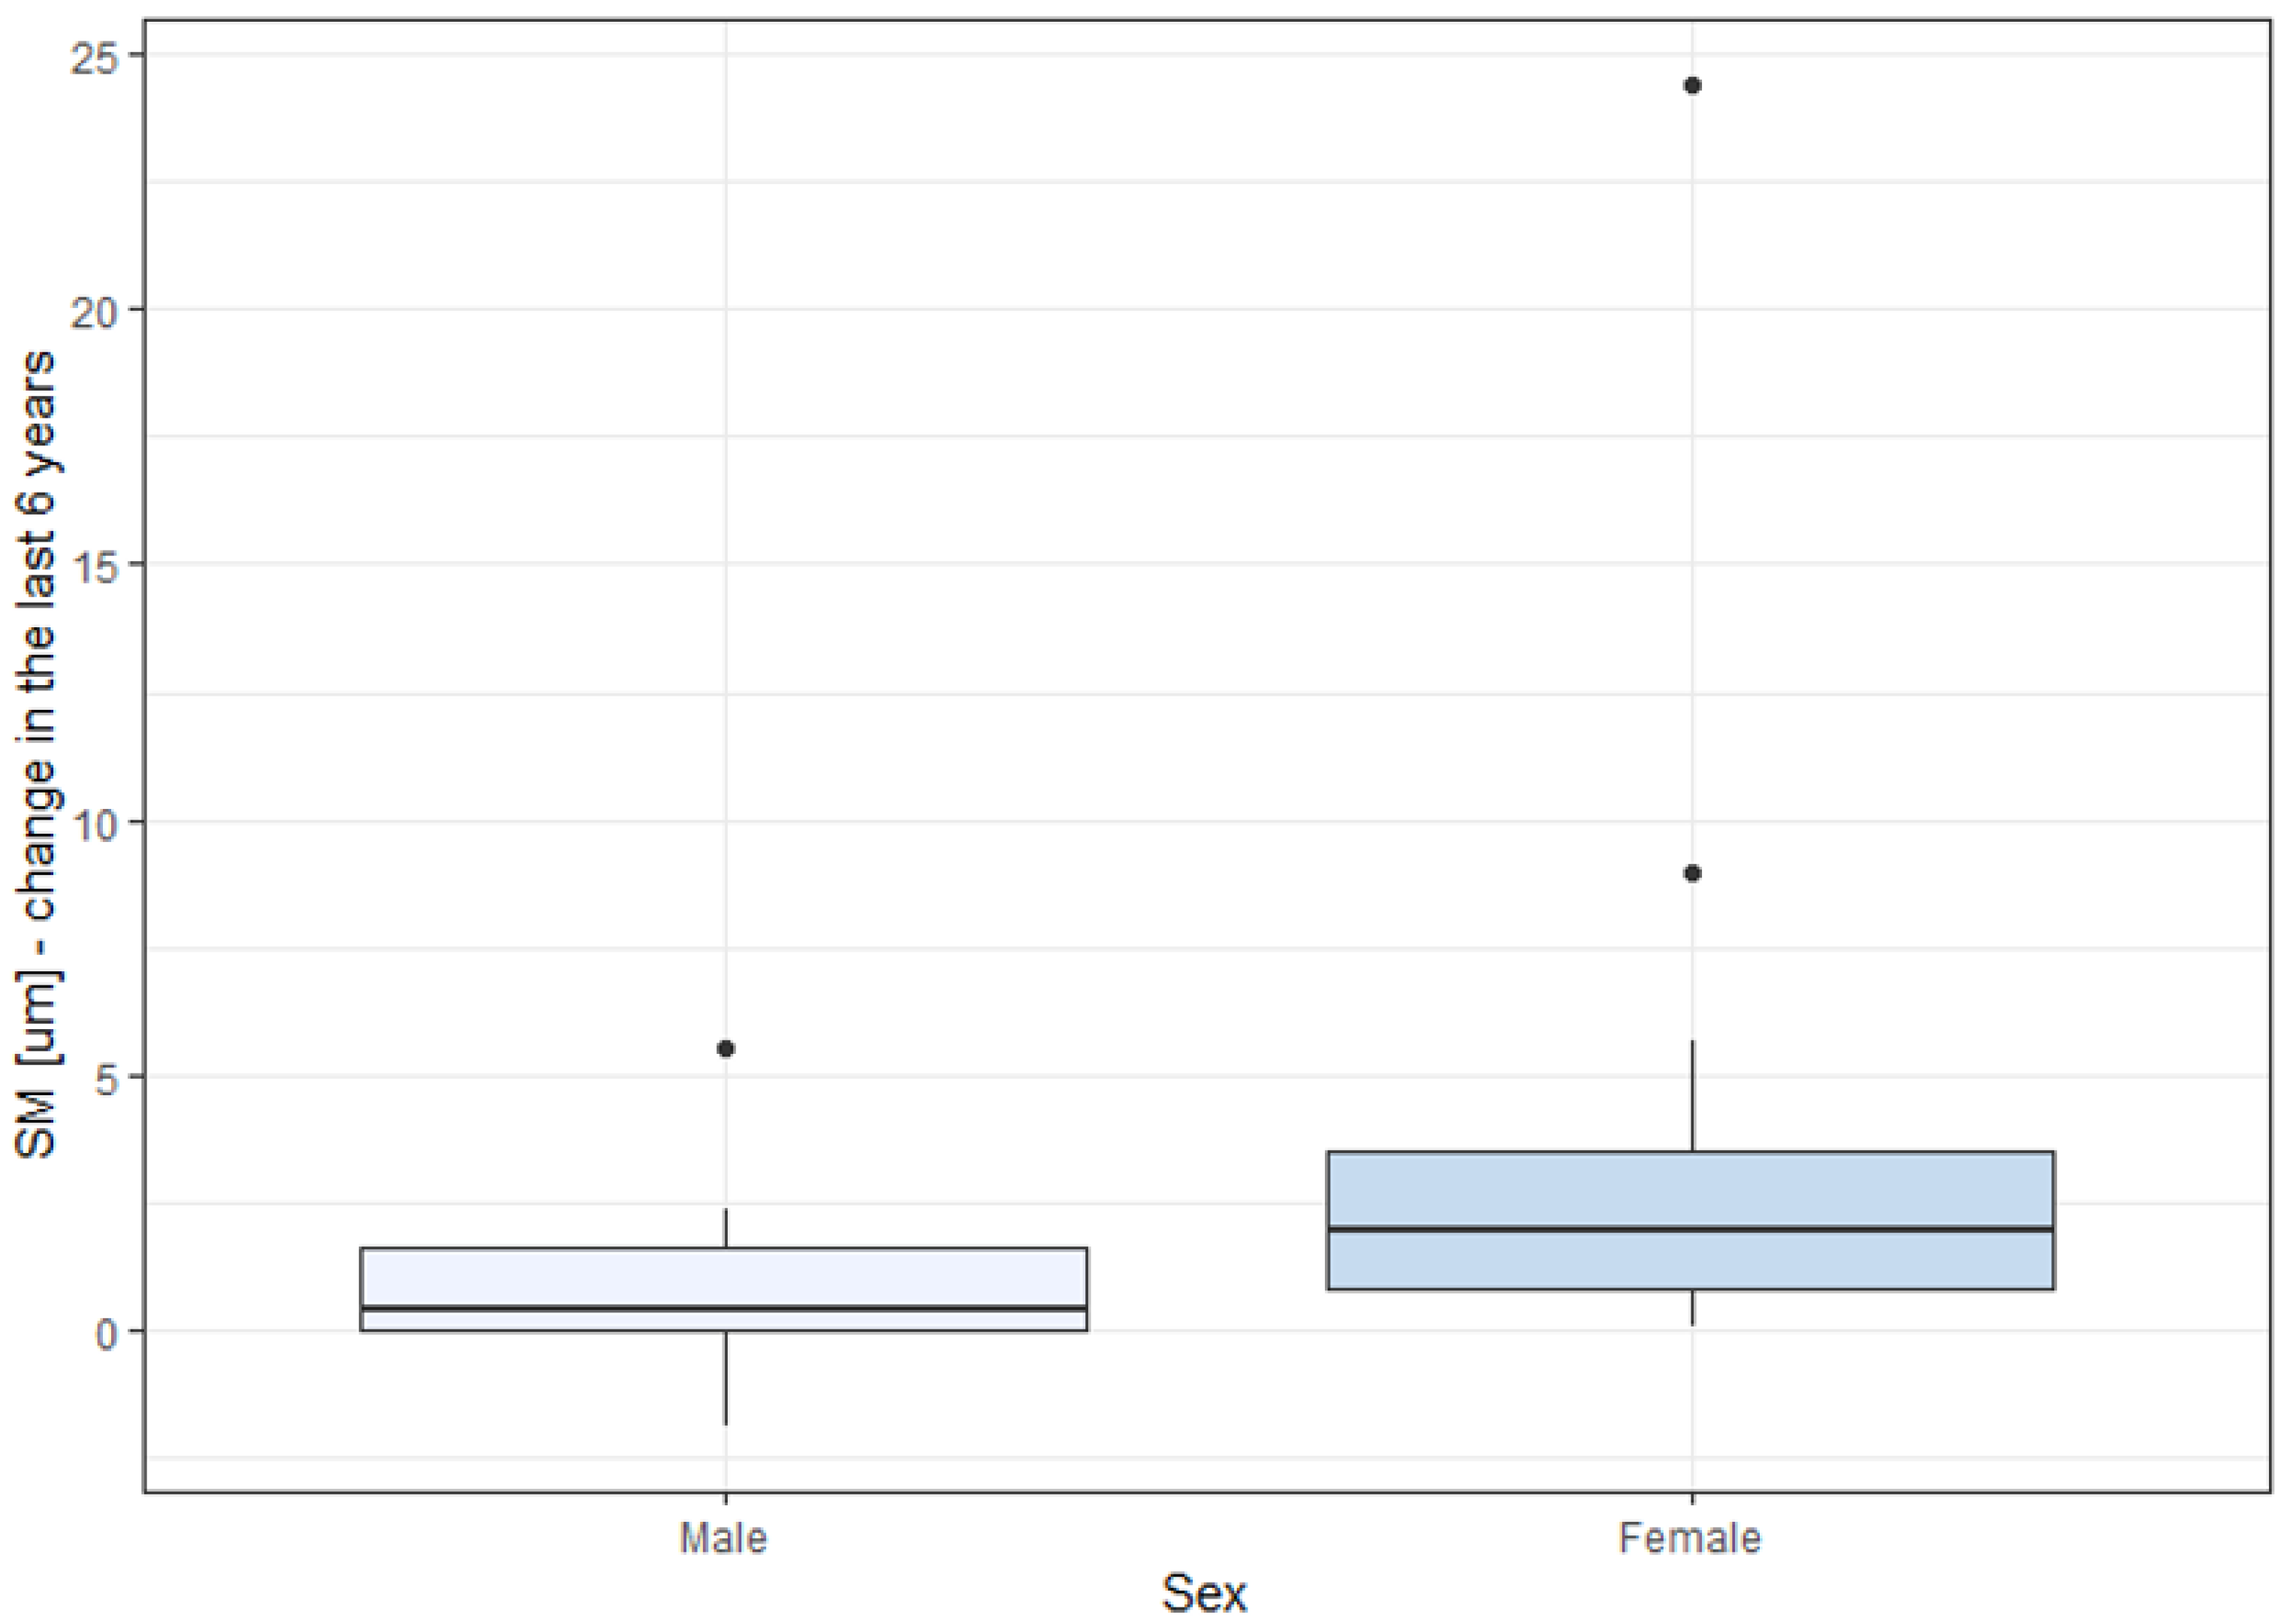
Changes in DM and SM over the six-year observation period were significantly higher in females than in males. This might be due to the higher percentage of females in the STGD group (57.1%, 16 women), compared to other groups. The percentages of females in the CD and CRD groups were 55.6% and 25%, corresponding to 5 and 2 women, respectively, indicating a small group size for reliable statistical analysis. To our knowledge, other studies have not reported a quicker progression of IRDs in females than in males. The observation of the greater prevalence of SM and DM changes in women with IRDs needs to be validated in future studies.
No inter-eye differences were noted in terms of cone density in our study, consistent with our previous study conducted on healthy eyes [16].
The rarity of inherited retinal dystrophies in the population constrained the number of patients in the study group. Several studies have compared AO imaging outcomes between eyes with IRDs and healthy eyes. For instance, Duncan et al. [28] contrasted 5 eyes with RP, 3 eyes with CRD, and 8 healthy eyes. Nakatake et al. [29] analysed 14 eyes with RP alongside 10 healthy controls. Additionally, Giannini et al. [30] included a range of conditions: 4 eyes with RP, 1 eye with best corrected macular dystrophy, 1 eye with occult macular dystrophy, 2 eyes with macular drusen, 4 eyes with nonproliferative diabetic retinopathy, and 20 healthy subjects. However, none of these studies provided longitudinal observations.
To our knowledge, no study other than ours has longitudinally assessed eyes with CD, CRD, or STGD. However, other reports on various IRDs do exist. For instance, a study on 16 eyes with RCD confirmed the correlation of AO changes with retinal thickness and findings in microperimetry, as well as a significant decline in cone spacing over a 3-year observation in the study group with no significant decline in healthy subjects [31].
Ueda-Consolvo et al. [32] carried out a study on 12 eyes of six patients with RP, aged 19–63, confirming the deterioration in cone density over a 2-year follow-up. BCVA was found to deteriorate in only one of six patients. This study did not include healthy controls. An observational case series by Ziccardi et al. [33] suggested the possibility of monitoring the progression of RP based on three probands over two years. A more-recent study [34] offered a short-term observation with AO imaging of eight patients with RCD and 10 healthy eyes, confirming the change of DM over a 6-month observation period in rod–cone dystrophy, but did not provide a longitudinal observation of healthy subjects.
Another publication reported the outcomes of imaging the eyes with RCDs [22], including patients who underwent neparovovec (Luxturna®) gene therapy. While the study did not report quantitative parameters such as DM and SM, it pointed out a crucial practical aspect of AO imaging in IRDs: the ability to assess the effects of treatments, like gene therapies. Evaluating photoreceptor parameters, along with visual assessment and other auxiliary tests, allows for a quantifiable analysis of the impacts of therapeutic interventions.
The progression of photoreceptor changes due to non-genetic pathology was documented by Potic et al. [35], where the study group consisted of patients post-retinal detachment repair, and the follow-up time was 3 months.
Differentiation between various types of IRD has been made possible through the use of AO across different genotypes. Mastey et al. [19] examined 9 subjects with ACHM, 7 of whom had a mutation in the ATF6 gene, 1 in CNGA3, and 1 in CNGB3. In two of the patients, the acquisition of high-quality images was not feasible. Yet, they were able to discern a characteristic clear foveal cone mosaic in CNGA3 and CNGB3 patients, in contrast to patients with an ATF6 gene mutation, where hyporeflective structures, possibly retinal pigment epithelium cells, were identified. The unique characteristics of the photoreceptor mosaic in retinitis-pigmentosa-GTPase-regulator (RPGR)-associated retinopathy and Stargardt disease and the differentiation between them have been reported [6].
A possible limitation to our study is the broad age range of the patients: 13–61 years, which could potentially impact the consistency of our study group. Nonetheless, in healthy eyes, the correlation between a patient’s age and cone density was not significant, as noted in our previous study [16]. There is no defined change rate in cone density and cone spacing. Foote et al. [31] found no change in cone spacing in healthy controls over a 3-year observation. Conversely, according to some authors, photoreceptor density appears to decrease over time. Our other study [15] describes the changes in AO parameters (mean cone density, cone spacing, cone regularity, and Voronoi analysis) over a two-year observation in healthy eyes and in patients with diabetes.
Another potential limitation of our study is the absence of a control group comprised of healthy eyes. The values of the photoreceptor parameters differed between our study and the study reporting a normative database of cone parameters of healthy eyes [16]. Longitudinal observations of eyes with IRDs and healthy controls are not commonplace, as outlined above. We believe that longitudinal studies comparing changes in DM and SM over time between eyes with IRDs and healthy eyes should be promoted.
One of the challenges encountered in adaptive optics (AO) imaging of eyes with inherited retinal diseases (IRDs) is the difficulty some eyes have in maintaining central fixation, which compromises the quality of the collected images. Additionally, when patients fixate eccentrically, the precise location of the captured image remains uncertain. Daich-Varela et al. [10] underscored the challenge of obtaining standardised AO images for each specific IRD.
In a previous study, we identified low cone density as a risk factor for incomplete data acquisition due to the poor quality of the obtained images, rendering quantitative analysis of photoreceptor parameters impossible [20]. These results align with those presented in the current article, as they are based on a similar cohort of patients. In our current study, the rate of full image acquisition failures ranged from 33.9% to 50%. We describe the correlation of low cone density and high cone spacing with the risk of data collection failure. The impact of low cone regularity as a predictor for incomplete data analysis remains uncertain, as it was not confirmed in a follow-up assessment. Both the current and previous analyses did not establish a correlation between visual acuity, sex, or age and the risk of poor image quality. We suspect that the researchers’ experience with the imaging device may impact the success of data collection, as the failure rate was higher during the initial assessment than during follow-up. Given the high percentage of eyes with IRDs, where obtaining high-quality images is often impossible, we propose considering average values of photoreceptor parameters collected from various quadrants rather than specific locations.
While the quality of imaging can be challenging in certain cases, it offers the ability to monitor disease progression, even in instances that are too advanced for successful standard monitoring with macular OCT, FAF, or electrophysiology testing.

5. Conclusions

We propose that adaptive optics is a dependable instrument in handling the complex task of tracking the progression of retinal diseases. Over the course of a 6-year observation, a significant change in the cone parameters DM and SM was recorded. The change in DM and SM was more pronounced in females than in males and appeared to be independent of diagnosis (STGD, CD, or CRD), BCVA, or age.
Our study group consisting of 55 eyes with IRDs, observed over a span of 6 years, is the largest and longest of its kind in terms of adaptive optics assessment of patients with IRDs. We anticipate that our findings will motivate other clinicians to incorporate this highly effective imaging tool into their practice. Presently, adaptive optics is predominantly used as a research method. We affirm that the data obtained with Rtx1™ are reliable, offering the potential for the long-term observation of disease progression. As the development of gene therapy in IRDs progresses, we believe that AO will serve as a valuable instrument for monitoring treatment efficacy.

Author Contributions

Conceptualisation, J.P.S. and A.Z.-Ż.; methodology, A.Z.-Ż.; software, K.S.; validation, A.Z.-Ż., K.S. and J.P.S.; formal analysis, A.Z.-Ż.; investigation, K.S., B.Ś. and A.Z.-Ż.; resources, K.S.; data curation, K.S. and B.Ś.; original draft preparation, K.S.; writing, K.S. and A.Z.-Ż.; review and editing, K.S., J.P.S., B.Ś. and A.Z.-Ż.; visualisation, J.P.S. and A.Z.-Ż.; supervision, A.Z.-Ż.; project administration, J.P.S.; funding acquisition, J.P.S. All authors have read and agreed to the published version of the manuscript.

Funding

This research received no external funding.

Institutional Review Board Statement

The study was conducted in accordance with the Declaration of Helsinki and approved by the Bioethics Committee of the Medical University of Warsaw (KB/87/2015, 7 April 2015).

Informed Consent Statement

Informed consent was obtained from all subjects involved in the study. In the case of patients younger than 18, the consent was given by the patient and his/her parent.

Data Availability Statement

Not applicable.

Conflicts of Interest

The authors declare no conflict of interest.

Abbreviations

The following abbreviations are used in this manuscript:
ATPAdenosine triphosphate
cGMPCyclic guanosine monophosphate
GTPGuanosine triphosphate
IQRInterquartile range
MDPIMultidisciplinary Digital Publishing Institute
DOAJDirectory of open access journals
LDLinear dichroism
SDStandard deviation
OROdds ratio

References

  1. Vincent, A.; Wright, T.; Garcia-Sanchez, Y.; Kisilak, M.; Campbell, M.; Westall, C.; Héon, E. Phenotypic characteristics including in vivo cone photoreceptor mosaic in KCNV2-related “cone dystrophy with supernormal rod electroretinogram”. Investig. Ophthalmol. Vis. Sci. 2013, 54, 898–908. [Google Scholar] [CrossRef] [PubMed]
  2. Gill, J.S.; Georgiou, M.; Kalitzeos, A.; Moore, A.T.; Michaelides, M. Progressive cone and cone–rod dystrophies: Clinical features, molecular genetics and prospects for therapy. Br. J. Ophthalmol. 2019, 103, 711–720. [Google Scholar] [CrossRef] [PubMed]
  3. Wawrocka, A.; Skorczyk-Werner, A.; Wicher, K.; Niedziela, Z.; Ploski, R.; Rydzanicz, M.; Sykulski, M.; Kociecki, J.; Weisschuh, N.; Kohl, S.; et al. Novel variants identified with next-generation sequencing in Polish patients with cone–rod dystrophy. Mol. Vis. 2018, 24, 326–339. [Google Scholar] [PubMed]
  4. Ścieżyńska, A.; Oziębło, D.; Ambroziak, A.M.; Korwin, M.; Szulborski, K.; Krawczyński, M.; Stawiński, P.; Szaflik, J.; Szaflik, J.P.; Płoski, R.; et al. Next-generation sequencing of ABCA4: High frequency of complex alleles and novel mutations in patients with retinal dystrophies from Central Europe. Exp. Eye Res. 2016, 145, 93–99. [Google Scholar] [CrossRef]
  5. Tanna, P.; Strauss, R.W.; Fujinami, K.; Michaelides, M. Stargardt disease: Clinical features, molecular genetics, animal models and therapeutic options. Br. J. Ophthalmol. 2017, 101, 25–30. [Google Scholar] [CrossRef] [PubMed]
  6. Tanna, P.; Kasilian, M.; Strauss, R.; Tee, J.; Kalitzeos, A.; Tarima, S.; Visotcky, A.; Dubra, A.; Carroll, J.; Michaelides, M. Reliability and Repeatability of Cone Density Measurements in Patients With Stargardt Disease and RPGR-Associated Retinopathy. Investig. Ophthalmol. Vis. Sci. 2017, 58, 3608–3615. [Google Scholar] [CrossRef] [PubMed]
  7. Kong, X.; Fujinami, K.; Strauss, R.W.; Munoz, B.; West, S.K.; Cideciyan, A.V.; Michaelides, M.; Ahmed, M.; Ervin, A.M.; Schönbach, E.; et al. Visual Acuity Change Over 24 Months and Its Association With Foveal Phenotype and Genotype in Individuals With Stargardt Disease: ProgStar Study Report No. 10. JAMA Ophthalmol. 2018, 136, 920–928. [Google Scholar] [CrossRef]
  8. Schönbach, E.M.; Strauss, R.W.; Ibrahim, M.A.; Janes, J.L.; Birch, D.G.; Cideciyan, A.V.; Sunness, J.S.; Muñoz, B.; Ip, M.S.; Sadda, S.R.; et al. Faster Sensitivity Loss around Dense Scotomas than for Overall Macular Sensitivity in Stargardt Disease: ProgStar Report No. 14. Am. J. Ophthalmol. 2020, 216, 219–225. [Google Scholar] [CrossRef]
  9. Ong, J.; Zarnegar, A.; Corradetti, G.; Singh, S.R.; Chhablani, J. Advances in Optical Coherence Tomography Imaging Technology and Techniques for Choroidal and Retinal Disorders. J. Clin. Med. 2022, 11, 5139. [Google Scholar] [CrossRef]
  10. Daich Varela, M.; Esener, B.; Hashem, S.A.; Cabral de Guimaraes, T.A.; Georgiou, M.; Michaelides, M. Structural evaluation in inherited retinal diseases. Br. J. Ophthalmol. 2021, 105, 1623–1631. [Google Scholar] [CrossRef]
  11. Samelska, K.; Kupis, M.; Zaleska-Żmijewska, A.; Szaflik, J.P. Adaptive optics imaging in the most common inherited retinal degenerations. Klin. Ocz. 2021, 123, 74–79. [Google Scholar] [CrossRef]
  12. Gill, J.S.; Moosajee, M.; Dubis, A.M. Cellular imaging of inherited retinal diseases using adaptive optics. Eye 2019, 33, 1683–1698. [Google Scholar] [CrossRef] [PubMed]
  13. Zaleska-Żmijewska, A.; Wawrzyniak, Z.; Kupis, M.; Szaflik, J.P. The Relation between Body Mass Index and Retinal Photoreceptor Morphology and Microvascular Changes Measured with Adaptive Optics (rtx1) High-Resolution Imaging. J. Ophthalmol. 2021, 2021, 6642059. [Google Scholar] [CrossRef]
  14. Zaleska-Żmijewska, A.; Piątkiewicz, P.; Śmigielska, B.; Sokołowska-Oracz, A.; Wawrzyniak, Z.M.; Romaniuk, D.; Szaflik, J.; Szaflik, J.P. Retinal Photoreceptors and Microvascular Changes in Prediabetes Measured with Adaptive Optics (rtx1™): A Case-Control Study. J. Diabetes Res. 2017, 2017, 4174292. [Google Scholar] [CrossRef]
  15. Kupis, M.; Wawrzyniak, Z.M.; Szaflik, J.P.; Zaleska-Żmijewska, A. Retinal Photoreceptors and Microvascular Changes in the Assessment of Diabetic Retinopathy Progression: A Two-Year Follow-Up Study. Diagnostics 2023, 13, 2513. [Google Scholar] [CrossRef]
  16. Zaleska-Żmijewska, A.; Wawrzyniak, Z.M.; Ulińska, M.; Szaflik, J.; Dąbrowska, A.; Szaflik, J.P. Human photoreceptor cone density measured with adaptive optics technology (rtx1 device) in healthy eyes: Standardization of measurements. Medicine 2017, 96, e7300. [Google Scholar] [CrossRef]
  17. Wynne, N.; Heitkotter, H.; Woertz, E.N.; Cooper, R.F.; Carroll, J. Comparison of Cone Mosaic Metrics From Images Acquired With the SPECTRALIS High Magnification Module and Adaptive Optics Scanning Light Ophthalmoscopy. Transl. Vis. Sci. Technol. 2022, 11, 19. [Google Scholar] [CrossRef]
  18. Song, H.; Rossi, E.A.; Yang, Q.; Granger, C.E.; Latchney, L.R.; Chung, M.M. High-Resolution Adaptive Optics in Vivo Autofluorescence Imaging in Stargardt Disease. JAMA Ophthalmol. 2019, 137, 603–609. [Google Scholar] [CrossRef]
  19. Mastey, R.R.; Georgiou, M.; Langlo, C.S.; Kalitzeos, A.; Patterson, E.J.; Kane, T.; Singh, N.; Vincent, A.; Moore, A.T.; Tsang, S.H.; et al. Characterization of Retinal Structure in ATF6-Associated Achromatopsia. Investig. Ophthalmol. Vis. Sci. 2019, 60, 2631–2640. [Google Scholar] [CrossRef]
  20. Samelska, K.; Szaflik, J.P.; Guszkowska, M.; Kurowska, A.K.; Zaleska-Żmijewska, A. Characteristics of Rare Inherited Retinal Dystrophies in Adaptive Optics—A Study on 53 Eyes. Diagnostics 2023, 13, 2472. [Google Scholar] [CrossRef]
  21. Song, H.; Rossi, E.A.; Latchney, L.; Bessette, A.; Stone, E.; Hunter, J.J.; Williams, D.R.; Chung, M. Cone and rod loss in Stargardt disease revealed by adaptive optics scanning light ophthalmoscopy. JAMA Ophthalmol. 2015, 133, 1198–1203. [Google Scholar] [CrossRef] [PubMed]
  22. Sahel, J.A.; Grieve, K.; Pagot, C.; Authié, C.; Mohand-Said, S.; Paques, M.; Audo, I.; Becker, K.; Chaumet-Riffaud, A.E.; Azoulay, L.; et al. Assessing Photoreceptor Status in Retinal Dystrophies: From High-Resolution Imaging to Functional Vision. Am. J. Ophthalmol. 2021, 230, 12–47. [Google Scholar] [CrossRef] [PubMed]
  23. Lombardo, M.; Serrao, S.; Devaney, N.; Parravano, M.; Lombardo, G. Adaptive optics technology for high-resolution retinal imaging. Sensors 2012, 13, 334–366. [Google Scholar] [CrossRef] [PubMed]
  24. Muthiah, M.N.; Gias, C.; Chen, F.K.; Zhong, J.; McClelland, Z.; Sallo, F.B.; Peto, T.; Coffey, P.J.; da Cruz, L. Cone photoreceptor definition on adaptive optics retinal imaging. Br. J. Ophthalmol. 2014, 98, 1073–1079. [Google Scholar] [CrossRef]
  25. Zaleska-Żmijewska, A.; Wawrzyniak, Z.M.; Dąbrowska, A.; Szaflik, J.P. Adaptive Optics (rtx1) High-Resolution Imaging of Photoreceptors and Retinal Arteries in Patients with Diabetic Retinopathy. J. Diabetes Res. 2019, 2019, 9548324. [Google Scholar] [CrossRef]
  26. Polans, J.; Keller, B.; Carrasco-Zevallos, O.M.; LaRocca, F.; Cole, E.; Whitson, H.E.; Lad, E.M.; Farsiu, S.; Izatt, J.A. Wide-field retinal optical coherence tomography with wavefront sensorless adaptive optics for enhanced imaging of targeted regions. Biomed. Opt. Express 2017, 8, 16–37. [Google Scholar] [CrossRef]
  27. Thiadens, A.A.H.J.; Phan, T.M.L.; Zekveld-Vroon, R.C.; Leroy, B.P.; van den Born, L.I.; Hoyng, C.B.; Klaver, C.C.W.; Roosing, S.; Pott, J.W.R.; van Schooneveld, M.J.; et al. Clinical course, genetic etiology, and visual outcome in cone and cone–rod dystrophy. Ophthalmology 2012, 119, 819–826. [Google Scholar] [CrossRef]
  28. Duncan, J.L.; Zhang, Y.; Gandhi, J.; Nakanishi, C.; Othman, M.; Branham, K.E.H.; Swaroop, A.; Roorda, A. High-resolution imaging with adaptive optics in patients with inherited retinal degeneration. Investig. Ophthalmol. Vis. Sci. 2007, 48, 3283–3291. [Google Scholar] [CrossRef]
  29. Nakatake, S.; Murakami, Y.; Funatsu, J.; Koyanagi, Y.; Akiyama, M.; Momozawa, Y.; Ishibashi, T.; Sonoda, K.H.; Ikeda, Y. Early detection of cone photoreceptor cell loss in retinitis pigmentosa using adaptive optics scanning laser ophthalmoscopy. Graefes Arch. Clin. Exp. Ophthalmol. 2019, 257, 1169–1181. [Google Scholar] [CrossRef]
  30. Giannini, D.; Lombardo, G.; Mariotti, L.; Devaney, N.; Serrao, S.; Lombardo, M. Reliability and Agreement Between Metrics of Cone Spacing in Adaptive Optics Images of the Human Retinal Photoreceptor Mosaic. Investig. Ophthalmol. Vis. Sci. 2017, 58, 3127–3137. [Google Scholar] [CrossRef]
  31. Foote, K.G.; De la Huerta, I.; Gustafson, K.; Baldwin, A.; Zayit-Soudry, S.; Rinella, N.; Porco, T.C.; Roorda, A.; Duncan, J.L. Cone Spacing Correlates with Retinal Thickness and Microperimetry in Patients With Inherited Retinal Degenerations. Investig. Ophthalmol. Vis. Sci. 2019, 60, 1234–1243. [Google Scholar] [CrossRef]
  32. Ueda-Consolvo, T.; Ozaki, H.; Nakamura, T.; Oiwake, T.; Hayashi, A. The association between cone density and visual function in the macula of patients with retinitis pigmentosa. Graefes Arch. Clin. Exp. Ophthalmol. 2019, 257, 1841–1846. [Google Scholar] [CrossRef] [PubMed]
  33. Ziccardi, L.; Giannini, D.; Lombardo, G.; Serrao, S.; Dell’Omo, R.; Nicoletti, A.; Bertelli, M.; Lombardo, M. Multimodal Approach to Monitoring and Investigating Cone Structure and Function in an Inherited Macular Dystrophy. Am. J. Ophthalmol. 2015, 160, 301–312. [Google Scholar] [CrossRef] [PubMed]
  34. Roshandel, D.; Heath Jeffery, R.C.; Charng, J.; Sampson, D.M.; McLenachan, S.; Mackey, D.A.; Chen, F.K. Short-Term Parafoveal Cone Loss Despite Preserved Ellipsoid Zone in Rod Cone Dystrophy. Transl. Vis. Sci. Technol. 2021, 10, 11. [Google Scholar] [CrossRef]
  35. Potic, J.; Bergin, C.; Giacuzzo, C.; Daruich, A.; Pournaras, J.A.; Kowalczuk, L.; Behar-Cohen, F.; Konstantinidis, L.; Wolfensberger, T.J. Changes in visual acuity and photoreceptor density using adaptive optics after retinal detachment repair. Retina 2020, 40, 376–386. [Google Scholar] [CrossRef]
Figure 1. An adaptive optics image showing photoreceptors in a healthy eye (Rtx1™, Imagine Eyes, France). The photoreceptor mosaic appears intact (not disrupted) with individual photoreceptors visible as white and greyish spots.
Life 13 01871 g001
Figure 2. An adaptive optics image of the photoreceptors of an eye afflicted by cone dystrophy (Rtx1™, Imagine Eyes, France). Observe the cone disruption throughout the image with “dark spaces” apparent within the cone mosaic across different areas of the image.
Life 13 01871 g002
Figure 3. An adaptive optics image of photoreceptors in an eye affected by cone–rod dystrophy (Rtx1™, Imagine Eyes, France). Throughout the image, the cones are not clearly visible. Observe the “dark spaces” scattered within the cone mosaic across various regions of the picture.
Life 13 01871 g003
Figure 4. An adaptive optics image of the photoreceptors of the eye with Stargardt disease (Rtx1™; Imagine Eyes, France). The photoreceptor mosaic is disrupted, note the appearance “dark spaces” among the cone mosaic in various regions of the picture.
Life 13 01871 g004
Figure 5. Difference in DM change over a 6-year observation period with respect to sex. DM: cone density (1/ mm 2 ).
Life 13 01871 g005
Figure 6. Difference in SM change over a 6-year observation with respect to sex. SM: cone spacing ( μ m).
Life 13 01871 g006
Table 1. Demographic data of the patients during the initial check (data collected in 2015). CD: cone dystrophy. CRD: cone–rod dystrophy. STGD: Stargardt disease.
CD (N = 9)CRD (N = 8)STGD (N = 38)Total (N = 55)
Age (years)
   Mean (SD)38.11 (7.46)44.75 (4.17)35.89 (14.41)37.18 (14.18)
   Median3943.53536.5
   Range30–5541–6713–6113–67
Sex
   Female5 (55.6%)2 (25%)24 (63%)31 (56.4%)
   Male4 (44.4%)6 (75%)14 (37%)24 (43.6%)
Eye
   Right5 (55.6%)4 (50%)19 (50%)28 (51%)
   Left4 (44.4%)4 (50%)19 (50%)27 (49%)
Table 2. Characteristics of adaptive optics parameters with respect to diagnosis during the initial check (data collected in 2015). BCVA: best corrected visual acuity; DM: cone density (1/mm 2 ), SM: cone spacing (μm); REG: cone regularity (%); CD: cone dystrophy; CRD: cone–rod dystrophy; STGD: Stargardt disease. The bold was used in all p-Values lower than 0.05 (=with statistical significance).
All PatientsCD (N = 9)CRD (N = 8)STGD (N = 38)p-Value (Test)
BCVA
   Mean (SD)0.16 (0.19)0.17 (0.13)0.32 (0.32)0.13 (0.16)0.102
   Median0.08 (0.04–0.2)0.20.10.06(Kruskal–Wallis)
   Range(0.01–0.8)0.02–0.40.04–0.80.01–0.7
DM
   Mean (SD)12,828.7314,454.6913,594.7212,235.540.032
   (2618.96)(2797)(3067.63)(2304.38)(Kruskal–Wallis)
   Median13,018.3314,52314,434.6212,513.33
   Range7062–18,644.759368.67–18,644.758511.67–16,7047062–18,080.5
SM
   Mean (SD)9.83 (1.01)9.34 (1.04)9.55 (1.12)10.03 (0.95)0.034
   Median9.629.189.099.75(Kruskal–Wallis)
   Range8.1–12.728.1–11.618.62–11.618.22–12.72
REG
   Mean (SD)86.44 (4.44)90.24 (2.52)89.02 (2.24)84.88 (4.38)<0.001
   Median86.8690.4288.2585.05(Kruskal–Wallis)
   Range72.55–93.884.97–93.886.78–92.9772.55–92.6
Table 3. Characteristics of adaptive optics parameters with respect to diagnosis during the follow-up check (data collected in 2021). BCVA: best corrected visual acuity; DM: cone density (1/mm 2 ); SM: cone spacing ( μ m); REG: cone regularity (%); CD: cone dystrophy; CRD: cone–rod dystrophy; STGD: Stargardt disease.
All PatientsCD (N = 9)CRD (N = 8)STGD (N = 38)p-Value (Test)
BCVA
   Mean (SD)0.12 (0.16)0.15 (0.09)0.28 (0.34)0.09 (0.09)0.111
   Median0.050.160.060.05(Kruskal–Wallis)
   Range0.01–0.80.01–0.250.04–0.80.01–0.4
DM
   Mean (SD)10,073.4210,757.311,711.269523.20.208
   (3217.93)(3839.17)(3694.61)(2861.4)(Kruskal–Wallis)
   Median10,213.3810,777.2512,1409123
   Range3830–16,341.255627.33–16,341.254584.33–15,494.753830–15,499.88
SM
   Mean (SD)12.16 (4.19)11.3 (2.46)11.42 (4.11)12.55 (4.58)0.219
   Median11.0810.59.9111.34(Kruskal–Wallis)
   Range8.59–35.088.59–15.518.86–21.189.11–35.08
REG
   Mean (SD)84.37 (6.96)86.8 (4.35)86.26 (4.48)83.31 (7.77)0.262
   Median86.0388.4786.6185.66(Kruskal–Wallis)
   Range60.66–96.7777.46–91.3179.05–92.4660.66–96.77
Table 4. Changes in adaptive optics parameters between the initial (2015) and follow-up (2021) checks. BCVA: best corrected visual acuity; DM: cone density (1/mm2); SM: cone spacing (μm); REG: cone regularity (%); CD: cone dystrophy; CRD: cone–rod dystrophy; STGD: Stargardt disease. The bold was used in all p-Values lower than 0.05 (=with statistical significance).
Initial (N = 55)Follow-Up (N = 55)p-Value (Test)
BCVAMean (SD)0.16 (0.19)0.12 (0.16)0.001
Median0.080.05(Wilcoxon)
Range0.01–0.80.01–0.8
DMMean (SD)12,828.73 (2618.96)10,073.42 (3217.93)<0.001
Median13,018.3310,213.38(Wilcoxon)
Range7062–18,644.753830–16,341.25
SMMean (SD)9.83 (1.01)12.16 (4.19)<0.001
Median9.6211.08(Wilcoxon)
Range8.1–12.728.59–35.08
REGMean (SD)86.44 (4.44)84.37 (6.96)0.089
Median86.8686.03(Wilcoxon)
Range72.55–93.860.66–96.77
Table 5. Changes in adaptive optics parameters between the initial and follow-up checks for right eyes only. BCVA: best corrected visual acuity; DM: cone density (1/ mm 2 ); SM: cone spacing ( μ m); REG: cone regularity (%); CD: cone dystrophy; CRD: cone–rod dystrophy; STGD: Stargardt disease. The bold was used in all p-Values lower than 0.05 (=with statistical significance).
Initial (N = 55)Follow-Up (N = 55)p-Value (Test)
BCVAMean (SD)0.18 (0.23)0.14 (0.17)0.025
Median0.070.06(Wilcoxon)
Range0.01–0.80.01–0.8
DMMean (SD)12,595.3 (2590.99)10,357.02 (3246.84)0.006
Median12,8779396.5(t-test)
Range7500–18,644.753830–15,499.88
SMMean (SD)9.97 (1.01)12.4 (5.13)0.002
Median9.8211.31(Wilcoxon)
Range8.1–12.188.85–35.08
REGMean (SD)86.00 (5.06)83.25 (7.53)0.160
Median86.3885.66(Wilcoxon)
Range72.55–93.860.66–96.77
Table 6. Changes in adaptive optics parameters between the initial and follow-up checks for the left eyes only. BCVA: best corrected visual acuity; DM: cone density (1/ mm 2 ); SM: cone spacing ( μ m); REG: cone regularity (%); CD: cone dystrophy; CRD: cone–rod dystrophy; STGD: Stargardt disease. The bold was used in all p-Values lower than 0.05 (=with statistical significance).
Initial (N = 55)Follow-Up (N = 55)p-Value (Test)
BCVAMean (SD)0.15 (0.15)0.11 (0.16)0.021
Median0.10.05(Wilcoxon)
Range0.01–0.60.01–0.8
DMMean (SD)13,080.83 (2678.64)9767.12 (3224.25)<0.001
Median13,152.2510,480.5(T-test)
Range7062–18,080.54584.33–16,341.25
SMMean (SD)9.69 (1.02)11.9 (2.95)<0.001
Median9.4410.53(Wilcoxon)
Range8.21–12.728.59–21.18
REGMean (SD)86.92 (3.7)85.57 (6.21)0.182
Median85.9586.17(Wilcoxon)
Range77.22–92.666.67–95.84
Table 7. A difference in change in BCVA, DM, SM, and REG over 6-year observation between CD, CRD, and STGD groups: both eyes. BCVA: best corrected visual acuity. DM: cone density (1/mm 2 ). SM: cone spacing ( μ m). REG: cone regularity (%). CD: cone dystrophy. CRD: cone–rod dystrophy. STGD: Stargardt disease.
All Patients (N = 55)CD (N = 9)CRD (N = 8)STGD (N = 38)p-Value (Test)
BCVA change
   Mean (SD)−0.04 (0.1)−0.03 (0.08)−0.03 (0.14)−0.04 (0.1)0.705
   Median00−0.040(Kruskal–Wallis)
   Range(−0.4)–0.2(−0.15)–0.1(−0.3)–0.2(−0.4)–0.04
DM change
   Mean (SD)−3008.25 (3059.45)−3697.39 (1571.73)−1883.46 (4462.61)−3092.98 (2983.56)0.338
   Median−3600.12−3682.75−1139.75−3622(Kruskal–Wallis)
   Range(−10,290.42)–3798.33(−6004.92)–(−1358.5)(−10,290.42)–3798.33(−8683.33)–3185.83
SM change
   Mean (SD)2.5 (4.13)1.96 (1.76)1.87 (4.43)2.8 (4.56)0.308
   Median1.411.330.231.55(Kruskal–Wallis)
   Range(−1.85)–24.390.38–5.66(−1.85)–12.18(−1.07)–24.39
REG change
   Mean (SD)−2.31 (7.66)−3.44 (3.67)−2.76 (4.36)−1.89 (9.04)0.475
   Median−1.82−4.81−1.820.05(Kruskal–Wallis)
   Range(−27.74)–18.61(−7.57)–2.26(−11.55)–2.01(−27.74)–18.61
Table 8. Differences in BCVA, DM, SM, and REG changes over a 6-year observation period between males and females: both eyes. BCVA: best corrected visual acuity; DM: cone density (1/ mm 2 ); SM: cone spacing ( μ m); REG: cone regularity (%); CD: cone dystrophy; CRD: cone–rod dystrophy; STGD: Stargardt disease. The bold was used in all p-Values lower than 0.05 (=with statistical significance).
Males (N = 24)Females (N = 31)p-Value (Test)
BCVA change
   Mean (SD)−0.03 (0.1)−0.05 (0.1)0.748
   Median00(Mann–Whitney U)
   Range(−0.3)–0.2(−0.4)–0.1
DM change
   Mean (SD)−1908.26 (3470.12)−3804.8 (2492.9)0.025
   Median−1528.75−3741.33(Mann–Whitney U)
   Range(−10,290.42)–3798.33(−8683.33)–2622.88
SM change
   Mean (SD)1.46 (2.99)3.25 (4.7)0.021
   Median0.481.62(Mann–Whitney U)
   Range(−1.85)–12.180.1–24.39
REG change
   Mean (SD)−1.54 (5.11)−2.86 (9.12)0.507
   Median−1.86−1.79(Mann–Whitney U)
   Range(−11.99)–6.91(−27.74)–18.61
Table 9. Correlation between DM change over a 6-year observation and initial parameters BCVA, DM, SM, REG, and age; BCVA change, SM change, and REG change. Initial BCVA: best corrected visual acuity at initial check (2015). Initial DM: cone density at initial check (2015) (1/ mm 2 ). Initial SM: cone spacing at initial check (2015) ( μ m ). Initial REG: cone regularity at initial check (2015) (%). BCVA change: difference in best corrected visual acuity between the initial check and follow-up. SM change: difference in cone spacing between the initial check and follow-up ( μ m ). REG change: difference in cone regularity between the initial check and follow-up (%). The bold was used in all p-Values lower than 0.05 (=with statistical significance).
VariableCorrelation Coefficient (r)p-Value(Test)
initial BCVA0.1490.302Spearman
initial DM0.1490.302Pearson
initial SM0.1720.231Spearman
initial REG−0.1570.276Spearman
age (years)−0.1760.223Pearson
BCVA change0.0280.847Spearman
SM change−0.856<0.001Spearman
REG change0.2970.036Pearson
Table 10. Pearson’s correlation coefficient (r) between mean values of DM, SM, and age (data collected in 2021). DM: cone density (1/mm 2 ), SM: cone spacing ( μ m).
VariableBoth Eyes (r)p-ValueRight Eyes (r)p-ValueLeft Eyes (r)p-Value
DM−0.1460.295−0.3280.110−0.1480.290
SM0.1970.1570.3160.1240.1850.185
Table 11. Descriptive characteristics concerning complete or incomplete data (with complete data indicating that 4 measurements provided an image suitable for analysis); data collected during the initial check. BCVA: best-corrected visual acuity; DM: cone density (1/mm 2 ); SM: cone spacing ( μ m); REG: cone regularity (%); CD: cone dystrophy; CRD: cone–rod dystrophy; STGD: Stargardt disease. The bold was used in all p-Values lower than 0.05 (=with statistical significance).
Incomplete Data ( N = 28 )Complete Data ( N = 28 )p-Value (Test)
Mean age (SD) 36.4 ( 16.5 ) 37.9 ( 11.4 ) 0.694
(t-test)
Sex
Male 42.9 % ( N = 12 ) 42.9 % ( N = 12 ) 1
Female 57.1 % ( N = 16 ) 57.1 % ( N = 16 ) (chi-squared)
Diagnosis
CD 7.1 % ( N = 2 ) 28.6 % ( N = 8 ) 0.118
CRD 14.3 % ( N = 4 ) 14.3 % ( N = 4 ) (Fisher)
STGD 78.6 % ( N = 22 ) 57.1 % ( N = 16 )
BCVA
Mean (SD)0.15 (0.23)0.21 (0.22)0.112
Median (IQR)0.05 (0.03–0.12)0.09 (0.05–0.29)(Mann–Whitney U)
Range0.01–0.90.01–0.7
DM
Mean (SD)11,078.6 (2329.58)14,003.66 (1905.81)<0.001
Median (IQR)10,460.67 (9368.67–12,786.08)13,805 (12,817.25–15,283.5)(t-test)
Range7500–15,94910.540–18,644.75
SM
Mean (SD)10.56 (0.98)9.42 (0.65)<0.001
Median (IQR)10.78 (9.84–11.21)9.42 (8.99–9.82)(t-test)
Range8.78–12.188.1–10.7
REG
Mean (SD)83.53 (5.56)88.29 (3.08)<0.001
Median (IQR)84.4 (79.47–87.03)88.4 (86.2–90.6)(t-test)
Range72.55–92.9781.77–93.8
Table 12. Descriptive characteristics concerning complete or incomplete data (with complete data indicating that 4 measurements provided an image suitable for analysis); data collected during the follow-up. BCVA: best-corrected visual acuity; DM: cone density (1/mm 2 ); SM: cone spacing ( μ m); REG: cone regularity (%); CD: cone dystrophy; CRD: cone–rod dystrophy; STGD: Stargardt disease. The bold was used in all p-Values lower than 0.05 (=with statistical significance).
Incomplete Data ( N = 19 )Complete Data ( N = 37 )p-Value (Test)
Mean age (SD) 39.63 ( 14.3 ) 35.39 ( 13.95 ) 0.360
(t-test)
Sex
Male 47.4 % ( N = 9 ) 40.5 % ( N = 15 ) 0.839
Female 52.6 % ( N = 10 ) 59.5 % ( N = 26 ) (chi-squared)
Diagnosis
CD 21.1 % ( N = 4 ) 16.2 % ( N = 6 ) 0.838
CRD 10.5 % ( N = 2 ) 16.2 % ( N = 6 ) (Fisher)
STGD 68.4 % ( N = 13 ) 67.6 % ( N = 25 )
BCVA
Mean (SD)0.1 (0.12)0.14 (0.18)0.416
Median (IQR)0.05 (0.04–0.11)0.06 (0.05–0.2)(Mann–Whitney U)
Range0.01–0.40.01–0.8
DM
Mean (SD)8071.89 (2892.07)10,884.85 (3011.82)0.004
Median (IQR)7943.67 (5992–8886.5)10.738 (9092.75–12,774.5)(t-test)
Range4584.33–15,0673830–16,341.25
SM
Mean (SD)13.17 (3.17)11.75 (4.52)0.013
Median (IQR)12.24 (11.36–13.91)10.5 (9.8–11.76)(Mann–Whitney U)
Range9.04–21.188.59–35.08
REG
Mean (SD)83.96 (7.48)84.53 (6.83)0.357
Median (IQR)84.76 (81.12–86.41)86.17 (82.81–88.97)(Mann–Whitney U)
Range66.67–96.7760.66–92.46
Disclaimer/Publisher’s Note: The statements, opinions and data contained in all publications are solely those of the individual author(s) and contributor(s) and not of MDPI and/or the editor(s). MDPI and/or the editor(s) disclaim responsibility for any injury to people or property resulting from any ideas, methods, instructions or products referred to in the content.

