1. Introduction
For decades, laser applications for the treatment of retinal diseases have been pursued due to their elegance of direct access through the ocular media and the possibility of sub-millimeter precise positioning under visual guidance. For retinal diseases, the retinal pigment epithelium (RPE), a monolayer of typically post-mitotic polarized epithelial cells strategically situated between the photoreceptors and the choroid, plays an important role as the primary caretaker of photoreceptor health and function [
1]. RPE dysfunction apparently underlies many inherited and acquired diseases causing permanent blindness [
2]. The resilience and regenerative capacity of the RPE has prompted the development of several laser techniques aimed at stimulating and rejuvenating the RPE whilst staying within a treatment window beneath the thresholds for collateral damage. To best meet the requirements for RPE-specific treatment, a photodisruptive laser approach known as selective retina therapy (SRT) was found to be particularly suitable [
3]. SRT intends to selectively initiate apoptosis of dysfunctional or senescent patches of the approximately 10 μm thick RPE monolayer without scarring the choroid and the neurosensory retina and especially sparing the non-regenerative photoreceptors, to enable RPE-mitosis, regrowth and uptake of physiological retinal function [
1,
3,
4,
5]. The basis for selective damage is the RPE’s high melanin content in the intracellular melanosomes, which absorb about 50% of the incident light in the green spectral range in their function as stray-light suppressors [
1,
6]. Within the thermal confinement of the short microsecond-long pulses used for SRT, peak temperatures (140 to 150 °C) at the melanosomes in the RPE initiate microsecond-long microbubble formation (MBF) [
7,
8]. Rapid mechanical expansion and collapse of these micrometer-sized steam bubbles successively cause RPE cell wall disruption, followed by immediate or delayed cell death [
8].
The original idea for selective RPE photocoagulation was introduced by Roider and Birngruber [
4,
9] following the concept of selective photothermolysis of the RPE by Anderson and Parish [
10]. Subsequently, the concept was further developed and optimized by Brinkmann et al. at the Medical Laser Center Lübeck, and finally named SRT [
11]. In contrast to conventional photocoagulation, SRT intends to rejuvenate the regenerative RPE, resulting in improved metabolism at the target sites after RPE migration and proliferation [
3,
12]. Since the concept of SRT was introduced, the method has been successfully used clinically to treat central serous chorioretinopathy and diabetic macular edema [
11,
13,
14,
15,
16]. Furthermore, SRT has already been shown to reduce Bruch’s membrane thickness and age-related macular degeneration (AMD)-like RPE alterations in AMD mouse models to increase permeability and could therefore become a promising option for the treatment of dry AMD [
17].
Recently, new high-power flexible continuous wave (CW)-based lasers have been investigated for SRT, allowing a wider range of pulse durations. For example, Seifert et al. evaluated a 15 W diode laser (A.R.C Laser, Nürnberg, Germany) at 514 nm wavelength and adjustable pulse duration from 2 to 50 µs [
18], and Burri et al. evaluated a 30 W optically pumped semiconductor laser (Meridian Medical, Thun, Switzerland) at 532 nm and adjustable pulse duration from 2 µs to 20 µs [
19]. Such lasers have the potential to cover the entire laser treatment range from SRT to sublethal hyperthermia-inducing short pulse applications to traditional CW photocoagulation. Since thermally induced tissue alterations depend on pulse duration, radiant exposure, and local temperature rise as well as tissue properties, effects differ widely among the application regimes, as do their medical indications. Common CW lasers used in clinical practice for photocoagulation operate in the range of a few hundred milliwatts to several watts of power. A laser modulated for SRT that is only active with a significantly lower duty cycle, on the other hand, requires higher instantaneous power to deliver the same amount of energy. As indicated by Seifert et al., who extrapolated clinical data for SRT on patients with diabetic macular edema, laser powers of 5 W to 40 W are required to achieve RPE damage using short microsecond laser pulses [
18]. Although immunohistochemical studies by Framme et al. have already demonstrated selective RPE interaction with exposure times up to 15 µs [
20], it is also known that due to the theory-derived thermal relaxation time for RPE cells, pulse durations longer than 10 µs may be less efficient for SRT [
3]. Lee et al. substantiated this theoretical assumption when they showed that, in the case of 1, 5 and 10 µs laser pulse duration, more than 95% of dead RPE cells were associated with MBF, whereas the ratio decreased to 65% and 45% for longer 20 µs and 40 µs pulses, respectively [
21]. Complementarily, an in vivo experiment by Burri et al. showed that for pulse durations of 20 µs, more pronounced morphologic retinal changes occur according to optical coherence tomography (OCT) B-scans compared to pulse durations of 4 µs [
22]. It can be concluded that the pulse duration range of around 10 µs up to 20 µs, respectively, has to be carefully evaluated to achieve the desired effect according to SRT, but at the same time to avoid suprathreshold lesions with unwanted collateral effects to ensure clinical safety. Therefore, we examined the influence of pulse duration and application mode on laser microsurgery of the RPE in the range from 8 µs to 20 µs to investigate and thereby minimize the risk of heat accumulation in the neurosensory retina during SRT.
Another aspect we investigated in this study is real-time feedback dosimetry (RFD) for SRT. Even if basic parameters such as the laser pulse duration and the number of applied pulses as well as the pulse energy range are optimized, SRT without damaging the surrounding tissue by heat diffusion proved to be challenging. The reason for this is the strongly varying RPE melanin concentration within different locations by up to a factor of 4 [
23], as well as the decreasing ocular transparency with age by tens of percent [
24,
25]. This leads to strongly varying inter- and intraindividual thresholds for selective RPE cell damage. Therefore, reliable RFD is essential to preserve photoreceptor integrity. Hence, several approaches for real-time MBF detection are under development. Delivering real-time feedback on the localized impact is imperative for keeping the laser energy within the treatment window, at best without additional mechanical interaction to minimize the procedure’s invasiveness. Methods such as measuring the increased reflectance at the bubble surface via backscattered light or capturing the ultrasonic emission caused by rapid bubble expansion and collapse to detect the presence of MBF have been successfully tested [
26,
27]. An attractive dosimetry approach is the utilization of spectral-domain optical coherence tomography (SD-OCT) simultaneously with SRT. This method was first described by Steiner et al., who indirectly detected tissue effects of laser pulses as signal loss (coherent fringe washout) in time-resolved SD-OCT A-scans (M-scans) [
28,
29,
30]. The detailed mechano-optical model of the signal loss during laser treatment is still debated, but the currently favored hypothesis explains it as interference signal contrast loss, or decorrelation, also known as “fringe washout” resulting from the axial motion or other signal alterations of retinal surfaces due to MBF within time scales close to, or above, the coherent acquisition time of the depth scan [
31]. In consideration are fast dynamic changes of the scattering behavior, especially at the level of the RPE as well as vibration due to MBF and thermal expansion following the exposure. Thereby, fringe washouts are particularly pronounced during a single A-scan (within the acquisition time of the interferometric measurement of typically 10 µs to 30 µs), which roughly corresponds to the average cumulative microsecond lifetime of MBF during SRT [
8]. Burri et al. recently presented an SD-OCT-based RFD algorithm for SRT [
31]. For certain samples, this algorithm achieved a sensitivity of 99% and specificity of 97% for predicting RPE lesions after microsecond laser application. We used the same algorithm again in this study to investigate OCT-based RFD.
2. Materials and Methods
2.1. Treatment and Monitoring System
For the experiments, the non-commercially available research device Spectralis Centaurus (HuCE-optoLab, Bern University of Applied Sciences, Biel, Switzerland) was used [
32]. The device is based on a modified diagnostic imaging platform (Spectralis, Heidelberg Engineering, Heidelberg, Germany), extended with a prototype treatment laser (modified Merilas 532 short pulse, Meridian Medical, Thun, Switzerland) intended for SRT. The laser emits radiation at 532 nm, supports pulse durations from 2 to 20 μs at repetition rates of 100 Hz, and delivers 30 W power [
19]. The laser beam is focused to a spot size of approximately 90 × 90 μm
2 as a square beam profile on the porcine retina and an intensity modulation factor (IMF) of 1.3 is achieved, indicating an almost homogeneous top-hat beam profile [
33]. The IMF describes the ratio of maximum to mean radiant exposure across the beam profile and was first introduced by Framme et al. in 2002 as a speckle factor [
34]. An IMF = 1 corresponds to perfectly homogenous, top-hat radiant exposure. Furthermore, the system features the ability of intervention planning utilizing a coaxially integrated confocal scanning laser ophthalmoscope (cSLO) and a spectral domain (SD)—also called Fourier-domain (FD) OCT—that are widely applied in the diagnosis of retinal diseases by capturing cross-sectional and volumetric images (B- and C-scans). The super-luminescence diode of the SD-OCT laser emits infrared radiation centered at 870 nm wavelength with a 73 nm spectral bandwidth. The OCT system is operated at a rate of 85 kHz resulting in an integration time of 11.8 µs per A-scan. In B-scan mode, the beam scans across the retina, producing a cross-sectional, depth-resolved image of the backscatter from minute tissue interfaces. Furthermore, it can be operated in the so-called M-scan mode (motion mode) to measure time-resolved sequences of A-scans at the point of the therapy laser application, thereby unveiling depth-resolved temporal signal fluctuations or signal loss (coherent fringe washouts) for RFD.
2.2. Tissue Preparation
Juvenile porcine eyes were used for the experiments (
n = 9). The enucleated pig eyes were obtained from a local slaughterhouse (pigs’ age ~24 weeks, ~110 kg weight). After enucleation, the eyes were transported to the laboratory (within 30 min) in a jar filled with phosphate-buffered saline (PBS), enclosed by a thermo box cooled with reusable ice packs (freshly enucleated eyes should be kept at 4 °C [
35]). Before treatment, superfluous tissue was removed from around the eyeball. For irradiation, the eyes were positioned in a special 3D-printed plastic container (polylactic acid (PLA), Ultimaker S5, Utrecht, The Netherlands) attached to the original headrest in front of the delivery optics of the treatment system. To maintain the intraocular pressure (IOP), an intravitreal injection into the vitreous cavity through the pars plana was made. The eyes were cannulated using a disposable hypodermic needle (20 G × 1 1/2″, Teqler, Wecker, Luxembourg) connected with a tube to a height-adjustable column filled with balanced salt solution (BSS). A physiological pressure transducer (SP844, Memscap, Isere, France), inserted in the silicon tube at the same height as the eye via an attached silicon diaphragm dome (844-28, Memscap, Isere, France), allowed the recording, respectively, the control of the IOP. The eyes were pressurized at 15 mmHg. This corresponds roughly to the IOP found in pigs (15.2 mmHg) [
36] and also to the mean IOP of humans (14.7 mmHg) [
37]. The cornea was manually moistened using BSS approximately 10 times per minute. An intact corneal tear film is important for maintaining epithelial integrity, physiologically reduces surface scattering, and helps to partially correct high-order optical aberrations by smoothing out the rough ocular surface [
38]. The experiments took place at room temperature well within the common cellular survivability window, which should not be longer than five hours [
35].
2.3. Treatment Pattern and Irradiation
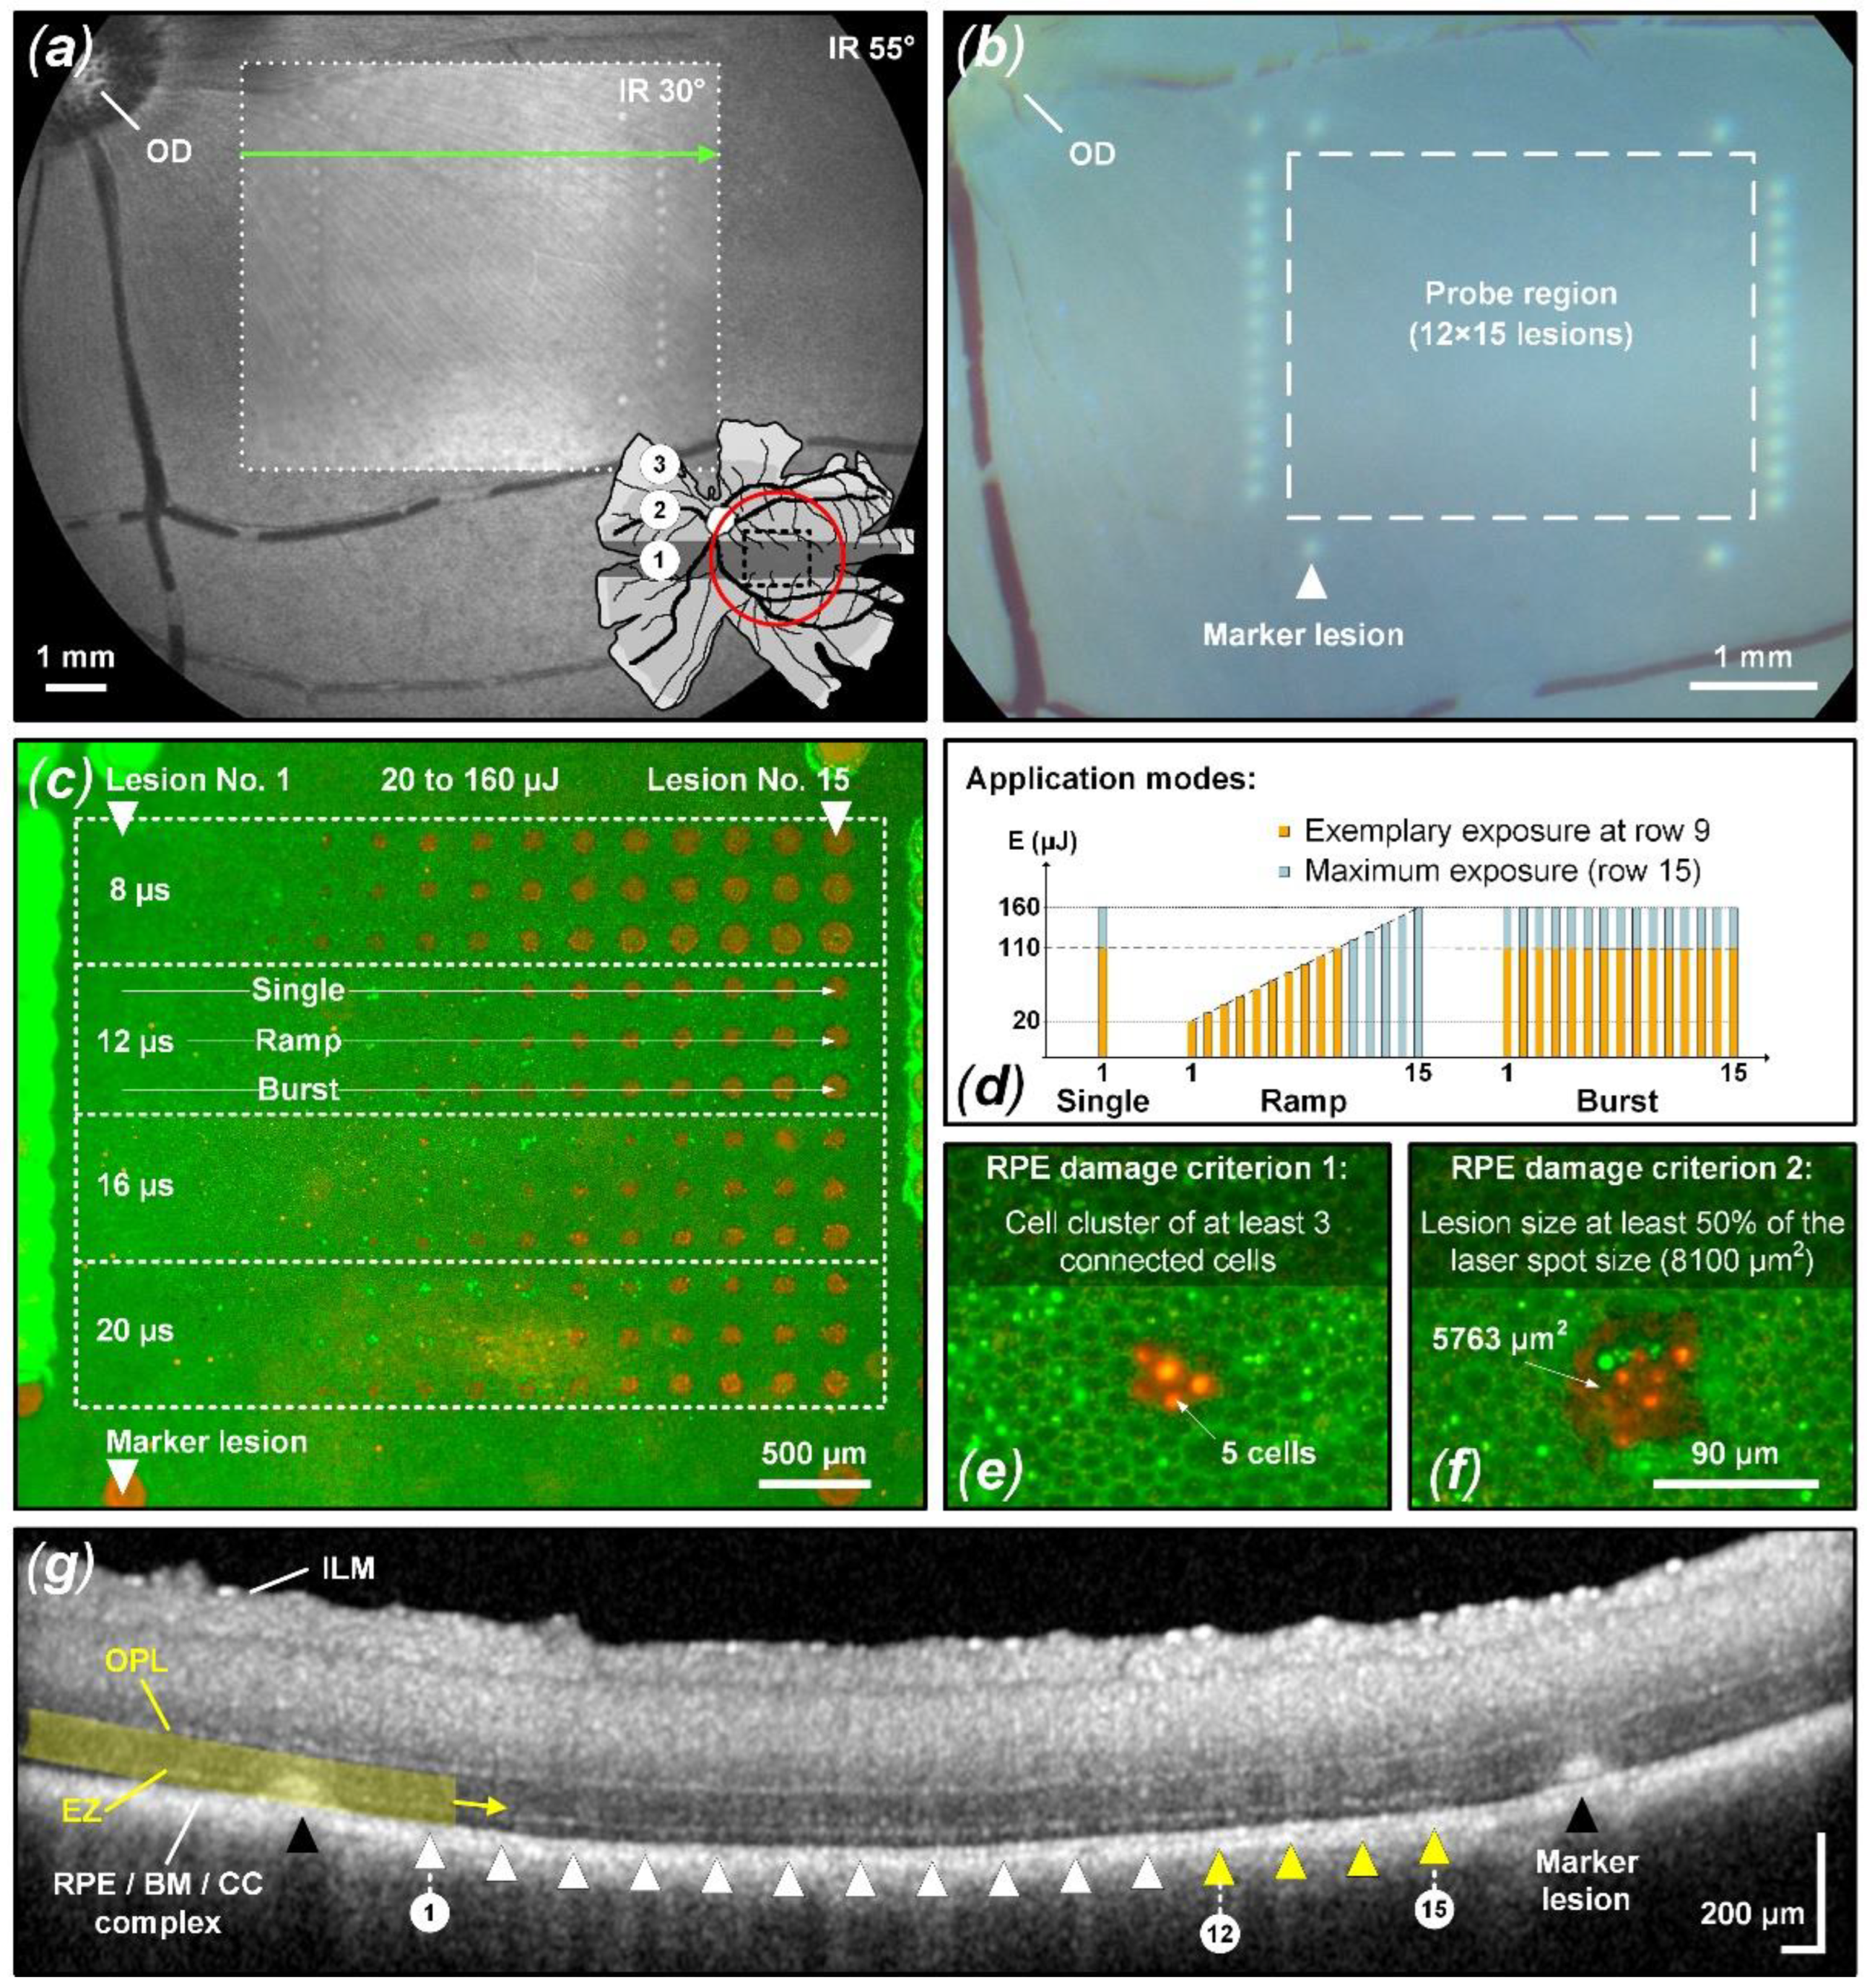
As depicted in
Figure 1a, the porcine retina has, in addition to a mid- and peripheral region, a rod-enriched periphery and a cone-enriched area centralis, also referred to as a visual streak (VS), that resembles the human macula [
39,
40,
41]. The treatment for the experiment presented here was always applied within the VS area. To reach the VS area, a wide-angle lens (Widefield Imaging Module, Heidelberg Engineering, Heidelberg, Germany) with a 55° field of view was used in front of the cSLO. Once the desired area was localized (VS area nasal to the optic disc), the delivery optics were switched back to the standard 30° lens for the remaining treatment.
The treatment pattern consisted of a test region surrounded by 29 reliably detectable marker lesions (
Figure 1b). These marker lesions were applied in CW mode (200 ms pulse duration and 200 mW pulse power). Inside the demarcation frame, the microsecond laser probe region was placed, consisting of a pattern of 12 × 15 lesions. Sets of laser pulses with increasing energy grouped in durations of 8, 12, 16, and 20 µs were applied. The pulse energy was adapted according to a recent in vivo animal study [
22,
42] to meet the microsecond pulse duration range described in detail in the introduction. As depicted in
Figure 1c, the pulse duration was increased from top to bottom and the pulse energy was increased from left (20 µJ) to right (160 µJ).
Each pulse duration setting was further split into three different laser application modes: single pulse, pulse ramp (1 to 15 pulses, 100 Hz repetition rate) and pulse burst (15 pulses, 100 Hz repetition rate). Thereby, the individual maximum pulse energy per lesion was identical within vertical subgroups, while the accumulated exposure differed horizontally. The pulse energy was measured using a calibrated energy meter (J-10MB-LE, Coherent, Santa Clara, CA, USA) prior to the experiments in front of the laser aperture of the system.
In each case, the exposure position of the retina was optimized using live OCT B-scans prior to laser application. This ensures that each lesion is optimally focused despite chromatic aberrations.
2.4. Fundus Examinations
Within 30 min after laser irradiation, color fundus photography (CFP) and OCT B-scans were acquired. CFP was assessed using a fundus camera (Fundus Module 300, Haag-Streit, Köniz, Switzerland). OCT B-scans were acquired over the treatment region using a pre-defined OCT scan pattern (size: 30° × 20° (8.9 × 6.0 mm2); number of B-scans: 97; images averaged per B-scan: 38) to compare morphological changes with RPE lesion formation.
For probit analysis, barely visible and visible lesions on CFP imaging were scored as 1 (suprathreshold). Lesions not visible according to CFP were scored as 0 (subthreshold). Using the OCT B-scans possible retinal perturbation was assessed with emphasis on the ellipsoid zone (EZ), formerly known as the inner/outer segment of photoreceptors (IS/OS), and the area up to the outer plexiform layer (OPL) (
Figure 1g). Suprathreshold treatment (scored as 1) was considered to have occurred when any of the following changes were evident within a B-scan in the laser lesion: thickening and hyperreflectivity in the EZ region and outer nuclear layer (ONL), continuous columnar hyperreflectivity from the RPE/BM (Bruch’s membrane) complex to the OPL, external limiting membrane (ELM) upward protrusion and disturbed layer continuity. Damage would of course also have been assessed if the choroid or the entire retina up to the ILM would indicate structural alterations to the undisturbed surroundings.
Figure 1g depicts an example of suprathreshold retinal tissue alterations (yellow triangles and marker lesions). Lesions without the previously described tissue alterations were considered subthreshold and scored as 0.
2.5. RPE Cell Viability Assay
After microsecond laser irradiation, the viability of RPE cells was tested by using a two-color assay live/dead staining kit (L3224, Thermo Fisher Scientific, Waltham, MA, USA). The eye was carefully cut in half and the vitreous body was removed. Subsequently, a circular area on the retina was excised around the pattern with the help of the visible marker lesions. Successively, the specimens were placed in phosphate-buffered saline (PBS) for 30 min. This gently detaches the retina from the RPE and facilitates complete retinal removal. The specimens were further incubated for 30 min at room temperature using the staining kit. The viable-lethal analysis was conducted using a fluorescence microscope (Axio Lab.A1, Carl Zeiss, Oberkochen, Germany) and attached microscope camera (Gryphax Progres, Jenoptik, Jena, Germany). Thereby, green-fluorescent (emission: 517 nm) calcein-AM (live) and red-fluorescent (emission: 617 nm) ethidium homodimer-1 (EthD-1, dead) as well as bright green hyperfluorescence indicate function or loss of plasma membrane integrity. Post processing of the fluorescence images was accomplished with the Fiji image processing package distribution of ImageJ [
43].
For probit analysis, successful damage to the RPE was assessed in binary fashion using two criteria: pronounced lesion area/three cell clusters. For the criterion defined as “area,” the lesion area (including hyperfluorescent cells) had to exceed or fall below 50% of the square beam profile of 90 × 90 μm2 and thus be scored as 1 (RPE damage present) or 0 (no damage). For the criterion defined as “cluster”, three contiguous dead RPE cells (including hyperfluorescent cells) had to be present within the treatment spot area.
2.6. Fringe Washout Evaluation in OCT M-Scans
As previously mentioned, the Spectralis Centaurus device can be operated in M-scan mode to measure time-resolved sequences of A-scans at the therapy laser application site before, during and after the exposure. The evaluation of SD-OCT M-scans for fringe washouts was performed post-treatment visually (investigator based) and using the algorithm for RFD introduced by Burri et al. [
31].
In view of future clinical applications, the RFD algorithm features a variable parameter (-value). This parameter determines the sensitivity ratio between the fringe washout-based filter edge response and the background noise of the M-scan and has to be set manually by the operator. This will give the dosimetry algorithm a certain flexibility to adapt to different anatomical, optical or clinical ocular conditions. To check which algorithm setting could be suitable for future clinical applications, M-scan data was analyzed for fringe washouts with different -values. Therefore, all acquired M-scans were evaluated with 18 different -values ranging from 5 to 100.
For probit analysis, fringe washout, i.e., loss of the interference signal was defined as a temporal signal loss over one A-scan integration time (11.8 µs) or longer and axial over 5 pixels (11.4 µm/pixel) or more as a criterion for the investigator-based examination. Such a signal loss was scored as 1 (fringe washout present). Weaker signal losses or signal disturbances (change in scatter behavior) were not evaluated and scored as 0 (no fringe washout). For the algorithm, probit analysis was performed based on the detected fringe washouts according to the overall best-performing -values (single: ; ramp: ; burst: ).
2.7. Probit Analysis
To investigate the influence of different laser parameters a probit analysis was performed to calculate dose–response percentiles. The median exposure dose, i.e., the dose at which 50% of the exposures resulted in a response, i.e., a detectable RPE laser lesion, is referred to as the effective dose ED
50. Correspondingly, the exposure doses at which 16% and 84% of the exposures resulted in detected lesions are referred to as ED
16 and ED
84, respectively. The logarithms of these points represent 1 standard deviation in the normal distribution from the logarithm of the median dose [
44]. The previously mentioned binary evaluation for RPE cell damage, fringe washouts in OCT M-scans as well as suprathreshold lesions according to CFP and OCT B-scan imaging served as input for the probit analysis. The analysis was performed with Origin 2023 (OriginLab Corporation, Northampton, MA, USA) utilizing the Levenberg Marquardt iteration algorithm to fit with a χ
2 tolerance value of 1 × 10
−9 within up to 400 iteration steps.
2.8. Statistical Evaluation
The ground truth for the statistical evaluation was based on the RPE cell viability assay and the hypothesis that RPE lesions due to MBF lead to fringe washouts in SD-OCT M-scans. For statistical evaluation, the occurrence of fringe washouts (predictive class) was compared to the damage outcome on the viability assay (actual class) by using the confusion matrix as described by Burri et al. [
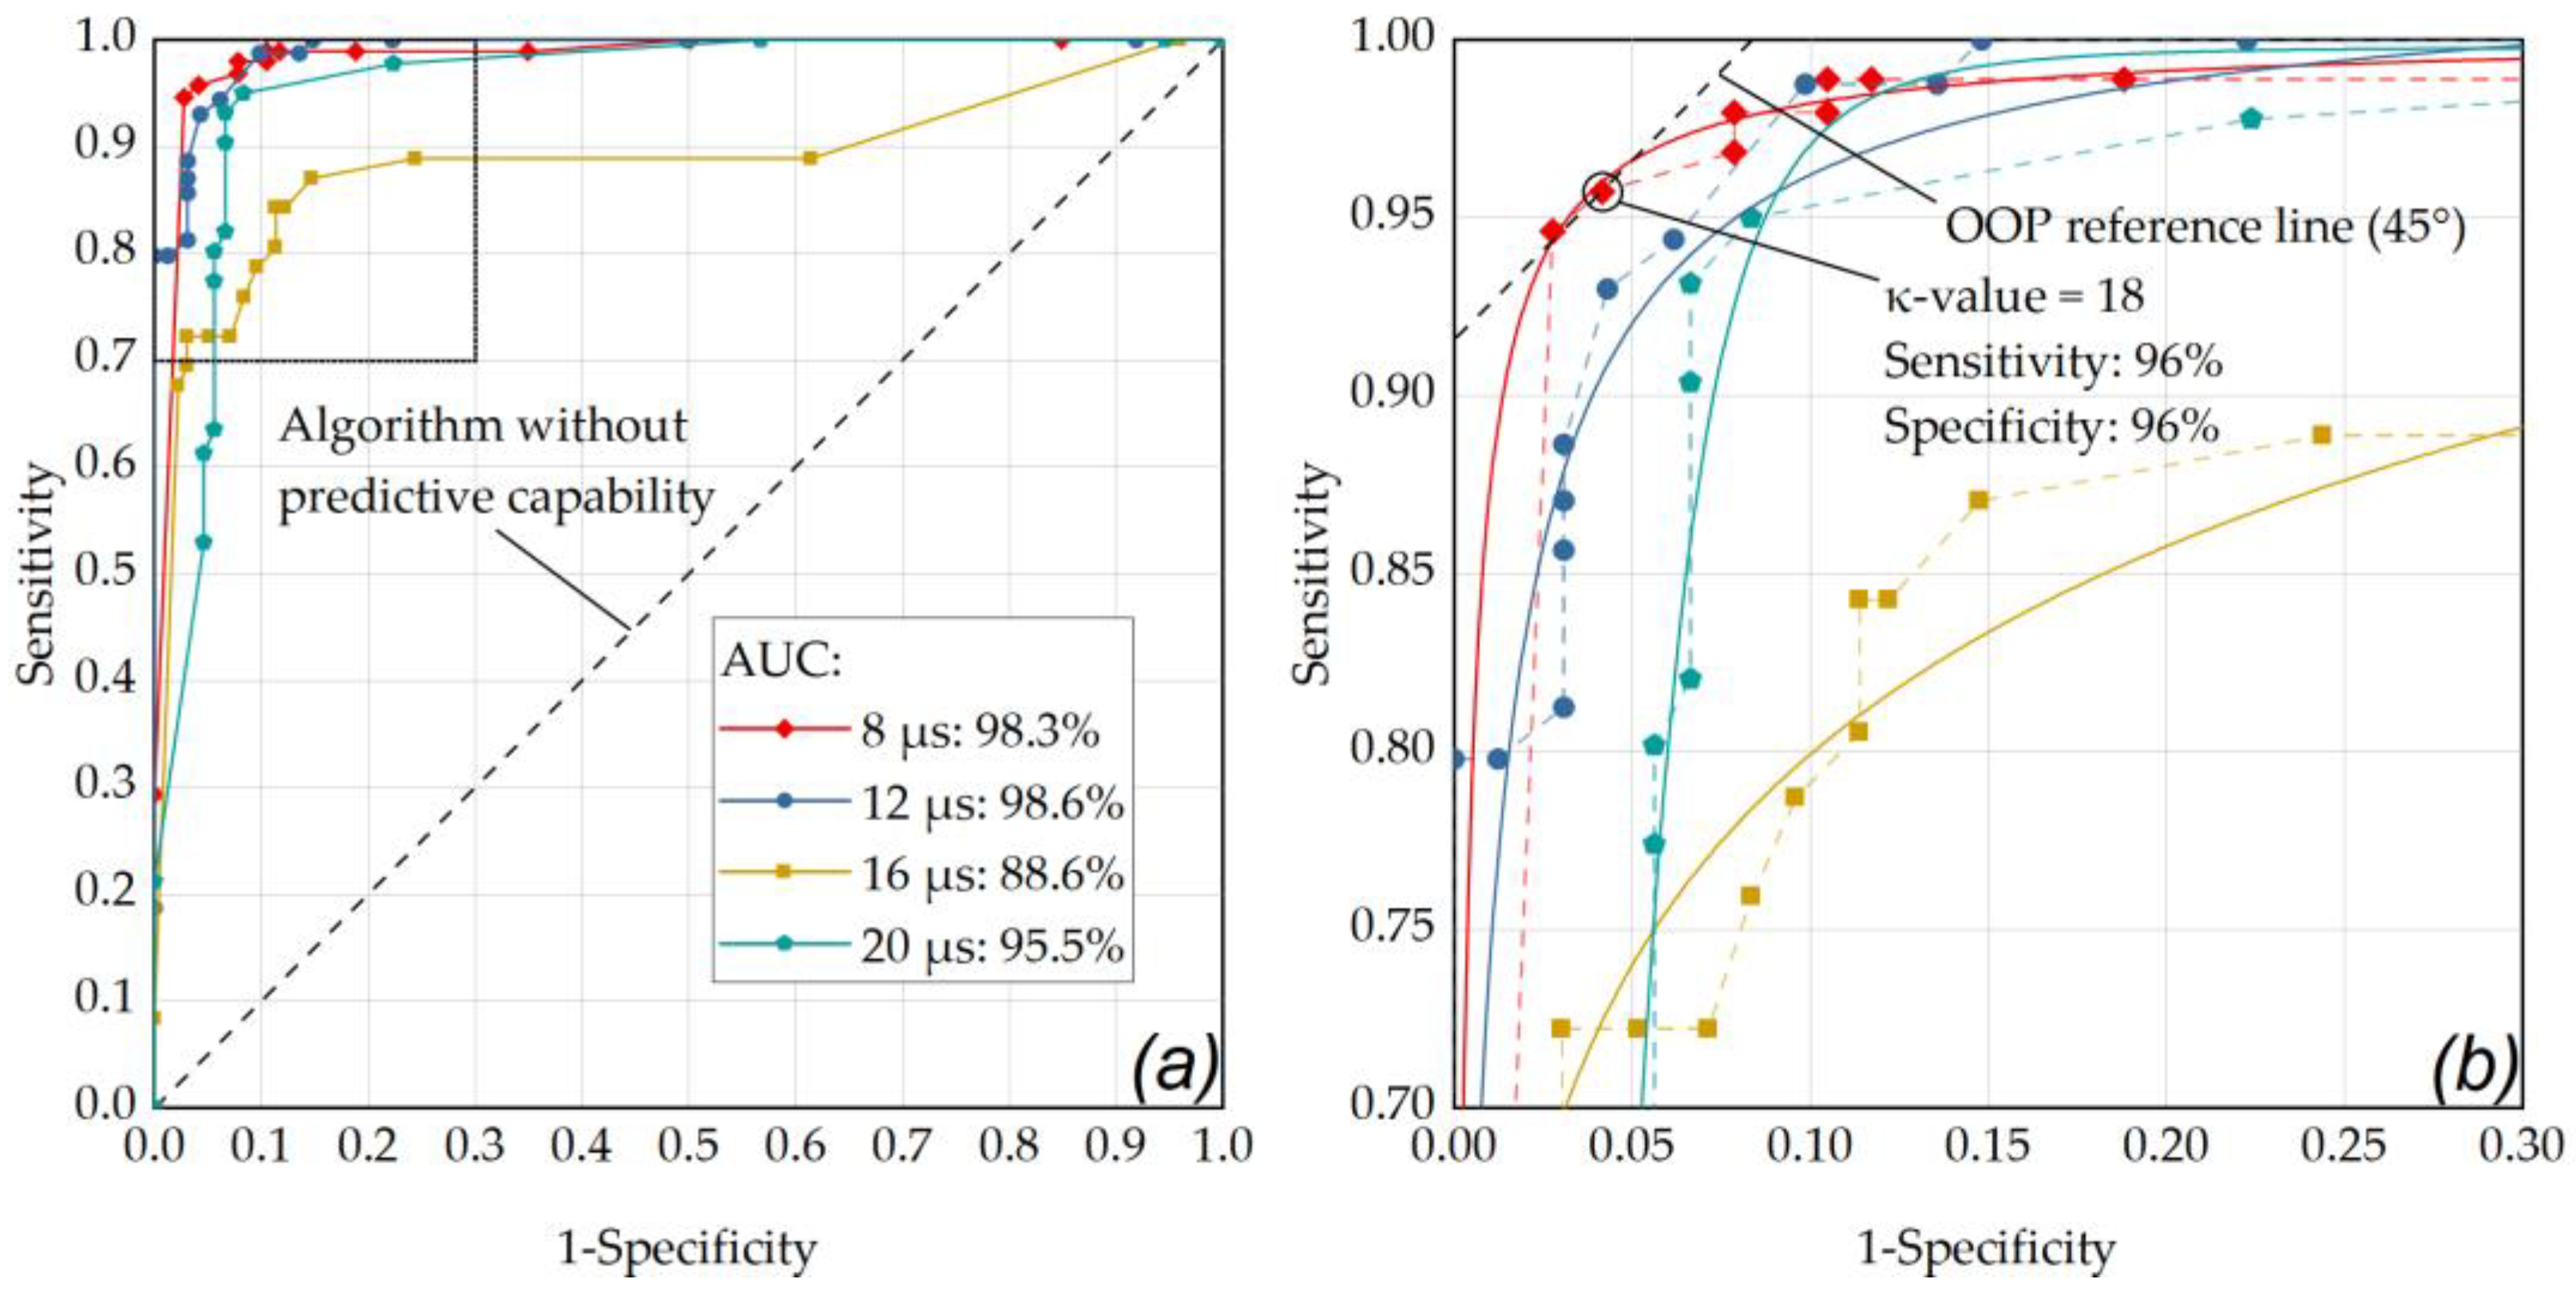
31]. The confusion matrix features four cardinalities: true positive (TP), true negative (TN), false positive (FP) and false negative (FN). Thereby, positive and negative refer to the prediction (true or false) made by SD-OCT M-scans of whether an RPE lesion was created, based on the presence of fringe washouts. Based on the four cardinalities of the confusion matrix, several statistical measures were derived to present the overall device performance in a straightforward fashion. In our case, the sensitivity, specificity, accuracy, positive predictive value (PPV) and negative predictive value (NPV) were calculated. Statistical measures were then analyzed via a receiver operating characteristic (ROC) curve. The ROC of an algorithm shows its performance as a tradeoff between selectivity and sensitivity, with the optimum performance in the top-left corner of the graph. Therefore, we used the ROC curve to determine the RFD algorithm’s optimal
-value by checking the optimal operating point (OOP) for each pulse duration and each application mode. To determine for which pulse duration and application mode the dosimetry algorithm gave the best overall performance, the area under the ROC curve (AUC) was calculated.
4. Discussion
As already found in in vivo experiments by Framme et al. in 2004, when using laser pulses of 200 ns and 1.7 µs duration, the laser pulse duration and the number of applied pulses have a significant influence on RPE damage thresholds and consecutively on TW and SR [
46]. In this work, we have investigated a range of longer, better controllable pulse durations utilizing a flexible high-power CW prototype SRT laser in the range of 8 µs to 20 µs with different application modes (single, ramp, burst), with a precisely positionable exposure field and a sensitive set of diagnostic methods to determine cellular effects. Recently, a Q-switched Nd:YLF (Neodymium-doped Yttrium Lithium Fluoride) laser emitting at 527 nm has been widely used for SRT. Since this laser operates at a pulse duration of 1.7 µs, relatively high powers around 200 W are required to achieve the desired maximum pulse energy of up to 350 µJ [
47]. However, our results indicate that, especially for pulse durations shorter than 12 µs, new flexible CW lasers with high power (around 30 W) should also be considered for SRT, since at these pulse durations RPE damage seems to be possible without cumulative damage. In other words, with the laser used for this study and under suitable boundary conditions such as a repetition rate of 100 Hz, it is apparently possible to work within the thermal confinement of the RPE cell layer. Therefore, this laser has the potential to cover the entire laser treatment range from SRT to sublethal hyperthermia-inducing short pulse applications to traditional CW photocoagulation due to its functionality, flexibility and power.
As already shown in previous work [
31] and confirmed by the results of Framme et al. [
34,
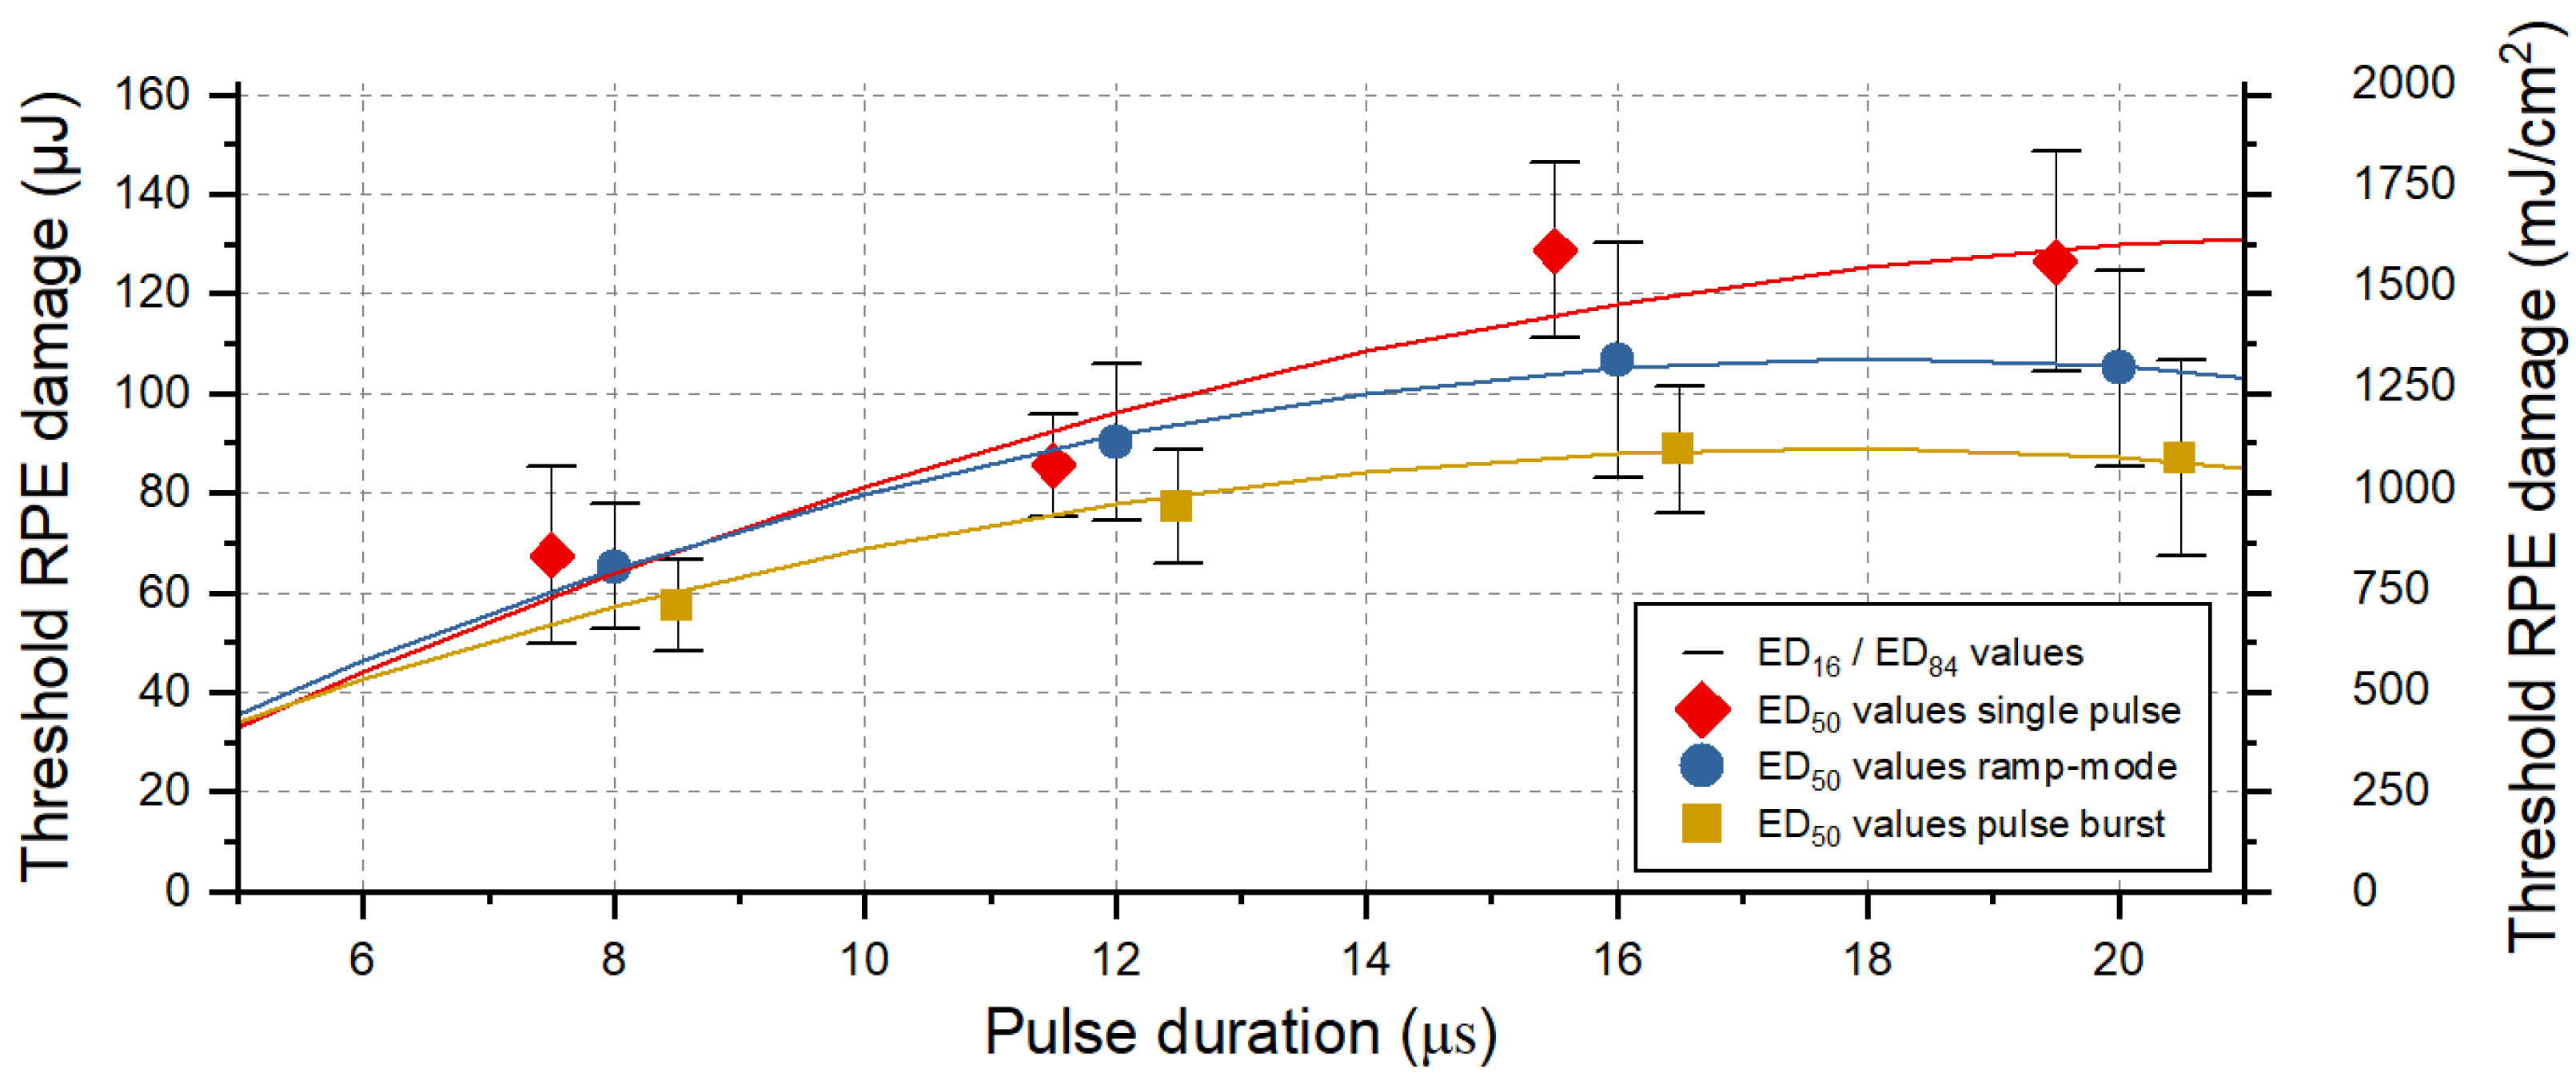
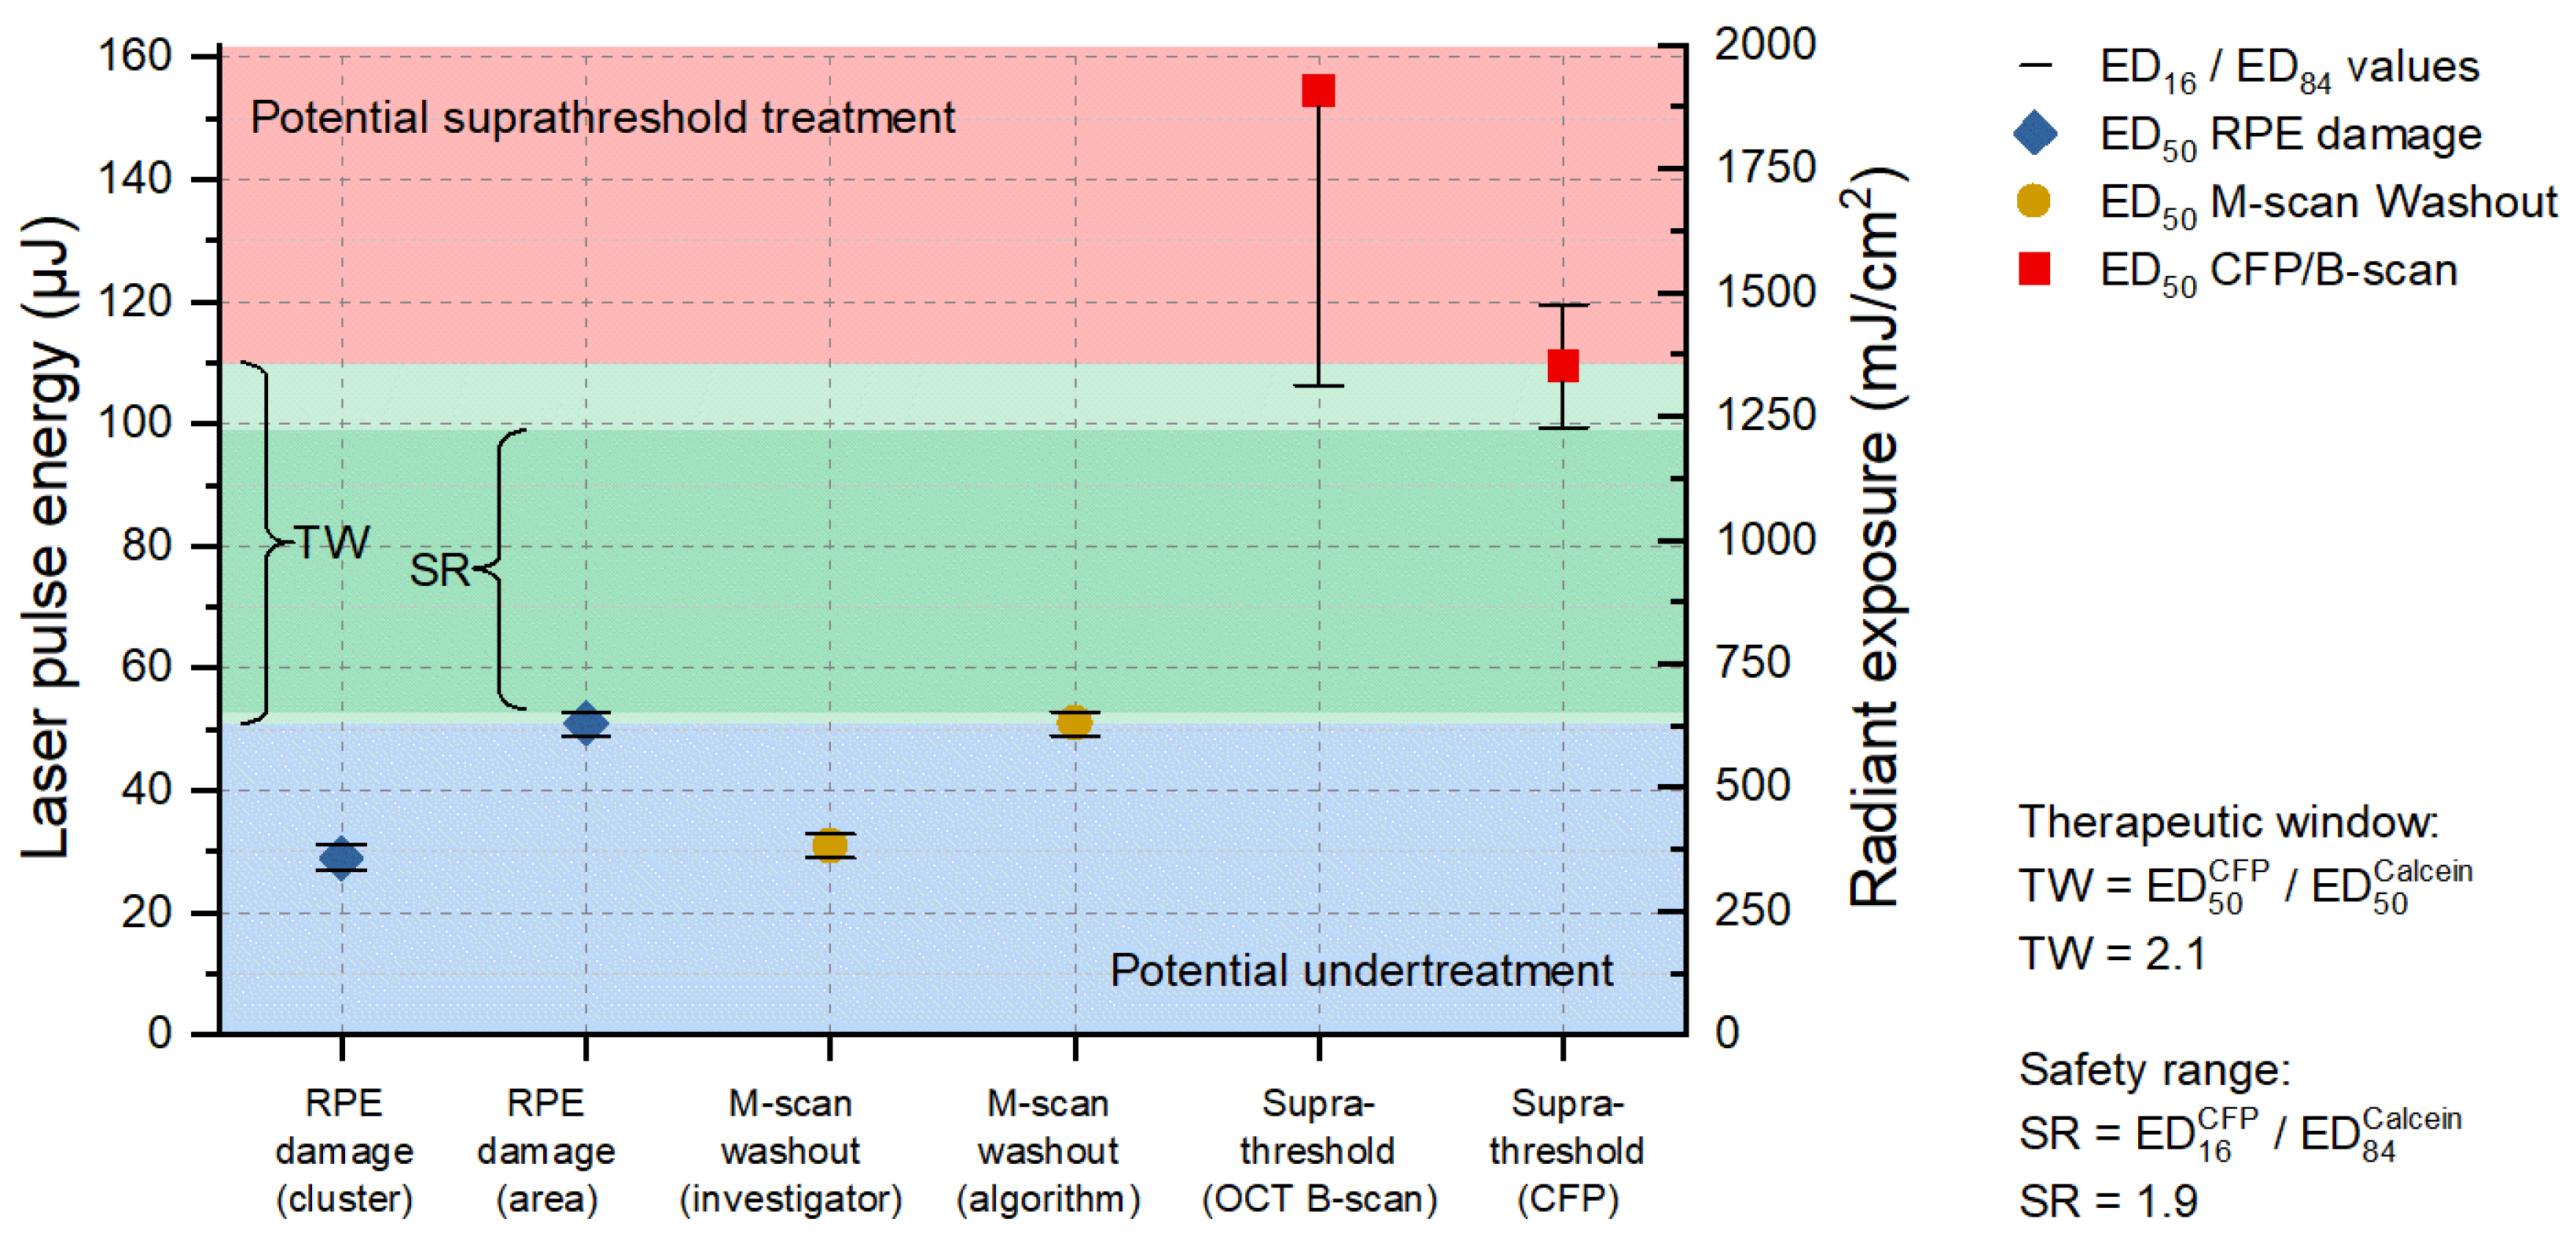
46], this study shows once more that the RPE damage threshold decreases with a shorter pulse duration (
Figure 2). With shorter pulses, less heat dissipates from the melanosomes into the tissue. Therefore, less energy is required to heat the melanosomes leading to MBF and consequent rupture of RPE cells [
48].
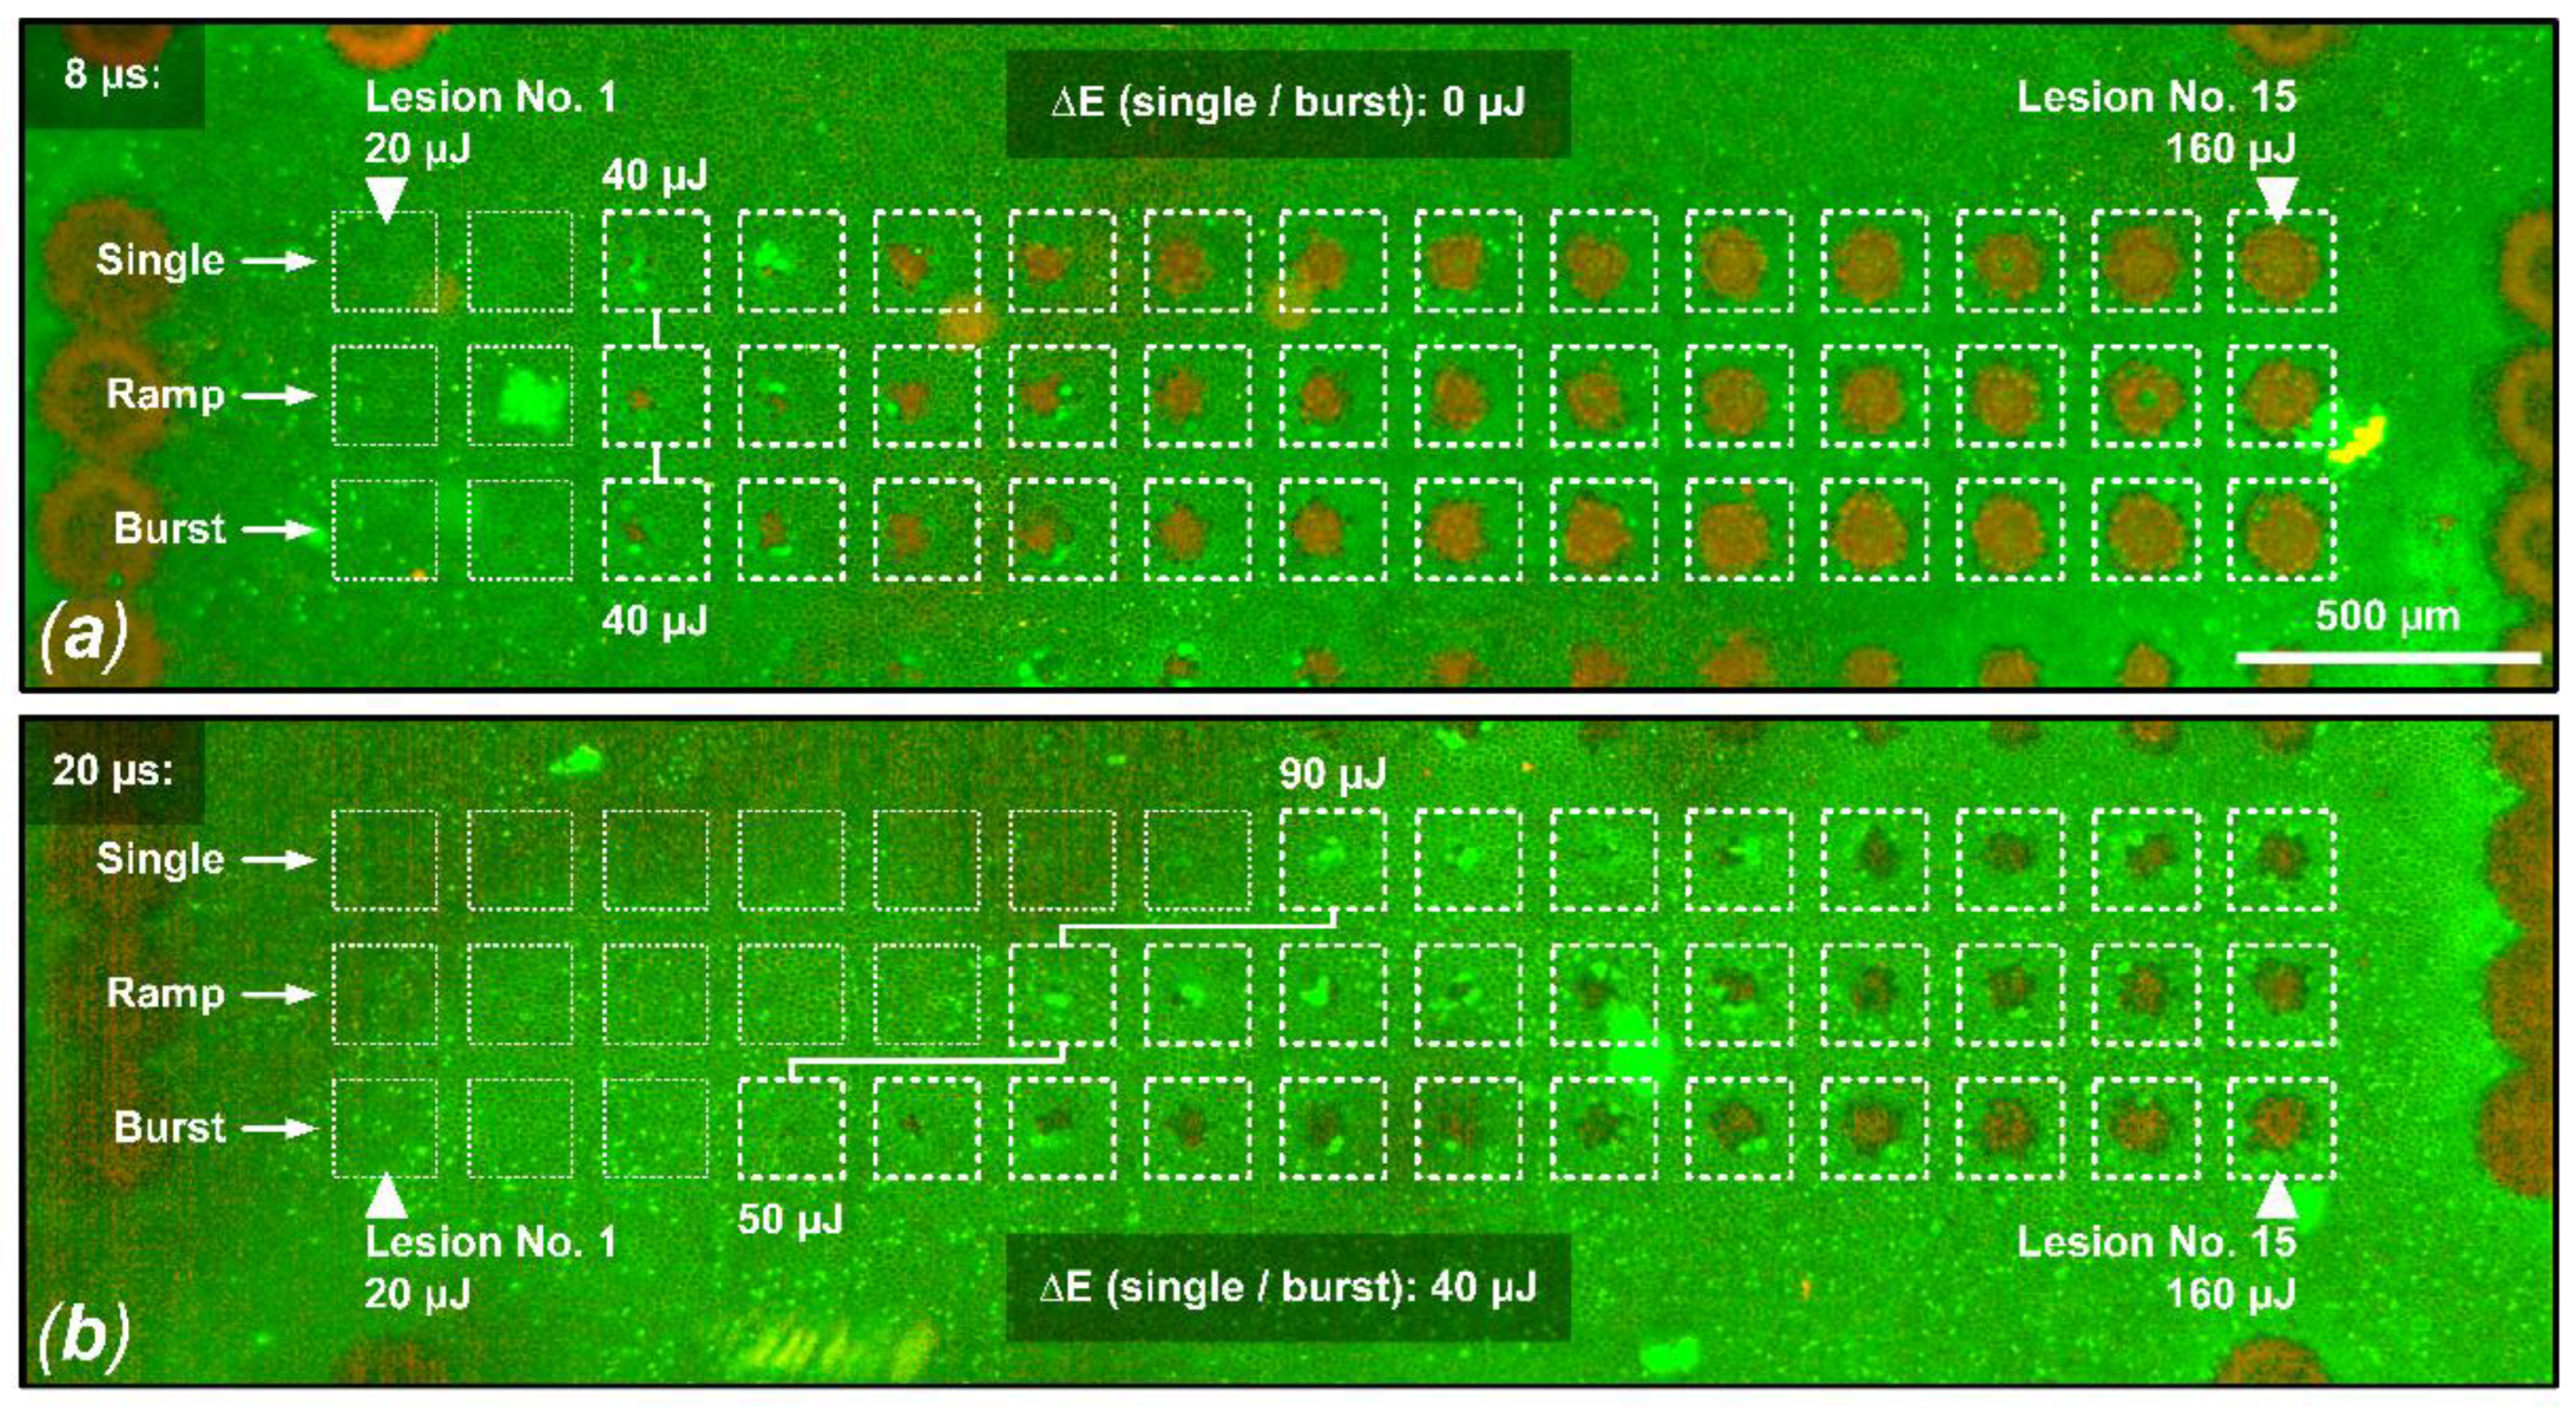
As shown in
Figure 2 and the cell viability assay for sample No. 8. in
Figure 3, for pulse durations of 16 µs and especially 20 µs, the thermal confinement of the RPE seems to be exceeded. Cumulative RPE damage effects become evident when multiple pulses per lesion are delivered at a repetition rate of 100 Hz for these pulse durations. The tissue has too little time to sufficiently cool during the individual pulses, which probably leads to a slow but steady increase in the RPE’s baseline temperature. Therefore, if heat diffusion into the neuronal retina and especially to the photoreceptors is to be prevented, as in the sense of SRT, these pulse durations seem rather unsuitable considering the applied repetition rate of 100 Hz. For pulse durations of 12 µs and especially of 8 µs, only very small cumulative effects appear. In particular, the application of pulse ramps, which is common for SRT to figure out the local TW, seems to be unproblematic. This observed transition around 12 µs is also in good agreement with previous model calculations by Brinkmann et al. who estimated a thermal relaxation time of 10 µs for RPE cells [
3]. Furthermore, Schuele et al. were able to show that using laser pulses of 5 µs duration RPE cell damage was always associated with MBF, whereas at pulses of 50 µs duration, thermal denaturation takes over but does not fully replace microbubble formation [
49]. Complementarily, Lee et al. were able to show that by using pulses of 1, 5 and 10 µs duration, more than 95% of dead RPE cells were associated with MBF, whereas the ratio decreased to 65% and 45% for longer 20 µs and 40 µs pulses, respectively [
30]. The presented results from this study underline these findings.
Using probit analysis, we were able to determine the TW and SR for a pulse duration of 8 µs from one sample. We found a TW of 2.1 and an SR of 1.9. Similar results were found by Framme et al. in an in vivo rabbit model using a laser emitting at 527 nm and pulses of 1.7 µs duration [
46]. For the application of single pulses and pulse burst with 10 pulses (repetition rate: 100 Hz), they found a TW of 1.6 and 2.5, respectively. For the application of pulse bursts containing 10 and 100 pulses, they found an SR of 1.0 and 1.7, respectively. As mentioned before, our results are statistically not representative due to the sparse data set from a single sample. Nevertheless, our result fits well into the results from Framme et al. and thus provide the first indications on the TW and SR when using laser pulses with a duration of 8 µs. Further experiments are certainly necessary to define the TW and the SR for SRT at the pulse duration used by us in order to ensure a safe clinical application.
CFP unveiled only a limited number of barely visible lesions within the SRT probe areas, which indicate marginally suprathreshold treatments. Such lesions are also described in a clinical SRT study by Park et al. and were not defined as conventional coagulation scars as they differ in shape, color and appearance [
14]. Clinically, such lesions did not lead to long-term morphological changes in the retina and disappeared within six months. The same applies to the corresponding slight morphological changes according to the OCT B-scan images. Such effects are also known from clinical SRT studies and were reversible without retinal damage [
50]. However, an improved RFD algorithm should avoid marginal suprathreshold effects in the first place.
Recently, similar laser parameters were applied to porcine RPE–choroid–sclera explants using the Spectralis Centaurus device [
31]. In these experiments, we found a similar setting (
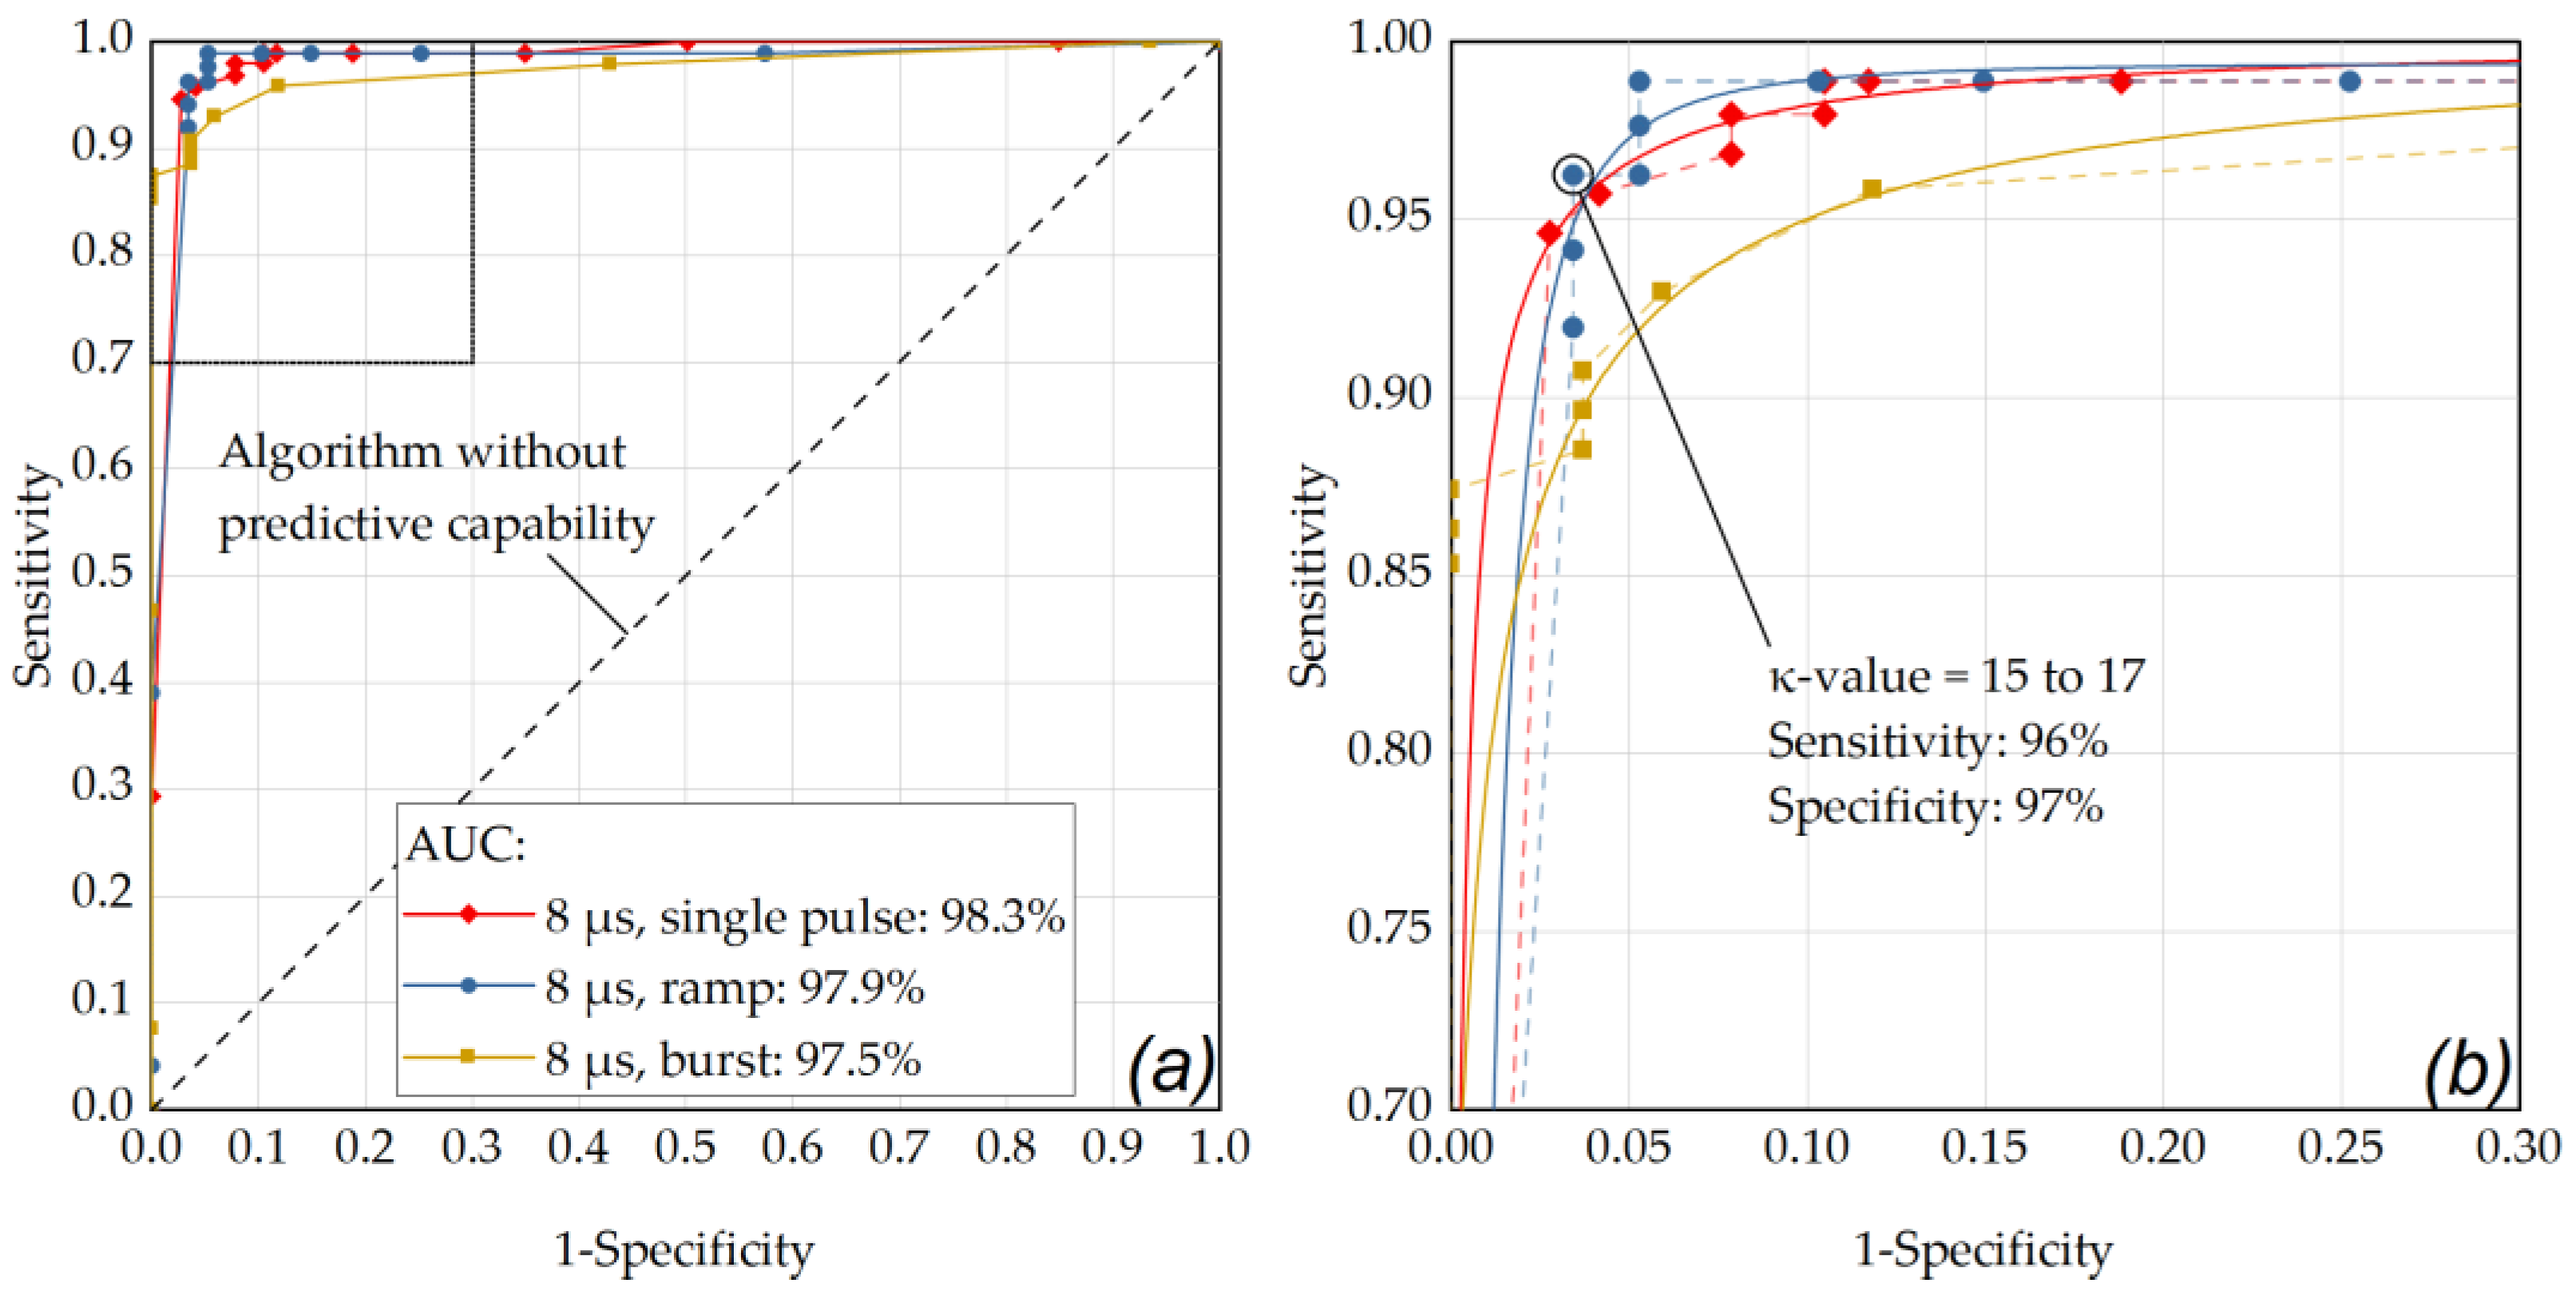
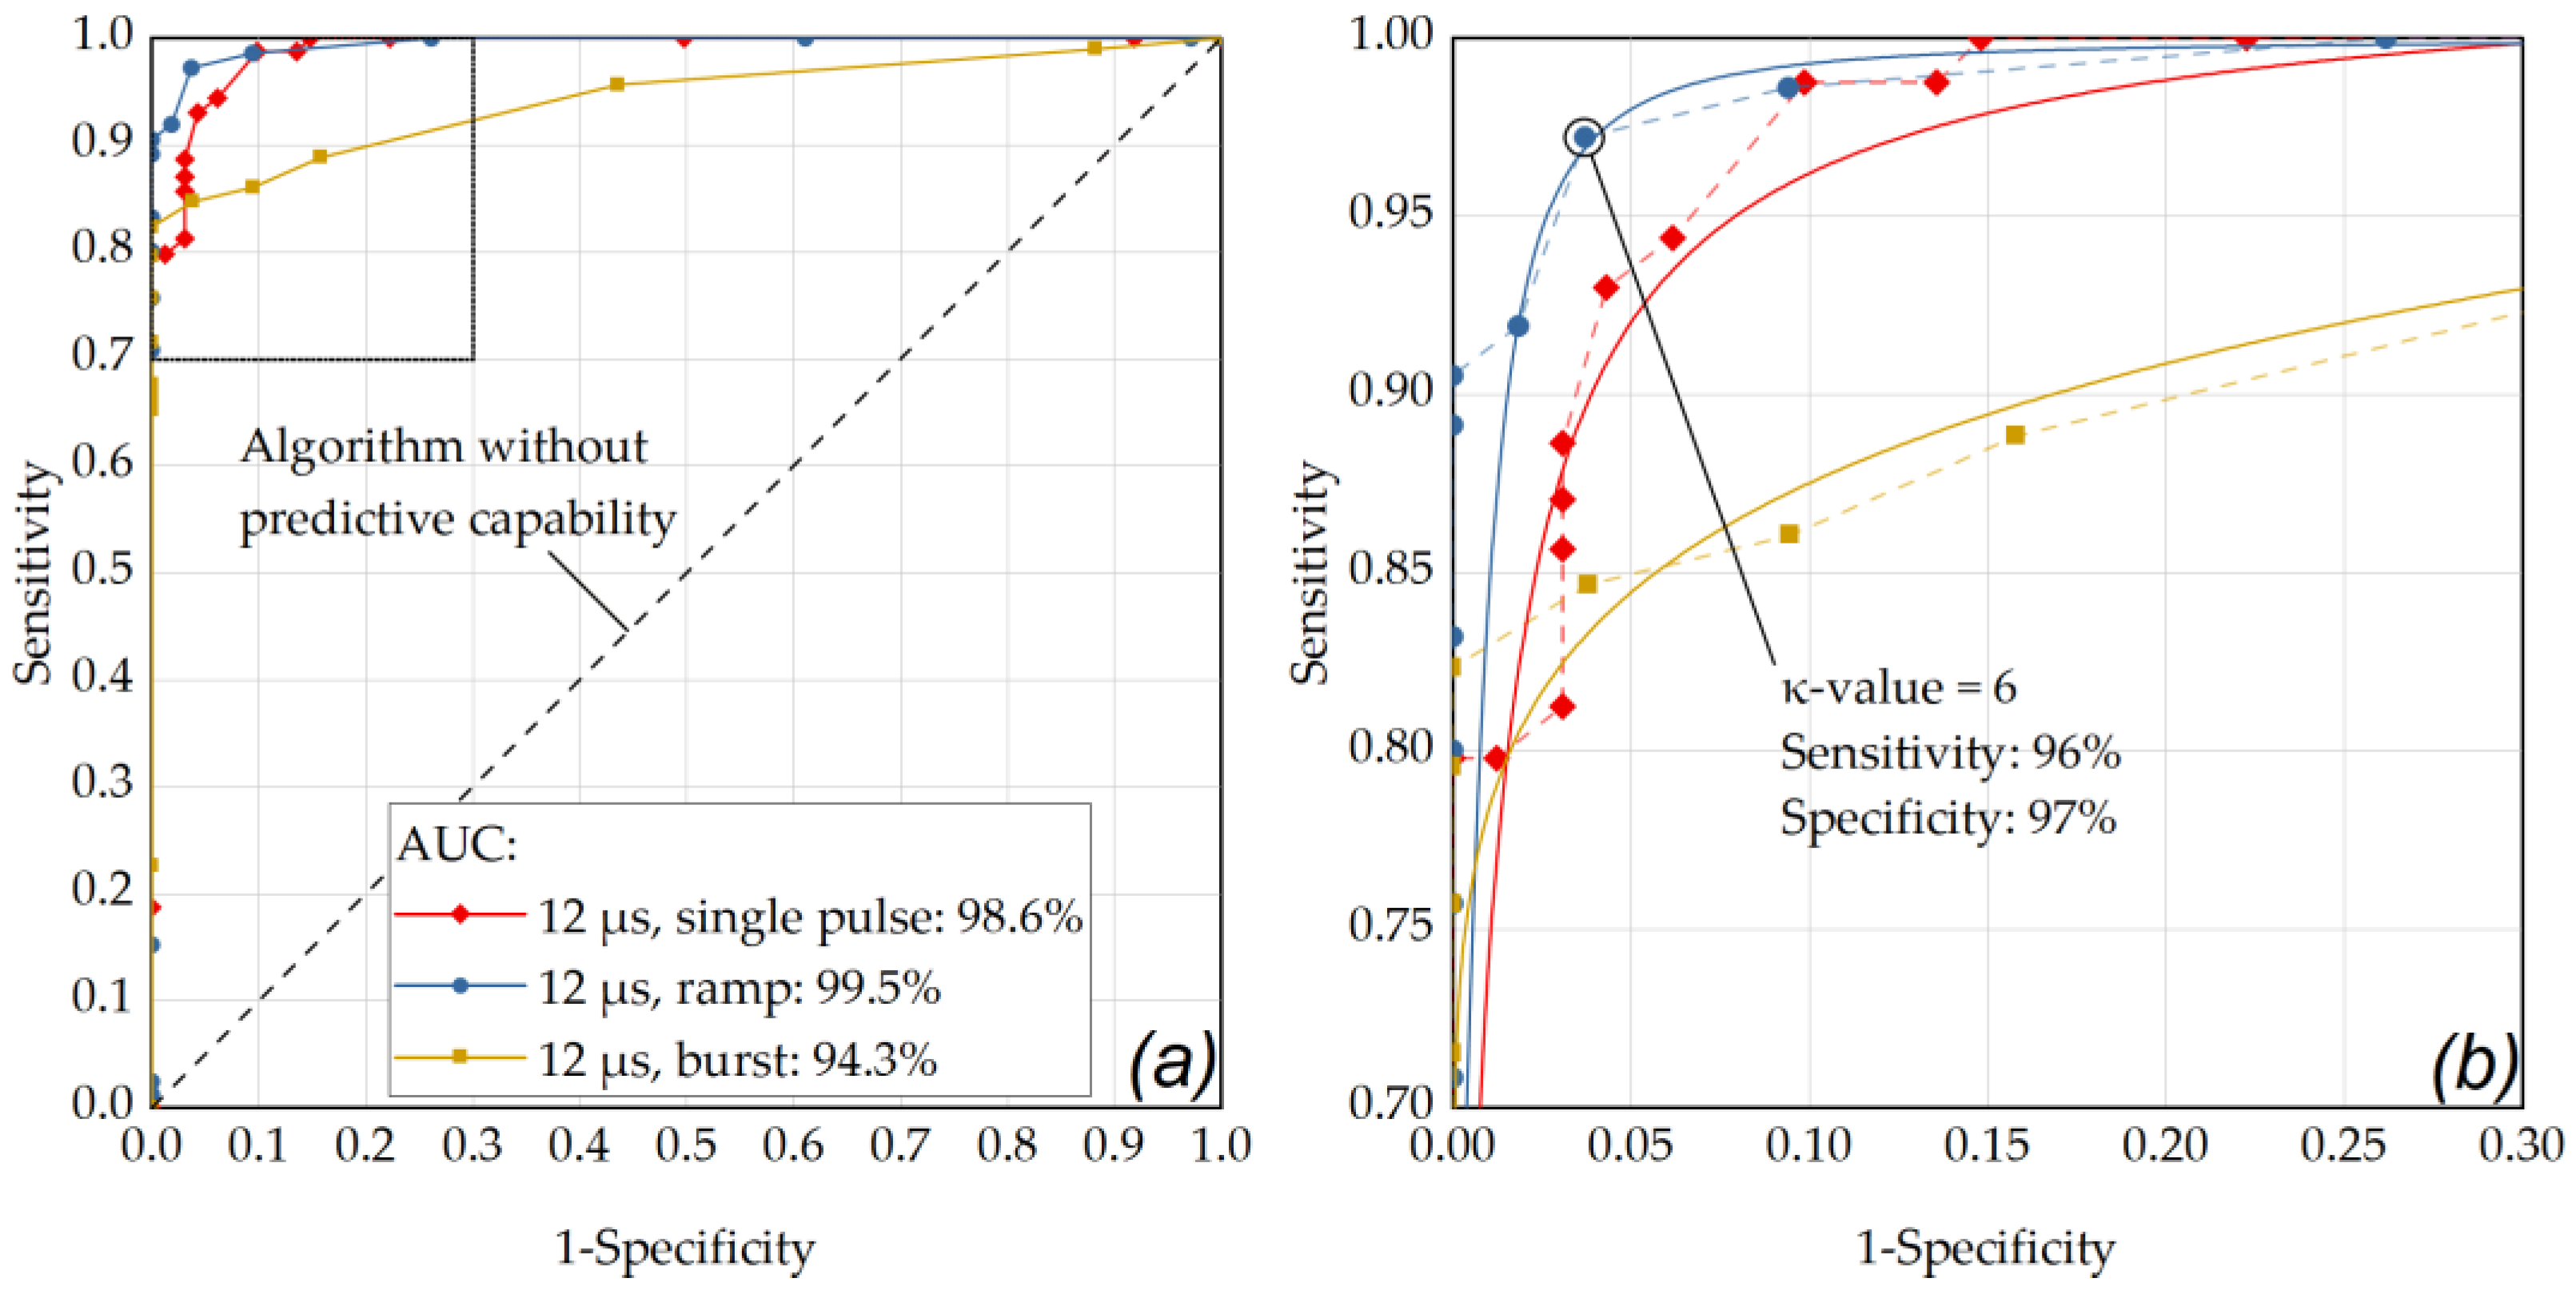
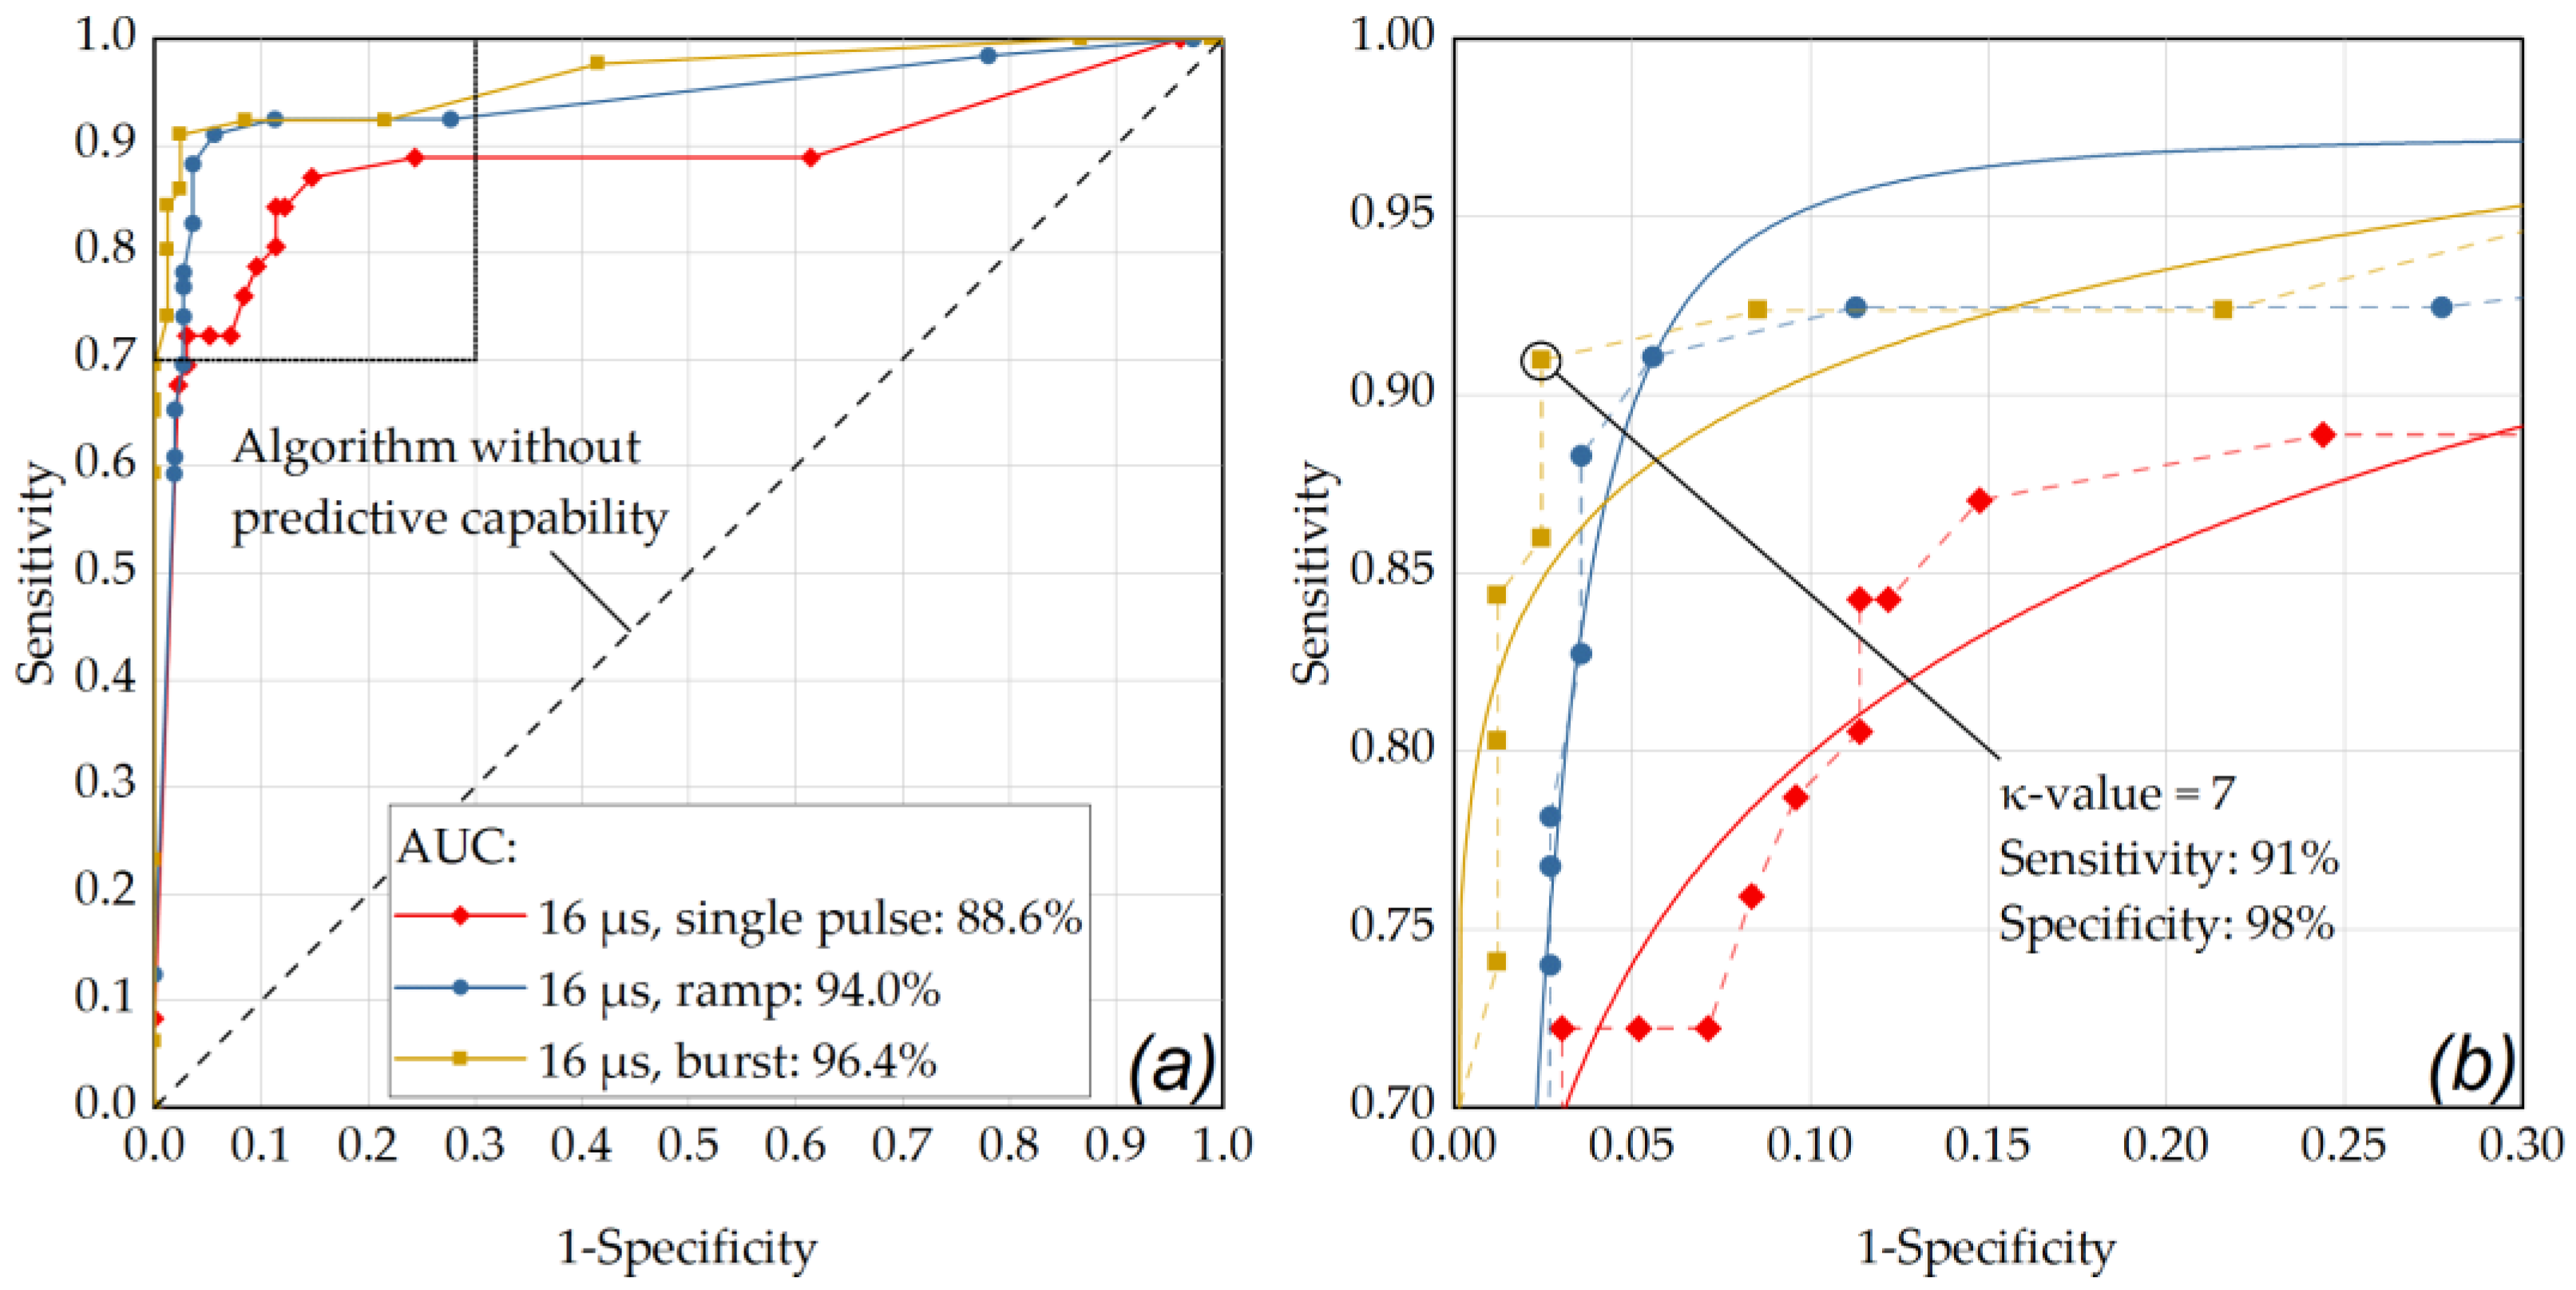
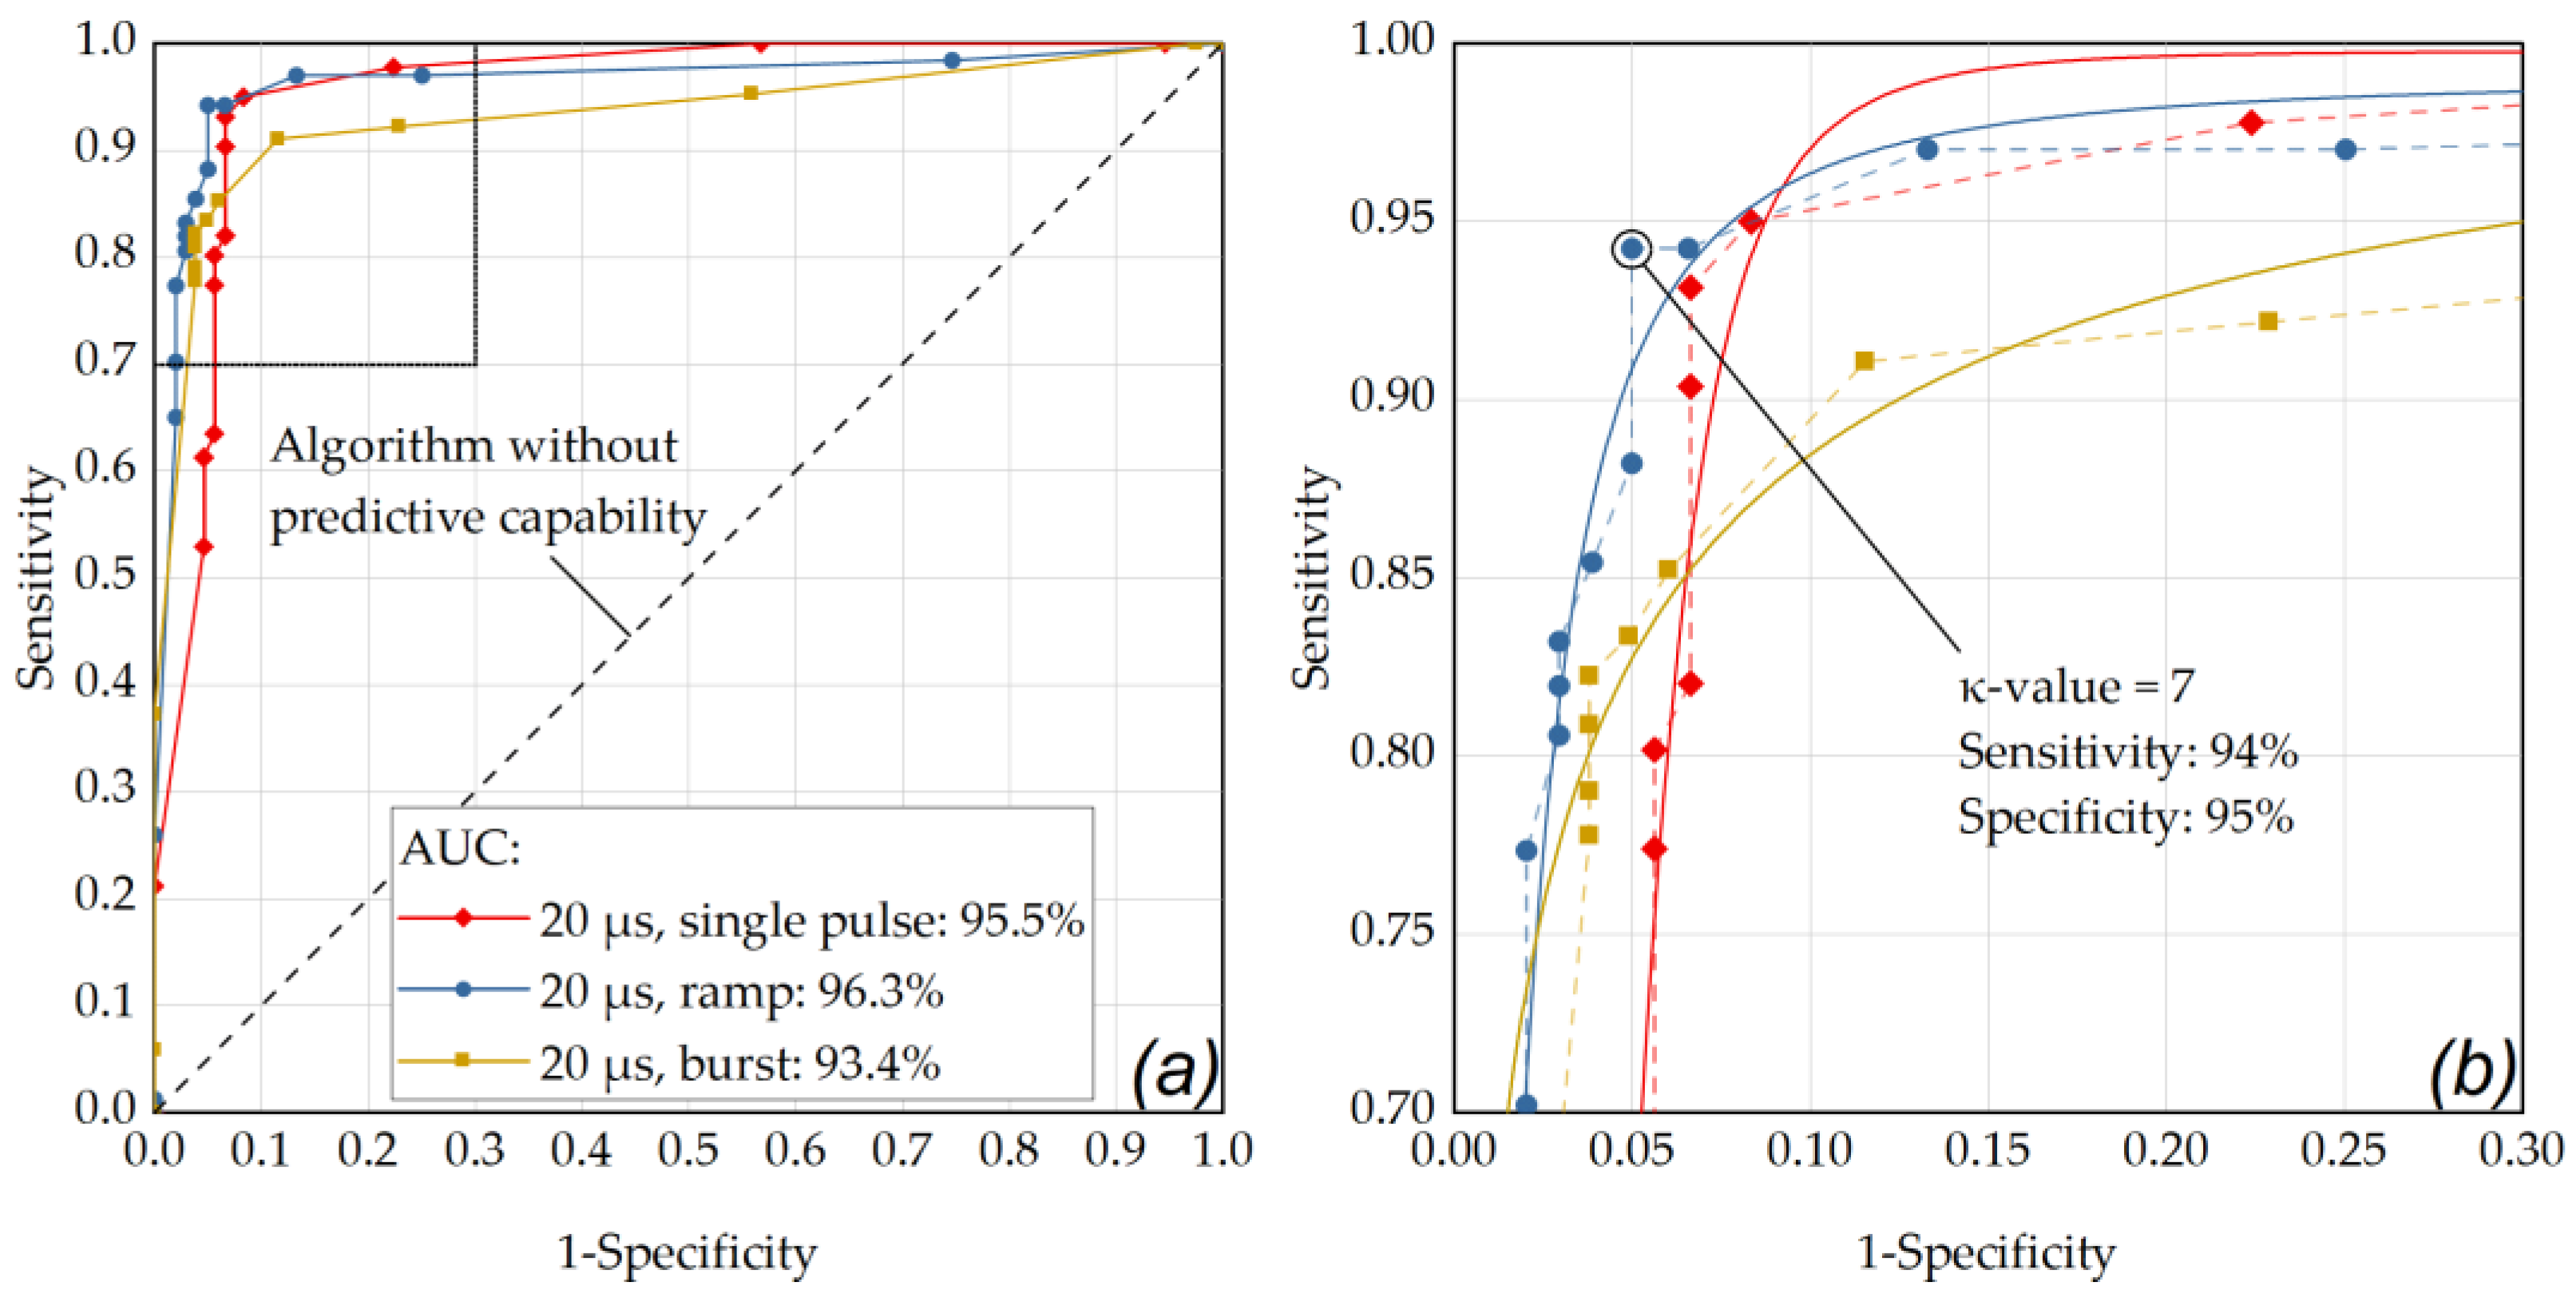
κ-value of 13 at a laser pulse duration of 6 µs) as the optimal operation point for the RFD algorithm. However, the achieved specificity (94%) and especially the sensitivity (89%) at that time were considerably lower than in the experiments shown here. With hindsight, we can see that this was caused by the utilized RPE–choroid–sclera explants and the RPE cell viability assay evaluation criterion of small cell clusters. On RPE–sclera–choroid explants, our RFD algorithm has a much smaller measurement range for detecting fringe washouts in SD-OCT M-scans due to the absence of the neurosensory retina. This difference resulted in a higher sensitivity of up to 96% (
Figure A1 and
Figure A2) in this experiment. Since whole eyes would of course be treated in a clinical setting, it can be assumed that the high sensitivity of around 96% would also be achieved in humans. Even more so, it can be assumed that in humans the OCT feedback would further improve with an optimally moistened cornea and a retina free of edema based on the in vivo situation. Furthermore, the RFD algorithm was developed for a different positive detection criterion (at least 50% dead RPE cells within the exposure spot) than the criterion used in the last experiment (cluster of three dead RPE cells). This criterion led to fine fringe washouts being disregarded by the algorithm, which resulted in a low number of falsely identified events and therefore a slightly lower specificity. Therefore, as suggested in the last paper, an area-based detection criterion (at least 50% dead RPE cells within the exposure spot) was implemented [
31]. This criterion is more appropriate for SRT application since it can be assumed that for the desired stimulation of metabolism after RPE cell proliferation and migration, a certain area of dead RPE cells must be present, and single dead RPE cells are not purposeful. Generally, the RFD algorithm shows a very high overall accuracy of 93% (sensitivity: 91%, specificity: 94%) when predicting RPE lesions. In particular, in the regular SRT application mode using pulse ramps, with a pulse duration of 8 µs, the performance (AUC: 98%) and the accuracy of 97% (sensitivity: 99%, specificity: 93%) are remarkable. This setting has already emerged in previous experiments [
19,
22,
31,
33,
42] and is, therefore, currently also being evaluated clinically (ClinicalTrials.gov Identifier: NCT04968756). Therefore, in vivo RFD data on our SD-OCT M-scan based algorithm and the Spectralis Centaurus device should be available soon.
The investigator-based evaluation of fringe washouts in SD-OCT M-scans yielded better results for the prediction of RPE cell clusters than for pronounced lesions (
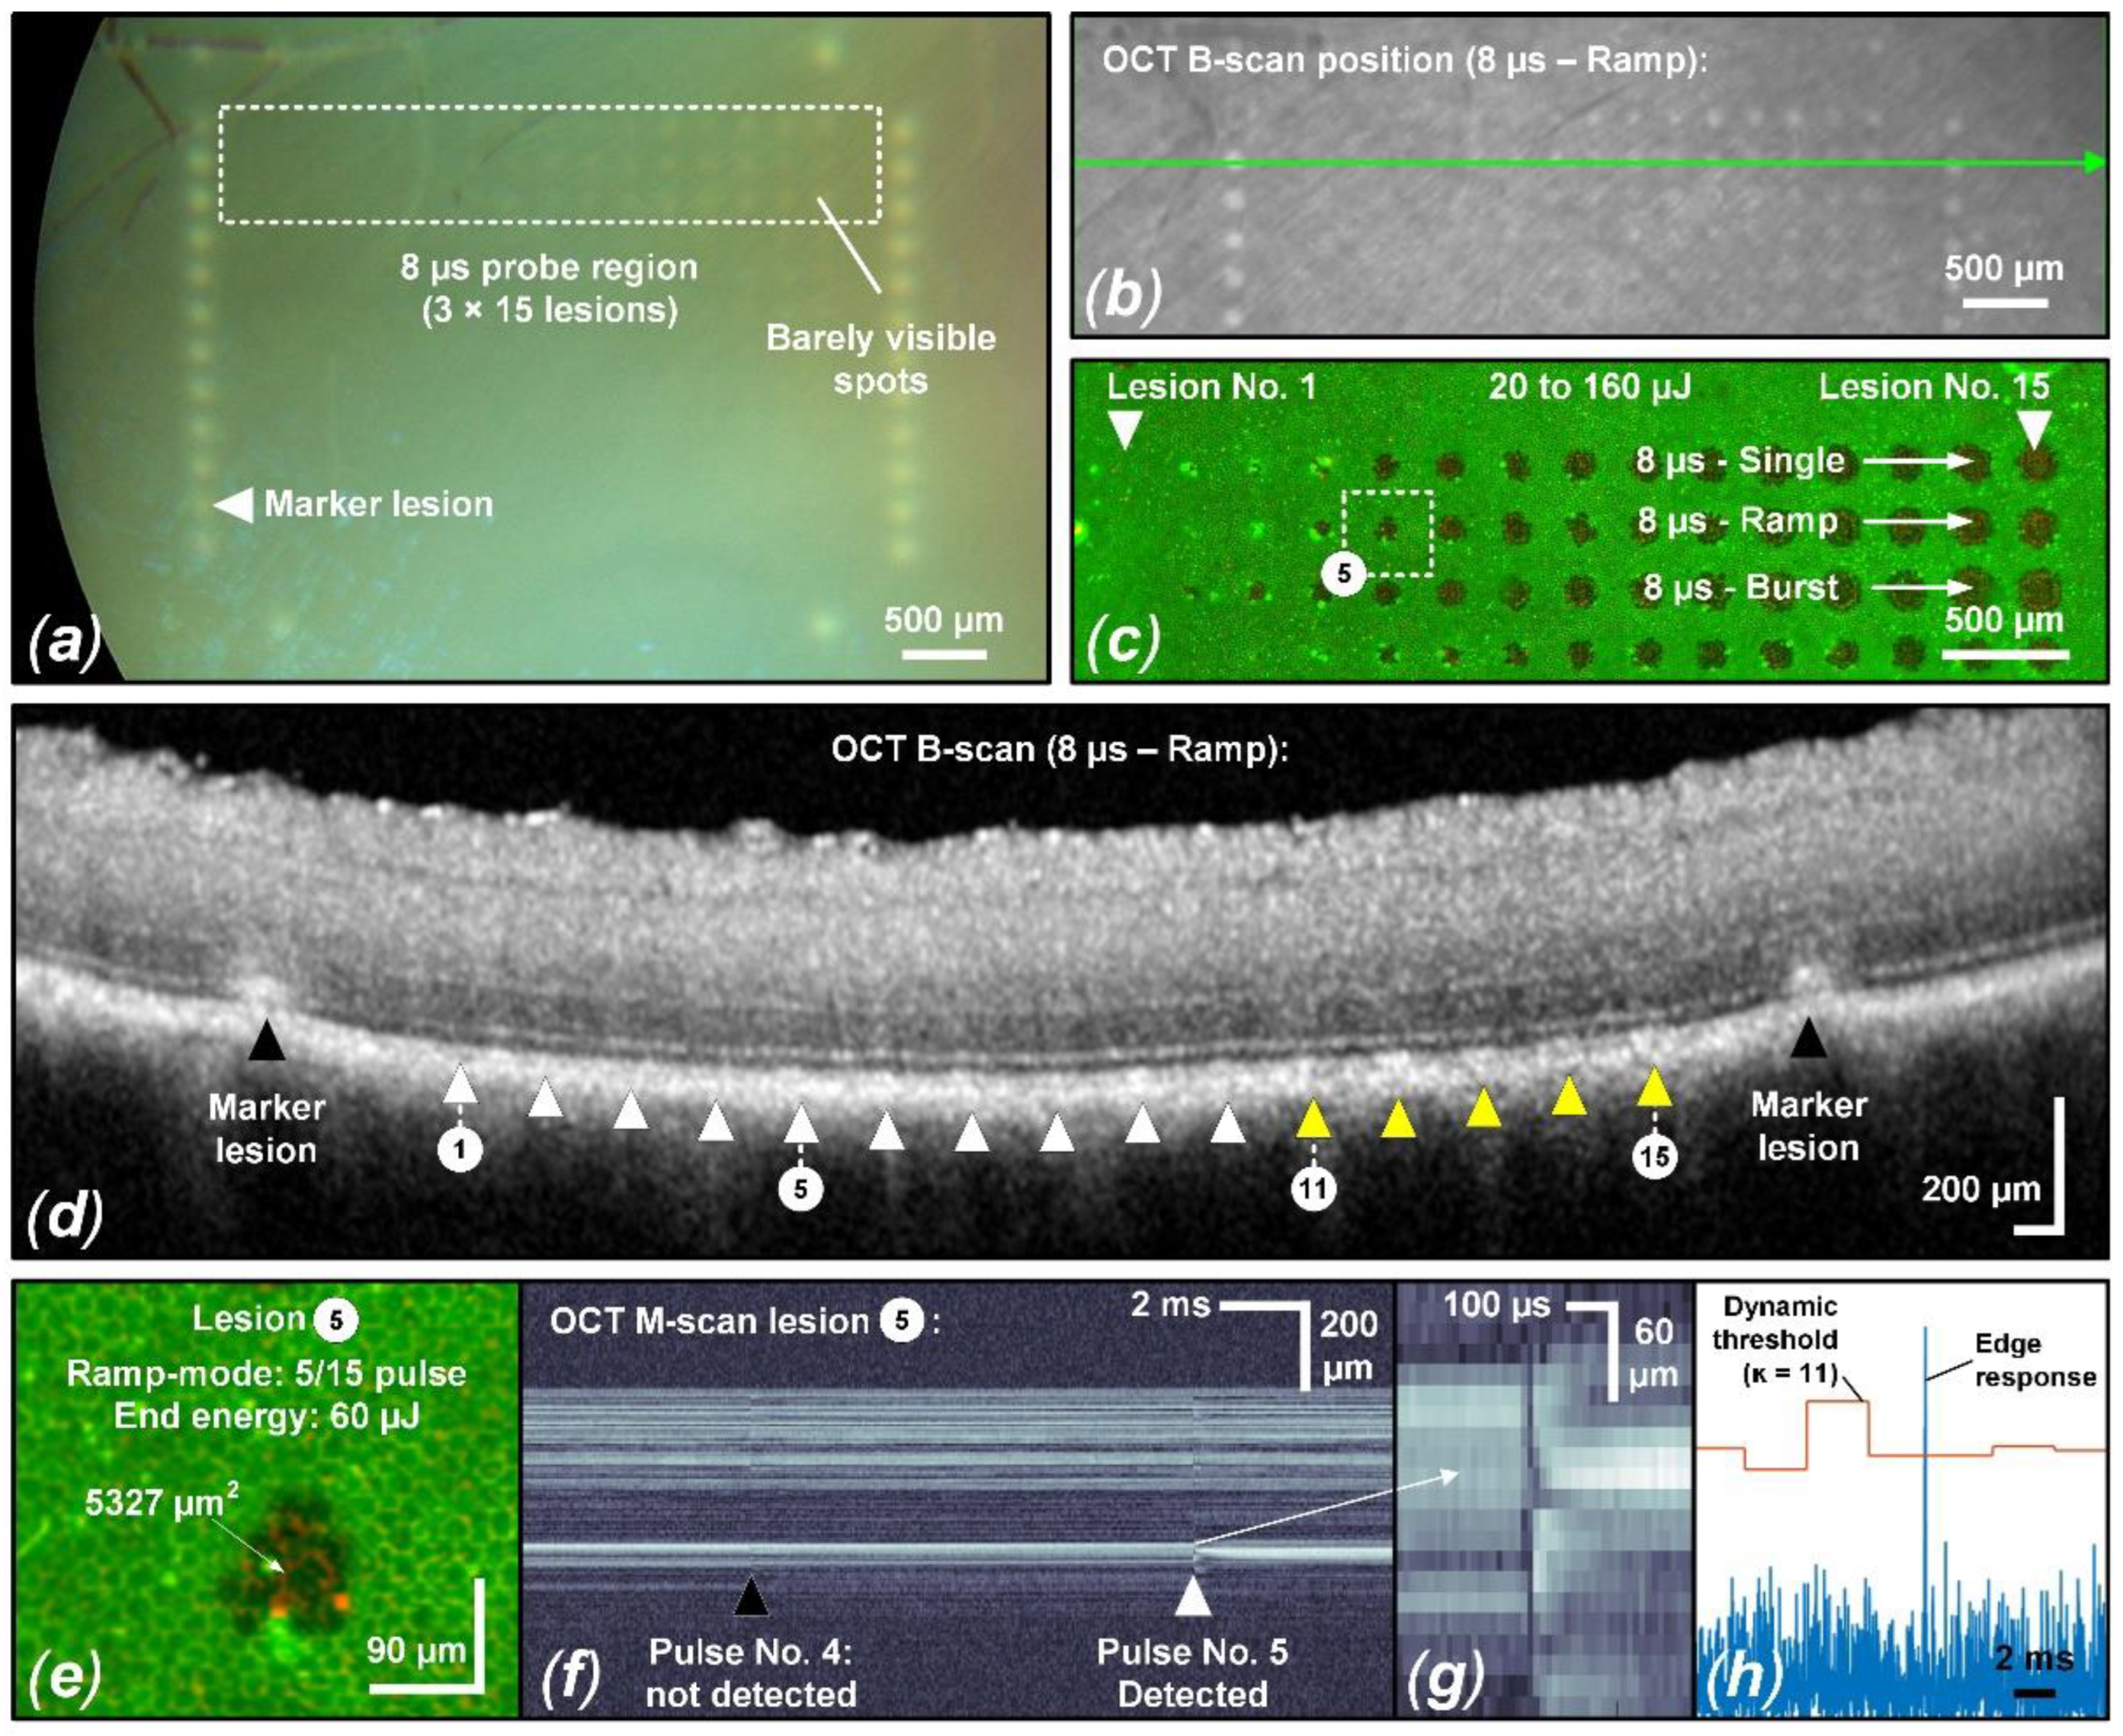
Table A4). For example, for a pulse duration of 12 µs and application in ramp mode, an accuracy of 96% (sensitivity: 97%, specificity: 90%) was obtained for RPE cell clusters, while an accuracy of 73% (sensitivity: 100%, specificity: 45%) was obtained for the detection of pronounced RPE lesions. The reason for this is that visual signal changes in the SD-OCT M-scan (change in scattering behavior) are relatively easy to detect at the level of the RPE cell layer (
Figure 4f/Pulse No. 4). These weak signal changes correlate with the destruction of single RPE cells in the laser spot, as we have already shown in previous work [
31]. In this respect, the poor specificity of 45% for the detection of pronounced lesions is expected since such lesions are not considered to be lesions anyway. In this case (12 µs, ramp mode), across all samples, 36 of 135 lesions were scored as false positives, and a sensitivity of 100% was achieved across all samples since no false negative evaluation occurred. Although our experiment shows that very good results can be obtained with the RFD algorithm, the above-described circumstance shows the great potential of RFD for SRT using SD-OCT. High sensitivity is mandatory for safe SRT application if suprathreshold lesions are to be prevented. Since our RFD algorithm was optimized to detect signal loss over one A-scan integration time rather than slight signal changes, we still see great potential to further optimize our RFD algorithm.
We found different optimal settings (individual κ-values) for the samples. Thus, for certain samples and a median κ-value of 12, we partially found an accuracy, sensitivity and specificity of 100%. For other samples, however, this value works less optimally. In this respect, it could be important to individually adapt the optimal settings when using the RFD algorithm in patients. If necessary, the baseline noise level could be re-determined or re-measured at each treatment site.
5. Limitations
A limitation of our experiment is of course related to the ex vivo experimental setting. Although the eyes were treated as soon as possible after enucleation, the intraocular pressure was maintained and the cornea was moistened, the thermodynamic processes, i.e., the movement of heat energy, may have been different from an in vivo situation. Temperature rise in tissues depends on many different factors such as heat conduction into the tissue, metabolic heat generation, and heating (cooling) by blood circulation in the tissue. For example, in the ex vivo situation, blood circulation no longer takes place and also the baseline temperature of the eyes in our experiment was at room temperature and not body temperature. Thus, there is a different heat flow or possibly also a heat accumulation in the retina that would take place differently in vivo. In this respect, the data obtained here cannot replace in vivo experiments, but they show a certain tendency about the laser–tissue interaction that could also take place in vivo. For example, in an in vivo experiment with pigmented rabbit eyes, we have already shown that when laser pulses of 20 µs duration are applied in ramp mode, more pronounced lesions appear according to OCT B-scans compared to pulses of 4 or 8 µs duration [
22]. This circumstance is reflected in this ex vivo experiment, which is why it can be assumed that the present results may also be representative of the in vivo situation.
Another limitation, which is also due to the ex vivo setting, was the OCT quality. In the OCT-B scans shown here, it is evident that despite the short time between enucleation and treatement, the retina had already begun to retain water (edema formation). As a result, the retinal structures were significantly worse to assess than one would expect from an in vivo situation. Therefore, morphologic changes were difficult to detect in OCT B-scans. Furthermore, this circumstance has a negative impact on the performance of the RFD algorithm, since a good signal-to-noise ratio (SNR) is important to reliably detect fringe washouts in OCT M-scans. In this respect, even better OCT dosimetry feedback can be expected in an in vivo setting.
