
Inflammatory Markers Showed Significant Incremental Value for Predicting Post-Hepatectomy Liver Failure in Hepatocellular Carcinoma Patients

 , ,
, ,
Abstract
:1. Introduction
2. Methods
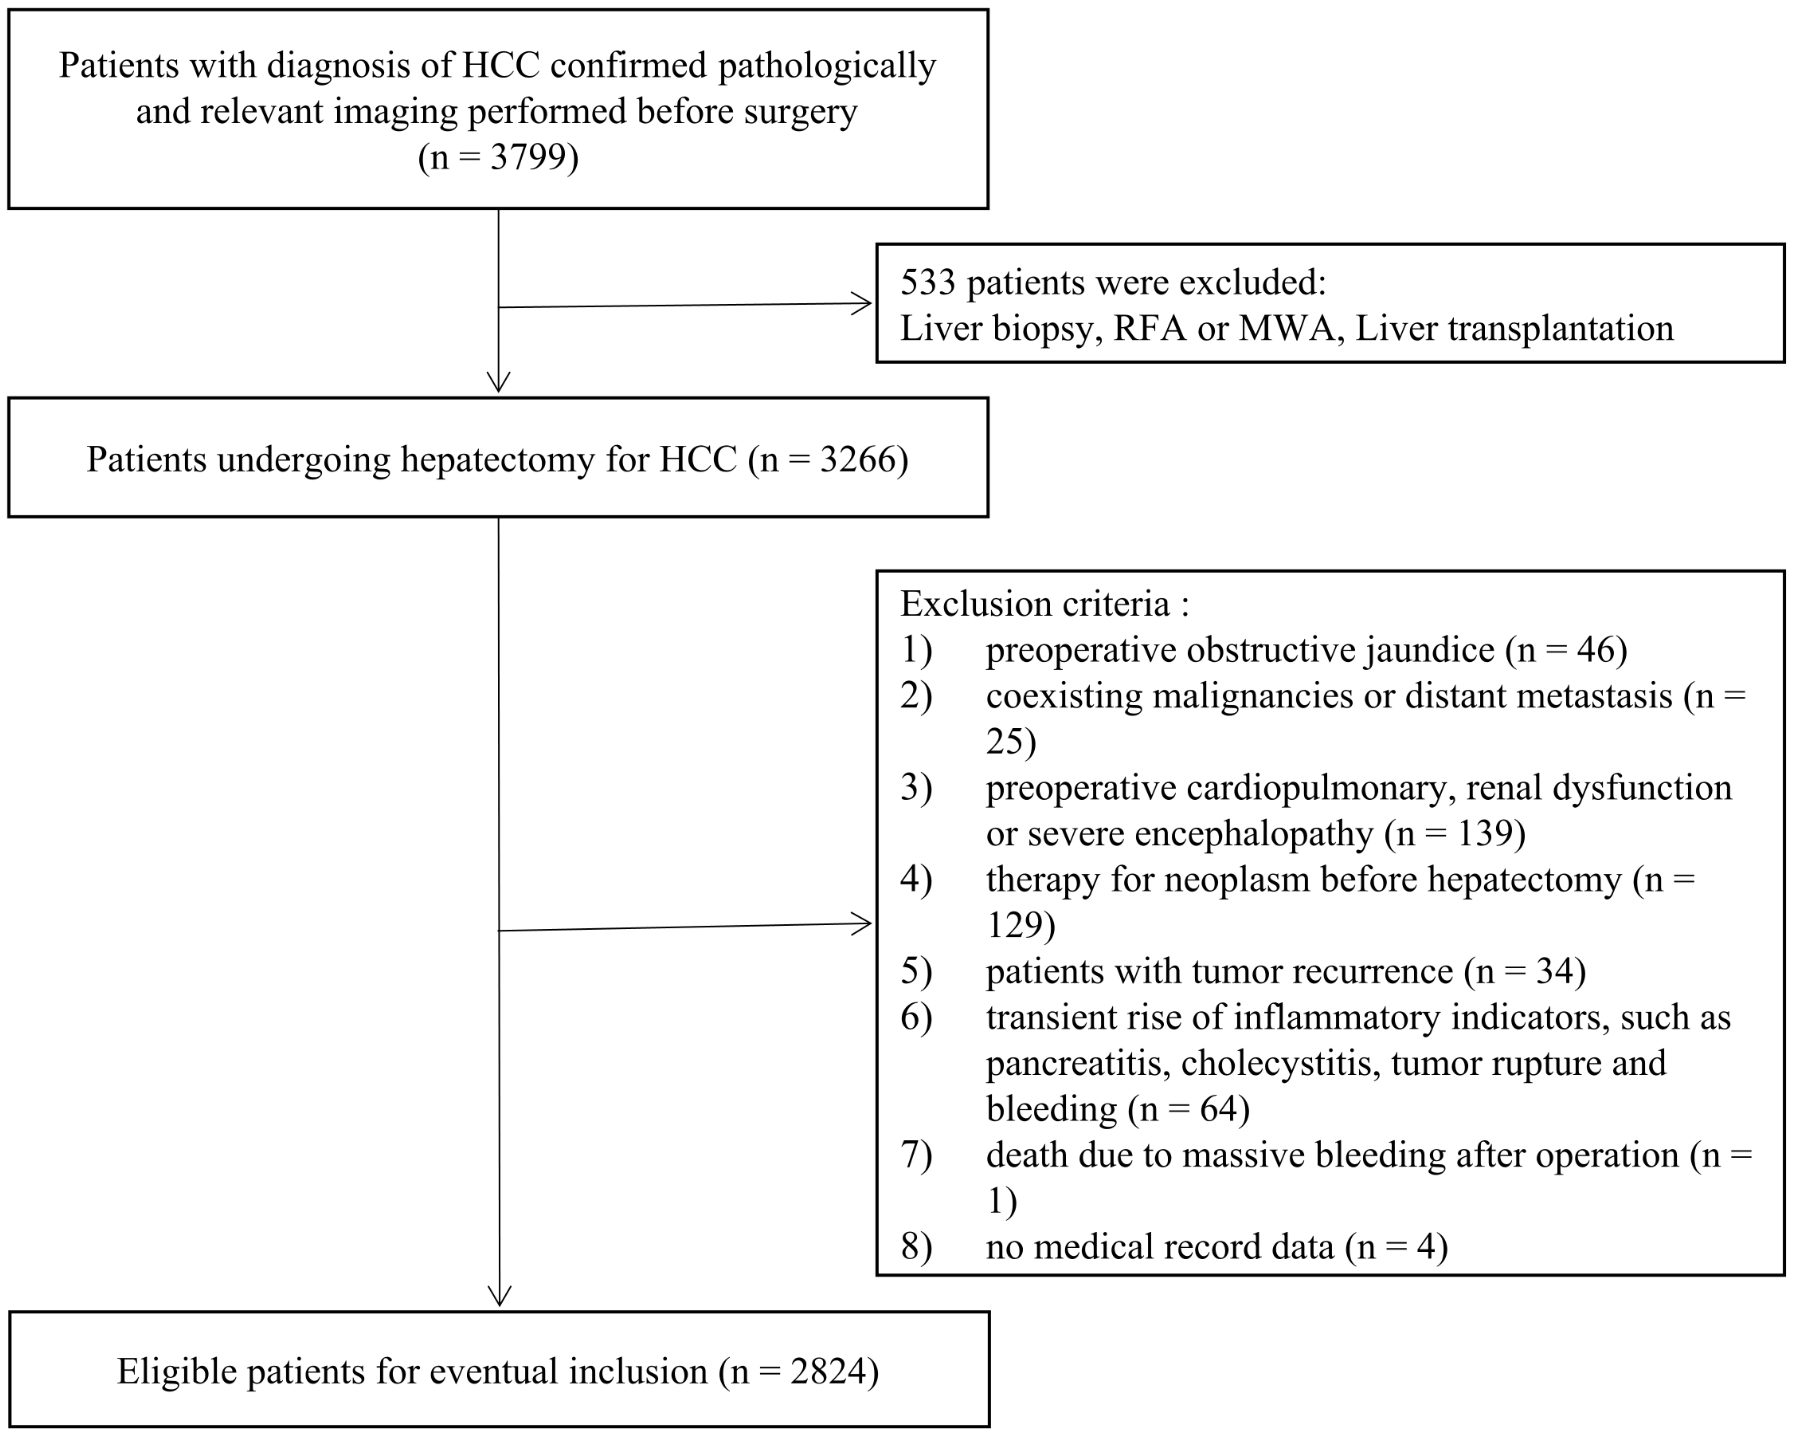
2.1. Subjects
2.2. Indocyanine Green Test
2.3. Clinical Characteristics and Variables
2.4. Definitions of PHLF
2.5. Reference Model
2.6. Statistical Analysis
3. Results
3.1. Descriptive Data
3.2. Assessment of the Incremental Value of Inflammation-Related Variables over the Original Model
4. Discussion
5. Limitations
6. Conclusions
Supplementary Materials
Author Contributions
Funding
Institutional Review Board Statement
Informed Consent Statement
Data Availability Statement
Acknowledgments
Conflicts of Interest
References
- Njei, B.; Rotman, Y.; Ditah, I.; Lim, J.K. Emerging trends in hepatocellular carcinoma incidence and mortality. Hepatology 2015, 61, 191–199. [Google Scholar] [CrossRef]
- Bray, F.; Ferlay, J.; Soerjomataram, I.; Siegel, R.L.; Torre, L.A.; Jemal, A. Global cancer statistics 2018: GLOBOCAN estimates of incidence and mortality worldwide for 36 cancers in 185 countries. CA Cancer J. Clin. 2018, 68, 394–424. [Google Scholar] [CrossRef]
- Villanueva, A. Hepatocellular Carcinoma. N. Engl. J. Med. 2019, 380, 1450–1462. [Google Scholar] [CrossRef]
- European Association for Study of Liver; European Organisation for Research and Treatment of Cancer. EASL-EORTC clinical practice guidelines: Management of hepatocellular carcinoma. Eur. J. Cancer 2012, 48, 599–641. [Google Scholar] [CrossRef] [PubMed]
- Lau, W.Y.; Lau, S.H. The current role of radiofrequency ablation in the treatment of hepatocellular carcinoma. Hepatobiliary Pancreat. Dis. Int. 2017, 16, 122–126. [Google Scholar] [CrossRef]
- Ho, M.C.; Hasegawa, K.; Chen, X.P.; Nagano, H.; Lee, Y.J.; Chau, G.Y.; Zhou, J.; Wang, C.C.; Choi, Y.R.; Poon, R.T.P.; et al. Surgery for Intermediate and Advanced Hepatocellular Carcinoma: A Consensus Report from the 5th Asia-Pacific Primary Liver Cancer Expert Meeting (APPLE 2014). Liver Cancer 2016, 5, 245–256. [Google Scholar] [CrossRef]
- Kokudo, T.; Hasegawa, K.; Matsuyama, Y.; Takayama, T.; Izumi, N.; Kadoya, M.; Kudo, M.; Ku, Y.; Sakamoto, M.; Nakashima, O.; et al. Survival benefit of liver resection for hepatocellular carcinoma associated with portal vein invasion. J. Hepatol. 2016, 65, 938–943. [Google Scholar] [CrossRef]
- Farges, O.; Malassagne, B.; Flejou, J.F.; Balzan, S.; Sauvanet, A.; Belghiti, J. Risk of major liver resection in patients with underlying chronic liver disease: A reappraisal. Ann. Surg. 1999, 229, 210–215. [Google Scholar] [CrossRef]
- Mir, Z.M.; Golding, H.; McKeown, S.; Nanji, S.; Flemming, J.A.; Groome, P.A. Appraisal of multivariable prognostic models for post-operative liver decompensation following partial hepatectomy: A systematic review. HPB 2021, 23, 1773–1788. [Google Scholar] [CrossRef] [PubMed]
- Durand, F.; Valla, D. Assessment of the prognosis of cirrhosis: Child-Pugh versus MELD. J. Hepatol. 2005, 42 (Suppl. S1), S100–S107. [Google Scholar] [CrossRef] [PubMed]
- Hsu, C.Y.; Huang, Y.H.; Hsia, C.Y.; Su, C.W.; Lin, H.C.; Loong, C.C.; Chiou, Y.Y.; Chiang, J.H.; Lee, P.C.; Huo, T.I.; et al. A new prognostic model for hepatocellular carcinoma based on total tumor volume: The Taipei Integrated Scoring System. J. Hepatol. 2010, 53, 108–117. [Google Scholar] [CrossRef] [PubMed]
- Liu, P.H.; Hsu, C.Y.; Hsia, C.Y.; Lee, Y.H.; Su, C.W.; Huang, Y.H.; Lee, F.Y.; Lin, H.C.; Huo, T.I. Prognosis of hepatocellular carcinoma: Assessment of eleven staging systems. J. Hepatol. 2016, 64, 601–608. [Google Scholar] [CrossRef] [PubMed]
- Johnson, P.J.; Berhane, S.; Kagebayashi, C.; Satomura, S.; Teng, M.; Reeves, H.L.; O’Beirne, J.; Fox, R.; Skowronska, A.; Palmer, D.; et al. Assessment of liver function in patients with hepatocellular carcinoma: A new evidence-based approach-the ALBI grade. J. Clin. Oncol. 2015, 33, 550–558. [Google Scholar] [CrossRef]
- Kokudo, T.; Hasegawa, K.; Amikura, K.; Uldry, E.; Shirata, C.; Yamaguchi, T.; Arita, J.; Kaneko, J.; Akamatsu, N.; Sakamoto, Y.; et al. Assessment of Preoperative Liver Function in Patients with Hepatocellular Carcinoma—The Albumin-Indocyanine Green Evaluation (ALICE) Grade. PLoS ONE 2016, 11, e0159530. [Google Scholar] [CrossRef]
- Diakos, C.I.; Charles, K.A.; McMillan, D.C.; Clarke, S.J. Cancer-related inflammation and treatment effectiveness. Lancet Oncol. 2014, 15, e493–e503. [Google Scholar] [CrossRef]
- Hanahan, D.; Weinberg, R.A. Hallmarks of cancer: The next generation. Cell 2011, 144, 646–674. [Google Scholar] [CrossRef] [PubMed]
- Abdel-Khalek, E.E.; El-Fakhry, A.; Helaly, M.; Hamed, M.; Elbaz, O. Systemic inflammatory response syndrome in patients with liver cirrhosis. Arab J. Gastroenterol. 2011, 12, 173–177. [Google Scholar] [CrossRef]
- Peng, W.; Zhang, X.Y.; Li, C.; Wen, T.F.; Yan, L.N.; Yang, J.Y. Spleen stiffness and volume help to predict posthepatectomy liver failure in patients with hepatocellular carcinoma. Medicine 2019, 98, e15458. [Google Scholar] [CrossRef] [PubMed]
- Fang, T.; Long, G.; Wang, D.; Liu, X.; Xiao, L.; Mi, X.; Su, W.; Zhou, L.; Zhou, L. A Nomogram Based on Preoperative Inflammatory Indices and ICG-R15 for Prediction of Liver Failure After Hepatectomy in HCC Patients. Front. Oncol. 2021, 11, 667496. [Google Scholar] [CrossRef]
- Cannon, N.A.; Meyer, J.; Iyengar, P.; Ahn, C.; Westover, K.D.; Choy, H.; Timmerman, R. Neutrophil-lymphocyte and platelet-lymphocyte ratios as prognostic factors after stereotactic radiation therapy for early-stage non-small-cell lung cancer. J. Thorac. Oncol. 2015, 10, 280–285. [Google Scholar] [CrossRef]
- Chan, J.C.; Chan, D.L.; Diakos, C.I.; Engel, A.; Pavlakis, N.; Gill, A.; Clarke, S.J. The Lymphocyte-to-Monocyte Ratio is a Superior Predictor of Overall Survival in Comparison to Established Biomarkers of Resectable Colorectal Cancer. Ann. Surg. 2017, 265, 539–546. [Google Scholar] [CrossRef]
- Fang, L.; Yan, F.H.; Liu, C.; Chen, J.; Wang, D.; Zhang, C.H.; Lou, C.J.; Lian, J.; Yao, Y.; Wang, B.J.; et al. Systemic Inflammatory Biomarkers, Especially Fibrinogen to Albumin Ratio, Predict Prognosis in Patients with Pancreatic Cancer. Cancer Res. Treat. 2021, 53, 131–139. [Google Scholar] [CrossRef]
- Hu, B.; Yang, X.R.; Xu, Y.; Sun, Y.F.; Sun, C.; Guo, W.; Zhang, X.; Wang, W.M.; Qiu, S.J.; Zhou, J.; et al. Systemic immune-inflammation index predicts prognosis of patients after curative resection for hepatocellular carcinoma. Clin. Cancer Res. 2014, 20, 6212–6222. [Google Scholar] [CrossRef] [PubMed]
- Kasymjanova, G.; MacDonald, N.; Agulnik, J.S.; Cohen, V.; Pepe, C.; Kreisman, H.; Sharma, R.; Small, D. The predictive value of pre-treatment inflammatory markers in advanced non-small-cell lung cancer. Curr. Oncol. 2010, 17, 52–58. [Google Scholar]
- Miao, J.; Xiao, W.; Wang, L.; Han, F.; Wu, H.; Deng, X.; Guo, X.; Zhao, C. The value of the Prognostic Nutritional Index (PNI) in predicting outcomes and guiding the treatment strategy of nasopharyngeal carcinoma (NPC) patients receiving intensity-modulated radiotherapy (IMRT) with or without chemotherapy. J. Cancer Res. Clin. Oncol. 2017, 143, 1263–1273. [Google Scholar] [CrossRef] [PubMed]
- Templeton, A.J.; McNamara, M.G.; Šeruga, B.; Vera-Badillo, F.E.; Aneja, P.; Ocaña, A.; Leibowitz-Amit, R.; Sonpavde, G.; Knox, J.J.; Tran, B.; et al. Prognostic role of neutrophil-to-lymphocyte ratio in solid tumors: A systematic review and meta-analysis. J. Natl. Cancer Inst. 2014, 106, dju124. [Google Scholar] [CrossRef]
- Wang, C.; He, W.; Yuan, Y.; Zhang, Y.; Li, K.; Zou, R.; Liao, Y.; Liu, W.; Yang, Z.; Zuo, D.; et al. Comparison of the prognostic value of inflammation-based scores in early recurrent hepatocellular carcinoma after hepatectomy. Liver Int. 2020, 40, 229–239. [Google Scholar] [CrossRef]
- Rahbari, N.N.; Garden, O.J.; Padbury, R.; Brooke-Smith, M.; Crawford, M.; Adam, R.; Koch, M.; Makuuchi, M.; Dematteo, R.P.; Christophi, C.; et al. Posthepatectomy liver failure: A definition and grading by the International Study Group of Liver Surgery (ISGLS). Surgery 2011, 149, 713–724. [Google Scholar] [CrossRef]
- Simpson, A.L.; Adams, L.B.; Allen, P.J.; D’Angelica, M.I.; DeMatteo, R.P.; Fong, Y.; Kingham, T.P.; Leung, U.; Miga, M.I.; Parada, E.P.; et al. Texture analysis of preoperative CT images for prediction of postoperative hepatic insufficiency: A preliminary study. J. Am. Coll. Surg. 2015, 220, 339–346. [Google Scholar] [CrossRef]
- Kerr, K.F.; McClelland, R.L.; Brown, E.R.; Lumley, T. Evaluating the incremental value of new biomarkers with integrated discrimination improvement. Am. J. Epidemiol. 2011, 174, 364–374. [Google Scholar] [CrossRef] [PubMed]
- Leening, M.J.; Vedder, M.M.; Witteman, J.C.; Pencina, M.J.; Steyerberg, E.W. Net reclassification improvement: Computation, interpretation, and controversies: A literature review and clinician’s guide. Ann. Intern. Med. 2014, 160, 122–131. [Google Scholar] [CrossRef]
- Pencina, M.J.; D’Agostino, R.B., Sr.; D’Agostino, R.B., Jr.; Vasan, R.S. Evaluating the added predictive ability of a new marker: From area under the ROC curve to reclassification and beyond. Stat. Med. 2008, 27, 157–172, discussion in Stat. Med. 2008, 27, 207–212. [Google Scholar] [CrossRef] [PubMed]
- Pencina, M.J.; D’Agostino, R.B., Sr.; Demler, O.V. Novel metrics for evaluating improvement in discrimination: Net reclassification and integrated discrimination improvement for normal variables and nested models. Stat. Med. 2012, 31, 101–113. [Google Scholar] [CrossRef]
- Austin, P.C.; Steyerberg, E.W. Predictive accuracy of risk factors and markers: A simulation study of the effect of novel markers on different performance measures for logistic regression models. Stat. Med. 2013, 32, 661–672. [Google Scholar] [CrossRef]
- Cook, N.R. Use and misuse of the receiver operating characteristic curve in risk prediction. Circulation 2007, 115, 928–935. [Google Scholar] [CrossRef]
- Pepe, M.S.; Janes, H.; Longton, G.; Leisenring, W.; Newcomb, P. Limitations of the odds ratio in gauging the performance of a diagnostic, prognostic, or screening marker. Am. J. Epidemiol. 2004, 159, 882–890. [Google Scholar] [CrossRef] [PubMed]
- Pencina, M.J.; D’Agostino, R.B., Sr.; Steyerberg, E.W. Extensions of net reclassification improvement calculations to measure usefulness of new biomarkers. Stat. Med. 2011, 30, 11–21. [Google Scholar] [CrossRef] [PubMed]
- Meisner, M. Pathobiochemistry and clinical use of procalcitonin. Clin. Chim. Acta 2002, 323, 17–29. [Google Scholar] [CrossRef]
- Shi, J.Y.; Sun, L.Y.; Quan, B.; Xing, H.; Li, C.; Liang, L.; Pawlik, T.M.; Zhou, Y.H.; Wang, H.; Gu, W.M.; et al. A novel online calculator based on noninvasive markers (ALBI and APRI) for predicting post-hepatectomy liver failure in patients with hepatocellular carcinoma. Clin. Res. Hepatol. Gastroenterol. 2021, 45, 101534. [Google Scholar] [CrossRef]
- Xu, M.H.; Xu, B.; Zhou, C.H.; Xue, Z.; Chen, Z.S.; Xu, W.X.; Huang, C.; Zhu, X.D.; Zhou, J.; Fan, J.; et al. An mALBI-Child-Pugh-based nomogram for predicting post-hepatectomy liver failure grade B-C in patients with huge hepatocellular carcinoma: A multi-institutional study. World J. Surg. Oncol. 2022, 20, 206. [Google Scholar] [CrossRef]

| Abbreviation | Definition of Each Scoring System | Score |
|---|---|---|
| GPS: Glasgow prognostic score | ||
| CRP (<10 mg/L) and albumin (≥35 g/L) | 0 | |
| CRP (≥10 mg/L) or albumin (<35 g/L) | 1 | |
| CRP (≥10 mg/L) and albumin (<35 g/L) | 2 | |
| mGPS: modified Glasgow prognostic score | ||
| CRP (≤10 mg/L) and albumin (≥35 g/L) | 0 | |
| CRP (≤10 mg/L) and albumin (<35 g/L) | 0 | |
| CRP (>10 mg/L) and albumin (≥35 g/L) | 1 | |
| CRP (>10 mg/L) and albumin (<35 g/L) | 2 | |
| PI: prognostic index | ||
| CRP (≤10 mg/L) and white blood cell count (≤11 × 109/L) | 0 | |
| CRP (≤10 mg/L) and white blood cell count (>11 × 109/L) | 1 | |
| CRP (>10 mg/L) and white blood cell count (≤11 × 109/L) | 1 | |
| CRP (>10 mg/L) and white blood cell count (>11 × 109/L) | 2 | |
| PNI: prognostic nutritional index | ||
| Albumin (g/L) + 5 × total lymphocyte count (109/L) ≥ 45 | 0 | |
| Albumin (g/L) + 5 × total lymphocyte count (109/L) < 45 | 1 | |
| SII: systemic immune-inflammation index | ||
| Platelet count (×109/L) × neutrophil count (×109/L)/ lymphocyte count (×109/L) < 305 | 0 | |
| Platelet count (×109/L) × neutrophil count (×109/L)/ lymphocyte count (×109/L) ≥ 305 | 1 | |
| LCR: lymphocyte-C-reactive protein ratio | ||
| 104 × lymphocyte count (109/L): CRP (mg/L) > 6000 | 0 | |
| 104 × lymphocyte count (109/L): CRP (mg/L) ≤ 6000 | 1 | |
| NLR: neutrophil-to-lymphocyte ratio | ||
| Neutrophil count(109/L): lymphocyte count(109/L) < 5:1 | 0 | |
| Neutrophil count(109/L): lymphocyte count(109/L) ≥ 5:1 | 1 | |
| LMR: lymphocyte-to-monocyte ratio | ||
| Lymphocyte count (109/L): monocyte count (109/L) < 3 | 0 | |
| Lymphocyte count (109/L): monocyte count (109/L) ≥ 3 | 1 | |
| PLR: platelet-to-lymphocyte ratio | ||
| Platelet count(109/L): lymphocyte count(109/L) < 150:1 | 0 | |
| Platelet count(109/L): lymphocyte count(109/L) ≥ 150:1 | 1 | |
| Platelet count(109/L): lymphocyte count(109/L) > 300:1 | 2 | |
| Variable | All Patients (n = 2824) | Clinical Classifcation on Outcome | ||
|---|---|---|---|---|
| Patients without PHLF (n = 2556) | Patients with PHLF (n = 268) | p Value | ||
| Demographic characteristics | ||||
| Age (years) | 56 (49–64) | 56 (49–63) | 58 (50–64) | 0.017 |
| Sex | ||||
| Male | 2405 (85.1%) | 2163 (84.6%) | 242 (90.2%) | |
| Female | 419 (14.8%) | 393 (15.3%) | 26 (9.7%) | |
| HBsAg | 0.018 | |||
| Positive | 1966 (69.6%) | 1770 (69.2%) | 196 (73.1%) | |
| Negative | 858 (30.4%) | 786 (30.8%) | 72 (26.9%) | |
| HCV | 0.268 | |||
| Positive | 107 (3.8%) | 101 (3.9%) | 6 (2.2%) | |
| Negative | 2717 (96.2%) | 2455 (96.1%) | 262 (97.8%) | |
| Diabetes mellitus | 0.646 | |||
| Yes | 616 (21.8%) | 561 (21.9%) | 55 (20.5%) | |
| No | 2208 (78.1%) | 1995 (78.0%) | 213 (79.4%) | |
| Hypertension | 0.003 | |||
| Yes | 758 (26.8%) | 707 (27.6%) | 51 (19.0%) | |
| No | 2066 (73.1%) | 1849 (72.3%) | 217 (80.9%) | |
| Final variables of the original model | ||||
| Cirrhosis | <0.001 | |||
| Yes | 1123 (39.7%) | 974 (38.1%) | 149 (55.5%) | |
| No | 1701 (60.2%) | 1582 (61.8%) | 119 (44.4%) | |
| Tumor size (cm) | 4.8 (3.1–7.4) | 4.6 (3.0–7.3) | 6.2 (3.95–9.55) | 0.001 |
| Blood loss (ml) | <0.001 | |||
| <400 | 1916 (68.1%) | 1786 (70.1%) | 130 (48.7%) | |
| ≥400 | 899 (31.9%) | 762 (29.9%) | 137 (51.3%) | |
| ICG-R15 (%) | 4.5 (2.9–6.9) | 4.4 (2.9–6.7) | 6.1 (3.8–8.6) | <0.001 |
| PT (s) | 13.6 (13.1–14.2) | 13.6 (13.0–14.2) | 14.1 (13.4–14.8) | <0.001 |
| APRI | 0.41 (0.28–0.67) | 0.40 (0.27–0.64) | 0.62 (0.39–1.12) | <0.001 |
| Inflammation-related variables | ||||
| White cell (109/L) | 5.47 (4.48–6.59) | 5.51 (4.52–6.62) | 4.98 (3.84–6.27) | 0.001 |
| Neutrophil (109/L) | 3.05 (2.38–3.96) | 3.06 (2.41–3.97) | 2.89 (2.11–3.90) | 0.271 |
| Lymphocyte (109/L) | 1.67 (1.31–2.09) | 1.69 (1.33–2.12) | 1.44 (1.09–1.86) | 0.523 |
| Monocyte (109/L) | 0.39 (0.31–0.50) | 0.39 (0.31–0.49) | 0.38 (0.29–0.50) | 0.029 |
| Platelet (109/L) | 163 (127–207) | 164 (129–208) | 142 (96.5–186.5) | <0.001 |
| AST (U/L) | 26.1 (19.6–37.3) | 25.3 (19.4–36.1) | 33.8 (24.6–48.9) | <0.001 |
| ALB (g/L) | 40.6 (38.3–43.0) | 40.7 (38.4–43.1) | 39.4 (36.8–41.8) | <0.001 |
| FIB (g/L) | 2.81 (2.40–3.41) | 2.82 (2.40–3.40) | 2.72 (2.29–3.42) | 0.315 |
| CRP (mg/L) | 1.9 (0.9–5.2) | 1.7 (0.9–5.1) | 3.17 (1.0–6.4) | 0.144 |
| IL-6 (pg/mL) | 4.68 (2.98–10.94) | 4.55 (2.91–11.10) | 6.2 (3.44–10.20) | 0.184 |
| Procalcitonin (ng/mL) | 0.05 (0.03–0.08) | 0.05 (0.03–0.08) | 0.13 (0.04–0.24) | <0.001 |
| GPS | 0.039 | |||
| 0 | 879 (80.2%) | 793 (81.2%) | 86 (72.3%) | |
| 1 | 209 (19.1%) | 176 (18.0%) | 33 (27.7%) | |
| 2 | 8 (0.7%) | 8 (0.8%) | 0 | |
| mGPS | 0.876 | |||
| 0 | 931 (85.0%) | 831 (85.1%) | 100 (84.1%) | |
| 1 | 130 (11.9%) | 115 (11.8%) | 15 (12.6%) | |
| 2 | 35 (3.2%) | 31 (3.2%) | 4 (3.4%) | |
| PI | 0.558 | |||
| 0 | 921 (84.0%) | 823 (84.2%) | 98 (82.4%) | |
| 1 | 169 (15.4%) | 149 (15.2%) | 20 (16.8%) | |
| 2 | 6 (0.5%) | 5 (0.5%) | 1 (0.8%) | |
| PNI | 0.341 | |||
| 0 | 2289 (81.4%) | 2116 (83.1%) | 173 (64.8%) | |
| 1 | 524 (18.6%) | 430 (16.9%) | 94 (35.2%) | |
| SII | <0.001 | |||
| 0 | 1492 (53.0%) | 1343 (52.7%) | 149 (55.8%) | |
| 1 | 1321 (47.0%) | 1203 (47.3%) | 118 (44.2%) | |
| LCR | 0.002 | |||
| 0 | 655 (59.9%) | 600 (61.5%) | 55 (46.2%) | |
| 1 | 439 (40.1%) | 375 (38.5%) | 64 (53.8%) | |
| NLR | 0.004 | |||
| 0 | 2723 (96.8%) | 2468 (97.0%) | 255 (95.5%) | |
| 1 | 90 (3.2%) | 78 (3.1%) | 12 (4.5%) | |
| LMR | 0.003 | |||
| 0 | 494 (17.6%) | 423 (16.6%) | 71 (26.6%) | |
| 1 | 2319 (82.4%) | 2123 (83.4%) | 196 (73.4%) | |
| PLR | 0.436 | |||
| 0 | 2418 (86.0%) | 2193 (86.1%) | 225 (84.3%) | |
| 1 | 371 (13.2%) | 331 (13.0%) | 40 (15.0%) | |
| 2 | 24 (0.9%) | 22 (0.9%) | 2 (0.7%) | |
| ANRI | 8.60 (5.83–13.75) | 8.32 (5.67–13.05) | 12.07 (7.84–19.71) | 0.454 |
| FAR | 0.07 (0.06–0.09) | 0.07 (0.06–0.09) | 0.07 (0.06–0.09) | 0.399 |
| AFR | 14.42 (11.63–17.08) | 14.44 (11.73–17.04) | 14.33 (11.28–17.31) | 0.399 |
| Variable | AUC (95%CI) | ΔAUC | p Value | Continuous NRI (95%CI) | p Value | IDI (95%CI) | p Value |
|---|---|---|---|---|---|---|---|
| WBC | 0.7492 (0.7189–0.7795) | 0 | 0.9964 | 0.1569 (0.0317–0.2821) | 0.0140 | 0.0041 (0.0007–0.0076) | 0.0182 |
| Neutrophil | 0.7486 (0.7184–0.7788) | −0.0006 | 0.8183 | 0.1626 (0.0383–0.2869) | 0.0130 | 0.0024 (0.0001–0.0050) | 0.0633 |
| Lymphocyte | 0.7523 (0.7221–0.7822) | 0.0031 | 0.3849 | 0.1558 (0.0309–0.2807) | 0.0145 | 0.0034 (0.0006–0.0062) | 0.0186 |
| Monocyte | 0.7496 (0.7195–0.7797) | 0.0004 | 0.3979 | −0.0519 (−0.1762–0.0725) | 0.4137 | 0.0000 (−0.0004–0.0003) | 0.8437 |
| CRP | 0.7509 (0.721–0.7808) | 0.0017 | 0.2961 | 0.0213 (−0.1030–0.1457) | 0.7365 | 0.0005 (−0.0011–0.0021) | 0.5612 |
| IL-6 | 0.7493 (0.7191–0.7795) | 0.0001 | 0.7819 | 0.0175 (−0.1049–0.1399) | 0.7795 | 0.0000 (−0.0003–0.0004) | 0.7797 |
| PCT | 0.7536 (0.7236–0.7837) | 0.0044 | 0.0265 | 0.0996 (−0.0249–0.2241) | 0.1167 | 0.0033 (−0.0010–0.0076) | 0.1319 |
| GPS | 0.7493 (0.7192–0.7795) | 0.0001 | 0.8890 | 0.4607 (0.3549–0.5666) | <0.0001 | 0.0005 (−0.0010–0.0020) | 0.5350 |
| mGPS | 0.7505 (0.7205–0.7804) | 0.0013 | 0.5532 | 0.1654 (0.0540–0.2769) | 0.0036 | 0.0017 (−0.0005–0.0040) | 0.1327 |
| PI | 0.7497 (0.7197–0.7798) | 0.0005 | 0.7979 | 0.0902 (−0.0160–0.1963) | 0.0960 | 0.0017 (−0.0002–0.0037) | 0.0796 |
| PNI | 0.7488 (0.7184–0.7792) | −0.0004 | 0.7172 | 0.1500 (0.0289–0.2711) | 0.0152 | 0.0012 (0.0000–0.0024) | 0.0582 |
| SII | 0.7536 (0.7236–0.7836) | 0.0044 | 0.3593 | 0.3579 (0.2343–0.4816) | <0.0001 | 0.0076 (0.0030–0.0121) | 0.0011 |
| LCR | 0.7491 (0.7189–0.7792) | −0.0001 | 0.7071 | 0.2309 (0.1060–0.3558) | 0.0003 | 0.0001 (−0.0002–0.0004) | 0.4133 |
| NLR | 0.7491 (0.7188–0.7794) | −0.0001 | 0.9030 | 0.3163 (0.2190–0.4137) | <0.0001 | 0.0005 (−0.0007–0.0017) | 0.4470 |
| ANRI | 0.7496 (0.7197–0.7795) | 0.0004 | 0.8767 | 0.2151 (0.0898–0.3405) | 0.0008 | 0.0020 (−0.0006–0.0045) | 0.1407 |
| LMR | 0.7495 (0.7193–0.7796) | 0.0003 | 0.7183 | 0.1544 (0.0416–0.2673) | 0.0073 | 0.0003 (−0.0005–0.0011) | 0.4363 |
| PLR | 0.7497 (0.7196–0.7799) | 0.0005 | 0.7353 | 0.0578 (−0.0592–0.1748) | 0.3330 | 0.0009 (−0.0010–0.0028) | 0.3462 |
| FAR | 0.7525 (0.7226–0.7823) | 0.0033 | 0.2264 | 0.1786 (0.0565–0.3007) | 0.0041 | 0.0013 (−0.0014–0.0041) | 0.3412 |
| AFR | 0.7527 (0.7229–0.7825) | 0.0035 | 0.1972 | 0.1621 (0.0374–0.2868) | 0.0108 | 0.0010 (−0.0015–0.0036) | 0.4292 |
Disclaimer/Publisher’s Note: The statements, opinions and data contained in all publications are solely those of the individual author(s) and contributor(s) and not of MDPI and/or the editor(s). MDPI and/or the editor(s) disclaim responsibility for any injury to people or property resulting from any ideas, methods, instructions or products referred to in the content. |
© 2023 by the authors. Licensee MDPI, Basel, Switzerland. This article is an open access article distributed under the terms and conditions of the Creative Commons Attribution (CC BY) license (https://creativecommons.org/licenses/by/4.0/).
Share and Cite
Wang, X.; Wang, W.; Lin, X.; Chen, X.; Zhu, M.; Xu, H.; He, K. Inflammatory Markers Showed Significant Incremental Value for Predicting Post-Hepatectomy Liver Failure in Hepatocellular Carcinoma Patients. Life 2023, 13, 1990. https://doi.org/10.3390/life13101990
Wang X, Wang W, Lin X, Chen X, Zhu M, Xu H, He K. Inflammatory Markers Showed Significant Incremental Value for Predicting Post-Hepatectomy Liver Failure in Hepatocellular Carcinoma Patients. Life. 2023; 13(10):1990. https://doi.org/10.3390/life13101990
Chicago/Turabian StyleWang, Xiao, Wenjun Wang, Xixiang Lin, Xu Chen, Mingxiang Zhu, Hongli Xu, and Kunlun He. 2023. "Inflammatory Markers Showed Significant Incremental Value for Predicting Post-Hepatectomy Liver Failure in Hepatocellular Carcinoma Patients" Life 13, no. 10: 1990. https://doi.org/10.3390/life13101990
APA StyleWang, X., Wang, W., Lin, X., Chen, X., Zhu, M., Xu, H., & He, K. (2023). Inflammatory Markers Showed Significant Incremental Value for Predicting Post-Hepatectomy Liver Failure in Hepatocellular Carcinoma Patients. Life, 13(10), 1990. https://doi.org/10.3390/life13101990