
A Review of Biosensors for Detecting Tumor Markers in Breast Cancer


Abstract
:
1. Introduction
2. Tumor Markers
2.1. Estrogen Receptor
2.2. Progesterone Receptor
2.3. Human Epidermal Growth Factor Receptor 2
2.4. The Biomarker of Triple Negative Breast Cancer (TNBC)
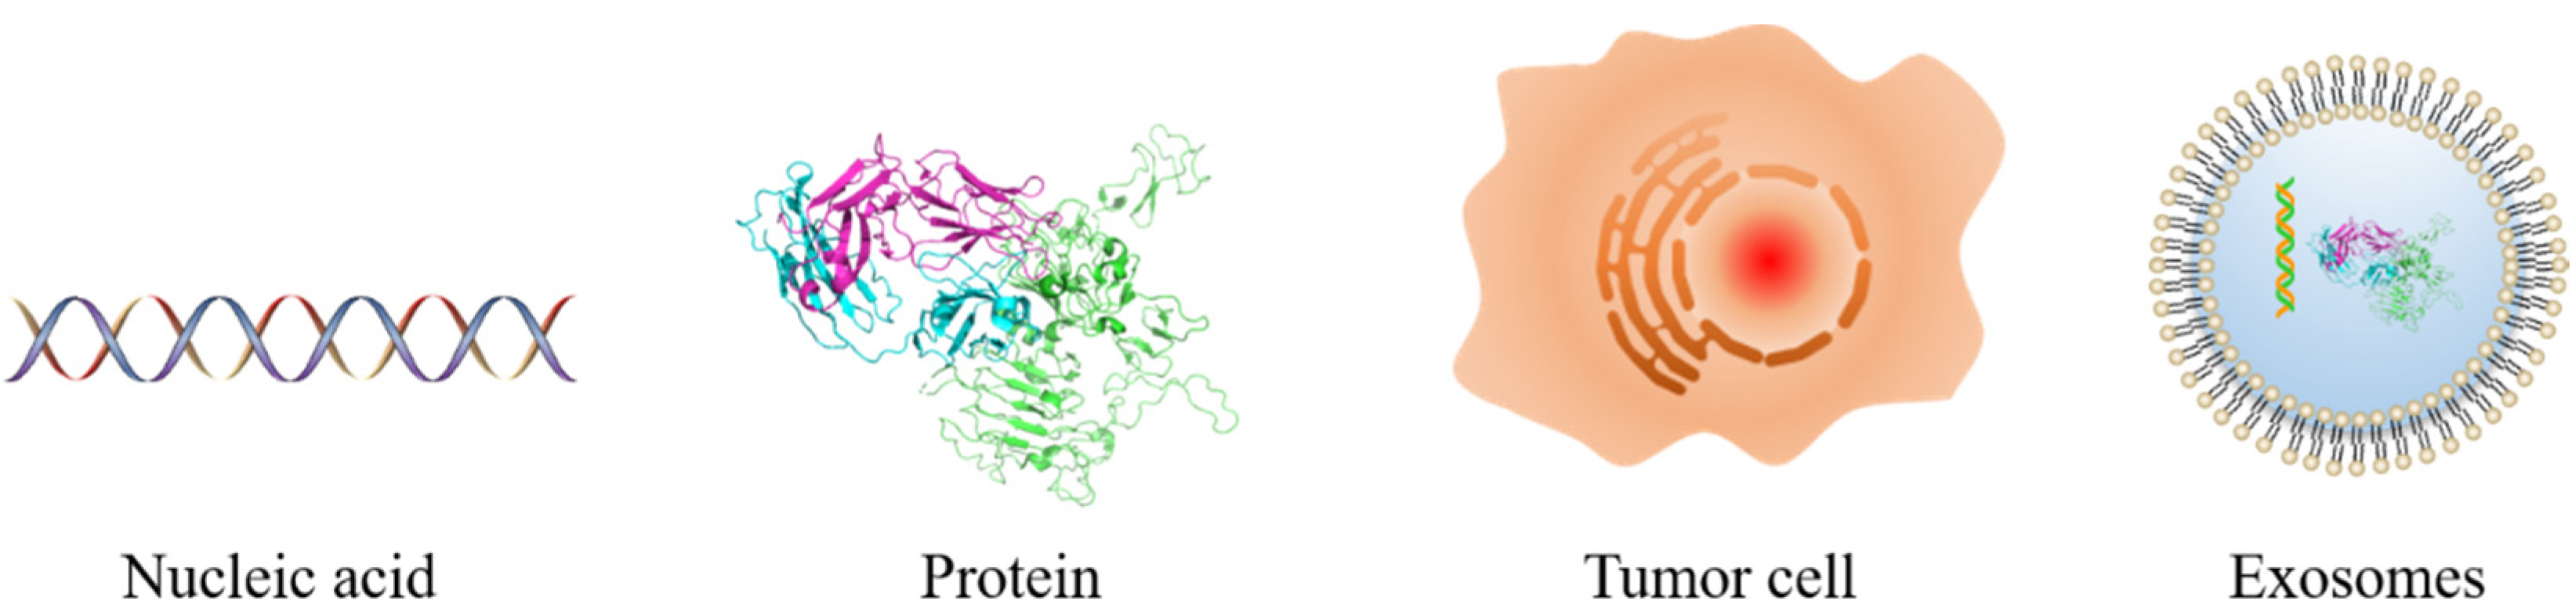
2.5. Emerging Tumor Markers
2.5.1. Nucleic Acids
2.5.2. Proteins
2.5.3. Tumor Cells
2.5.4. Others
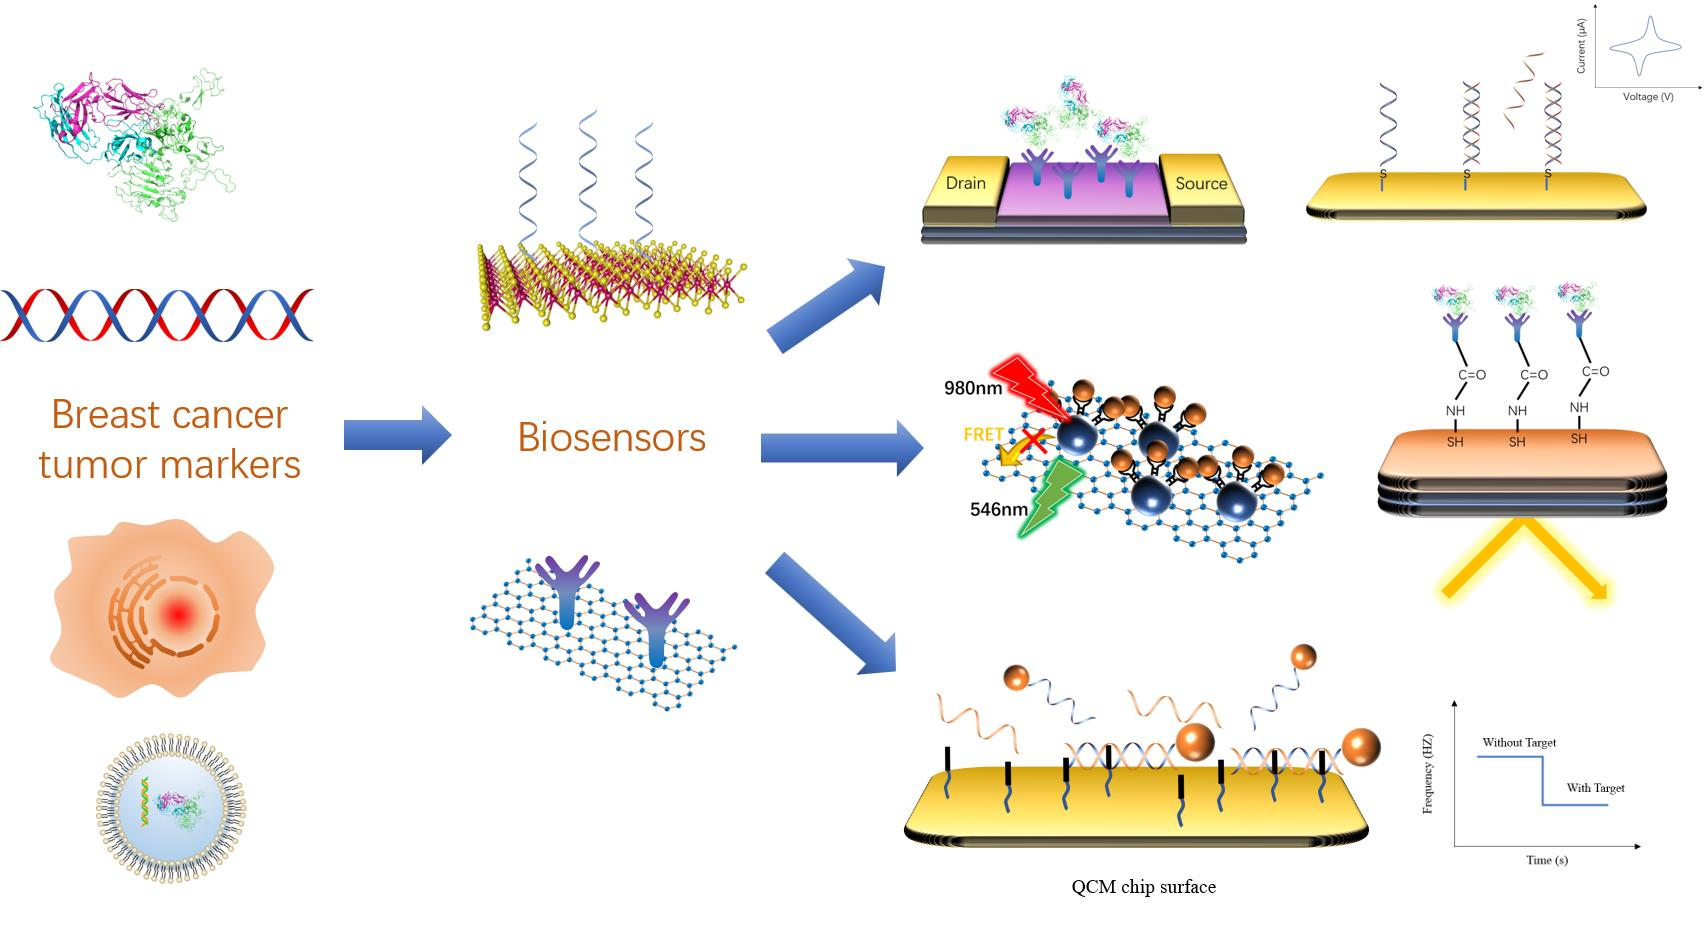
3. Biosensor
3.1. Electrochemical Biosensor
3.1.1. Cyclic Voltammetry
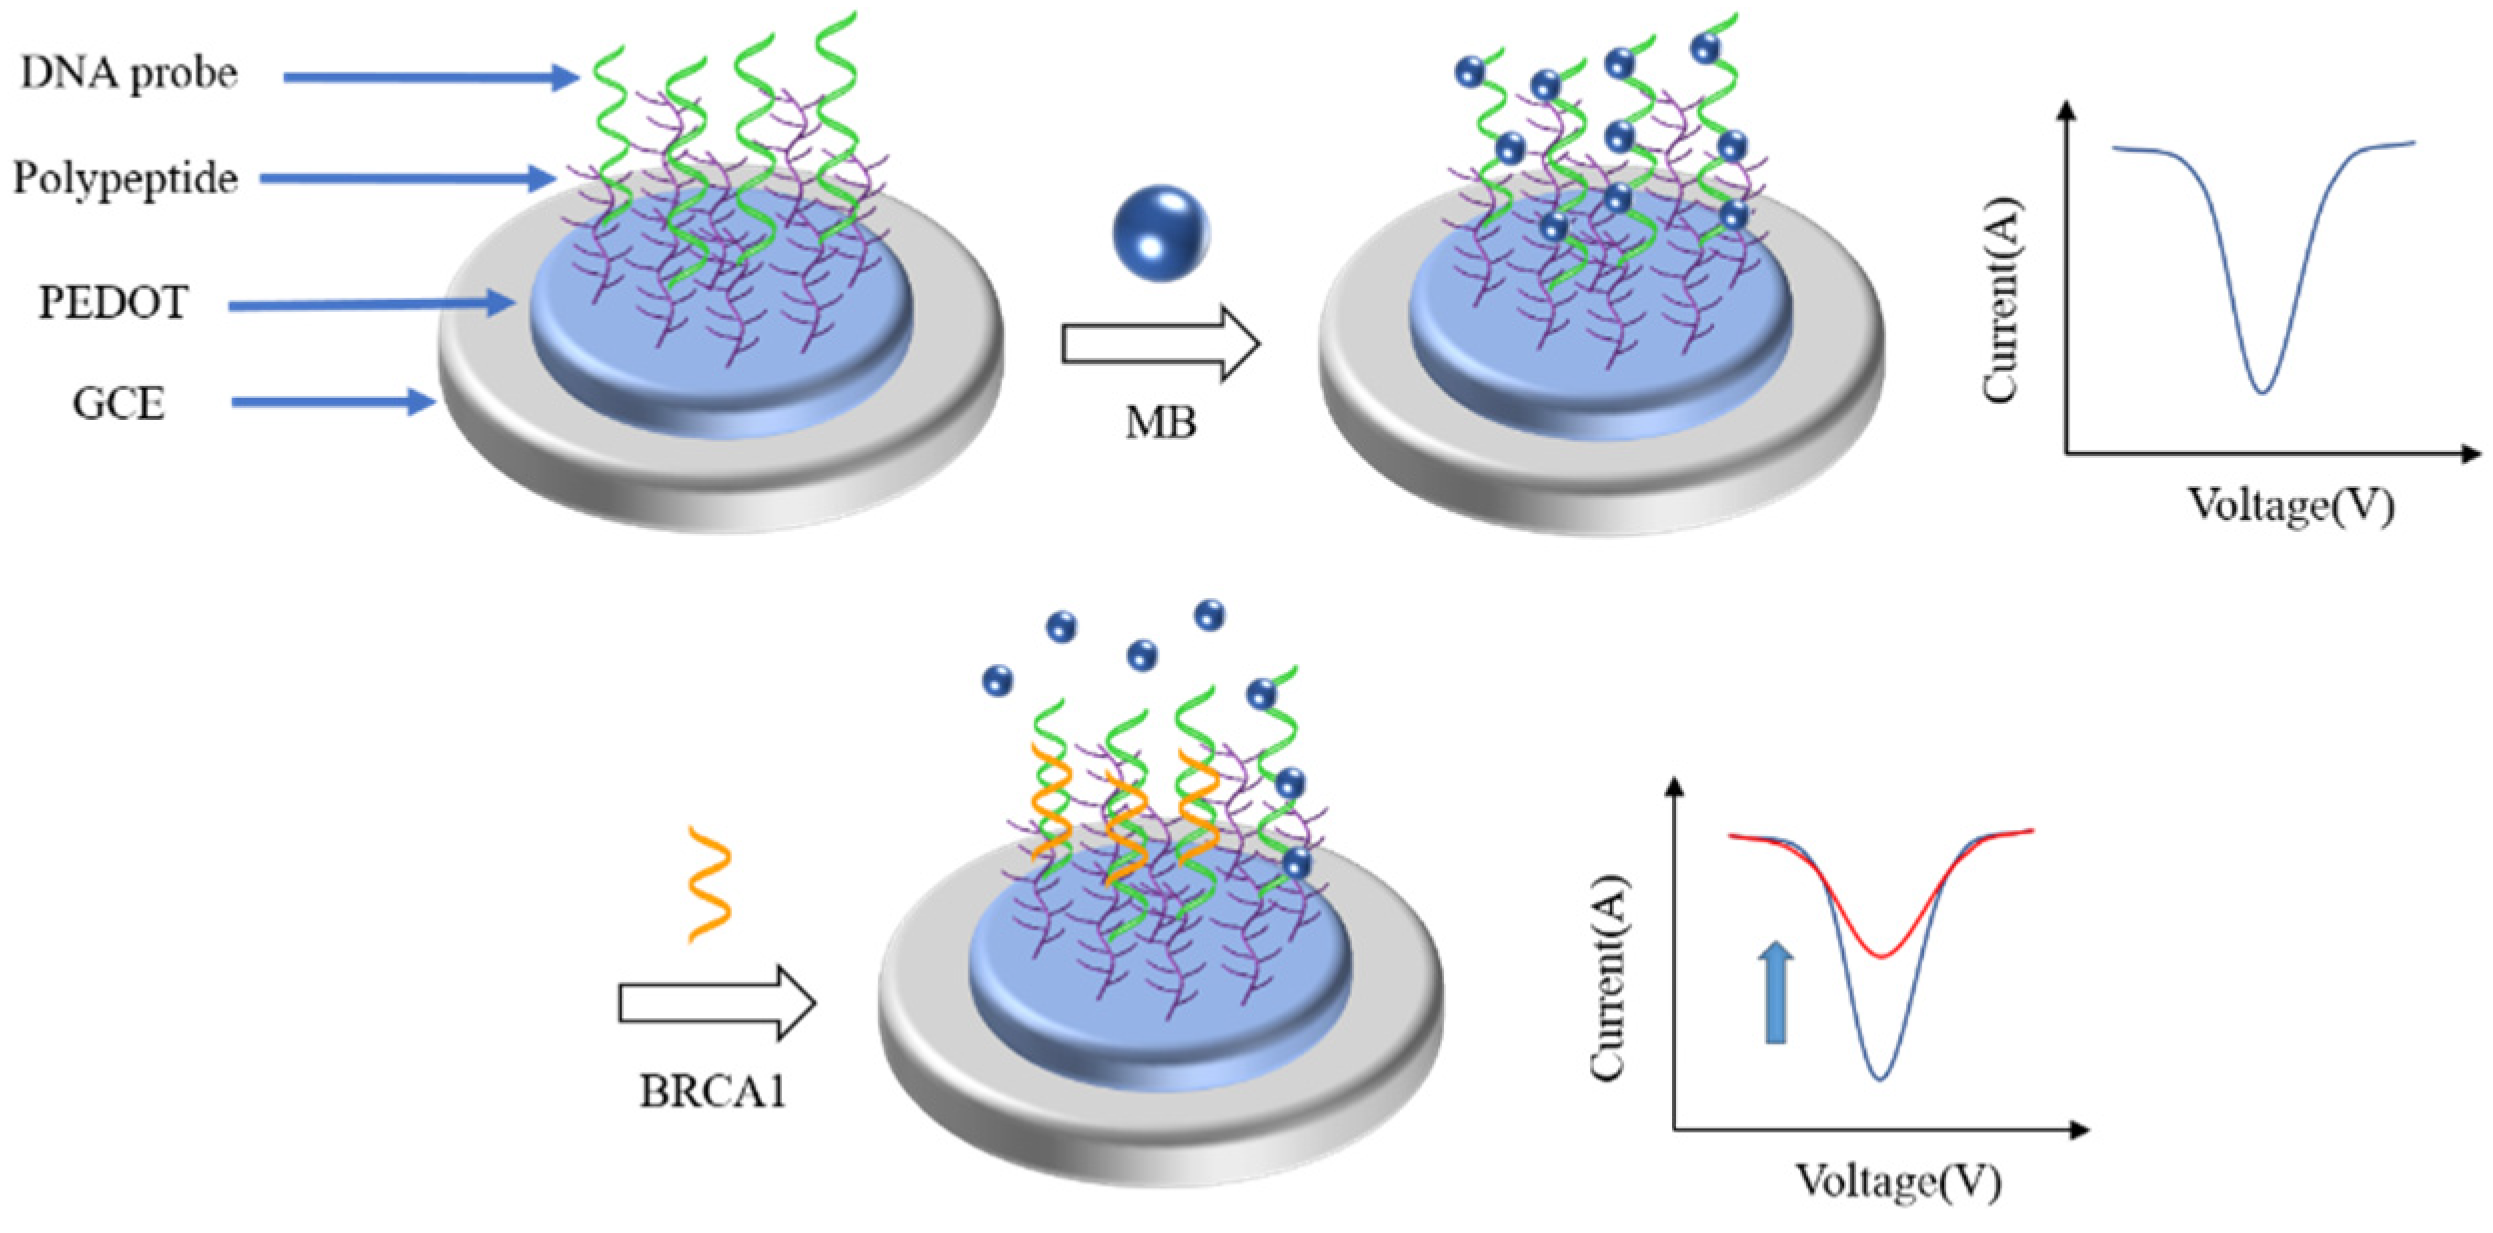
3.1.2. Differential Pulse Voltammetry
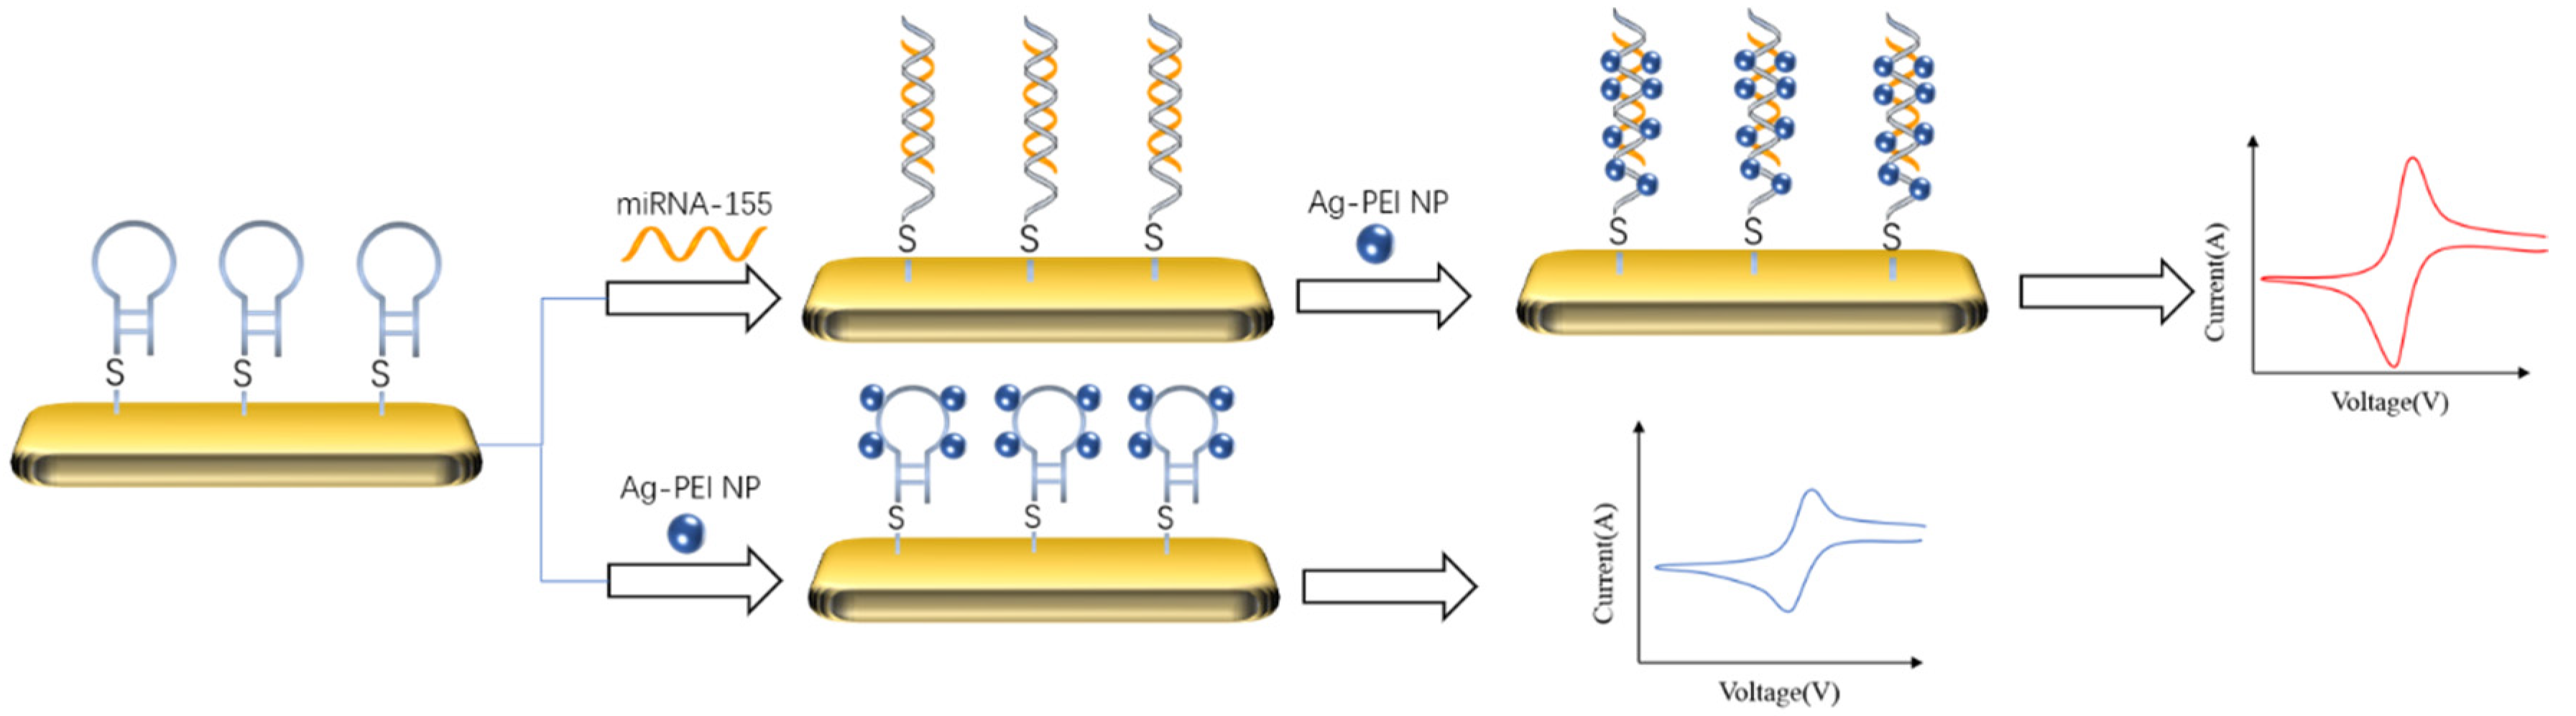
3.1.3. Square Wave Voltammetry
3.1.4. Linear Sweep Voltammetry
3.1.5. Electrochemical Impedance Spectroscopy
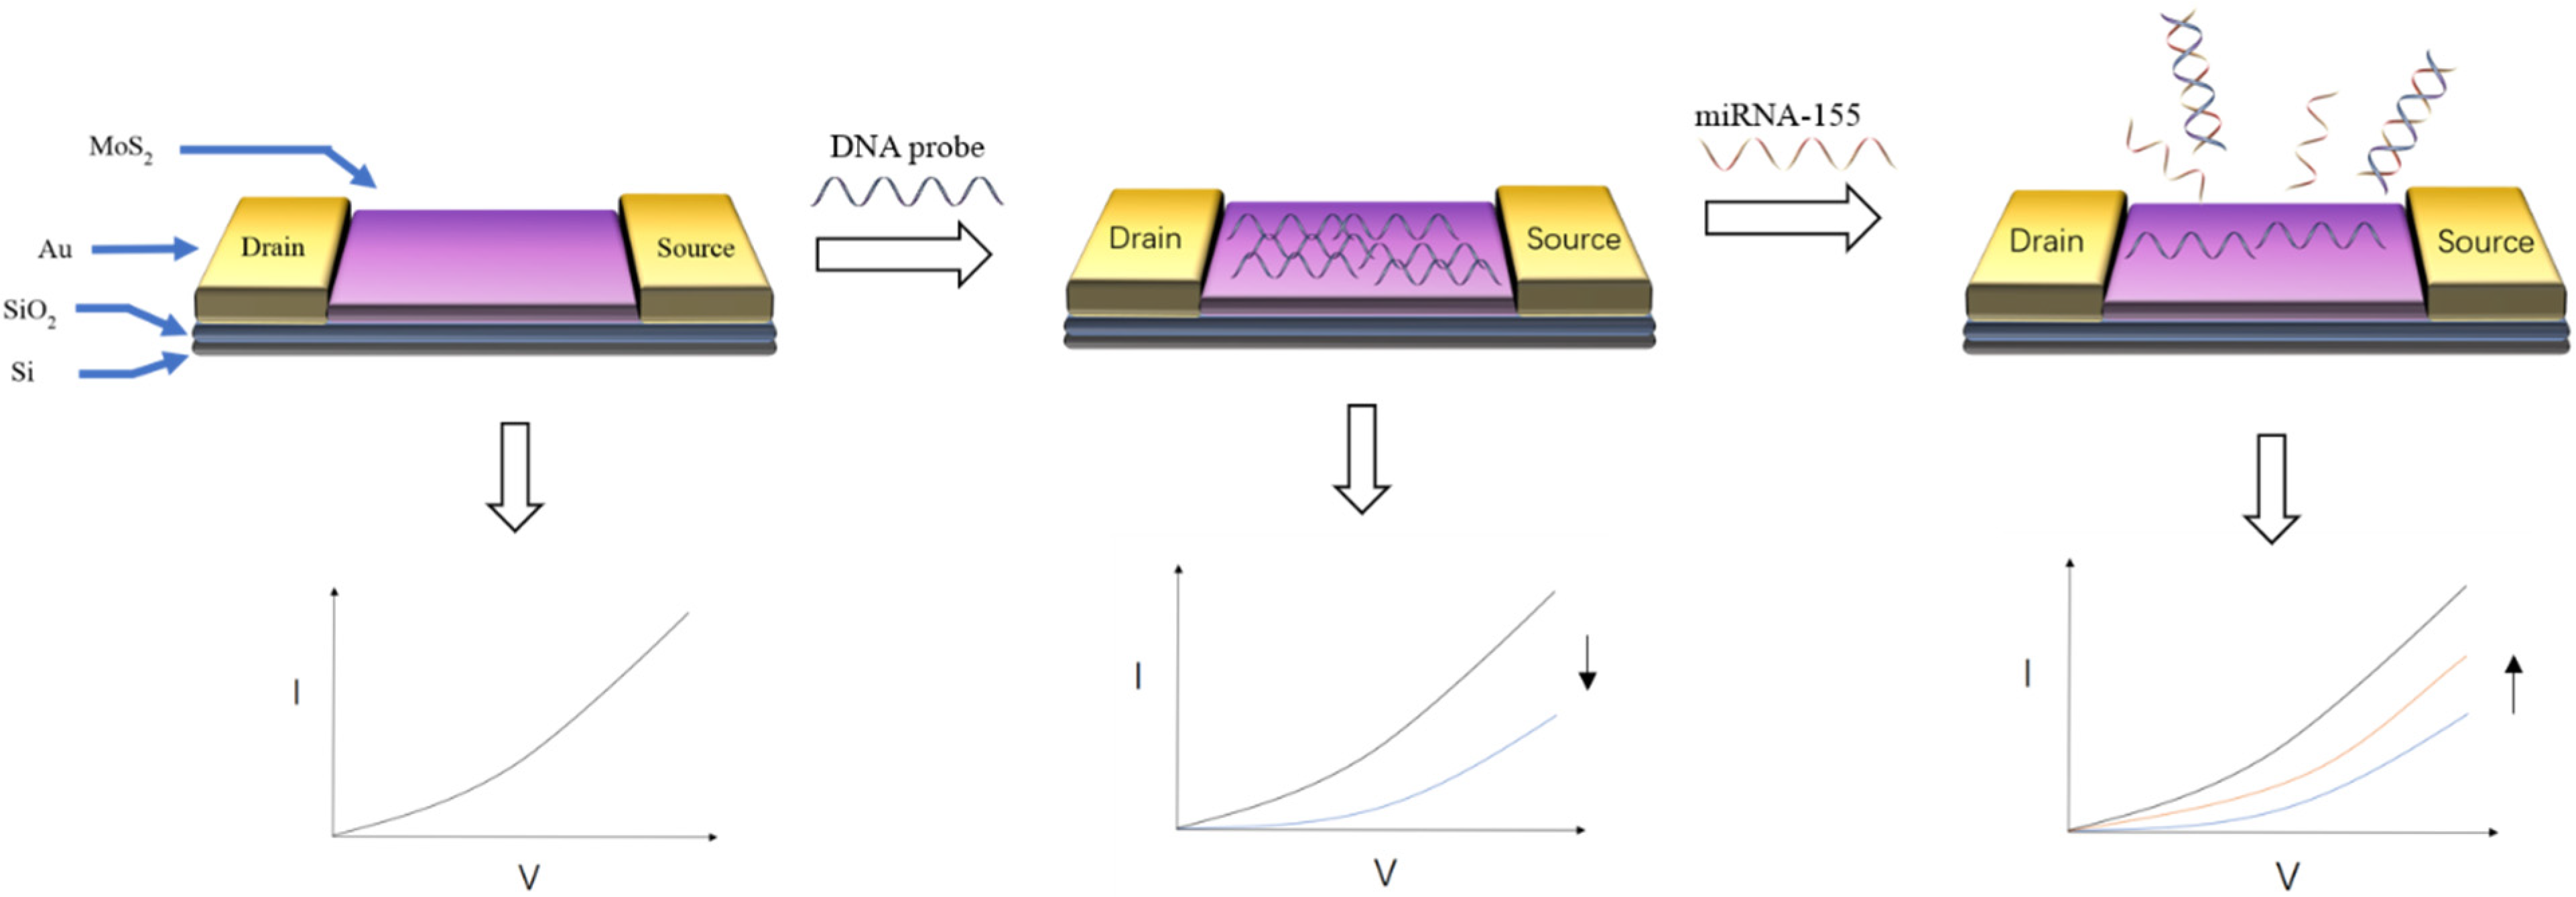
3.1.6. Field-Effect Sensor
3.2. Optical Biosensor
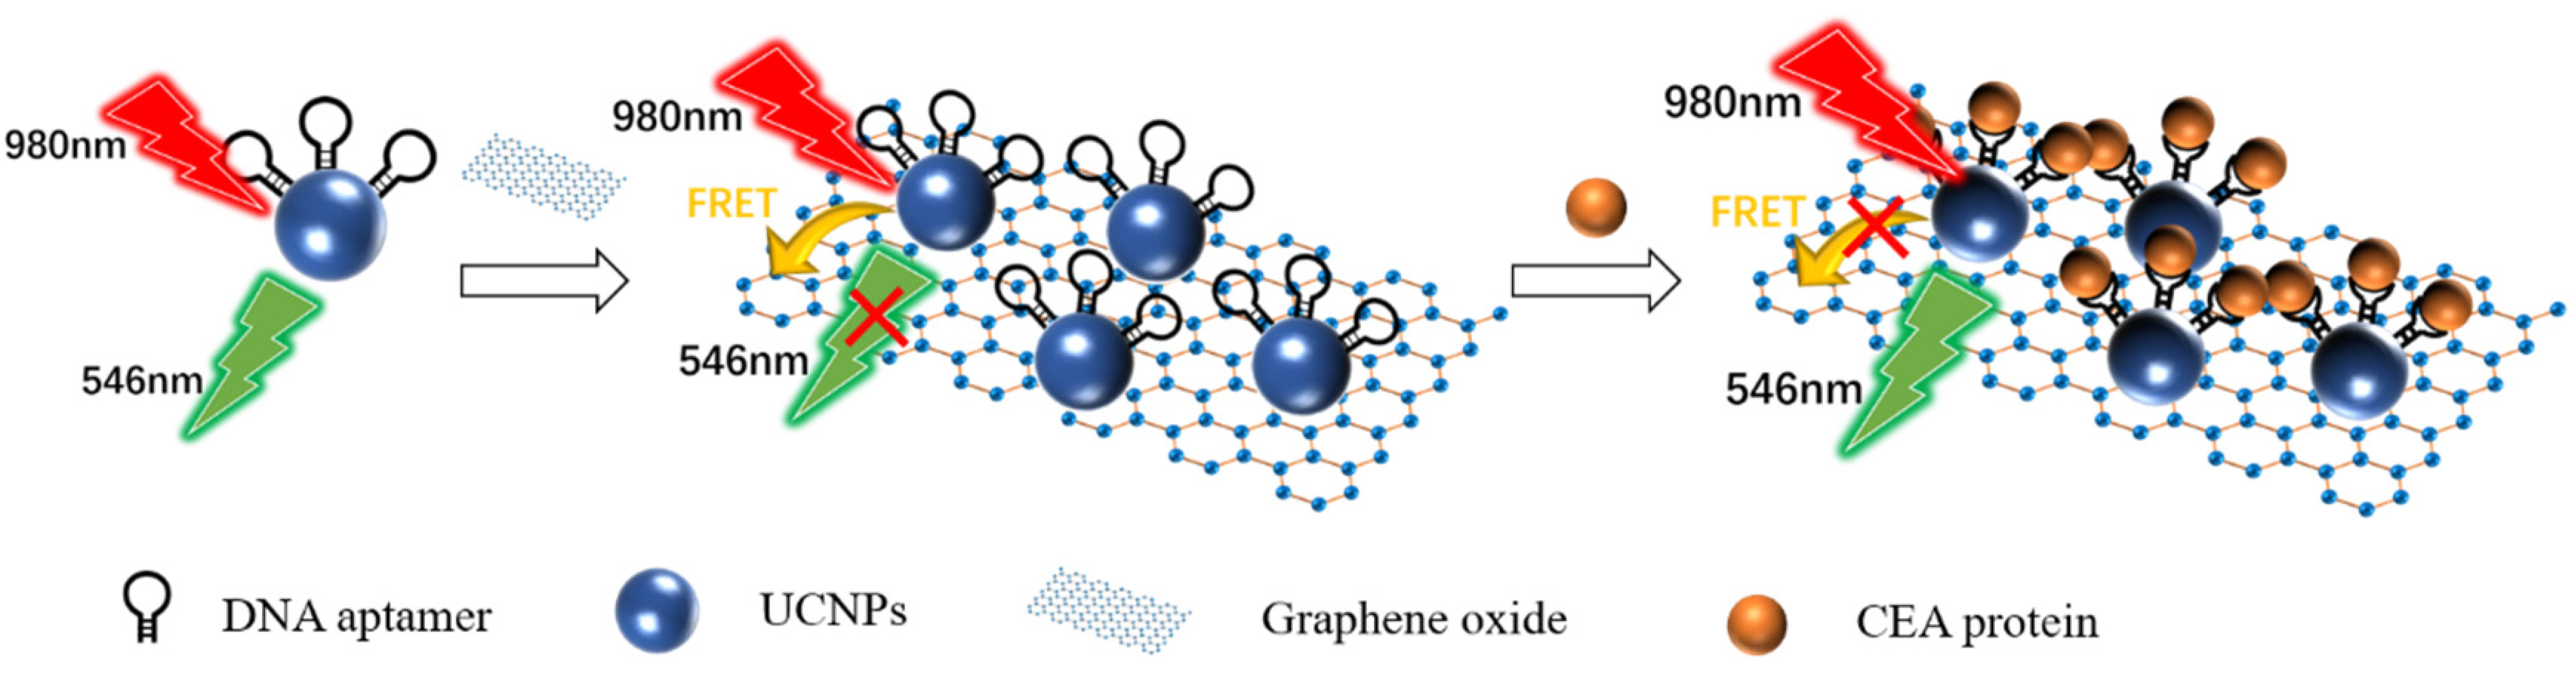
3.2.1. Fluorescence Biosensor
3.2.2. Colorimetric Biosensor
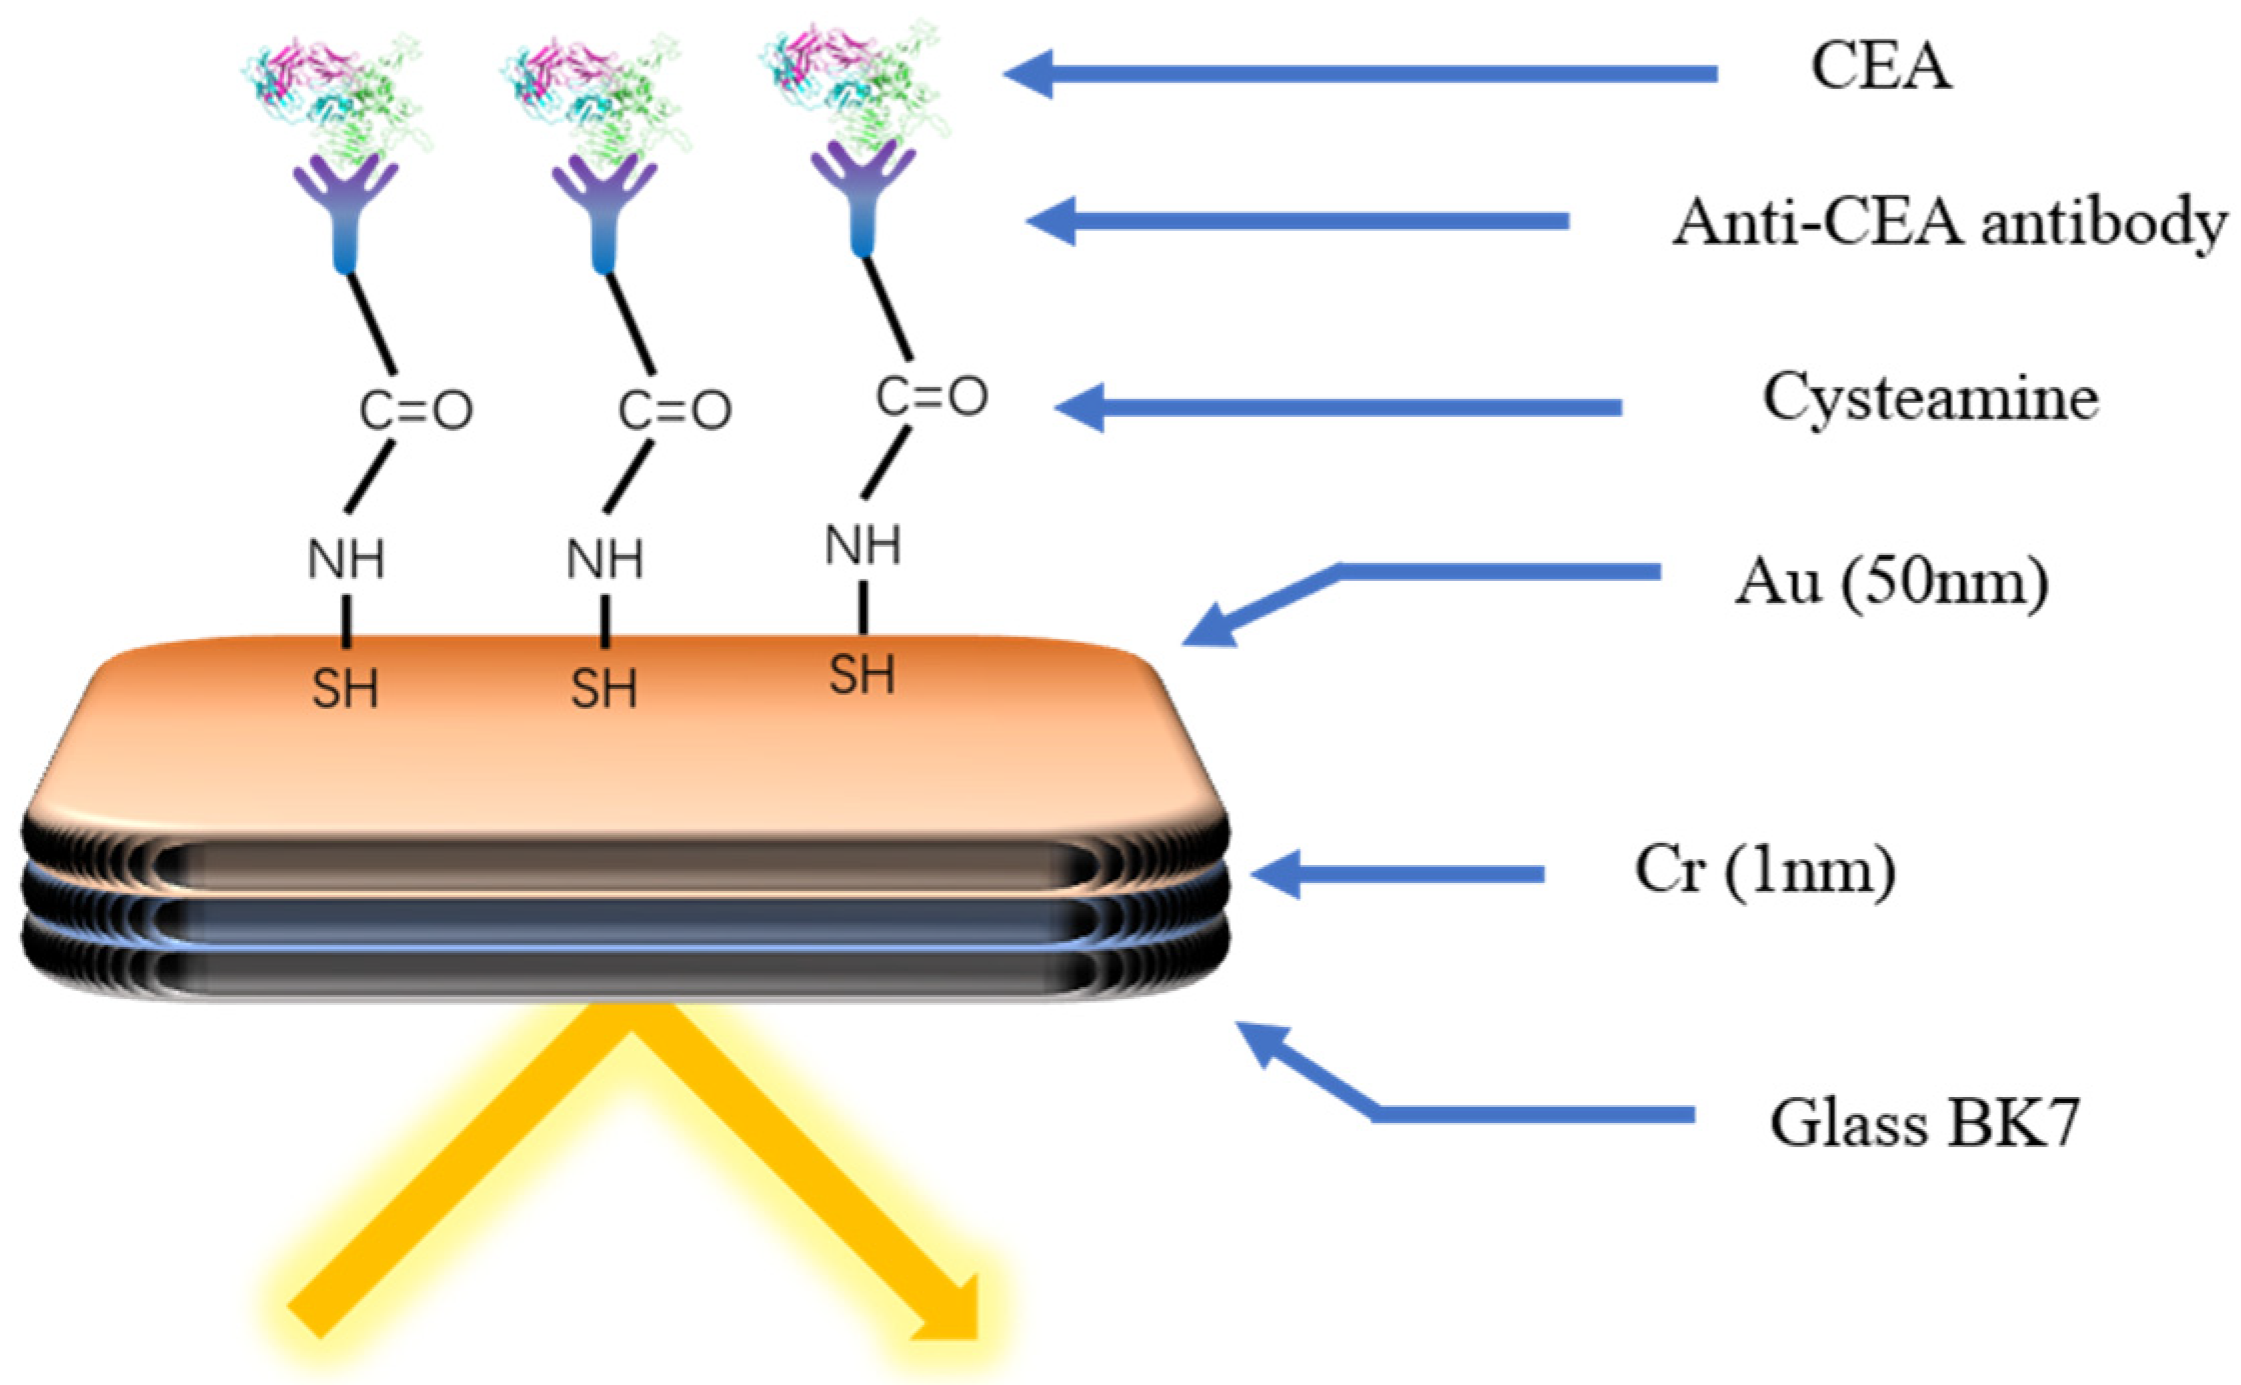
3.2.3. Surface Plasmon Resonance Imaging
3.2.4. Surface-Enhanced Raman Spectroscopy
3.2.5. Electrochemiluminescence Biosensor
3.3. Other Types of Biosensors
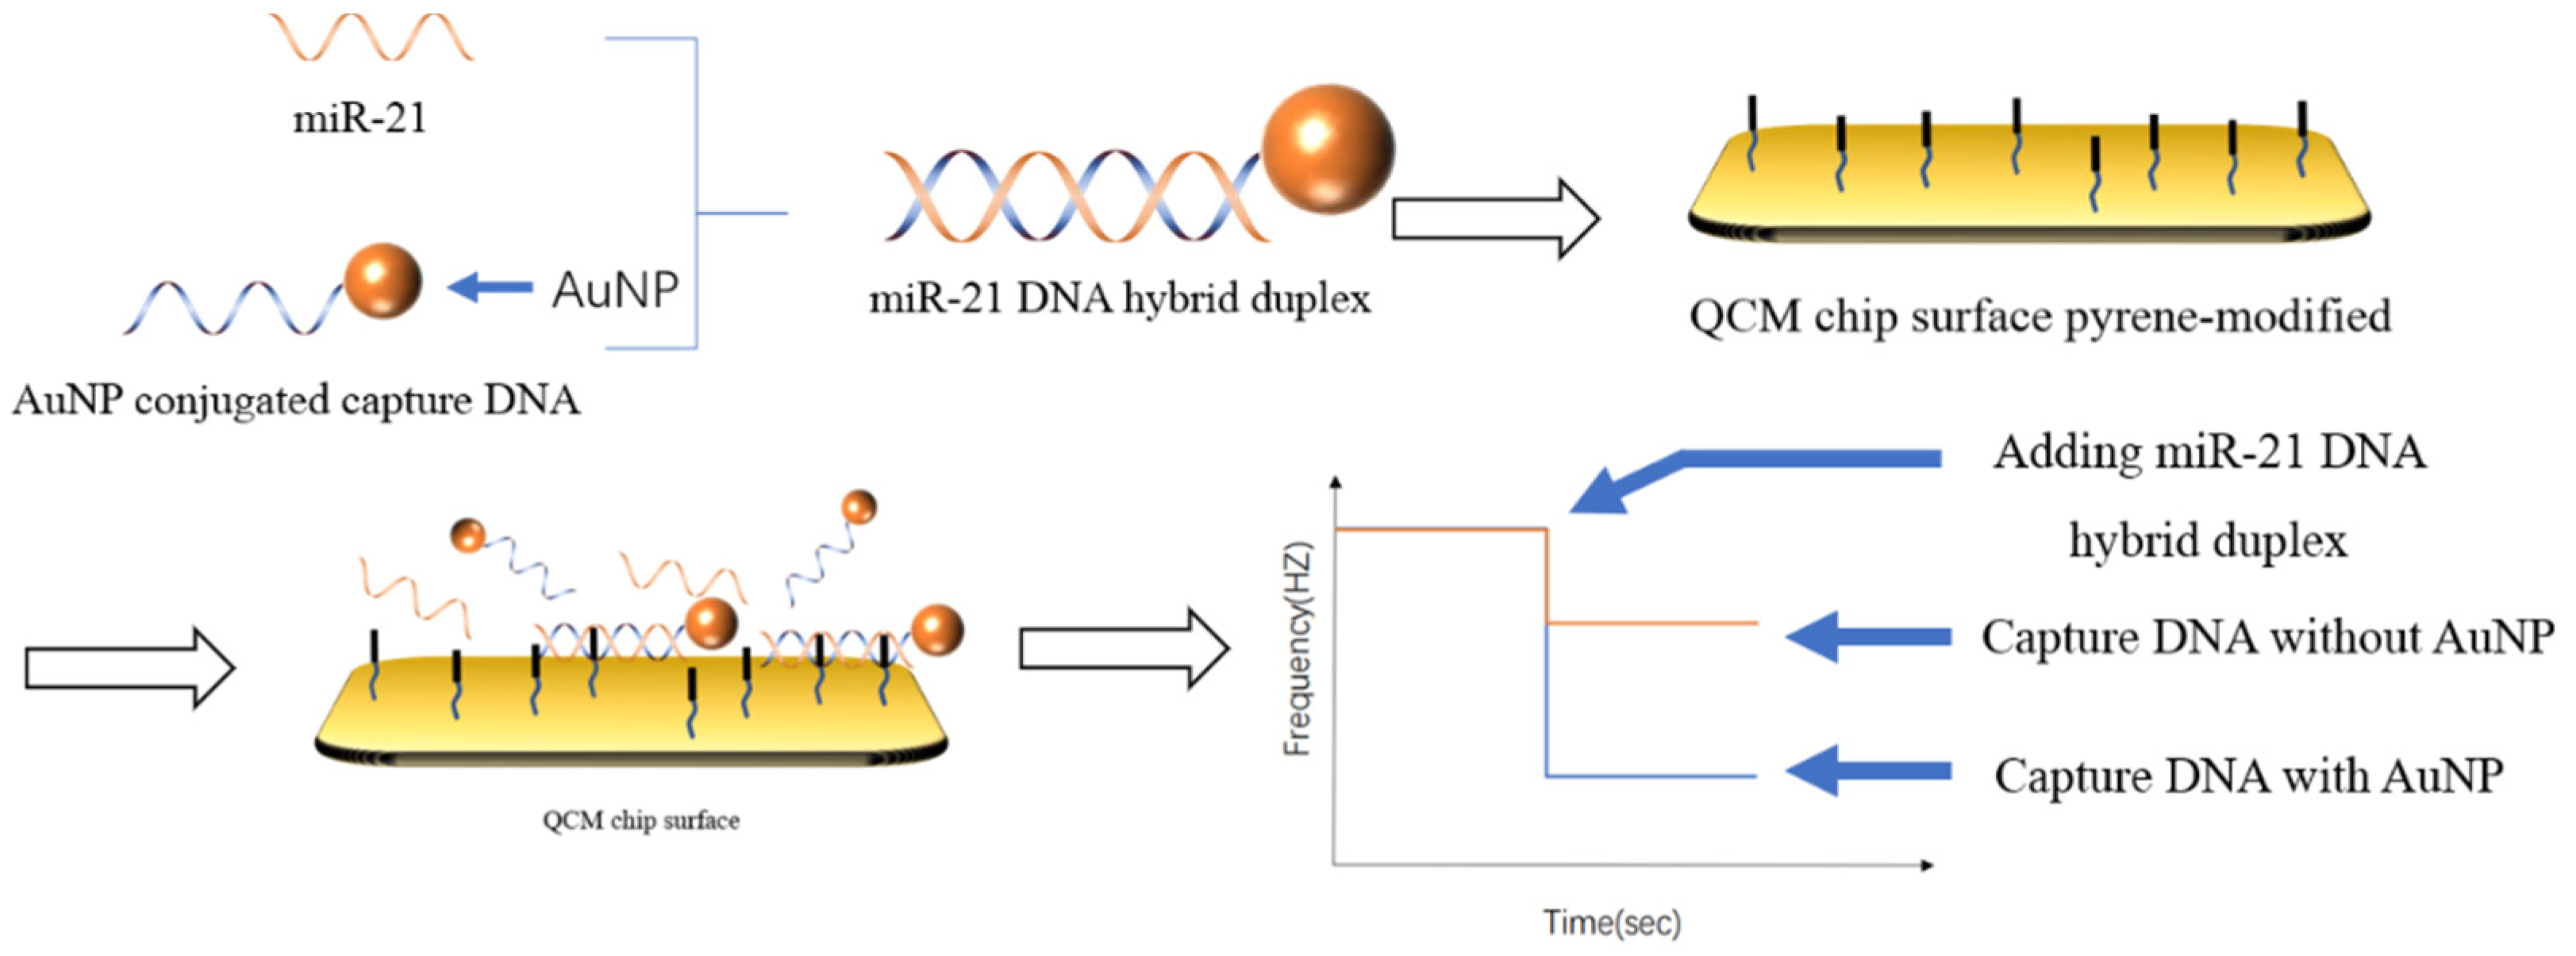
3.3.1. QCM Biosensor
3.3.2. Photoelectrochemical Biosensor
4. New Strategies for Biosensor
4.1. Molecularly Imprinted Polymers
4.2. Microfluidic Chip
5. Summary and Prospect
Author Contributions
Funding
Institutional Review Board Statement
Informed Consent Statement
Data Availability Statement
Conflicts of Interest
References
- World Health Organization. World Cancer Report: Cancer Research for Cancer Development; IARC: Lyon, France, 2020. [Google Scholar]
- Torre, L.A.; Islami, F.; Siegel, R.L.; Ward, E.M.; Jemal, A. Global Cancer in Women: Burden and Trends. Cancer Epidemiol. Biomarkers Prev. 2017, 26, 444–457. [Google Scholar] [CrossRef] [PubMed] [Green Version]
- Pace, L.E.; Keating, N.L. A systematic assessment of benefits and risks to guide breast cancer screening decisions. JAMA 2014, 311, 1327–1335. [Google Scholar] [CrossRef] [PubMed]
- Jafari, S.H.; Saadatpour, Z.; Salmaninejad, A.; Momeni, F.; Mokhtari, M.; Nahand, J.S.; Rahmati, M.; Mirzaei, H.; Kianmehr, M. Breast cancer diagnosis: Imaging techniques and biochemical markers. J. Cell. Physiol. 2018, 233, 5200–5213. [Google Scholar] [CrossRef] [PubMed]
- Panesar, S.; Neethirajan, S. Microfluidics: Rapid Diagnosis for Breast Cancer. Nanomicro Lett. 2016, 8, 204–220. [Google Scholar] [CrossRef] [Green Version]
- Roointan, A.; Ahmad Mir, T.; Ibrahim Wani, S.; Mati Ur, R.; Hussain, K.K.; Ahmed, B.; Abrahim, S.; Savardashtaki, A.; Gandomani, G.; Gandomani, M.; et al. Early detection of lung cancer biomarkers through biosensor technology: A review. J. Pharm. Biomed. Anal. 2019, 164, 93–103. [Google Scholar] [CrossRef]
- Ranjan, P.; Parihar, A.; Jain, S.; Kumar, N.; Dhand, C.; Murali, S.; Mishra, D.; Sanghi, S.K.; Chaurasia, J.P.; Srivastava, A.K.; et al. Biosensor-based diagnostic approaches for various cellular biomarkers of breast cancer: A comprehensive review. Anal. Biochem. 2020, 610, 113996. [Google Scholar] [CrossRef]
- Kal-Koshvandi, A.T. Recent advances in optical biosensors for the detection of cancer biomarker α-fetoprotein (AFP). Trends Anal. Chem. 2020, 128, 115920. [Google Scholar] [CrossRef]
- Piroozmand, F.; Mohammadipanah, F.; Faridbod, F. Emerging biosensors in detection of natural products. Synth. Syst. Biotechnol. 2020, 5, 293–303. [Google Scholar] [CrossRef]
- Mehrotra, P. Biosensors and their applications—A review. J. Oral. Biol. Craniofacial Res. 2016, 6, 153–159. [Google Scholar] [CrossRef] [Green Version]
- Misek, D.E.; Kim, E.H. Protein biomarkers for the early detection of breast cancer. Int. J. Proteom. 2011, 2011, 343582. [Google Scholar] [CrossRef] [Green Version]
- Harbeck, N.; Gnant, M. Breast cancer. Lancet 2017, 389, 1134–1150. [Google Scholar] [CrossRef]
- Li, G.; Hu, J.; Hu, G. Biomarker Studies in Early Detection and Prognosis of Breast Cancer. Adv. Exp. Med. Biol. 2017, 1026, 27–39. [Google Scholar] [CrossRef] [PubMed]
- Jayanthi, V.; Das, A.B.; Saxena, U. Recent advances in biosensor development for the detection of cancer biomarkers. Biosens. Bioelectron. 2017, 91, 15–23. [Google Scholar] [CrossRef] [PubMed]
- Tothill, I.E. Biosensors for cancer markers diagnosis. Semin. Cell Dev. Biol. 2009, 20, 55–62. [Google Scholar] [CrossRef]
- Chang, Y.; Xu, J.; Zhang, Q. Microplate magnetic chemiluminescence immunoassay for detecting urinary survivin in bladder cancer. Oncol. Lett. 2017, 14, 4043–4052. [Google Scholar] [CrossRef] [Green Version]
- Lakshmipriya, T.; Gopinath, S.C.B.; Hashim, U.; Murugaiyah, V. Multi-analyte validation in heterogeneous solution by ELISA. Int. J. Biol. Macromol. 2017, 105, 796–800. [Google Scholar] [CrossRef]
- Yang, G.; Xiao, Z.; Tang, C.; Deng, Y.; Huang, H.; He, Z. Recent advances in biosensor for detection of lung cancer biomarkers. Biosens. Bioelectron. 2019, 141, 111416. [Google Scholar] [CrossRef]
- Ouyang, M.; Tu, D.; Tong, L.; Sarwar, M.; Bhimaraj, A.; Li, C.; Cote, G.L.; Di Carlo, D. A review of biosensor technologies for blood biomarkers toward monitoring cardiovascular diseases at the point-of-care. Biosens. Bioelectron. 2021, 171, 112621. [Google Scholar] [CrossRef]
- Xu, L.; Shoaie, N.; Jahanpeyma, F.; Zhao, J.; Azimzadeh, M.; Al Jamal, K.T. Optical, electrochemical and electrical (nano)biosensors for detection of exosomes: A comprehensive overview. Biosens. Bioelectron. 2020, 161, 112222. [Google Scholar] [CrossRef]
- Duffy, M.J.; Harbeck, N.; Nap, M.; Molina, R.; Nicolini, A.; Senkus, E.; Cardoso, F. Clinical use of biomarkers in breast cancer: Updated guidelines from the European Group on Tumor Markers (EGTM). Eur. J. Cancer 2017, 75, 284–298. [Google Scholar] [CrossRef] [Green Version]
- Nzegwu, M.; Uzoigwe, J.; Omotowo, B.; Ugochukwu, A.; Ozumba, B.; Sule, E.; Ezeome, E.; Olusina, D.; Okafor, O.; Nzegwu, V.; et al. Predictive and prognostic relevance of immunohistochemical testing of estrogen and progesterone receptors in breast cancer in South East Nigeria: A review of 417 cases. Rare Tumors 2021, 13, 20363613211006338. [Google Scholar] [CrossRef] [PubMed]
- Nicolini, A.; Ferrari, P.; Duffy, M.J. Prognostic and predictive biomarkers in breast cancer: Past, present and future. Semin. Cancer Biol. 2018, 52, 56–73. [Google Scholar] [CrossRef] [PubMed]
- Allison, K.H.; Hammond, M.E.H.; Dowsett, M.; McKernin, S.E.; Carey, L.A.; Fitzgibbons, P.L.; Hayes, D.F.; Lakhani, S.R.; Chavez-MacGregor, M.; Perlmutter, J.; et al. Estrogen and Progesterone Receptor Testing in Breast Cancer: ASCO/CAP Guideline Update. J. Clin. Oncol. 2020, 38, 1346–1366. [Google Scholar] [CrossRef] [PubMed]
- Weigel, M.T.; Dowsett, M. Current and emerging biomarkers in breast cancer: Prognosis and prediction. Endocr. Relat. Cancer 2010, 17, R245–R262. [Google Scholar] [CrossRef]
- Davies, C.; Godwin, J.; Gray, R.; Clarke, M.; Darby, S.; McGale, P.; Wang, Y.C.; Peto, R.; Pan, H.C.; Cutter, D.; et al. Relevance of breast cancer hormone receptors and other factors to the efficacy of adjuvant tamoxifen: Patient-level meta-analysis of randomised trials. Lancet 2011, 378, 771–784. [Google Scholar] [CrossRef] [PubMed] [Green Version]
- Dai, X.; Xiang, L.; Li, T.; Bai, Z. Cancer Hallmarks, Biomarkers and Breast Cancer Molecular Subtypes. J. Cancer 2016, 7, 1281–1294. [Google Scholar] [CrossRef] [PubMed] [Green Version]
- Loibl, S.; Gianni, L. HER2-positive breast cancer. Lancet 2017, 389, 2415–2429. [Google Scholar] [CrossRef]
- Waks, A.G.; Winer, E.P. Breast Cancer Treatment: A Review. JAMA 2019, 321, 288–300. [Google Scholar] [CrossRef]
- Harbeck, N. Advances in targeting HER2-positive breast cancer. Curr. Opin. Obstet. Gynecol. 2018, 30, 55–59. [Google Scholar] [CrossRef]
- Wolff, A.C.; Hammond, M.E.; Hicks, D.G.; Dowsett, M.; McShane, L.M.; Allison, K.H.; Allred, D.C.; Bartlett, J.M.; Bilous, M.; Fitzgibbons, P.; et al. Recommendations for human epidermal growth factor receptor 2 testing in breast cancer: American Society of Clinical Oncology/College of American Pathologists clinical practice guideline update. Arch. Pathol. Lab. Med. 2014, 138, 241–256. [Google Scholar] [CrossRef] [Green Version]
- Yadav, B.S.; Chanana, P.; Jhamb, S. Biomarkers in triple negative breast cancer: A review. World J. Clin. Oncol. 2015, 6, 252–263. [Google Scholar] [CrossRef] [PubMed]
- da Silva, J.L.; Cardoso Nunes, N.C.; Izetti, P.; de Mesquita, G.G.; de Melo, A.C. Triple negative breast cancer: A thorough review of biomarkers. Crit. Rev. Oncol. Hematol. 2020, 145, 102855. [Google Scholar] [CrossRef] [PubMed]
- Crown, J.; O’Shaughnessy, J.; Gullo, G. Emerging targeted therapies in triple-negative breast cancer. Ann. Oncol. 2012, 23 (Suppl. 6), vi56–vi65. [Google Scholar] [CrossRef] [PubMed]
- Giovannelli, P.; Di Donato, M.; Galasso, G.; Di Zazzo, E.; Bilancio, A.; Migliaccio, A. The Androgen Receptor in Breast Cancer. Front. Endocrinol. 2018, 9, 492. [Google Scholar] [CrossRef] [Green Version]
- Luo, X.; Shi, Y.X.; Li, Z.M.; Jiang, W.Q. Expression and clinical significance of androgen receptor in triple negative breast cancer. Chin. J. Cancer 2010, 29, 585–590. [Google Scholar] [CrossRef] [Green Version]
- Tellez-Gabriel, M.; Knutsen, E.; Perander, M. Current Status of Circulating Tumor Cells, Circulating Tumor DNA, and Exosomes in Breast Cancer Liquid Biopsies. Int. J. Mol. Sci 2020, 21, 9457. [Google Scholar] [CrossRef]
- Zhang, T.; Hu, H.; Yan, G.; Wu, T.; Liu, S.; Chen, W.; Ning, Y.; Lu, Z. Long Non-Coding RNA and Breast Cancer. Technol Cancer Res Treat 2019, 18, 1533033819843889. [Google Scholar] [CrossRef] [Green Version]
- Donepudi, M.S.; Kondapalli, K.; Amos, S.J.; Venkanteshan, P. Breast cancer statistics and markers. J. Cancer Res. Ther 2014, 10, 506–511. [Google Scholar] [CrossRef]
- Tutt, A.; Tovey, H.; Cheang, M.C.U.; Kernaghan, S.; Kilburn, L.; Gazinska, P.; Owen, J.; Abraham, J.; Barrett, S.; Barrett-Lee, P.; et al. Carboplatin in BRCA1/2-mutated and triple-negative breast cancer BRCAness subgroups: The TNT Trial. Nat. Med. 2018, 24, 628–637. [Google Scholar] [CrossRef] [Green Version]
- Sheikh, A.; Hussain, S.A.; Ghori, Q.; Naeem, N.; Fazil, A.; Giri, S.; Sathian, B.; Mainali, P.; Al Tamimi, D.M. The spectrum of genetic mutations in breast cancer. Asian Pac. J. Cancer Prev. 2015, 16, 2177–2185. [Google Scholar] [CrossRef] [Green Version]
- Gupta, I.; Rizeq, B.; Vranic, S.; Moustafa, A.A.; Al Farsi, H. Circulating miRNAs in HER2-Positive and Triple Negative Breast Cancers: Potential Biomarkers and Therapeutic Targets. Int. J. Mol. Sci. 2020, 21, 6750. [Google Scholar] [CrossRef] [PubMed]
- Wang, H.; Peng, R.; Wang, J.; Qin, Z.; Xue, L. Circulating microRNAs as potential cancer biomarkers: The advantage and disadvantage. Clin. Epigenet. 2018, 10, 59. [Google Scholar] [CrossRef] [PubMed] [Green Version]
- Badr, M.; Said, H.; Louka, M.L.; Elghazaly, H.A.; Gaballah, A.; Atef Abd El Mageed, M. MicroRNA-21 as a predictor and prognostic factor for trastuzumab therapy in human epidermal growth factor receptor 2-positive metastatic breast cancer. J. Cell. Biochem. 2019, 120, 3459–3466. [Google Scholar] [CrossRef] [PubMed]
- Ye, Z.; Wang, C.; Wan, S.; Mu, Z.; Zhang, Z.; Abu-Khalaf, M.M.; Fellin, F.M.; Silver, D.P.; Neupane, M.; Jaslow, R.J.; et al. Association of clinical outcomes in metastatic breast cancer patients with circulating tumour cell and circulating cell-free DNA. Eur. J. Cancer 2019, 106, 133–143. [Google Scholar] [CrossRef]
- Openshaw, M.R.; Page, K.; Fernandez-Garcia, D.; Guttery, D.; Shaw, J.A. The role of ctDNA detection and the potential of the liquid biopsy for breast cancer monitoring. Expert. Rev. Mol. Diagn. 2016, 16, 751–755. [Google Scholar] [CrossRef]
- Jahani, S.; Nazeri, E.; Majidzadeh, A.K.; Jahani, M.; Esmaeili, R. Circular RNA; a new biomarker for breast cancer: A systematic review. J. Cell. Physiol. 2020, 235, 5501–5510. [Google Scholar] [CrossRef]
- Zhao, Q.; Yang, Y.; Ren, G.; Ge, E.; Fan, C. Integrating Bipartite Network Projection and KATZ Measure to Identify Novel CircRNA-Disease Associations. IEEE Trans. Nanobiosci. 2019, 18, 578–584. [Google Scholar] [CrossRef]
- Lin, C.; Yang, L. Long Noncoding RNA in Cancer: Wiring Signaling Circuitry. Trends Cell Biol. 2018, 28, 287–301. [Google Scholar] [CrossRef]
- Yousefi, H.; Maheronnaghsh, M.; Molaei, F.; Mashouri, L.; Aref, A.R.; Momeny, M.; Alahari, S.K. Long noncoding RNAs and exosomal lncRNAs: Classification, and mechanisms in breast cancer metastasis and drug resistance. Oncogene 2020, 39, 953–974. [Google Scholar] [CrossRef]
- Barkal, A.A.; Brewer, R.E.; Markovic, M.; Kowarsky, M.; Barkal, S.A.; Zaro, B.W.; Krishnan, V.; Hatakeyama, J.; Dorigo, O.; Barkal, L.J.; et al. CD24 signalling through macrophage Siglec-10 is a target for cancer immunotherapy. Nature 2019, 572, 392–396. [Google Scholar] [CrossRef]
- Wang, Z.; Wang, Q.; Wang, Q.; Wang, Y.; Chen, J. Prognostic significance of CD24 and CD44 in breast cancer: A meta-analysis. Int. J. Biol. Markers 2017, 32, e75–e82. [Google Scholar] [CrossRef] [PubMed]
- Xu, H.; Niu, M.; Yuan, X.; Wu, K.; Liu, A. CD44 as a tumor biomarker and therapeutic target. Exp. Hematol. Oncol. 2020, 9, 36. [Google Scholar] [CrossRef] [PubMed]
- Senbanjo, L.T.; Chellaiah, M.A. CD44: A Multifunctional Cell Surface Adhesion Receptor Is a Regulator of Progression and Metastasis of Cancer Cells. Front. Cell Dev. Biol. 2017, 5, 18. [Google Scholar] [CrossRef] [Green Version]
- Gao, T.; Cen, Q.; Lei, H. A review on development of MUC1-based cancer vaccine. Biomed. Pharmacother. 2020, 132, 110888. [Google Scholar] [CrossRef] [PubMed]
- Zhou, R.; Yazdanifar, M.; Roy, L.D.; Whilding, L.M.; Gavrill, A.; Maher, J.; Mukherjee, P. CAR T Cells Targeting the Tumor MUC1 Glycoprotein Reduce Triple-Negative Breast Cancer Growth. Front. Immunol. 2019, 10, 1149. [Google Scholar] [CrossRef] [PubMed] [Green Version]
- Diaconu, I.; Cristea, C.; Harceaga, V.; Marrazza, G.; Berindan-Neagoe, I.; Sandulescu, R. Electrochemical immunosensors in breast and ovarian cancer. Clin. Chim. Acta 2013, 425, 128–138. [Google Scholar] [CrossRef] [PubMed]
- Wang, W.; Xu, X.; Tian, B.; Wang, Y.; Du, L.; Sun, T.; Shi, Y.; Zhao, X.; Jing, J. The diagnostic value of serum tumor markers CEA, CA19-9, CA125, CA15-3, and TPS in metastatic breast cancer. Clin. Chim. Acta 2017, 470, 51–55. [Google Scholar] [CrossRef]
- Cristofanilli, M.; Pierga, J.Y.; Reuben, J.; Rademaker, A.; Davis, A.A.; Peeters, D.J.; Fehm, T.; Nole, F.; Gisbert-Criado, R.; Mavroudis, D.; et al. The clinical use of circulating tumor cells (CTCs) enumeration for staging of metastatic breast cancer (MBC): International expert consensus paper. Crit. Rev. Oncol. Hematol. 2019, 134, 39–45. [Google Scholar] [CrossRef]
- Thery, L.; Meddis, A.; Cabel, L.; Proudhon, C.; Latouche, A.; Pierga, J.Y.; Bidard, F.C. Circulating Tumor Cells in Early Breast Cancer. JNCI Cancer Spectr. 2019, 3, pkz026. [Google Scholar] [CrossRef]
- Logozzi, M.; Mizzoni, D.; Di Raimo, R.; Fais, S. Exosomes: A Source for New and Old Biomarkers in Cancer. Cancers 2020, 12, 2566. [Google Scholar] [CrossRef]
- Huang, T.; Deng, C.X. Current Progresses of Exosomes as Cancer Diagnostic and Prognostic Biomarkers. Int. J. Biol. Sci. 2019, 15, 1–11. [Google Scholar] [CrossRef] [PubMed]
- Sadighbayan, D.; Sadighbayan, K.; Khosroushahi, A.Y.; Hasanzadeh, M. Recent advances on the DNA-based electrochemical biosensing of cancer biomarkers: Analytical approach. Trends Anal. Chem. 2019, 119, 115609. [Google Scholar] [CrossRef]
- Sharifi, M.; Avadi, M.R.; Attar, F.; Dashtestani, F.; Ghorchian, H.; Rezayat, S.M.; Saboury, A.A.; Falahati, M. Cancer diagnosis using nanomaterials based electrochemical nanobiosensors. Biosens. Bioelectron. 2019, 126, 773–784. [Google Scholar] [CrossRef] [PubMed]
- Bhardwaj, T. Review on biosensor technologies. Int. J. Adv. Res. Eng. Technol. 2015, 6, 36–62. [Google Scholar]
- Moura, S.L.; Martin, C.G.; Marti, M.; Pividori, M.I. Electrochemical immunosensing of nanovesicles as biomarkers for breast cancer. Biosens. Bioelectron. 2020, 150, 111882. [Google Scholar] [CrossRef]
- Hong, C.; Yuan, R.; Chai, Y.; Zhuo, Y. Ferrocenyl-doped silica nanoparticles as an immobilized affinity support for electrochemical immunoassay of cancer antigen 15-3. Anal. Chim. Acta 2009, 633, 244–249. [Google Scholar] [CrossRef]
- Vasudev, A.; Kaushik, A.; Bhansali, S. Electrochemical immunosensor for label free epidermal growth factor receptor (EGFR) detection. Biosens. Bioelectron. 2013, 39, 300–305. [Google Scholar] [CrossRef]
- Hakimian, F.; Ghourchian, H. Ultrasensitive electrochemical biosensor for detection of microRNA-155 as a breast cancer risk factor. Anal. Chim. Acta 2020, 1136, 1–8. [Google Scholar] [CrossRef]
- Wang, J.; Wang, D.; Hui, N. A low fouling electrochemical biosensor based on the zwitterionic polypeptide doped conducting polymer PEDOT for breast cancer marker BRCA1 detection. Bioelectrochemistry 2020, 136, 107595. [Google Scholar] [CrossRef]
- Han, R.; Wang, G.; Xu, Z.; Zhang, L.; Li, Q.; Han, Y.; Luo, X. Designed antifouling peptides planted in conducting polymers through controlled partial doping for electrochemical detection of biomarkers in human serum. Biosens. Bioelectron. 2020, 164, 112317. [Google Scholar] [CrossRef]
- Xia, Y.M.; Li, M.Y.; Chen, C.L.; Xia, M.; Zhang, W.; Gao, W.W. Employing Label-free Electrochemical Biosensor Based on 3D-Reduced Graphene Oxide and Polyaniline Nanofibers for Ultrasensitive Detection of Breast Cancer BRCA1 Biomarker. Electroanalysis 2020, 32, 2045–2055. [Google Scholar] [CrossRef]
- Chang, J.; Wang, X.; Wang, J.; Li, H.; Li, F. Nucleic Acid-Functionalized Metal-Organic Framework-Based Homogeneous Electrochemical Biosensor for Simultaneous Detection of Multiple Tumor Biomarkers. Anal. Chem. 2019, 91, 3604–3610. [Google Scholar] [CrossRef] [PubMed]
- Chen, A.; Shah, B. Electrochemical sensing and biosensing based on square wave voltammetry. Anal. Methods 2013, 5, 2158–2173. [Google Scholar] [CrossRef]
- Wang, H.; Sun, J.; Lu, L.; Yang, X.; Xia, J.; Zhang, F.; Wang, Z. Competitive electrochemical aptasensor based on a cDNA-ferrocene/MXene probe for detection of breast cancer marker Mucin1. Anal. Chim. Acta 2020, 1094, 18–25. [Google Scholar] [CrossRef]
- Xu, S.; Chang, Y.; Wu, Z.; Li, Y.; Yuan, R.; Chai, Y. One DNA circle capture probe with multiple target recognition domains for simultaneous electrochemical detection of miRNA-21 and miRNA-155. Biosens. Bioelectron. 2020, 149, 111848. [Google Scholar] [CrossRef]
- Marques, R.C.; Viswanathan, S.; Nouws, H.P.; Delerue-Matos, C.; Gonzalez-Garcia, M.B. Electrochemical immunosensor for the analysis of the breast cancer biomarker HER2 ECD. Talanta 2014, 129, 594–599. [Google Scholar] [CrossRef] [Green Version]
- Freitas, M.; Nouws, H.P.A.; Delerue-Matos, C. Electrochemical Sensing Platforms for HER2-ECD Breast Cancer Biomarker Detection. Electroanalysis 2019, 31, 121–128. [Google Scholar] [CrossRef] [Green Version]
- Zhao, J.; Tang, Y.; Cao, Y.; Chen, T.; Chen, X.; Mao, X.; Yin, Y.; Chen, G. Amplified electrochemical detection of surface biomarker in breast cancer stem cell using self-assembled supramolecular nanocomposites. Electrochim. Acta 2018, 283, 1072–1078. [Google Scholar] [CrossRef]
- Gu, C.; Guo, C.; Li, Z.; Wang, M.; Zhou, N.; He, L.; Zhang, Z.; Du, M. Bimetallic ZrHf-based metal-organic framework embedded with carbon dots: Ultra-sensitive platform for early diagnosis of HER2 and HER2-overexpressed living cancer cells. Biosens. Bioelectron. 2019, 134, 8–15. [Google Scholar] [CrossRef]
- Paimard, G.; Shahlaei, M.; Moradipour, P.; Karamali, V.; Arkan, E. Impedimetric aptamer based determination of the tumor marker MUC1 by using electrospun core-shell nanofibers. Mikrochim. Acta 2019, 187, 5. [Google Scholar] [CrossRef]
- Shahrokhian, S.; Salimian, R. Ultrasensitive detection of cancer biomarkers using conducting polymer/electrochemically reduced graphene oxide-based biosensor: Application toward BRCA1 sensing. Sens. Actuators B Chem. 2018, 266, 160–169. [Google Scholar] [CrossRef]
- Wadhera, T.; Kakkar, D.; Wadhwa, G.; Raj, B. Recent Advances and Progress in Development of the Field Effect Transistor Biosensor: A Review. J. Electron. Mater. 2019, 48, 7635–7646. [Google Scholar] [CrossRef] [Green Version]
- Novodchuk, I.; Bajcsy, M.; Yavuz, M. Graphene-based field effect transistor biosensors for breast cancer detection: A review on biosensing strategies. Carbon 2021, 172, 431–453. [Google Scholar] [CrossRef]
- Majd, S.M.; Salimi, A.; Ghasemi, F. An ultrasensitive detection of miRNA-155 in breast cancer via direct hybridization assay using two-dimensional molybdenum disulfide field-effect transistor biosensor. Biosens. Bioelectron. 2018, 105, 6–13. [Google Scholar] [CrossRef] [PubMed]
- Bao, Z.; Sun, J.; Zhao, X.; Li, Z.; Cui, S.; Meng, Q.; Zhang, Y.; Wang, T.; Jiang, Y. Top-down nanofabrication of silicon nanoribbon field effect transistor (Si-NR FET) for carcinoembryonic antigen detection. Int. J. Nanomed. 2017, 12, 4623–4631. [Google Scholar] [CrossRef] [Green Version]
- Chen, C.; Wang, J. Optical biosensors: An exhaustive and comprehensive review. Analyst 2020, 145, 1605–1628. [Google Scholar] [CrossRef]
- Ding, J.; Qin, W. Recent advances in potentiometric biosensors. Trends Anal. Chem. 2020, 124, 115803. [Google Scholar] [CrossRef]
- Wang, Y.; Wei, Z.; Luo, X.; Wan, Q.; Qiu, R.; Wang, S. An ultrasensitive homogeneous aptasensor for carcinoembryonic antigen based on upconversion fluorescence resonance energy transfer. Talanta 2019, 195, 33–39. [Google Scholar] [CrossRef]
- Mohammadi, S.; Mohammadi, S.; Salimi, A. A 3D hydrogel based on chitosan and carbon dots for sensitive fluorescence detection of microRNA-21 in breast cancer cells. Talanta 2021, 224, 121895. [Google Scholar] [CrossRef]
- Bai, Y.; Li, H.; Xu, J.; Huang, Y.; Zhang, X.; Weng, J.; Li, Z.; Sun, L. Ultrasensitive colorimetric biosensor for BRCA1 mutation based on multiple signal amplification strategy. Biosens. Bioelectron. 2020, 166, 112424. [Google Scholar] [CrossRef]
- Choi, J.H.; Lim, J.; Shin, M.; Paek, S.H.; Choi, J.W. CRISPR-Cas12a-Based Nucleic Acid Amplification-Free DNA Biosensor via Au Nanoparticle-Assisted Metal-Enhanced Fluorescence and Colorimetric Analysis. Nano Lett. 2021, 21, 693–699. [Google Scholar] [CrossRef] [PubMed]
- Wang, D.; Loo, J.F.C.; Chen, J.; Yam, Y.; Chen, S.C.; He, H.; Kong, S.K.; Ho, H.P. Recent Advances in Surface Plasmon Resonance Imaging Sensors. Sensors 2019, 19, 1266. [Google Scholar] [CrossRef] [PubMed] [Green Version]
- Szymanska, B.; Lukaszewski, Z.; Hermanowicz-Szamatowicz, K.; Gorodkiewicz, E. An immunosensor for the determination of carcinoembryonic antigen by Surface Plasmon Resonance imaging. Anal. Biochem. 2020, 609, 113964. [Google Scholar] [CrossRef] [PubMed]
- Sina, A.A.; Vaidyanathan, R.; Wuethrich, A.; Carrascosa, L.G.; Trau, M. Label-free detection of exosomes using a surface plasmon resonance biosensor. Anal. Bioanal. Chem. 2019, 411, 1311–1318. [Google Scholar] [CrossRef] [Green Version]
- Wang, Q.; Zou, L.; Yang, X.; Liu, X.; Nie, W.; Zheng, Y.; Cheng, Q.; Wang, K. Direct quantification of cancerous exosomes via surface plasmon resonance with dual gold nanoparticle-assisted signal amplification. Biosens. Bioelectron. 2019, 135, 129–136. [Google Scholar] [CrossRef]
- Han, Y.; Qiang, L.; Gao, Y.; Gao, J.; He, Q.; Liu, H.; Han, L.; Zhang, Y. Large-area surface-enhanced Raman spectroscopy substrate by hybrid porous GaN with Au/Ag for breast cancer miRNA detection. Appl. Surf. Sci. 2021, 541, 148456. [Google Scholar] [CrossRef]
- Wang, H.N.; Crawford, B.M.; Norton, S.J.; Vo-Dinh, T. Direct and Label-Free Detection of MicroRNA Cancer Biomarkers using SERS-Based Plasmonic Coupling Interference (PCI) Nanoprobes. J. Phys. Chem. B 2019, 123, 10245–10251. [Google Scholar] [CrossRef]
- Wang, H.-M.; Wang, A.-J.; Yuan, P.-X.; Feng, J.-J. Flower-like metal-organic framework microsphere as a novel enhanced ECL luminophore to construct the coreactant-free biosensor for ultrasensitive detection of breast cancer 1 gene. Sens. Actuators B Chem. 2020, 320, 128395. [Google Scholar] [CrossRef]
- Qiao, B.; Guo, Q.; Jiang, J.; Qi, Y.; Zhang, H.; He, B.; Cai, C.; Shen, J. An electrochemiluminescent aptasensor for amplified detection of exosomes from breast tumor cells (MCF-7 cells) based on G-quadruplex/hemin DNAzymes. Analyst 2019, 144, 3668–3675. [Google Scholar] [CrossRef]
- Cui, A.; Zhang, J.; Bai, W.; Sun, H.; Bao, L.; Ma, F.; Li, Y. Signal-on electrogenerated chemiluminescence biosensor for ultrasensitive detection of microRNA-21 based on isothermal strand-displacement polymerase reaction and bridge DNA-gold nanoparticles. Biosens. Bioelectron. 2019, 144, 111664. [Google Scholar] [CrossRef]
- Hartz, J.S.R.; Emanetoglu, N.W.; Howell, C.; Vetelino, J.F. Lateral field excited quartz crystal microbalances for biosensing applications. Biointerphases 2020, 15, 030801. [Google Scholar] [CrossRef] [PubMed]
- Yang, X.; Zhou, R.; Hao, Y.; Yang, P. A CD44-biosensor for evaluating metastatic potential of breast cancer cells based on quartz crystal microbalance. Sci. Bull. 2017, 62, 923–930. [Google Scholar] [CrossRef]
- Park, H.J.; Lee, S.S. QCM sensing of miR-21 by formation of microRNA-DNA hybrid duplexes and intercalation on surface-functionalized pyrene. Analyst 2019, 144, 6936–6943. [Google Scholar] [CrossRef] [PubMed]
- Lin, S. Biosensitivity of Molybdenum Disulfide for Monitoring Breast Cancer Marker CA15-3 Using Quartz Crystal Microbalance. Int. J. Electrochem. Sci. 2021, 16, 150712. [Google Scholar] [CrossRef]
- Bakhshpour, M.; Piskin, A.K.; Yavuz, H.; Denizli, A. Quartz crystal microbalance biosensor for label-free MDA MB 231 cancer cell detection via notch-4 receptor. Talanta 2019, 204, 840–845. [Google Scholar] [CrossRef] [PubMed]
- Guo, X.; Liu, S.; Yang, M.; Du, H.; Qu, F. Dual signal amplification photoelectrochemical biosensor for highly sensitive human epidermal growth factor receptor-2 detection. Biosens. Bioelectron. 2019, 139, 111312. [Google Scholar] [CrossRef]
- Fu, Y.; Zou, K.; Liu, M.; Zhang, X.; Du, C.; Chen, J. Highly Selective and Sensitive Photoelectrochemical Sensing Platform for VEGF165 Assay Based on the Switching of Photocurrent Polarity of CdS QDs by Porous Cu2O-CuO Flower. Anal. Chem. 2020, 92, 1189–1196. [Google Scholar] [CrossRef]
- Dar, K.K.; Shao, S.; Tan, T.; Lv, Y. Molecularly imprinted polymers for the selective recognition of microorganisms. Biotechnol. Adv. 2020, 45, 107640. [Google Scholar] [CrossRef]
- Ramanavicius, S.; Jagminas, A.; Ramanavicius, A. Advances in Molecularly Imprinted Polymers Based Affinity Sensors (Review). Polymers 2021, 13, 974. [Google Scholar] [CrossRef]
- Zidaric, T.; Finsgar, M.; Maver, U.; Maver, T. Artificial Biomimetic Electrochemical Assemblies. Biosensors 2022, 12, 44. [Google Scholar] [CrossRef]
- Lowdon, J.W.; Dilien, H.; Singla, P.; Peeters, M.; Cleij, T.J.; van Grinsven, B.; Eersels, K. MIPs for commercial application in low-cost sensors and assays—An overview of the current status quo. Sens Actuators B Chem. 2020, 325, 128973. [Google Scholar] [CrossRef] [PubMed]
- You, M.; Yang, S.; Tang, W.; Zhang, F.; He, P. Molecularly imprinted polymers-based electrochemical DNA biosensor for the determination of BRCA-1 amplified by SiO2@Ag. Biosens. Bioelectron. 2018, 112, 72–78. [Google Scholar] [CrossRef] [PubMed]
- Ribeiro, J.A.; Pereira, C.M.; Silva, A.F.; Sales, M.G.F. Disposable electrochemical detection of breast cancer tumour marker CA 15-3 using poly(Toluidine Blue) as imprinted polymer receptor. Biosens. Bioelectron. 2018, 109, 246–254. [Google Scholar] [CrossRef] [PubMed]
- Pacheco, J.G.; Rebelo, P.; Freitas, M.; Nouws, H.P.A.; Delerue-Matos, C. Breast cancer biomarker (HER2-ECD) detection using a molecularly imprinted electrochemical sensor. Sens. Actuators B Chem. 2018, 273, 1008–1014. [Google Scholar] [CrossRef]
- Santos, A.R.T.; Moreira, F.T.C.; Helguero, L.A.; Sales, M.G.F. Antibody Biomimetic Material Made of Pyrrole for CA 15-3 and Its Application as Sensing Material in Ion-Selective Electrodes for Potentiometric Detection. Biosensors 2018, 8, 8. [Google Scholar] [CrossRef] [Green Version]
- Wang, X.; Liu, Z.; Fan, F.; Hou, Y.; Yang, H.; Meng, X.; Zhang, Y.; Ren, F. Microfluidic chip and its application in autophagy detection. Trends Anal. Chem. 2019, 117, 300–315. [Google Scholar] [CrossRef]
- Farshchi, F.; Hasanzadeh, M. Microfluidic biosensing of circulating tumor cells (CTCs): Recent progress and challenges in efficient diagnosis of cancer. Biomed. Pharmacother. 2021, 134, 111153. [Google Scholar] [CrossRef]
- Gao, Y.; Huo, W.; Zhang, L.; Lian, J.; Tao, W.; Song, C.; Tang, J.; Shi, S.; Gao, Y. Multiplex measurement of twelve tumor markers using a GMR multi-biomarker immunoassay biosensor. Biosens. Bioelectron. 2019, 123, 204–210. [Google Scholar] [CrossRef]
- Zheng, Z.; Wu, L.; Li, L.; Zong, S.; Wang, Z.; Cui, Y. Simultaneous and highly sensitive detection of multiple breast cancer biomarkers in real samples using a SERS microfluidic chip. Talanta 2018, 188, 507–515. [Google Scholar] [CrossRef]
- Liu, L.; Ye, K.; Lin, C.; Jia, Z.; Xue, T.; Nie, A.; Cheng, Y.; Xiang, J.; Mu, C.; Wang, B.; et al. Grain-boundary-rich polycrystalline monolayer WS2 film for attomolar-level Hg2+ sensors. Nat. Commun. 2021, 12, 3870. [Google Scholar] [CrossRef]

| Type of Biosensor | Target | Detection Limit | Linear Range | References | ||
|---|---|---|---|---|---|---|
| Electrochemical biosensor | CV | CA15-3 | 0.64 U mL−1 | 2.0–240 U mL−1 | [67] | |
| EGFR | 1 pg mL−1 | 1 pg mL−1–100 ng mL−1 | [68] | |||
| miRNA-155 | 2 × 10⁻²⁰ M | 2 × 10⁻²⁰–2 × 10⁻¹² M | [69] | |||
| DPV | BRCA1 | 0.0034 pM | 0.01 pM–1 nM | [70] | ||
| CA15-3 | 3.34 mU mL−1 | 0.01–1000 U mL−1 | [71] | |||
| BRCA1 | 3.01 × 10⁻¹⁶ M | 1.0 × 10⁻¹⁵–1.0 × 10⁻⁷ M | [72] | |||
| let-7a miRNA-21 | 3.6 fM (let-7a) 8.2 fM (miRNA-21) | 0.01–10 pM (let-7a) 0.02–10 pM (miRNA-21) | [73] | |||
| SWV | MUC1 | 0.33 pM | 1.0 pM–10 µM | [75] | ||
| miRNA-21 miRNA-155 | 18.9 aM (miRNA-21) 39.6 aM (miRNA-155) | 0.1 fM–10 nM | [76] | |||
| LSV | HER2-ECD | 4.4 ng mL−1 | 15–100ng mL−1 | [77] | ||
| HER2 | 0.16 ng mL−1 | 7.5–50 ng mL−1 | [78] | |||
| CD44 CD44 positive cell | 2.17 pg mL−1 8 cells mL−1 | 0.01 ng mL−1–100 ng mL−1 10 cells mL−1–106 cells mL−1 | [79] | |||
| EIS | HER2 MCF-7 cell | 19 fg mL−1 23 cells mL−1 | 0.001–10 ng mL−1 1 × 10²–1 × 10⁵ cells mL−1 | [80] | ||
| MUC1 | 2.7 nM | 5–115 nM | [81] | |||
| BRCA1 | 3 fM | 10 fM–0.1 µM | [82] | |||
| FET | miRNA-155 | 0.03 fM | 0.1 fM–10 nM | [85] | ||
| CEA | 10 pg mL−1 | 0.1–100 ng mL−1 | [86] | |||
| Optical biosensor | Fluorescence biosensor | CEA | 7.9 pg mL−1 (Water) 10.7 pg mL−1 (Human serum samples) | 0.03–6 ng mL−1 (Water) 0.03–6 ng mL−1 (Human serum samples) | [89] | |
| miRNA-21 | 0.03 fM | 0.1–125 fM | [90] | |||
| Colorimetric biosensor | BRCA1 | 10−18 M | 10−12–10−18 M | [91] | ||
| BRCA1 | 0.34 fM | 1 fM–100 pM | [92] | |||
| SPRi | CEA | 0.12 ng mL−1 | 0.40–20 ng mL−1 | [94] | ||
| HER2-positive EXO | 8280 exosomes μL−1 | 8280–33,100 exosomes μL−1 | [95] | |||
| EXO | 5000 exosomes mL−1 | / | [96] | |||
| SERS | miR-K12-5-5p | 884 pM | / | [97] | ||
| MicroRNA | / | / | [98] | |||
| ECL | BRCA1 | 0.71 fM | 1.0 fM–0.1 nM | [99] | ||
| EXO | 7.41 × 10⁴ exosomes | 3.4 × 10⁵–1.7 × 10⁸ exosomes mL−1 | [100] | |||
| miRNA-21 | 3.2 aM | 0.01–10,000 fM | [101] | |||
| QCM | miRNA-21 | 3.6 pM | 2.5 pM–2.5 μM | [104] | ||
| MDA-MB-231 cell MCF-7 cell | 300 cells mL−1 (M231) 1000 cells mL−1 (MCF-7) | 1 × 10³–5.0 × 10⁵ cells mL−1 (M231) 5 × 10³–4 × 10⁵ cells mL−1 (MCF-7) | [103] | |||
| MDA MB 231 cell | 12 cells mL−1 | 50–300 cells ml−1 | [106] | |||
| CA15-3 | 0.5 U mL−1 | 0.5–100 U mL−1 | [105] | |||
| PEC | HER2 | 0.36 ng mL−1 | 0.5–10 ng mL−1 | [107] | ||
| VEGF165 | 0.3 fM | 1–3000 fM | [108] | |||
| MIPs | DPV | CA15-3 | 0.10 U mL−1 | 0.10 U mL−1–100 U mL−1 | [114] | |
| HER2-ECD | 1.6 ng mL−1 | 10–70 ng mL−1 | [115] | |||
| BRCA1 | 2.53 fM | 10 fM–100 nM | [113] | |||
| Potentiometric Procedures | CA15-3 | 1.07 U mL−1 | 1.44–13.2 U mL−1 | [116] | ||
| Microfluidic chip | GMR | CEA AFP total PSA free PSA PG I PG II CYFRA21-1 NSE free-β-hCG SCC Tg CA19-9 | 0.5–500 ng mL−1 (CEA) 1–1000 ng mL−1 (AFP) 0.1–100ng mL−1 (total PSA) 0.1–50 ng mL−1 (free PSA) 2–200 ng mL−1 (PG I) 1–100 ng mL−1 (PG II) 0.5–100 ng mL−1 (CYFRA21-1) 1–200 ng mL−1 (NSE) 0.5–200 ng mL−1 (free-β-hCG) 0.5–70 ng mL−1 (SCC) 5–2000 ng mL−1 (Tg) 4–800 U mL−1 (CA19-9) | [119] | ||
| SERS | CA125 CA153 CEA | 0.01 U mL−1 (CA153) 0.01 U mL−1 (CA125) 1 pg mL−1 (CEA) | [120] | |||
Publisher’s Note: MDPI stays neutral with regard to jurisdictional claims in published maps and institutional affiliations. |
© 2022 by the authors. Licensee MDPI, Basel, Switzerland. This article is an open access article distributed under the terms and conditions of the Creative Commons Attribution (CC BY) license (https://creativecommons.org/licenses/by/4.0/).
Share and Cite
Hong, R.; Sun, H.; Li, D.; Yang, W.; Fan, K.; Liu, C.; Dong, L.; Wang, G. A Review of Biosensors for Detecting Tumor Markers in Breast Cancer. Life 2022, 12, 342. https://doi.org/10.3390/life12030342
Hong R, Sun H, Li D, Yang W, Fan K, Liu C, Dong L, Wang G. A Review of Biosensors for Detecting Tumor Markers in Breast Cancer. Life. 2022; 12(3):342. https://doi.org/10.3390/life12030342
Chicago/Turabian StyleHong, Rui, Hongyu Sun, Dujuan Li, Weihuang Yang, Kai Fan, Chaoran Liu, Linxi Dong, and Gaofeng Wang. 2022. "A Review of Biosensors for Detecting Tumor Markers in Breast Cancer" Life 12, no. 3: 342. https://doi.org/10.3390/life12030342
APA StyleHong, R., Sun, H., Li, D., Yang, W., Fan, K., Liu, C., Dong, L., & Wang, G. (2022). A Review of Biosensors for Detecting Tumor Markers in Breast Cancer. Life, 12(3), 342. https://doi.org/10.3390/life12030342