


Automatic Detection of Tuberculosis Using VGG19 with Seagull-Algorithm

 ,
,  ,
,  and
and 
Abstract
1. Introduction
- (i)
- Implementation of pre-trained DLS-based TB detection from chest X-ray;
- (ii)
- Generation of MLF using LBP and DWT;
- (iii)
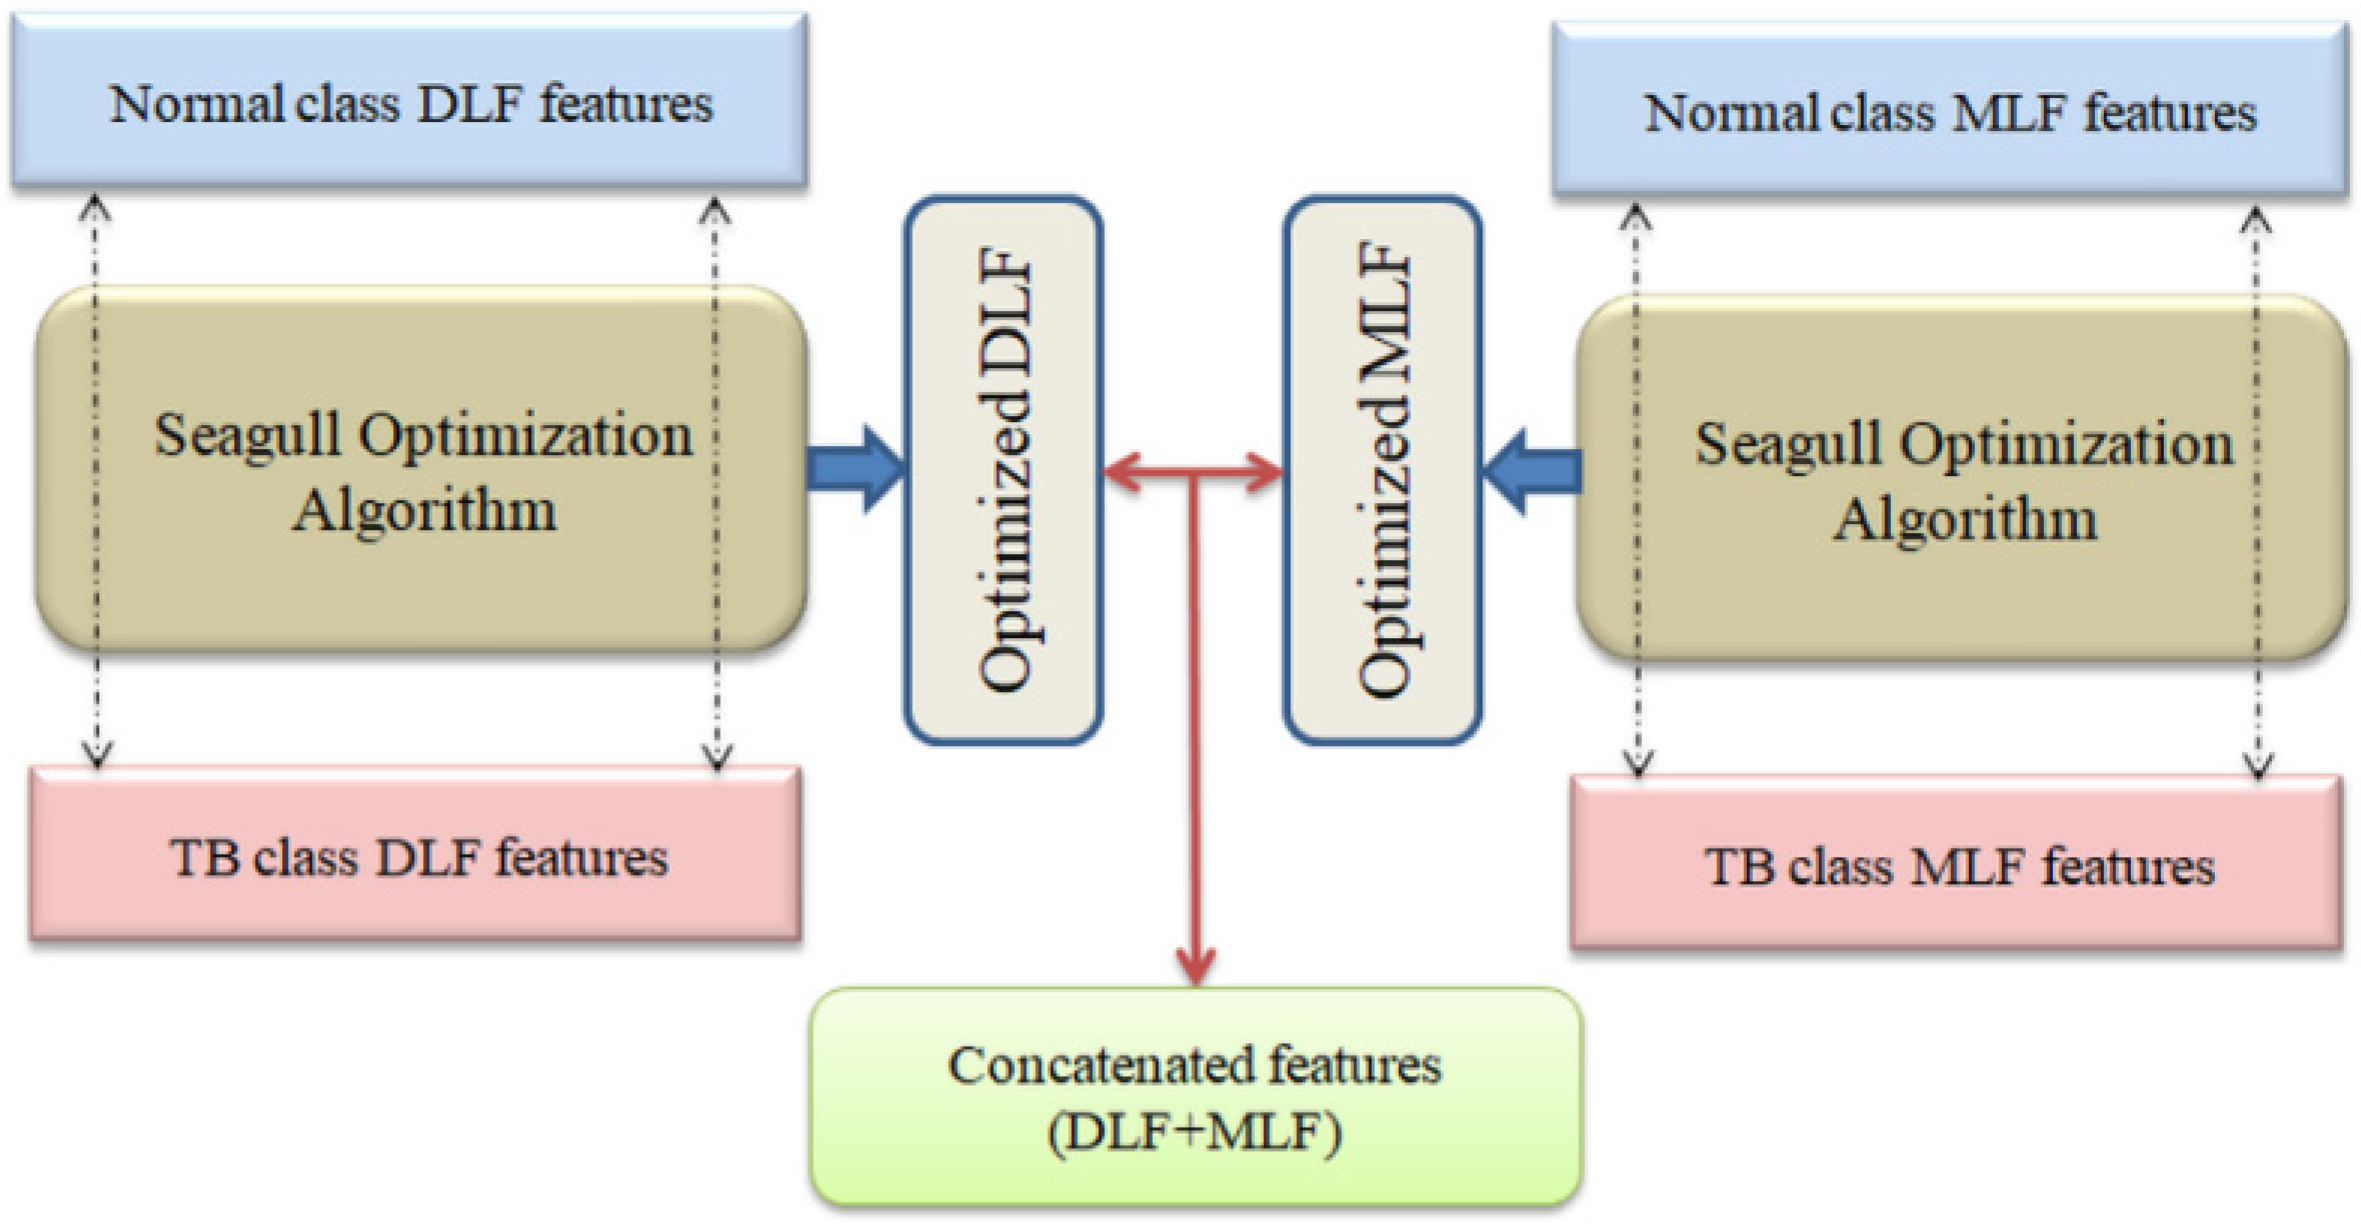
- SA-based feature optimization and serial feature concatenation to obtain DLF+MLF.
2. Earlier Research
3. Methodology
3.1. Image Dataset
3.2. Pre-Trained VGG19
3.3. Feature Extraction
3.3.1. Deep-Learning-Features
3.3.2. Machine-Learning-Features
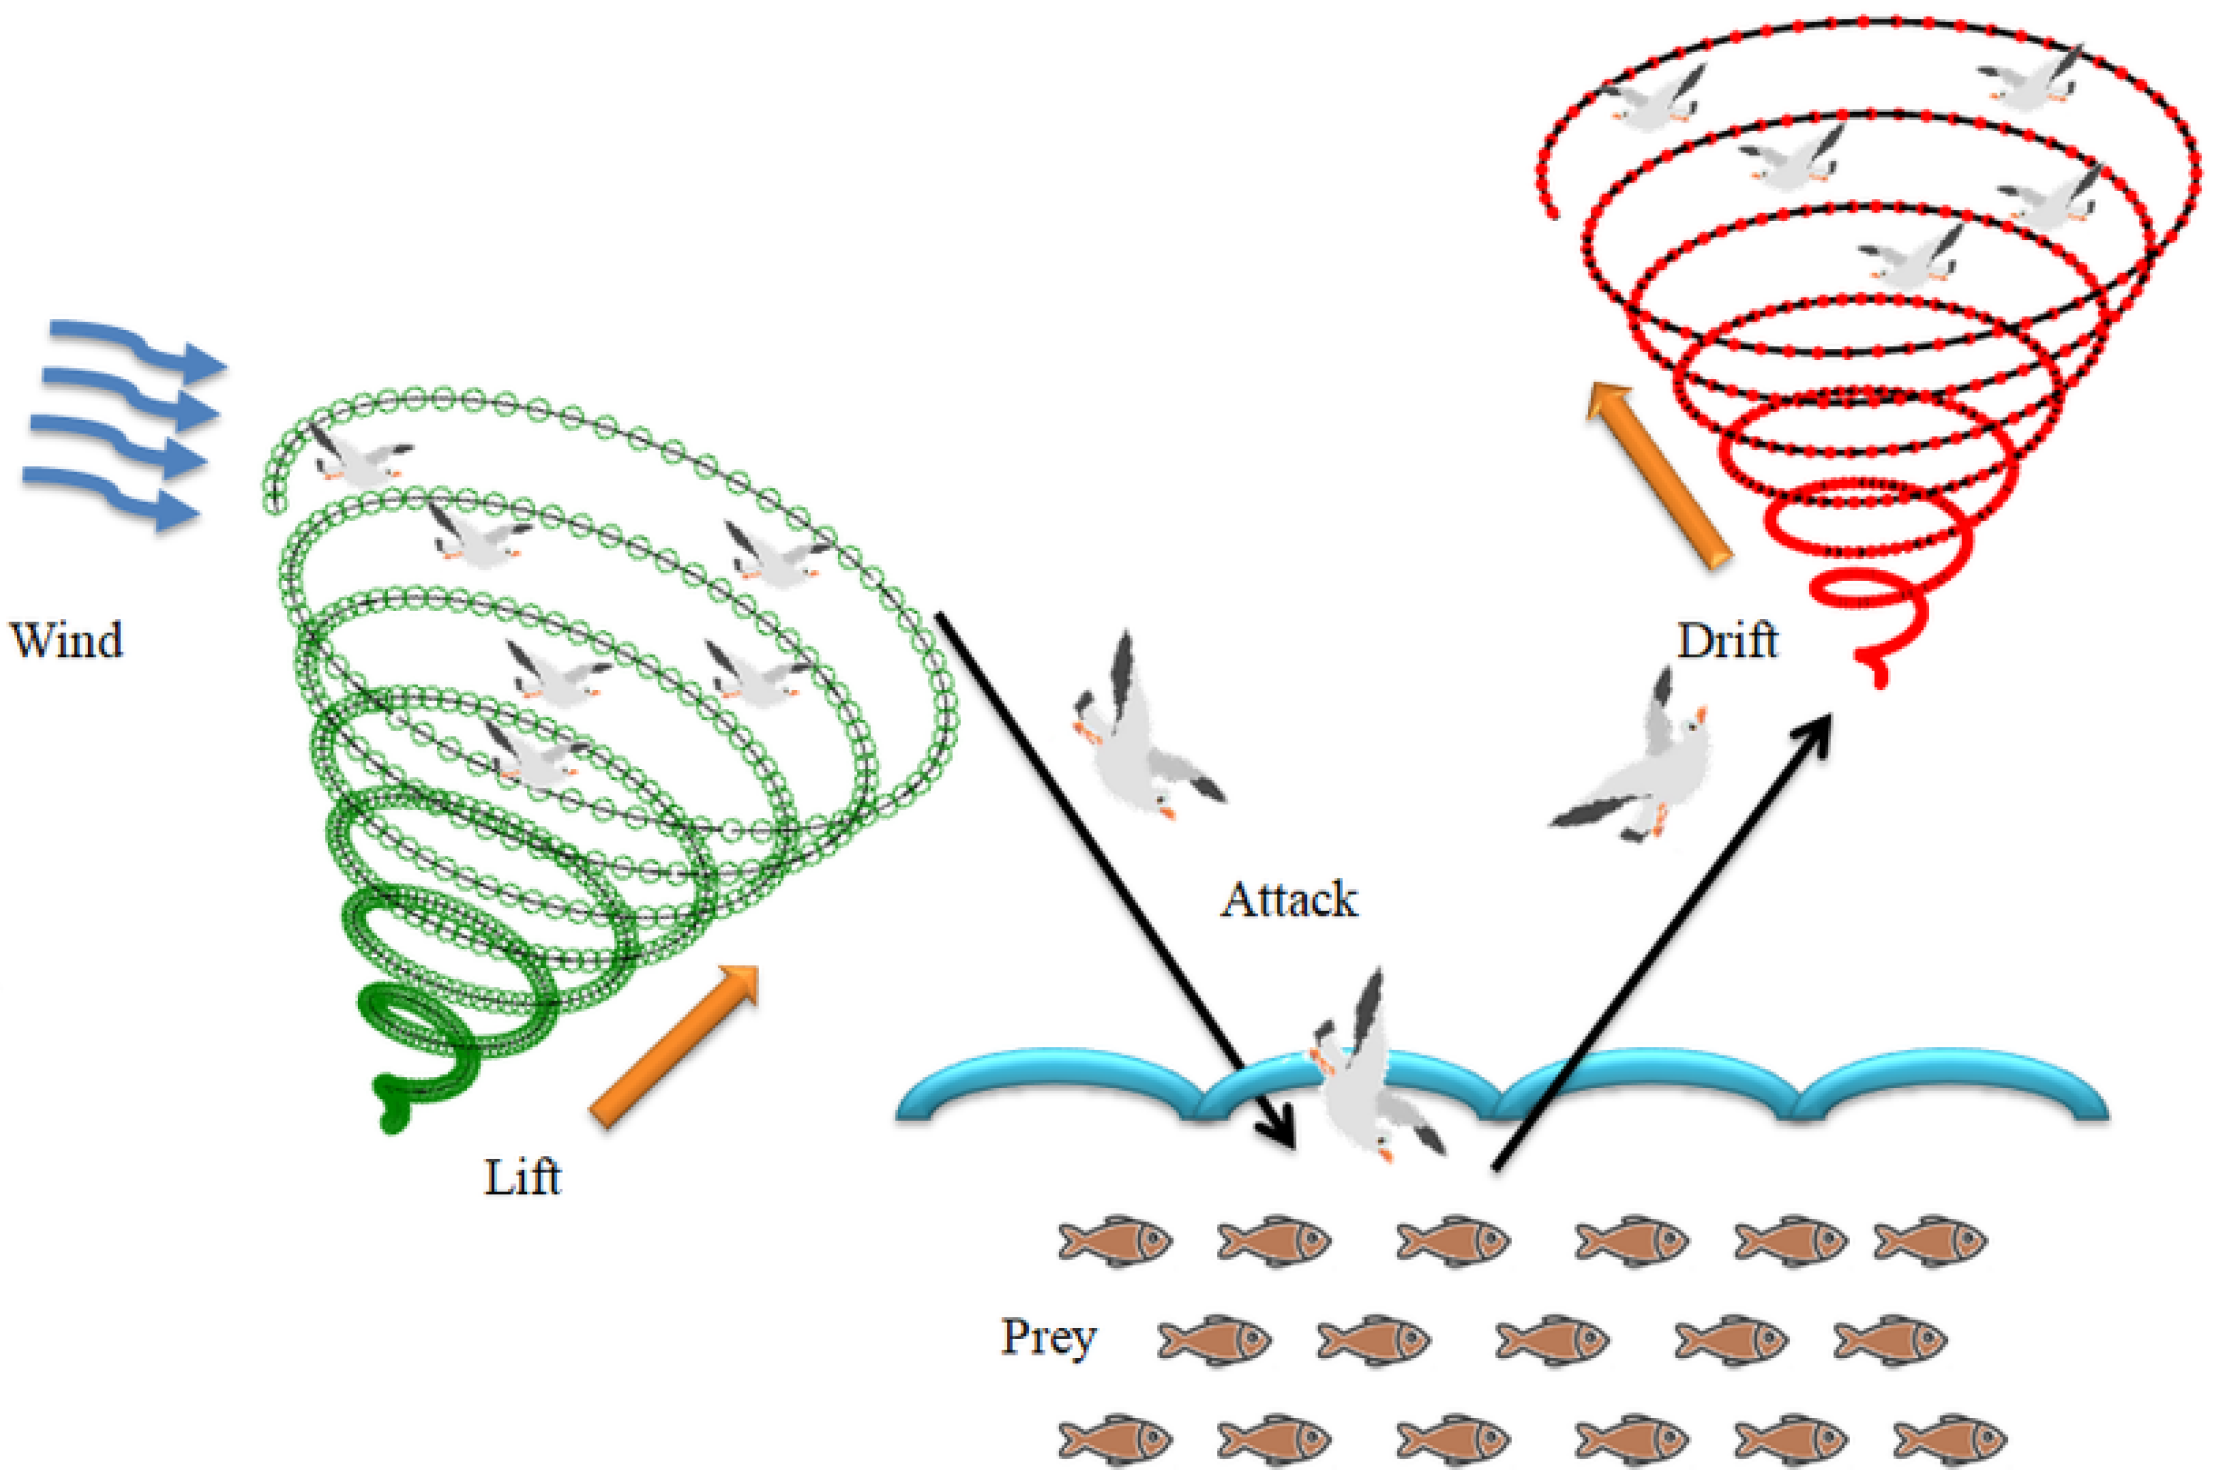
3.4. Seagull-Algorithm Based Feature Optimization
3.4.1. Migration as a Group to Find Fish Swarm (Exploration)
3.4.2. Attacking the Fish (Exploitation)
3.5. Performance Validation
4. Results and Discussion
5. Conclusions
Author Contributions
Funding
Institutional Review Board Statement
Informed Consent Statement
Data Availability Statement
Acknowledgments
Conflicts of Interest
References
- Rajinikanth, V.; Kadry, S.; Nam, Y. Convolutional neural network assisted segmentation and SVM classification of brain tumor in clinical MRI slices. Inf. Technol. Control 2021, 50, 342–356. [Google Scholar] [CrossRef]
- Ambikapathy, B.; Kirshnamurthy, K.; Venkatesan, R. Assessment of electromyograms using genetic algorithm and artificial neural networks. Evol. Intell. 2021, 14, 261–271. [Google Scholar] [CrossRef]
- Raghavendra, U.; Gudigar, A.; Rao, T.N.; Rajinikanth, V.; Ciaccio, E.J.; Yeong, C.H.; Satapathy, S.C.; Molinari, F.; Acharya, U.R. Feature-versus deep learning-based approaches for the automated detection of brain tumor with magnetic resonance images: A comparative study. Int. J. Imaging Syst. Technol. 2021, 32, 501–516. [Google Scholar] [CrossRef]
- Priya, S.J.; Rani, A.J.; Subathra, M.S.P.; Mohammed, M.A.; Damaševičius, R.; Ubendran, N. Local pattern transformation-based feature extraction for recognition of Parkinson’s disease based on gait signals. Diagnostics 2021, 11, 1395. [Google Scholar] [CrossRef] [PubMed]
- Rajakumar, M.P.; Sonia, R.; Maheswari, B.U.; Karuppiah, S.P. Tuberculosis detection in chest X-ray using Mayfly-algorithm optimized dual-deep-learning features. J. X-ray Sci. Technol. 2021, 11, 1395. [Google Scholar] [CrossRef]
- Kumar, V.; Singh, D.; Kaur, M.; Damaševičius, R. Overview of current state of research on the application of artificial intelligence techniques for COVID-19. PeerJ Comput. Sci. 2021, 7, e564. [Google Scholar] [CrossRef]
- Dey, N.; Zhang, Y.D.; Rajinikanth, V.; Pugalenthi, R.; Raja, N.S.M. Customized VGG19 architecture for pneumonia detection in chest X-rays. Pattern Recognit. Lett. 2021, 143, 67–74. [Google Scholar] [CrossRef]
- Akram, T.; Attique, M.; Gul, S.; Shahzad, A.; Altaf, M.; Naqvi, S.S.R.; Damaševičius, R.; Maskeliūnas, R. A novel framework for rapid diagnosis of COVID-19 on computed tomography scans. Pattern Anal. Appl. 2021, 24, 951–964. [Google Scholar] [CrossRef]
- Singh, D.; Kumar, V.; Kaur, M. Densely connected convolutional networks-based COVID-19 screening model. Appl. Intell. 2021, 51, 3044–3051. [Google Scholar] [CrossRef]
- Becker, A.S.; Blüthgen, C.; Van, V.D.P.; Sekaggya-Wiltshire, C.; Castelnuovo, B.; Kambugu, A.; Fehr, J.; Frauenfelder, T. Detection of tuberculosis patterns in digital photographs of chest X-ray images using Deep Learning: Feasibility study. Int. J. Tuberc. Lung Dis. 2018, 22, 328–335. [Google Scholar] [CrossRef]
- WHO. Tuberculosis. Available online: https://www.who.int/health-topics/tuberculosis#tab=tab_1 (accessed on 7 September 2022).
- WHO. Global Tuberculosis Report; WHO: Geneva, Switzerland, 2020. [Google Scholar]
- Harding, E. WHO global progress report on tuberculosis elimination. Lancet Respir. Med. 2020, 8, 19. [Google Scholar] [CrossRef]
- Al-Timemy, A.H.; Khushaba, R.N.; Mosa, Z.M.; Escudero, J. An efficient mixture of deep and machine learning models for COVID-19 and tuberculosis detection using X-ray images in resource limited settings. In Artificial Intelligence for COVID-19; Springer: Cham, Switzerland, 2021; pp. 77–100. [Google Scholar]
- Azmi, U.Z.M.; Yusof, N.A.; Abdullah, J.; Ahmad, S.A.A.; Faudzi, F.N.M.; Raston, N.H.A.; Suraiya, S.; Ong, P.S.; Krishnan, D.; Sahar, N.K. Portable electrochemical immunosensor for detection of Mycobacterium tuberculosis secreted protein CFP10-ESAT6 in clinical sputum samples. Mikrochim. Acta 2021, 188, 20. [Google Scholar] [CrossRef] [PubMed]
- Rajinikanth, V.; Kadry, S. Development of a Framework for Preserving the Disease-Evidence-Information to Support Efficient Disease Diagnosis. Int. J. Data Warehous. Min. 2021, 17, 63–84. [Google Scholar] [CrossRef]
- Diakogiannis, F.I.; Waldner, P.; Caccetta, C.; Wu, C. ResUNet-a: A deep learning framework for semantic segmentation of remotely sensed data. ISPRS J. Photogramm. Remote Sens. 2020, 162, 94–114. [Google Scholar] [CrossRef]
- Rahman, T.; Khandakar, A.; Kadir, M.A.; Islam, K.R.; Islam, K.F. Reliable tuberculosis detection using chest X-ray with deep learning, segmentation and visualization. IEEE Access 2020, 8, 191586–191601. [Google Scholar] [CrossRef]
- Rahman, T.; Khandakar, A.; Chowdhury, M.E.H. Tuberculosis (TB) Chest X-ray Database. Available online: https://ieee-dataport.org/documents/tuberculosis-tb-chest-x-ray-database (accessed on 7 September 2022).
- Rajaraman, S.; Antani, S.K. Modality-Specific Deep Learning Model Ensembles Toward Improving TB Detection in Chest Radiographs. IEEE Access 2020, 8, 27318–27326. [Google Scholar] [CrossRef]
- Hijazi, M.H.A.; Hwa, S.K.T.; Bade, A.; Yaakob, R.; Jeffree, M.S. Ensemble deep learning for tuberculosis detection using chest X-ray and canny edge detected images. IAES Int. J. Artif. Intell. 2019, 8, 429. [Google Scholar] [CrossRef]
- Wong, A.; Lee, J.R.H.; Rahmat-Khah, H.; Sabri, A.; Alaref, A.; Liu, H. TB-Net: A Tailored, Self-Attention Deep Convolutional Neural Network Design for Detection of Tuberculosis Cases From Chest X-ray Images. arXiv 2021, arXiv:2104.03165. [Google Scholar] [CrossRef]
- Hooda, R.; Sofat, S.; Kaur, S.; Mittal, A.; Meriaudeau, F. Deep-Learning: A Potential Method for Tuberculosis Detection Using Chest Radiography. In Proceedings of the 2017 IEEE International Conference on Signal and Image Processing Applications (ICSIPA), Kuching, Malaysia, 12–14 September 2017; IEEE: Piscataway, NJ, USA, 2017; pp. 497–502. [Google Scholar]
- Rohilla, A.; Hooda, R.; Mittal, A. TB detection in chest radiograph using deep learning architecture. In Proceedings of the 5th International Conference on Emerging Trends in Engineering, Technology, Science and Management (ICETETSM-17), Bengaluru, India, 20 August 2017; 2017; pp. 136–147. [Google Scholar]
- Nguyen, Q.H.; Nguyen, B.P.; Dao, S.D.; Unnikrishnan, B.; Dhingra, R.; Ravichandran, S.R.; Satpathy, S.; Raja, P.N.; Chua, M.C.H. Deep Learning Models for Tuberculosis Detection from Chest X-ray Images. In Proceedings of the 2019 26th International Conference on Telecommunications (ICT), Hanoi, Vietnam, 8–10 April 2019; IEEE: Piscataway, NJ, USA, 2019; pp. 381–385. [Google Scholar]
- Afzali, A.; Mofradand, F.B.; Pouladian, M. Feature Selection for Contour-Based Tuberculosis Detection from Chest X-ray Images. In Proceedings of the 2019 26th National and 4th International Iranian Conference on Biomedical Engineering (ICBME), Tehran, Iran, 27–28 November 2019; IEEE: Piscataway, NJ, USA, 2019; pp. 194–198. [Google Scholar]
- Rajinikanth, V.; Raj, A.N.J.; Thanaraj, K.P.; Naik, G.R. A Customized VGG19 Network with Concatenation of Deep and Handcrafted Features for Brain Tumor Detection. Appl. Sci. 2020, 10, 3429. [Google Scholar] [CrossRef]
- Kadry, S.; Srivastava, G.; Rajinikanth, V.; Rho, S.; Kim, Y. Tuberculosis detection in chest radiographs using spotted hyena algorithm optimized deep and handcrafted features. Comput. Intell. Neurosci. 2022, 2022, 9263379. [Google Scholar] [CrossRef]
- Saeed, F.; Khan, M.A.; Sharif, M.; Mittal, M.; Goyal, L.M.; Roy, S. Deep neural network features fusion and selection based on PLS regression with an application for crops diseases classification. Appl. Soft Comput. 2021, 103, 107164. [Google Scholar] [CrossRef]
- Gudigar, A.; Raghavendra, U.; Devasia, T.; Nayak, K.; Danish, S.M.; Kamath, G.; Samanth, J.; Pai, U.M.; Nayak, V.; Tan, R.S.; et al. Global weighted LBP based entropy features for the assessment of pulmonary hypertension. Pattern Recognit. Lett. 2019, 125, 35–41. [Google Scholar] [CrossRef]
- Song, T.; Xin, L.; Gao, C.; Zhang, T.; Huang, Y. Quaternionic extended local binary pattern with adaptive structural pyramid pooling for color image representation. Pattern Recognit. 2021, 115, 107891. [Google Scholar] [CrossRef]
- Tuncer, T.; Dogan, S.; Acharya, U.R. Automated EEG signal classification using chaotic local binary pattern. Expert Syst. Appl. 2021, 182, 115175. [Google Scholar] [CrossRef]
- Karadal, C.H.; Kaya, M.C.; Tuncer, T.; Dogan, S.; Acharya, U.R. Automated classification of remote sensing images using multileveled MobileNetV2 and DWT techniques. Expert Syst. Appl. 2021, 185, 115659. [Google Scholar] [CrossRef]
- Haweel, R.; Shalaby, A.; Mahmoud, A.; Seada, N.; Ghoniemy, S.; Ghazal, M.; Casanova, M.F.; Barnes, G.N.; El-Baz, A. A robust DWT–CNN-based CAD system for early diagnosis of autism using task-based fMRI. Med. Phys. 2021, 48, 2315–2326. [Google Scholar] [CrossRef]
- He, Z.; Lu, W.; Sun, W.; Huang, J. Digital image splicing detection based on Markov features in DCT and DWT domain. Pattern Recognit. 2012, 45, 4292–4299. [Google Scholar] [CrossRef]
- Cheong, K.H.; Tang, K.J.W.; Zhao, X.; Koh, J.E.W.; Faust, O.; Gururajan, R.; Ciaccio, E.J.; Rajinikanth, V.; Acharya, U.R. An automated skin melanoma detection system with melanoma-index based on entropy features. Biocybern. Biomed. Eng. 2021, 41, 997–1012. [Google Scholar] [CrossRef]
- Ramasamy, L.K.; Padinjappurathu, S.G.; Kadry, S.; Damaševičius, R. Detection of diabetic retinopathy using a fusion of textural and ridgelet features of retinal images and sequential minimal optimization classifier. PeerJ Comput. Sci. 2021, 7, e456. [Google Scholar] [CrossRef]
- Stewart, J.; Sprivulis, P.; Dwivedi, G. Artificial intelligence and machine learning in emergency medicine. Emerg. Med. Australas. 2018, 30, 870–874. [Google Scholar] [CrossRef]
- Acharya, U.R.; Fernandes, S.L.; WeiKoh, J.E.; Ciaccio, E.J.; Fabell, M.K.M.; Tanik, U.J.; Rajinikanth, V.; Yeong, C.H. Automated Detection of Alzheimer’s Disease Using Brain MRI Images– A Study with Various Feature Extraction Techniques. J. Med. Syst. 2019, 43, 1–14. [Google Scholar] [CrossRef] [PubMed]
- Rajinikanth, V.; Kadry, S.; Taniar, D.; Damasevicius, R.; Rauf, H.T. Breast-Cancer Detection using Thermal Images with Marine-Predators-Algorithm Selected Features. In Proceedings of the 2021 Seventh International conference on Bio Signals, Images, and Instrumentation (ICBSII), Chennai, India, 25–27 March 2021; IEEE: Piscataway, NJ, USA, 2021; pp. 1–6. [Google Scholar]
- Khan, M.A.; Kadry, S.; Alhaisoni, M.; Nam, Y.; Zhang, Y.-D.; Rajinikanth, V.; Sarfaraz, M.S. Computer-Aided Gastrointestinal Diseases Analysis From Wireless Capsule Endoscopy: A Framework of Best Features Selection. IEEE Access 2020, 8, 132850–132859. [Google Scholar] [CrossRef]
- Ahmed, M.; Ramzan, M.; Khan, H.U.; Iqbal, S.; Khan, M.A.; Choi, J.-I.; Nam, Y.; Kadry, S. Real-Time Violent Action Recognition Using Key Frames Extraction and Deep Learning. Comput. Mater. Contin. 2021, 69, 2217–2230. [Google Scholar] [CrossRef]
- Dhiman, G.; Kumar, V. Seagull optimization algorithm: Theory and its applications for large-scale industrial engineering problems. Knowl.-Based Syst. 2018, 165, 169–196. [Google Scholar] [CrossRef]
- Dhiman, G.; Singh, K.K.; Soni, M.; Nagar, A.; Dehghani, M.; Slowik, A.; Kaur, A.; Sharma, A.; Houssein, E.H.; Cengiz, K. MOSOA: A new multi-objective seagull optimization algorithm. Expert Syst. Appl. 2021, 167, 114150. [Google Scholar] [CrossRef]
- Panagant, N.; Pholdee, N.; Bureerat, S.; Kaen, K.; Yıldız, A.R.; Sait, S.M. Seagull optimization algorithm for solving real-world design optimization problems. Mater. Test. 2020, 62, 640–644. [Google Scholar] [CrossRef]


| Reference | Developed Procedure |
|---|---|
| Rajaraman and Antani [20] | Implementation of modified DLS is presented in this research to inspect the Shenzhen CXR images and this scheme offered a classification accuracy of 83.7% on the considered images. |
| Hwa et al. [21] | Assessment of TB using the chest X-ray with ensemble DLS and Canny supported edge discovery is discussed and this investigation offered a categorization accuracy of 89.77%. |
| Wong et al. [22] | This research implemented a novel DLS called TB-Net to examine the TV from X-ray pictures and this work helped to obtain improved performance (accuracy = 99.86%) measure on the chosen image database. |
| Hooda et al. [23] | Implementation of a customized DLS with 7 convolutional (Conv) and 3 fully connected (FC) layer is discussed to recognise the TB from the chosen test pictures and this DLS offered an accuracy of 94.73%. |
| Rohilla et al. [24] | This work implemented pre-trained DLS (AlexNet and VGG16) to automatically detect the chest radiographs and achieved better accuracy (>81%). |
| Nguyen et al. [25] | Examination of X-ray pictures using the existing DLS is discussed, and its performance is compared using chest X-ray images. |
| Afzali et al. [26] | This scheme employed the contour-based shape descriptor practice to distinguish the TB with a better accuracy (>92%). |
| Rahman et al. [18] | This work employed Conv Neural Network (CNN) supported joint segmentation and classification to classify 7000 number of test images into healthy/TB class. With the proposed technique, this scheme achieved a best classification accuracy of 96.47% (without segmentation) and 98.6% (with segmentation), respectively. |
| Class | Dimension | Images | ||
|---|---|---|---|---|
| Total | Training | Testing | ||
| Normal | 3500 | 2450 | 1050 | |
| TB | 3500 | 2450 | 1050 | |
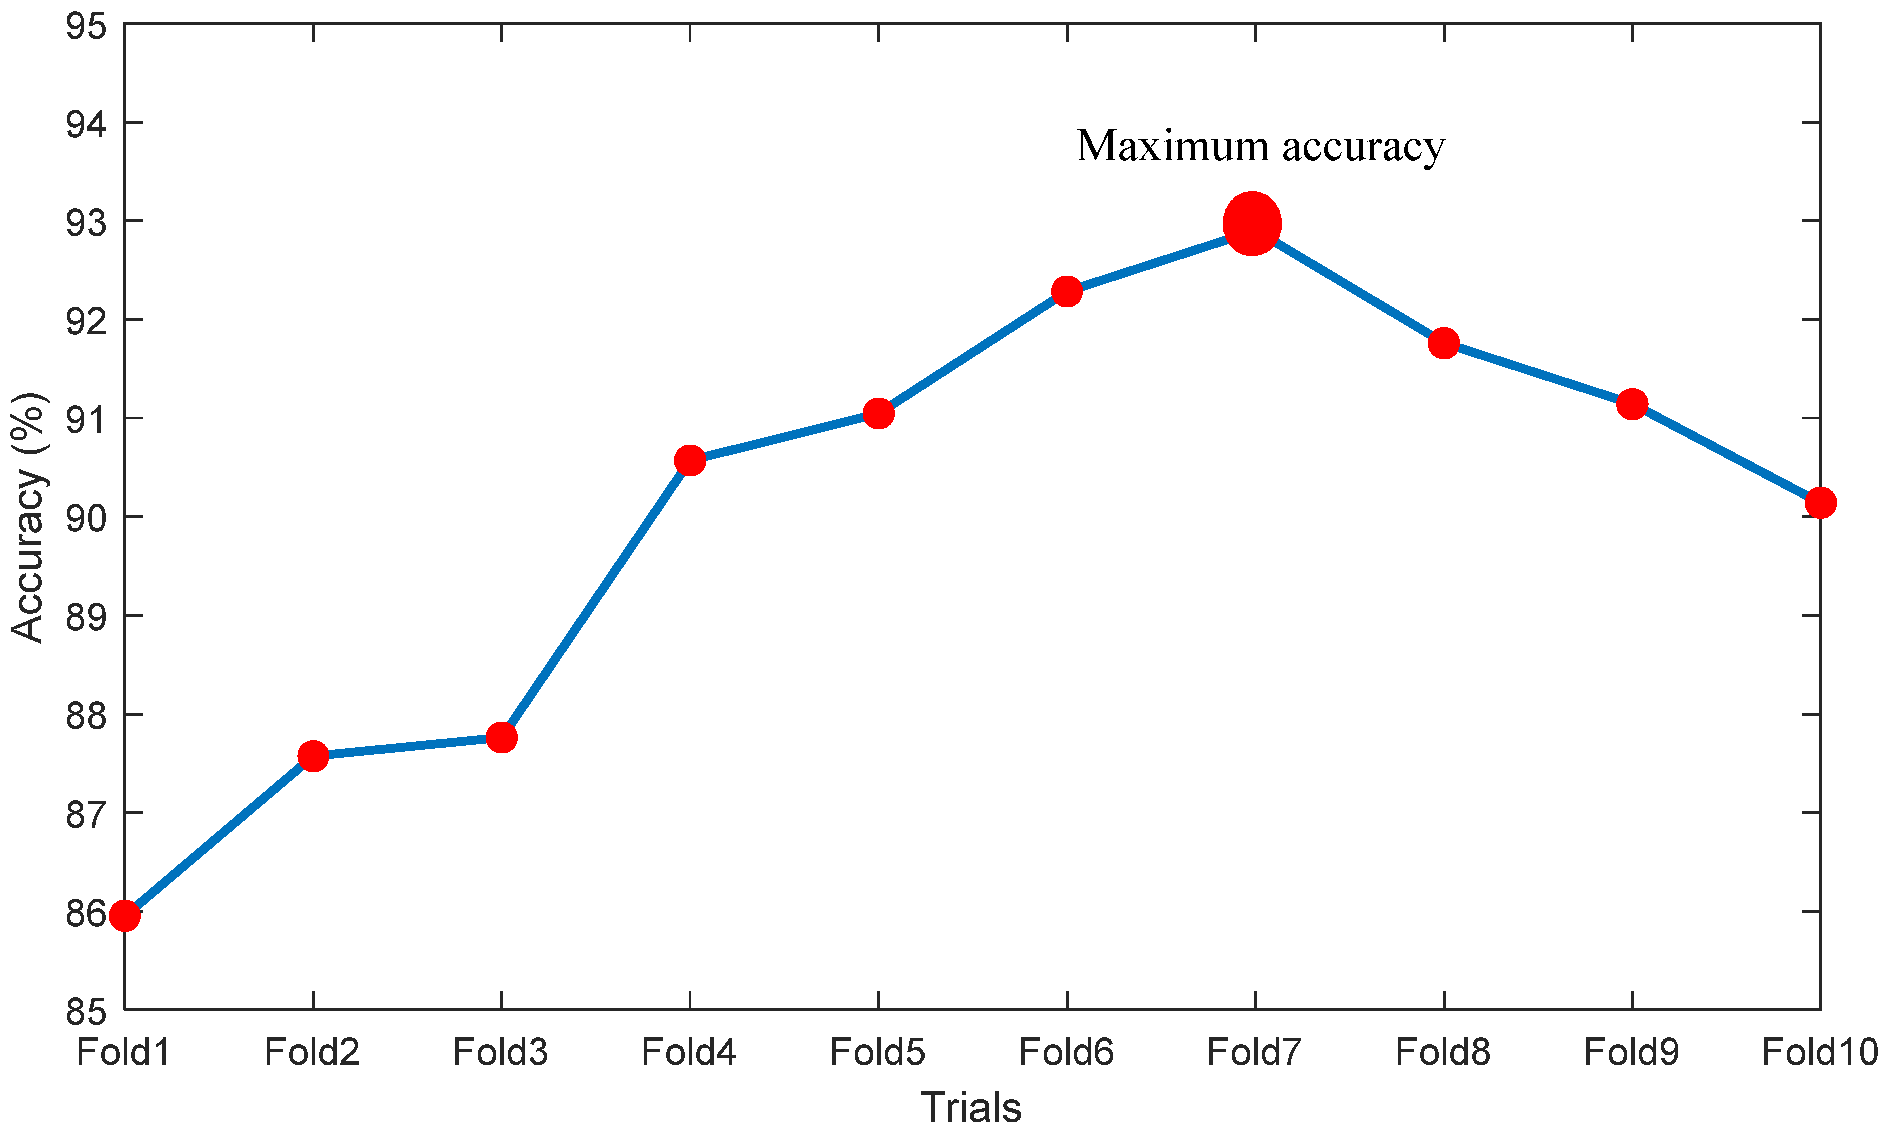
| Trials | TP | FN | TN | FP | ACC% | PRE% | SEN% | SPE% | NPV% |
|---|---|---|---|---|---|---|---|---|---|
| Fold1 | 892 | 158 | 913 | 137 | 85.9524 | 86.6861 | 84.9524 | 86.9524 | 85.2474 |
| Fold2 | 907 | 143 | 932 | 118 | 87.5714 | 88.4878 | 86.3810 | 88.7619 | 86.6977 |
| Fold3 | 904 | 146 | 939 | 111 | 87.7619 | 89.0640 | 86.0952 | 89.4286 | 86.5438 |
| Fold4 | 958 | 92 | 994 | 106 | 90.5714 | 90.0376 | 91.2381 | 89.9048 | 91.1197 |
| Fold5 | 964 | 86 | 948 | 102 | 91.0476 | 90.4315 | 91.8095 | 90.2857 | 91.6828 |
| Fold6 | 973 | 77 | 965 | 85 | 92.2857 | 91.9660 | 92.6667 | 91.9048 | 92.6104 |
| Fold7 | 979 | 71 | 972 | 78 | 92.9048 | 92.6206 | 93.2381 | 92.5714 | 93.1927 |
| Fold8 | 961 | 89 | 966 | 84 | 91.7619 | 91.9617 | 91.5238 | 92.0000 | 91.5640 |
| Fold9 | 954 | 96 | 960 | 90 | 91.1429 | 91.3793 | 90.8571 | 91.4286 | 90.9091 |
| Fold10 | 942 | 108 | 951 | 99 | 90.1429 | 90.4899 | 89.7143 | 90.5714 | 89.8017 |
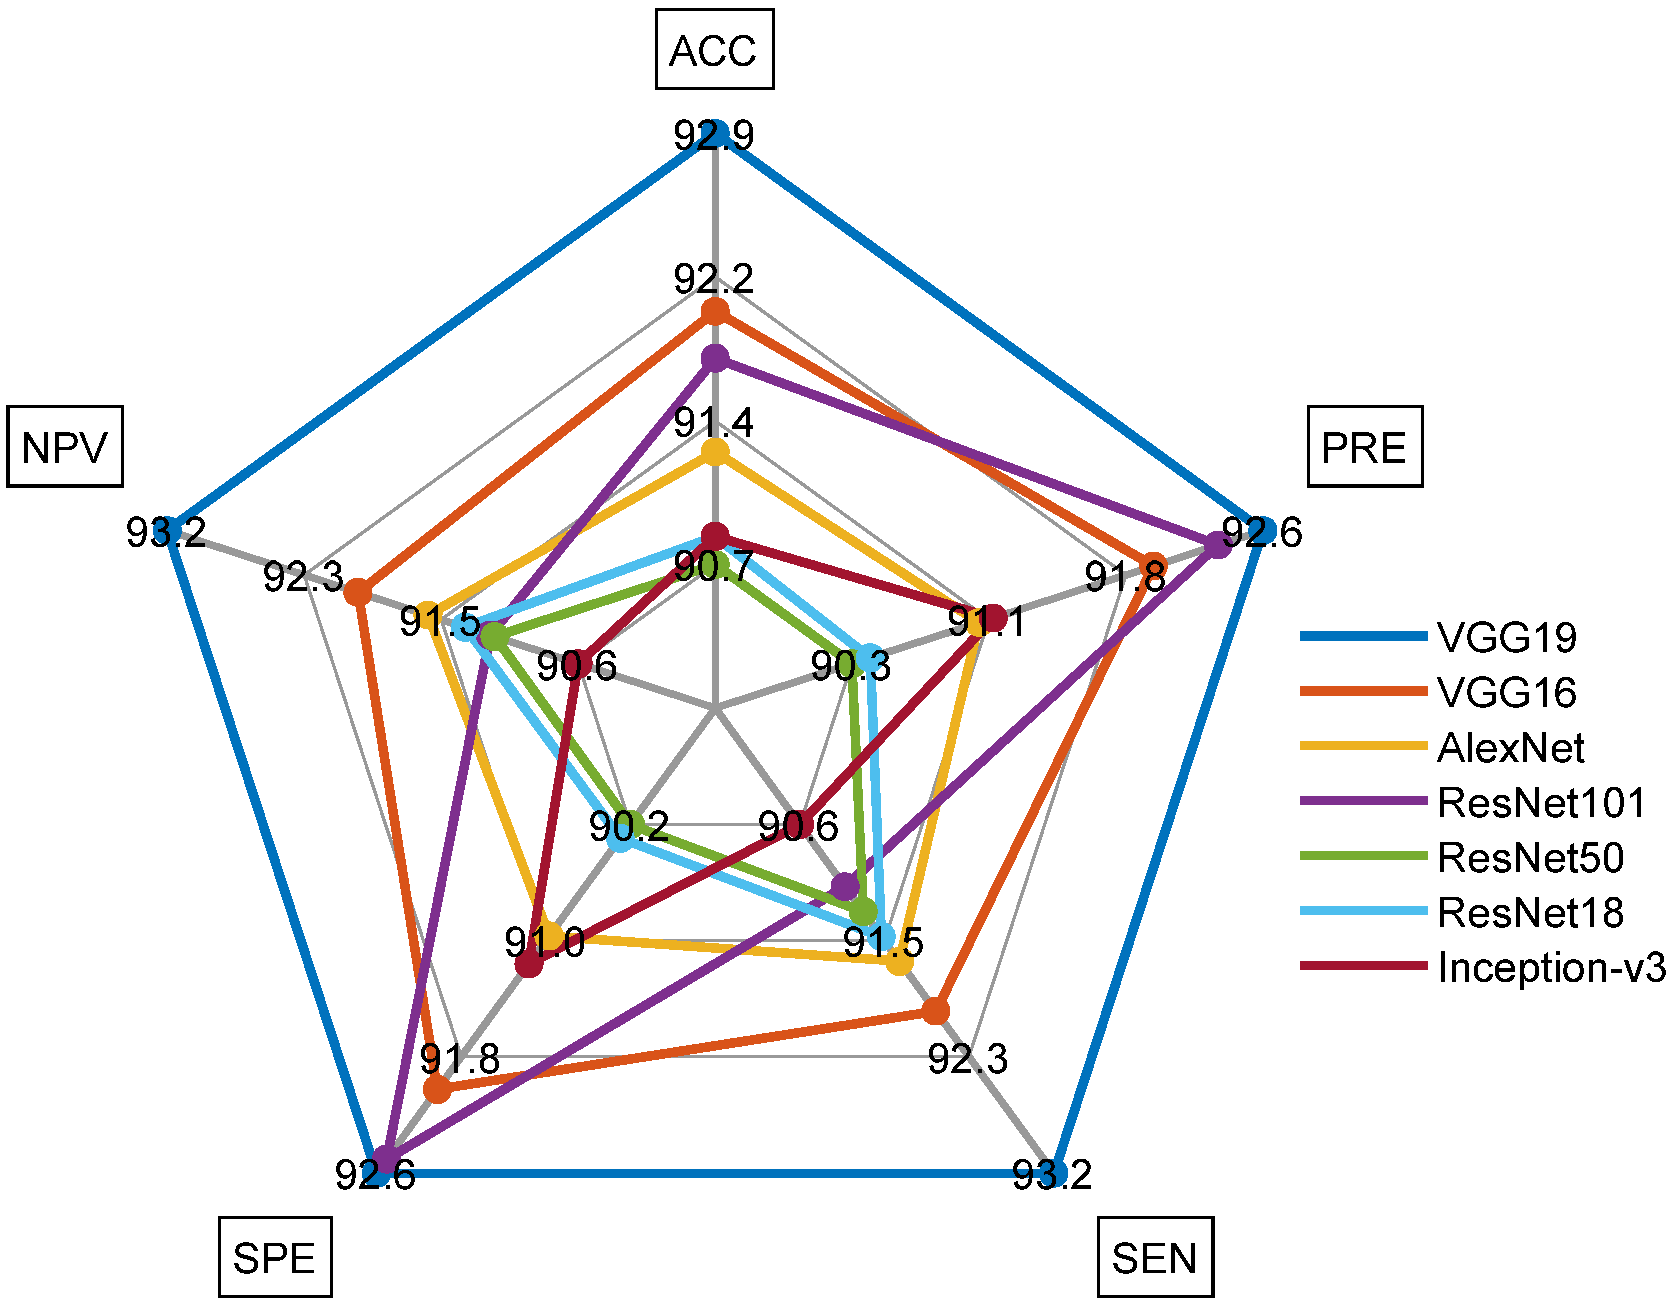
| Scheme | TP | FN | TN | FP | ACC% | PRE% | SEN% | SPE% | NPV% |
|---|---|---|---|---|---|---|---|---|---|
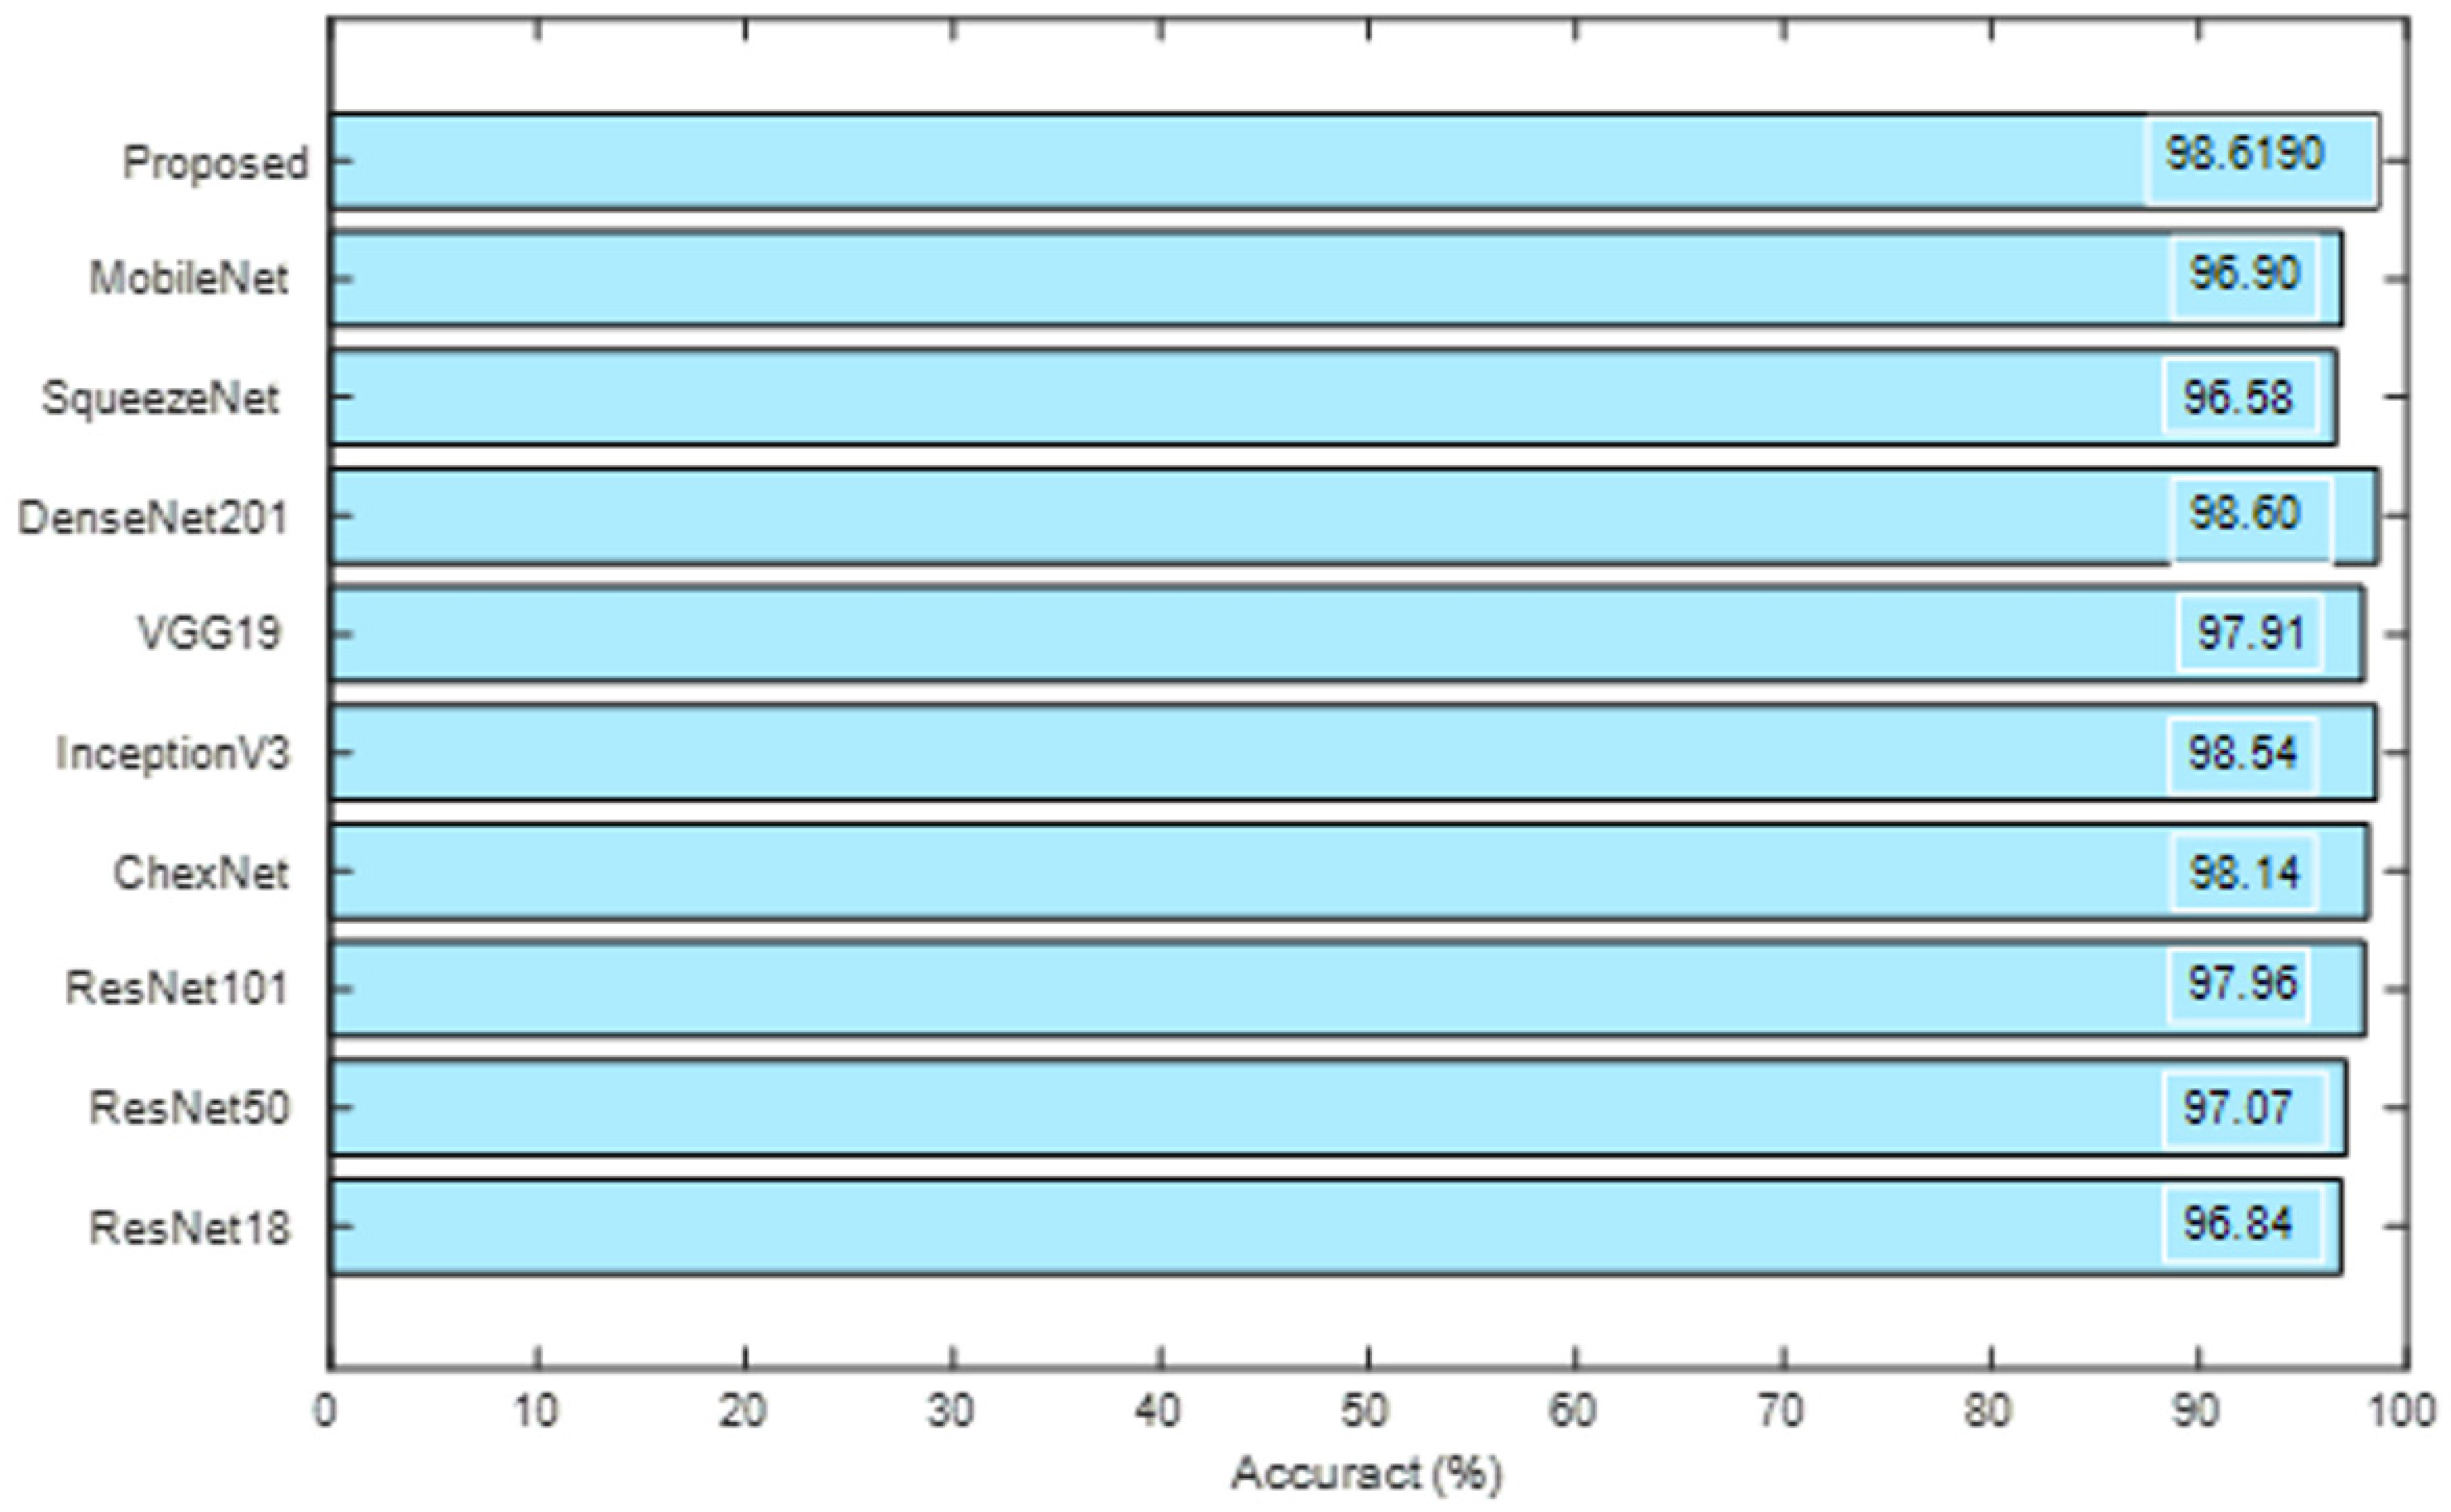
| VGG19 | 979 | 71 | 972 | 78 | 92.9048 | 92.6206 | 93.2381 | 92.5714 | 93.1927 |
| VGG16 | 966 | 84 | 966 | 84 | 92.0000 | 92.0000 | 92.0000 | 92.0000 | 92.0000 |
| AlexNet | 962 | 88 | 955 | 95 | 91.2857 | 91.0123 | 91.6190 | 90.9524 | 91.5628 |
| ResNet101 | 956 | 94 | 971 | 79 | 91.7619 | 92.3671 | 91.0476 | 92.4762 | 91.1737 |
| ResNet50 | 958 | 92 | 947 | 103 | 90.7143 | 90.2922 | 91.2381 | 90.1905 | 91.1453 |
| ResNet18 | 960 | 90 | 948 | 102 | 90.8571 | 90.3955 | 91.4286 | 90.2857 | 91.3295 |
| Inception-v3 | 951 | 99 | 957 | 93 | 90.8571 | 91.0920 | 90.5714 | 91.1429 | 90.6250 |
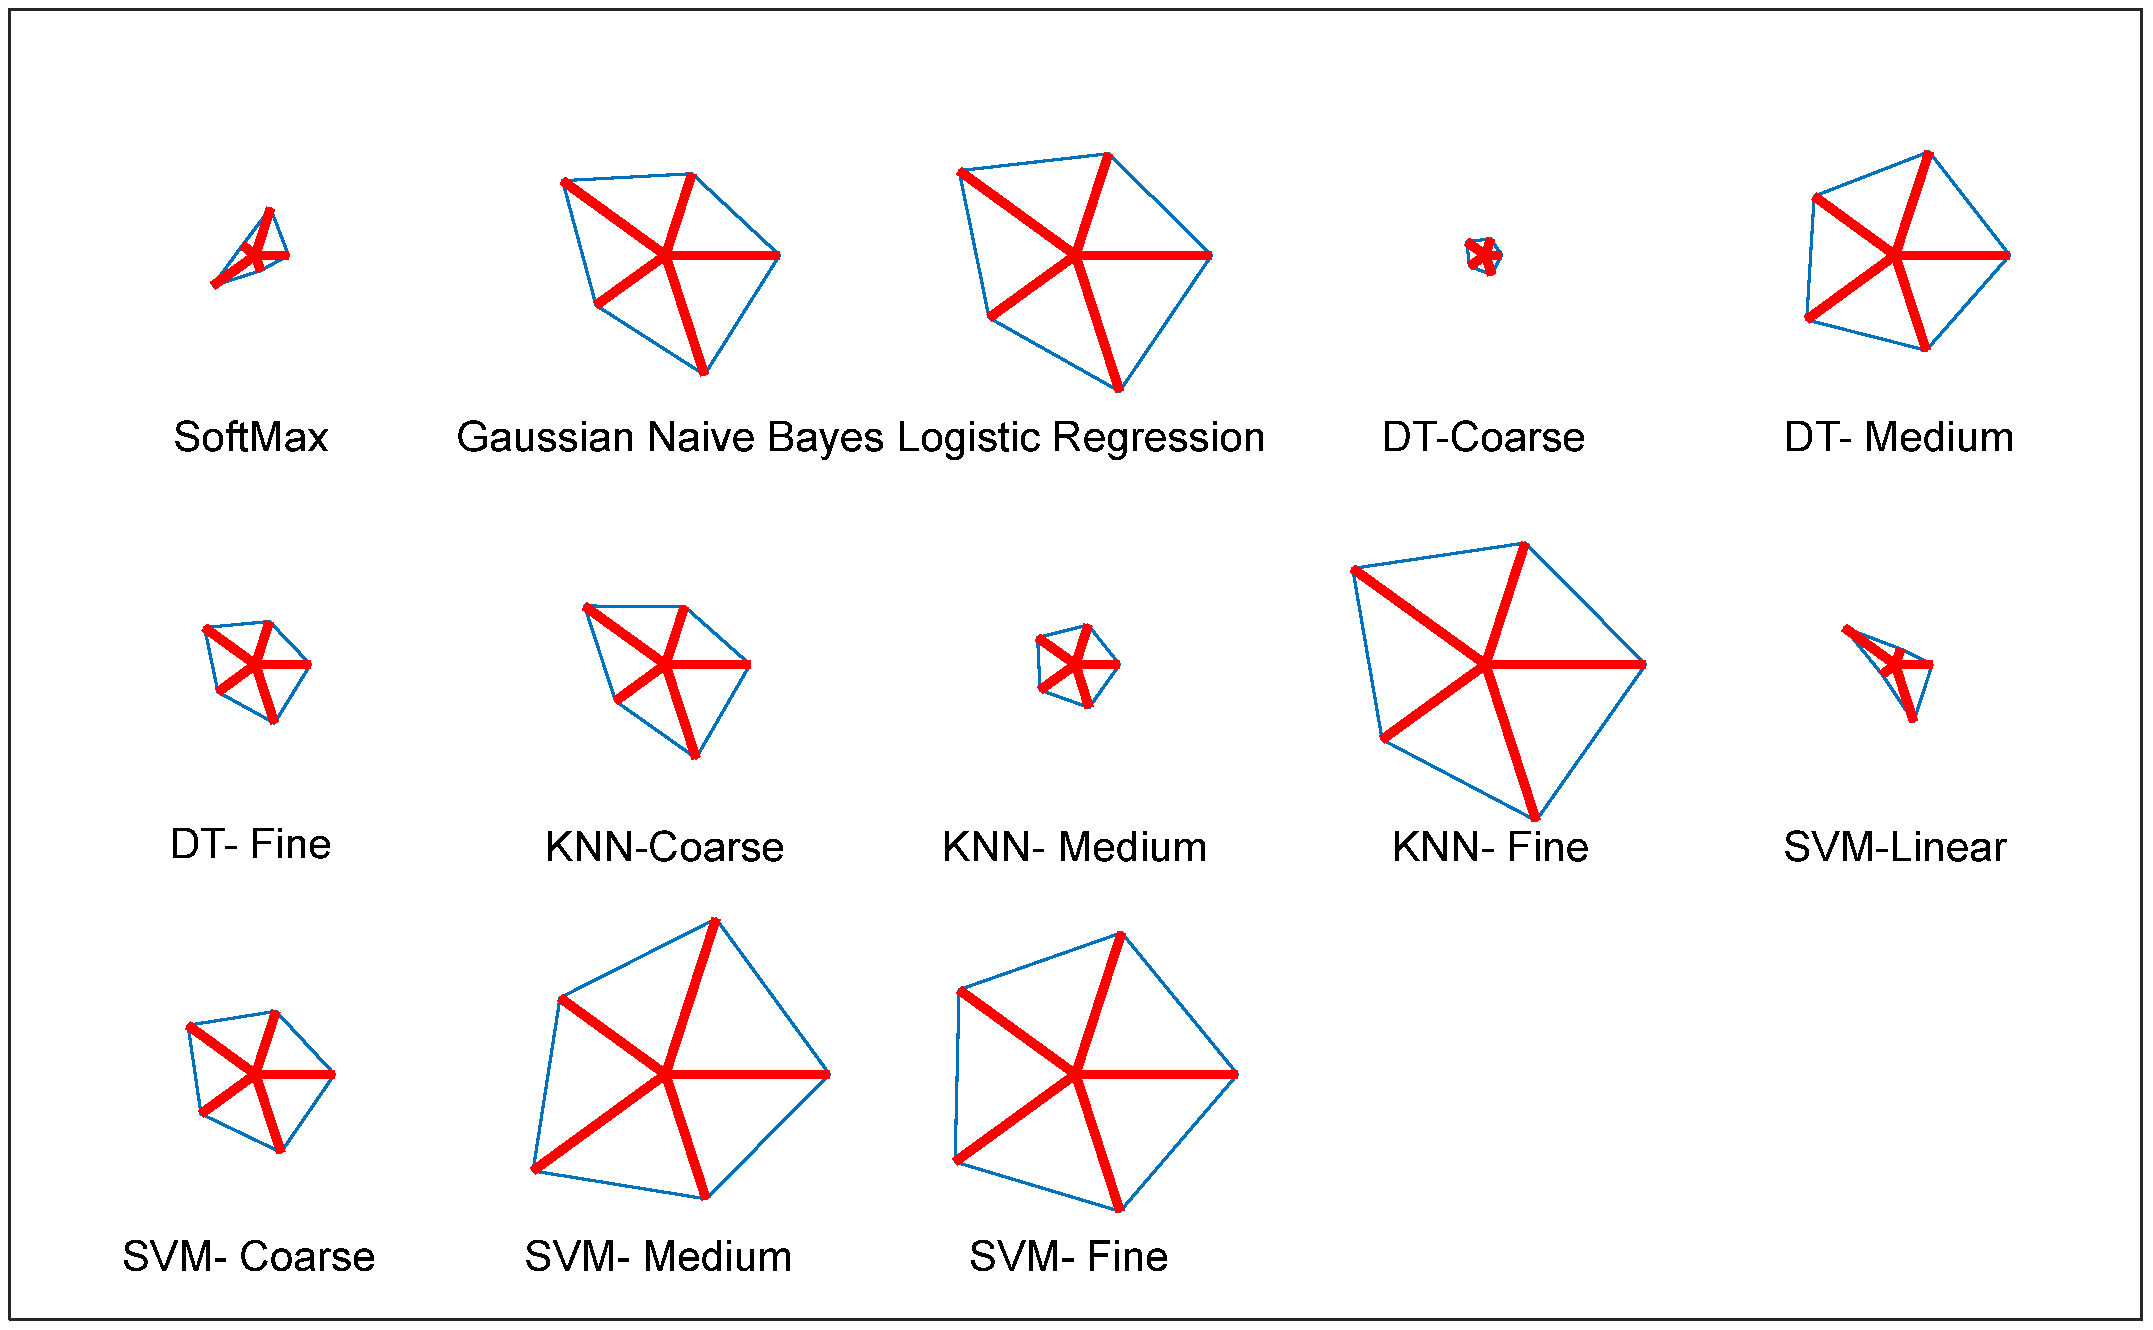
| Feature | Classifier | TP | FN | TN | FP | ACC% | PRE% | SEN% | SPE% | NPV% |
|---|---|---|---|---|---|---|---|---|---|---|
| DLF | SoftMax | 973 | 77 | 978 | 72 | 92.9048 | 93.1100 | 92.6667 | 93.1429 | 92.7014 |
| Gaussian Naive Bayes | 975 | 75 | 980 | 70 | 93.0952 | 93.3014 | 92.8571 | 93.3333 | 92.8910 | |
| Logistic Regression | 976 | 74 | 976 | 74 | 92.9524 | 92.9524 | 92.9524 | 92.9524 | 92.9524 | |
| DT-Coarse | 982 | 68 | 979 | 71 | 93.3810 | 93.2574 | 93.5238 | 93.2381 | 93.5053 | |
| DT-Medium | 981 | 69 | 983 | 67 | 93.5238 | 93.6069 | 93.4286 | 93.6190 | 93.4411 | |
| DT-Fine | 978 | 72 | 980 | 70 | 93.2381 | 93.3206 | 93.1429 | 93.3333 | 93.1559 | |
| KNN-Coarse | 981 | 69 | 986 | 64 | 93.6667 | 93.8756 | 93.4286 | 93.9048 | 93.4597 | |
| KNN-Medium | 974 | 76 | 979 | 71 | 93.0000 | 93.2057 | 92.7619 | 93.2381 | 92.7962 | |
| KNN-Fine | 977 | 73 | 982 | 68 | 93.2857 | 93.4928 | 93.0476 | 93.5238 | 93.0806 | |
| SVM-Linear | 982 | 68 | 977 | 73 | 93.2857 | 93.0806 | 93.5238 | 93.0476 | 93.4928 | |
| SVM-Coarse Gaussian | 980 | 70 | 983 | 67 | 93.4762 | 93.6008 | 93.3333 | 93.6190 | 93.3523 | |
| SVM-Medium Gaussian | 979 | 71 | 977 | 73 | 93.1429 | 93.0608 | 93.2381 | 93.0476 | 93.2252 | |
| SVM-Fine Gaussian | 982 | 68 | 981 | 69 | 93.4762 | 93.4348 | 93.5238 | 93.4286 | 93.5176 | |
| MLF | SoftMax | 841 | 209 | 864 | 186 | 81.1905 | 81.8890 | 80.0952 | 82.2857 | 80.5219 |
| Gaussian Naive Bayes | 853 | 197 | 848 | 202 | 81.0000 | 80.8531 | 81.2381 | 80.7619 | 81.1483 | |
| Logistic Regression | 856 | 194 | 851 | 199 | 81.2857 | 81.1374 | 81.5238 | 81.0476 | 81.4354 | |
| DT-Coarse | 849 | 201 | 862 | 188 | 81.4762 | 81.8708 | 80.8571 | 82.0952 | 81.0913 | |
| DT-Medium | 853 | 197 | 859 | 191 | 81.5238 | 81.7050 | 81.2381 | 81.8095 | 81.3447 | |
| DT-Fine | 863 | 187 | 861 | 189 | 82.0952 | 82.0342 | 82.1905 | 82.0000 | 82.1565 | |
| KNN-Coarse | 865 | 185 | 852 | 198 | 81.7619 | 81.3735 | 82.3810 | 81.1429 | 82.1601 | |
| KNN-Medium | 862 | 188 | 861 | 189 | 82.0476 | 82.0171 | 82.0952 | 82.0000 | 82.0782 | |
| KNN-Fine | 857 | 193 | 864 | 186 | 81.9524 | 82.1668 | 81.6190 | 82.2857 | 81.7408 | |
| SVM-Linear | 853 | 197 | 863 | 187 | 81.7143 | 82.0192 | 81.2381 | 82.1905 | 81.4151 | |
| SVM-Coarse Gaussian | 858 | 192 | 862 | 188 | 81.9048 | 82.0268 | 81.7143 | 82.0952 | 81.7837 | |
| SVM-Medium Gaussian | 861 | 189 | 864 | 186 | 82.1429 | 82.2350 | 82.0000 | 82.2857 | 82.0513 | |
| SVM-Fine Gaussian | 864 | 186 | 862 | 188 | 82.1905 | 82.1293 | 82.2857 | 82.0952 | 82.2519 |
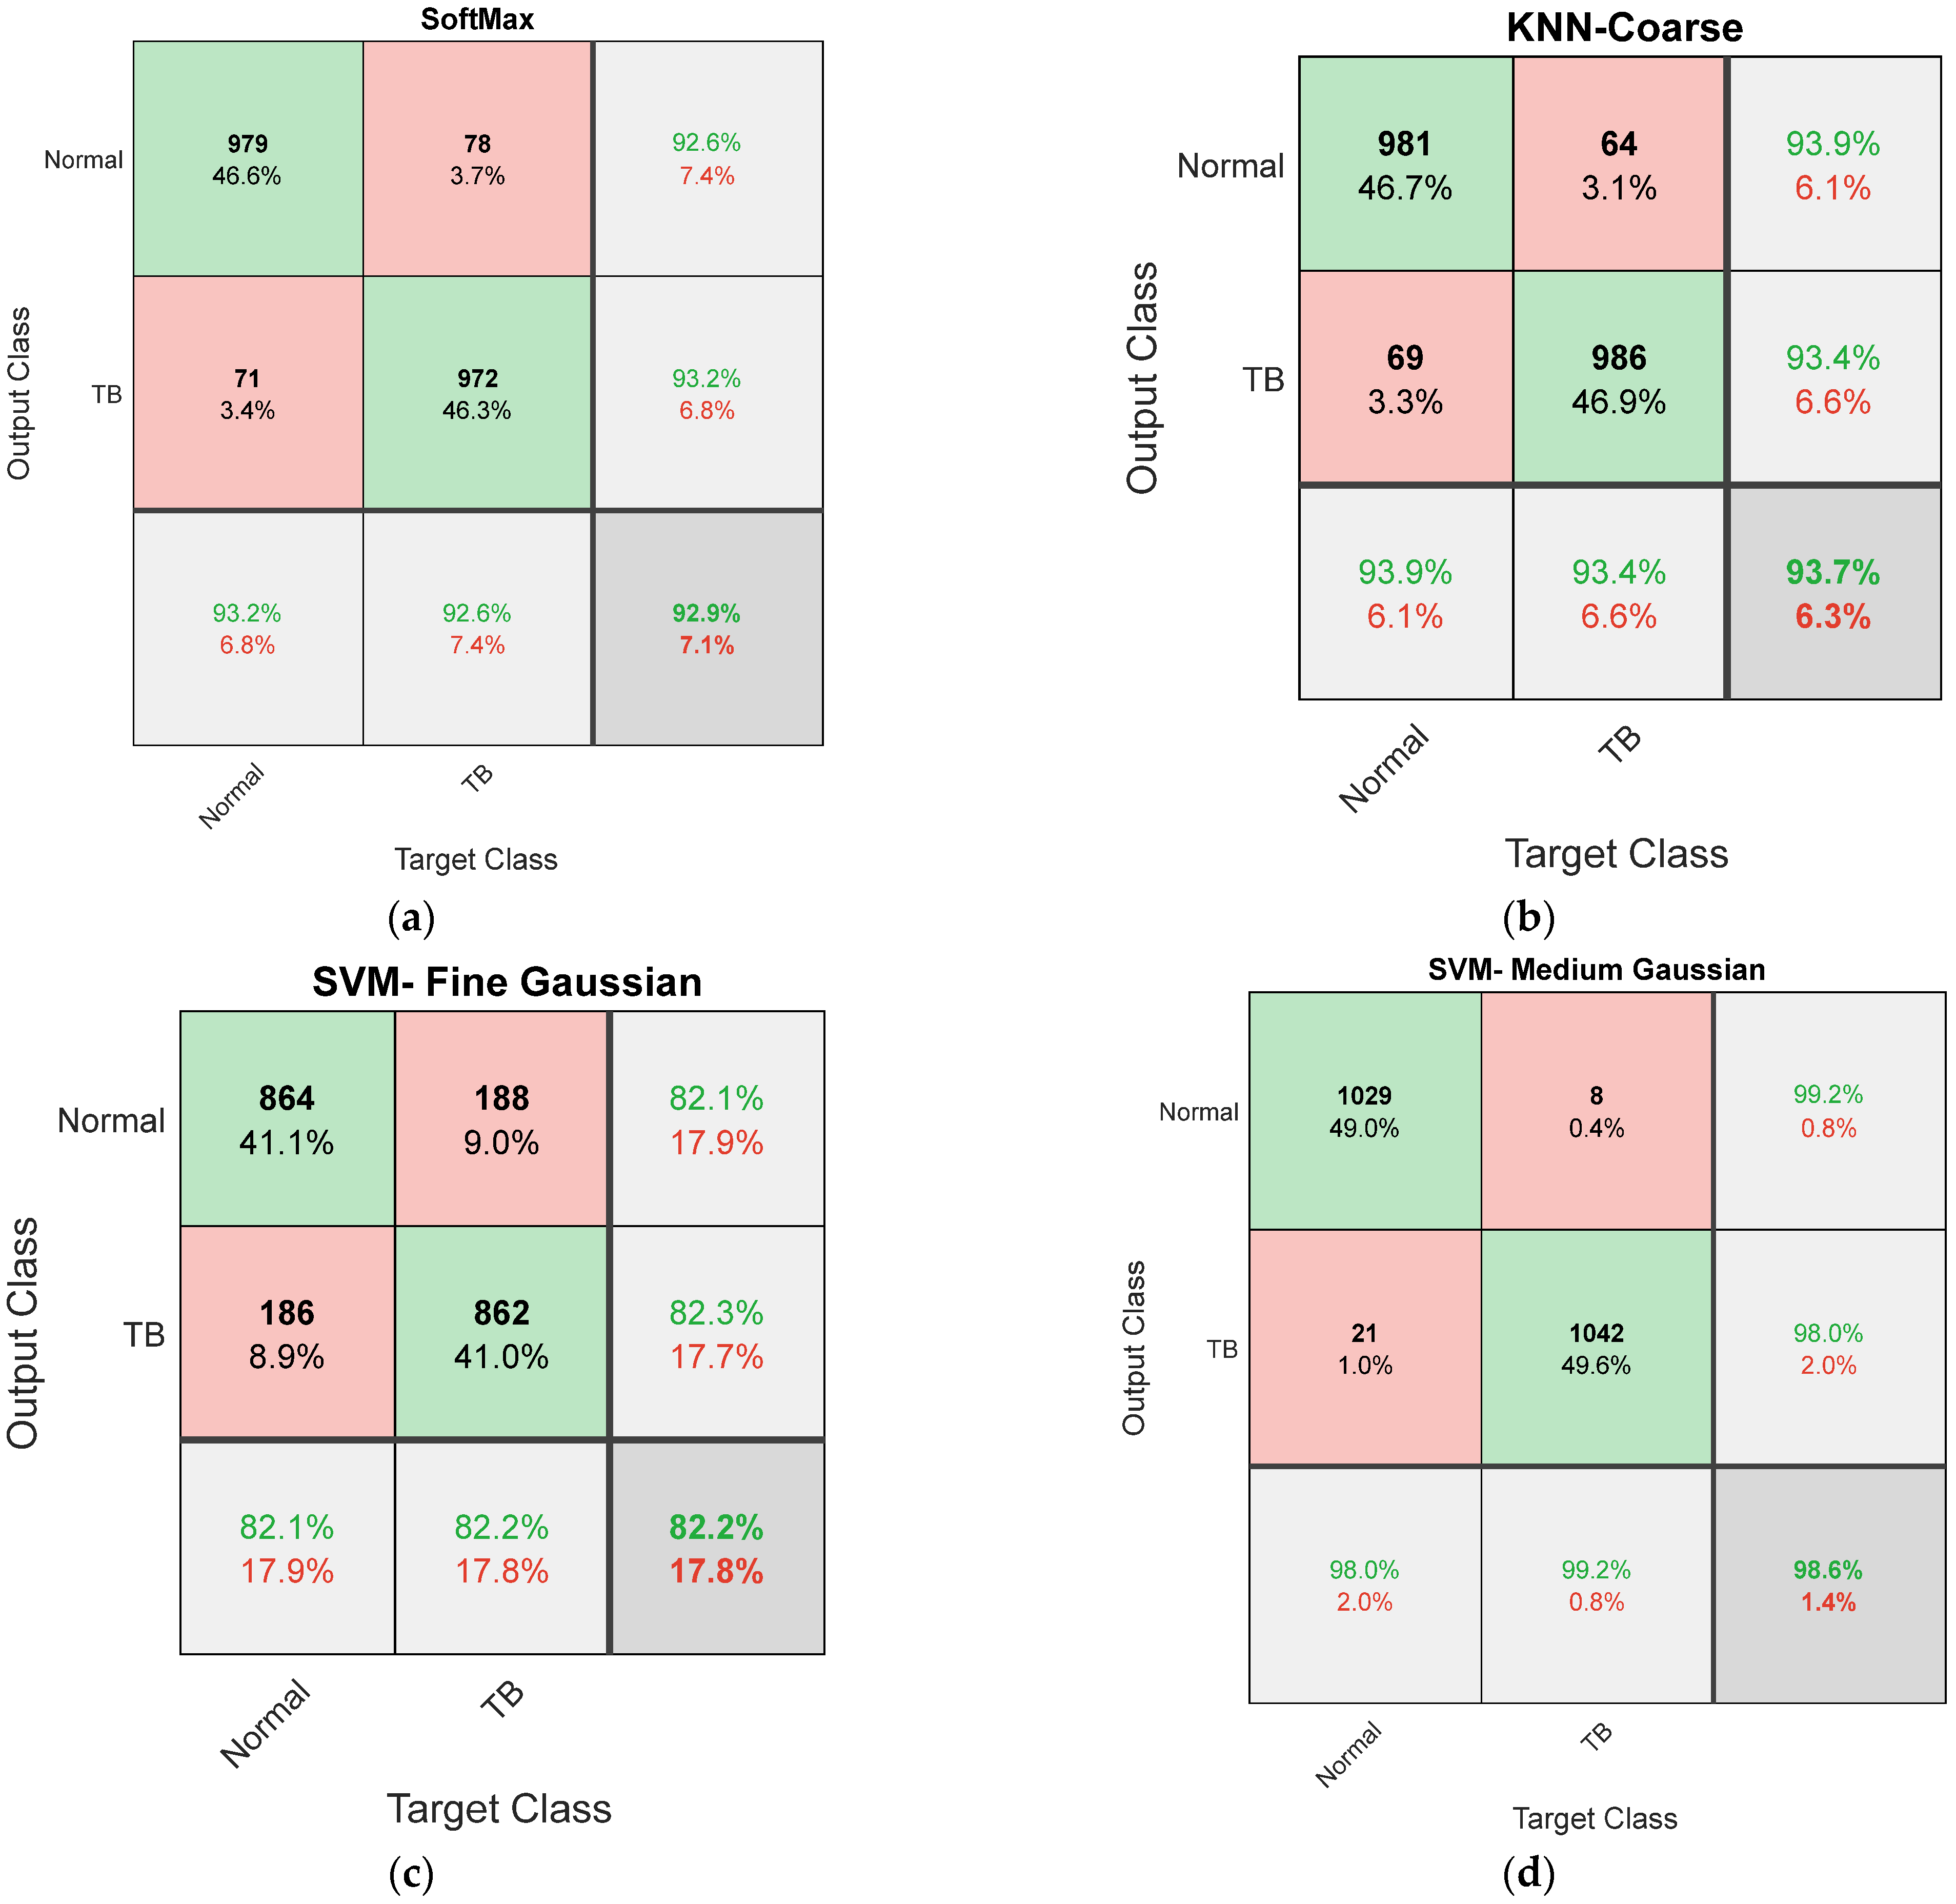
| Classifier | TP | FN | TN | FP | ACC% | PRE% | SEN% | SPE% | NPV% |
|---|---|---|---|---|---|---|---|---|---|
| SoftMax | 993 | 57 | 1004 | 46 | 95.0952 | 95.5727 | 94.5714 | 95.6190 | 94.6277 |
| Gaussian Naive Bayes | 1026 | 24 | 1015 | 35 | 97.1905 | 96.7012 | 97.7143 | 96.6667 | 97.6901 |
| Logistic Regression | 1031 | 19 | 1022 | 28 | 97.7619 | 97.3560 | 98.1905 | 97.3333 | 98.1748 |
| DT-Coarse | 995 | 55 | 993 | 57 | 94.6667 | 94.5817 | 94.7619 | 94.5714 | 94.7519 |
| DT-Medium | 1018 | 32 | 1023 | 27 | 97.1905 | 97.4163 | 96.9524 | 97.4286 | 96.9668 |
| DT-Fine | 1007 | 43 | 1002 | 48 | 95.6667 | 95.4502 | 95.9048 | 95.4286 | 95.8852 |
| KNN-Coarse | 1018 | 32 | 1007 | 43 | 96.4286 | 95.9472 | 96.9524 | 95.9048 | 96.9201 |
| KNN-Medium | 1002 | 48 | 1001 | 49 | 95.3810 | 95.3378 | 95.4286 | 95.3333 | 95.4242 |
| KNN-Fine | 1037 | 13 | 1029 | 21 | 98.3810 | 98.0151 | 98.7619 | 98.0000 | 98.7524 |
| SVM-Linear | 1007 | 43 | 992 | 58 | 95.1905 | 94.5540 | 95.9048 | 94.4762 | 95.8454 |
| SVM-Coarse Gaussian | 1013 | 37 | 1009 | 41 | 96.2857 | 96.1101 | 96.4762 | 96.0952 | 96.4627 |
| SVM-Medium Gaussian | 1029 | 21 | 1042 | 8 | 98.6190 | 99.2285 | 98.0000 | 99.2381 | 98.0245 |
| SVM-Fine Gaussian | 1031 | 19 | 1036 | 14 | 98.4286 | 98.6603 | 98.1905 | 98.6667 | 98.1991 |
Publisher’s Note: MDPI stays neutral with regard to jurisdictional claims in published maps and institutional affiliations. |
© 2022 by the authors. Licensee MDPI, Basel, Switzerland. This article is an open access article distributed under the terms and conditions of the Creative Commons Attribution (CC BY) license (https://creativecommons.org/licenses/by/4.0/).
Share and Cite
Mohan, R.; Kadry, S.; Rajinikanth, V.; Majumdar, A.; Thinnukool, O. Automatic Detection of Tuberculosis Using VGG19 with Seagull-Algorithm. Life 2022, 12, 1848. https://doi.org/10.3390/life12111848
Mohan R, Kadry S, Rajinikanth V, Majumdar A, Thinnukool O. Automatic Detection of Tuberculosis Using VGG19 with Seagull-Algorithm. Life. 2022; 12(11):1848. https://doi.org/10.3390/life12111848
Chicago/Turabian StyleMohan, Ramya, Seifedine Kadry, Venkatesan Rajinikanth, Arnab Majumdar, and Orawit Thinnukool. 2022. "Automatic Detection of Tuberculosis Using VGG19 with Seagull-Algorithm" Life 12, no. 11: 1848. https://doi.org/10.3390/life12111848
APA StyleMohan, R., Kadry, S., Rajinikanth, V., Majumdar, A., & Thinnukool, O. (2022). Automatic Detection of Tuberculosis Using VGG19 with Seagull-Algorithm. Life, 12(11), 1848. https://doi.org/10.3390/life12111848