


A Deep Learning Framework for Automatic Sleep Apnea Classification Based on Empirical Mode Decomposition Derived from Single-Lead Electrocardiogram


Abstract
:1. Introduction
- (1)
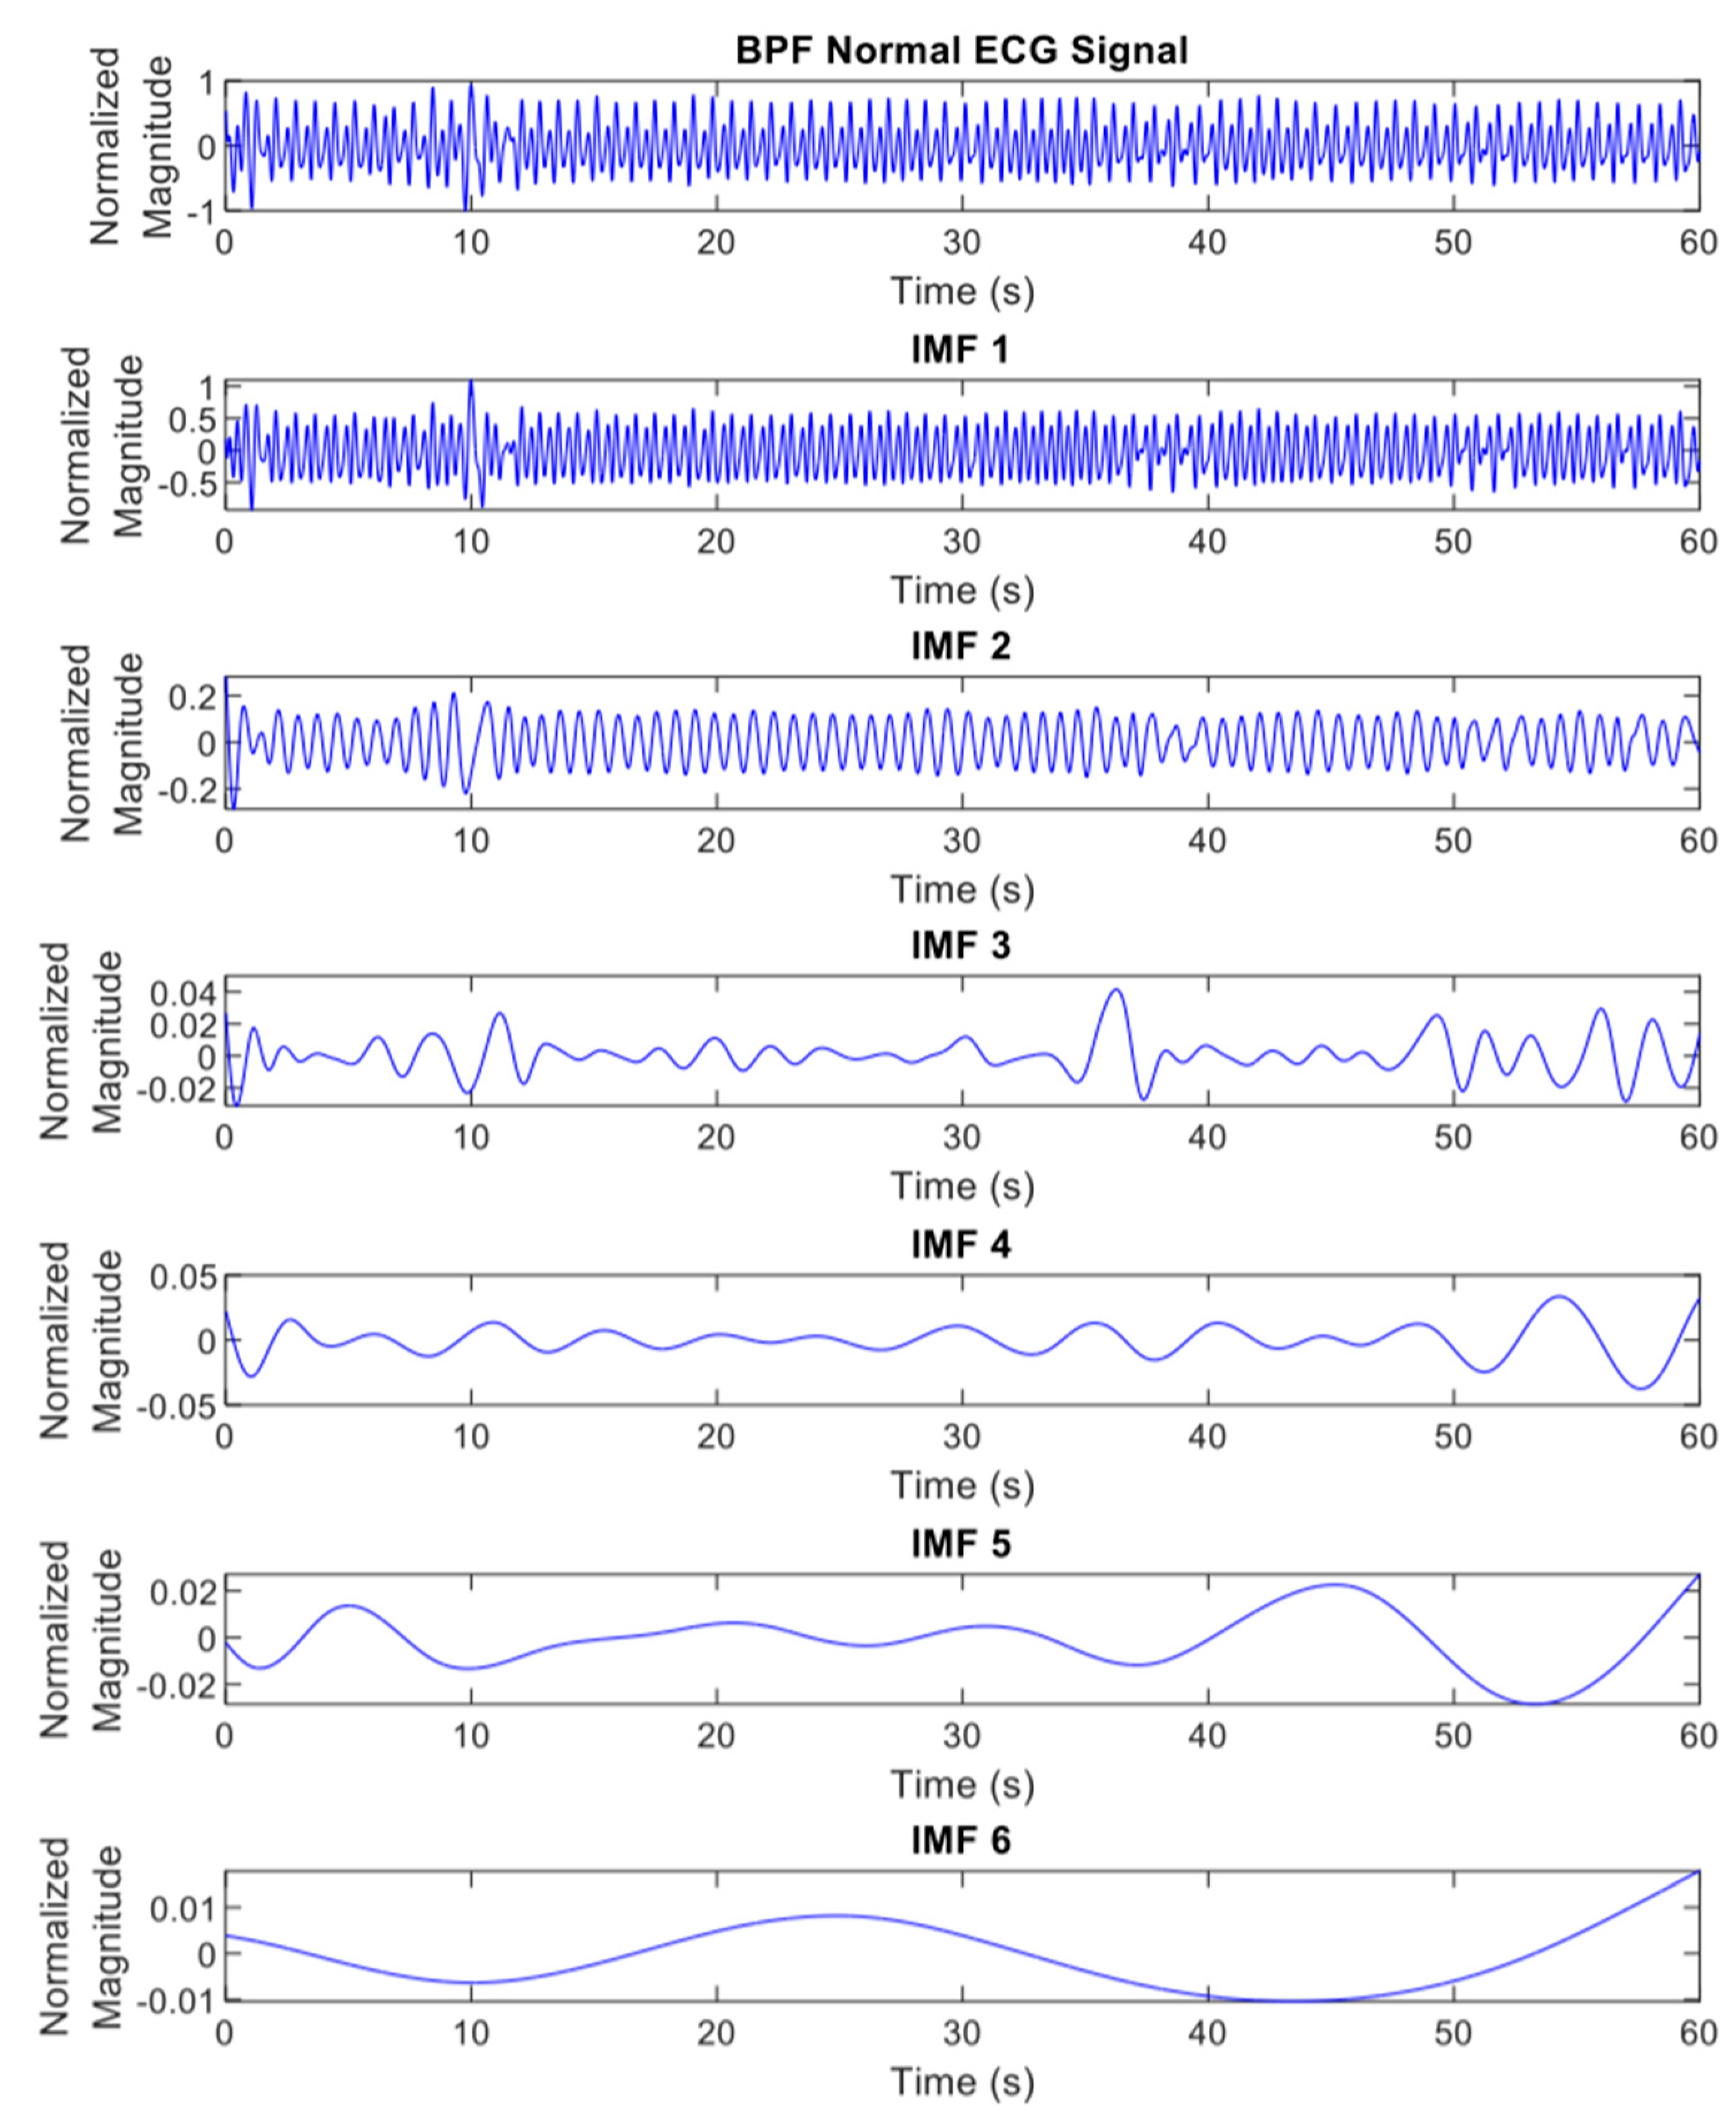
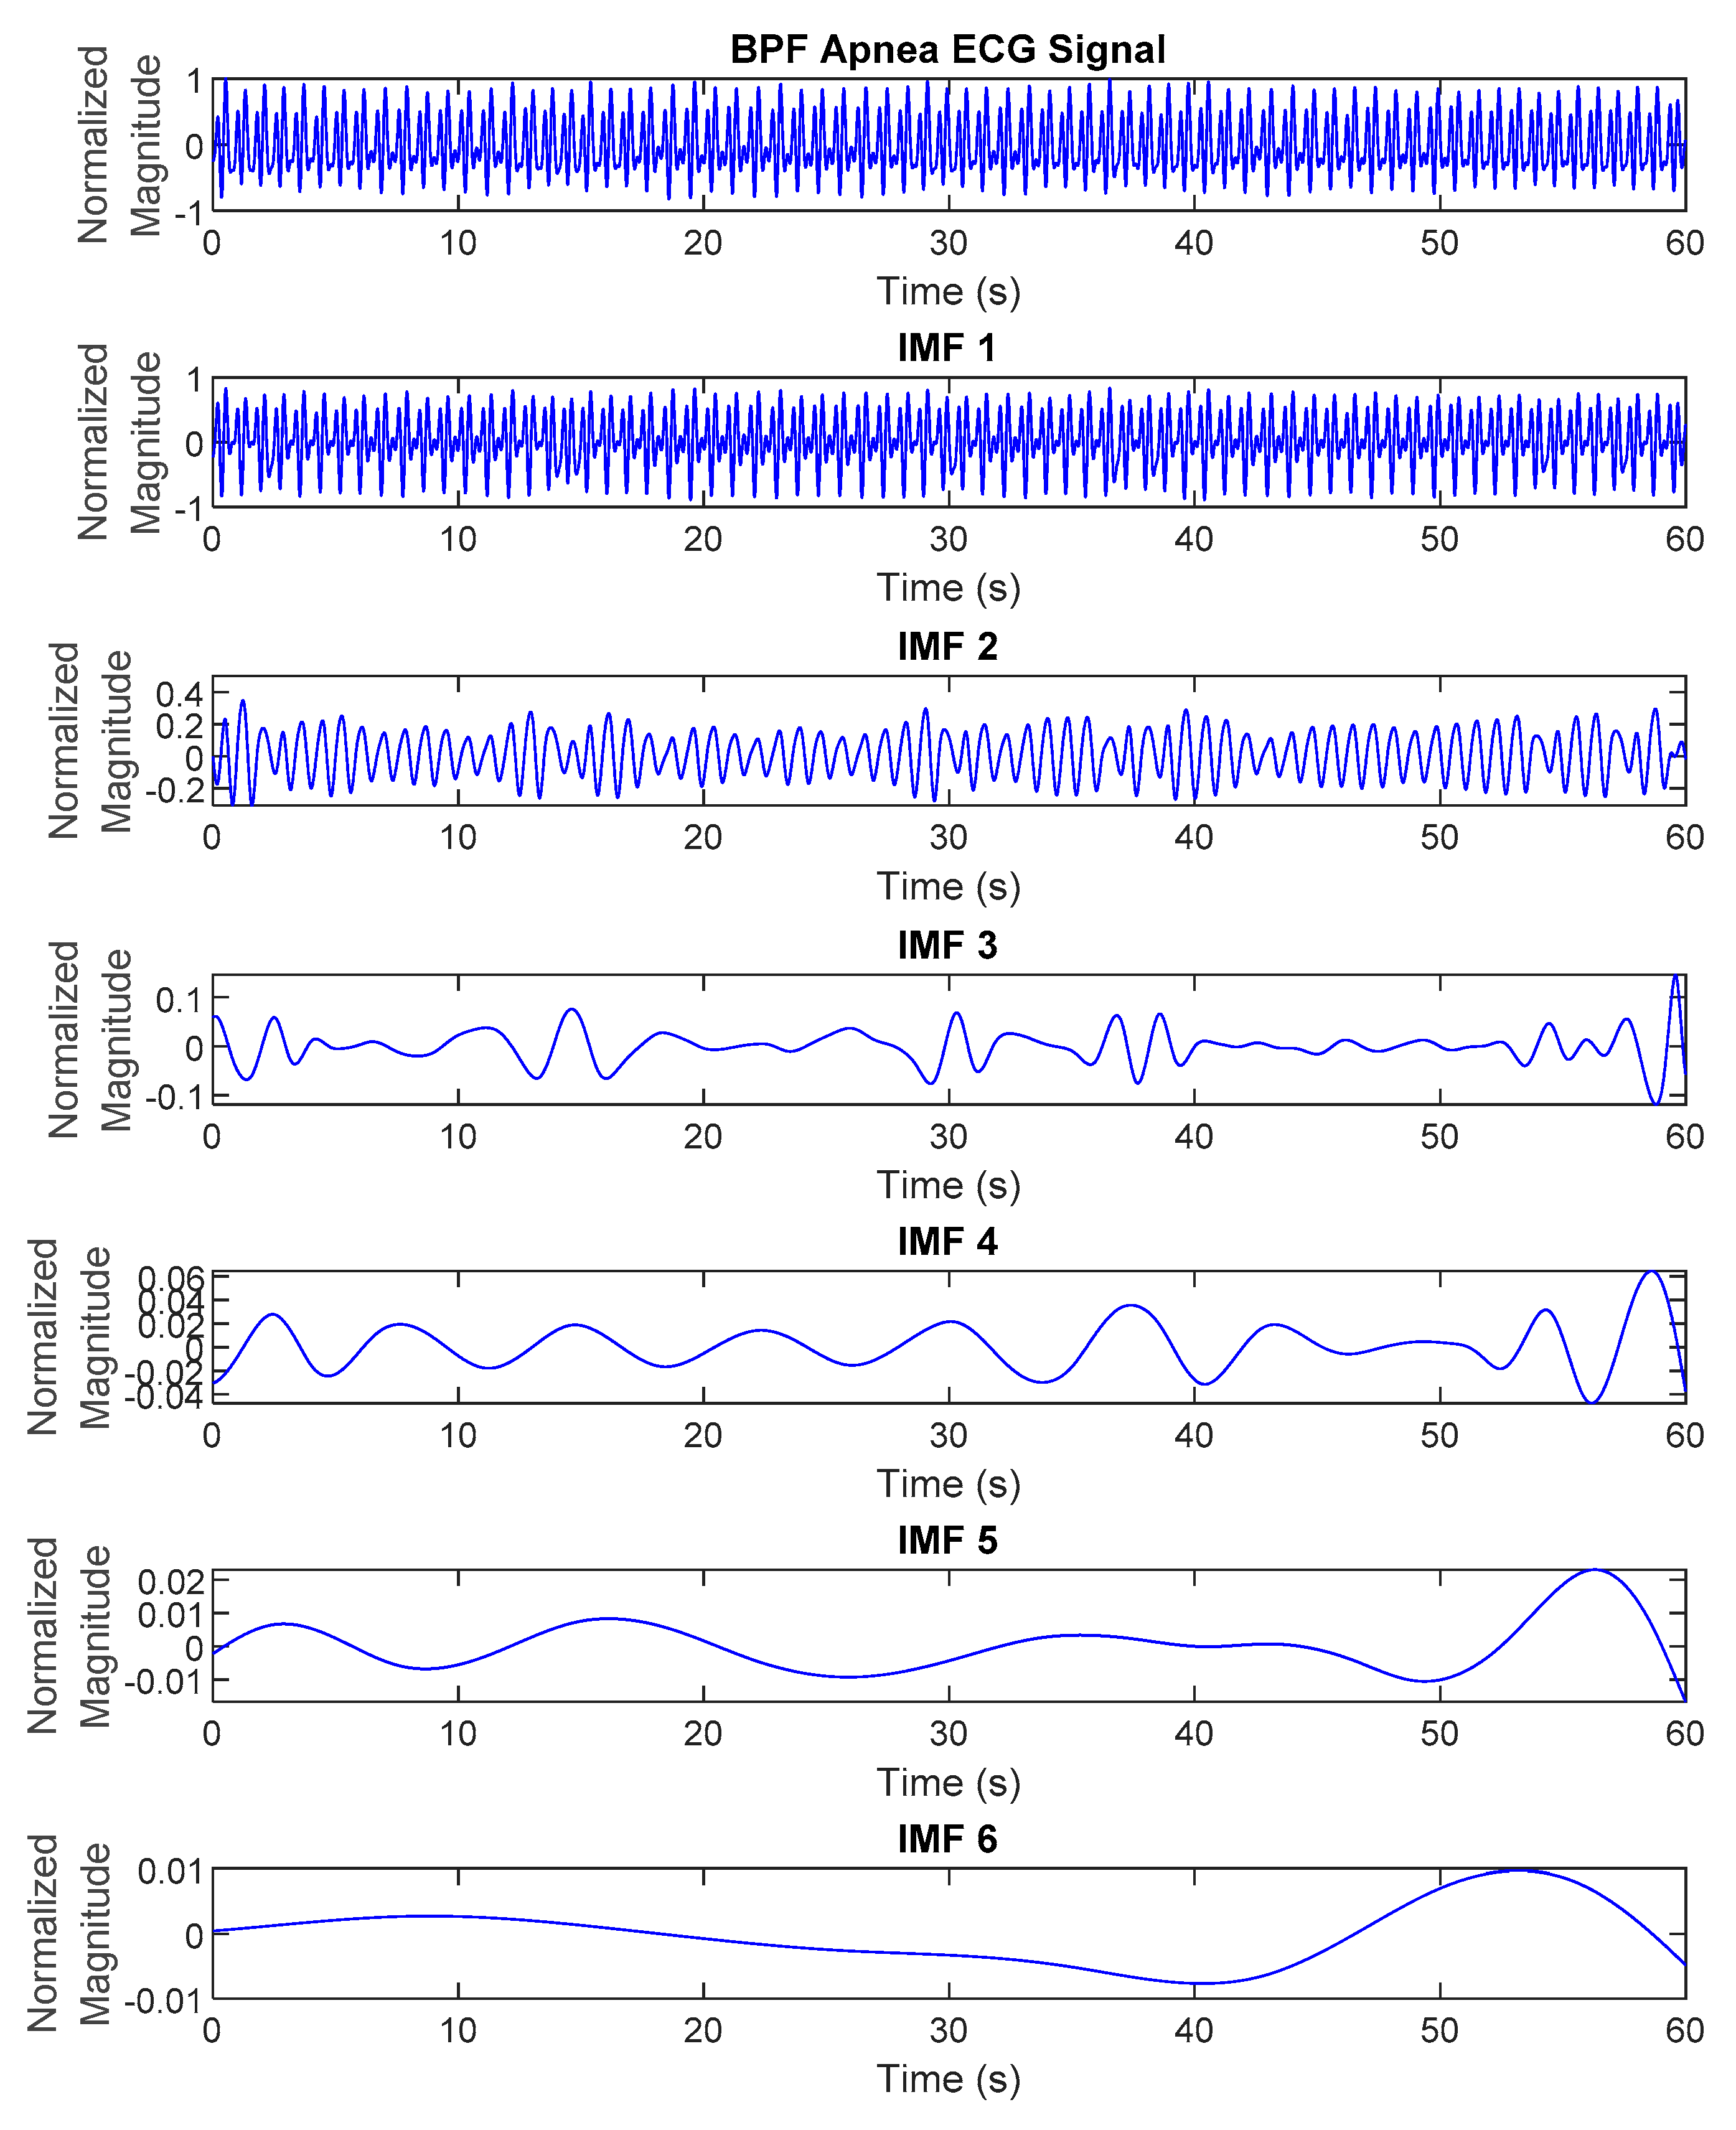
- The proposed method used EMD features generated from preprocessed overnight ECG signals to identify various symptoms of SA episodes. Due to external stimulation, biomedical signals are, in general, non-linear and non-stationary, thus EMD is ideally suited to extract essential components which are characteristic of the underlying biological or physiological processes.
- (2)
- The proposed deep learning framework can outperform SA classification state-of-the-art methods with potential for real-time and low-cost hardware implementation. The deep CNN models have a simple and compact architecture; moreover, they reduce the need for feature extraction.
- (3)
- The proposed method applied the synthetic minority oversampling technique (SMOTE) to overcome the imbalance problem. The comparison performance with other re-sampling methods is also discussed.
2. Materials and Methods
2.1. Overnight Apnea ECG Database
2.2. The Overall Deep Learning Framework for Automatic Sleep Apnea Classification Based on Empirical Mode Decomposition Derived from Single-Lead Electrocardiogram
2.3. ECG Signal Preprocessing and Filtering
2.4. Empirical Mode Decomposition (EMD)
- Correlate all the local maximum and minimum by applying a cubic spline to generate the upper and lower envelope.
- Specify the average of upper and lower envelopes, which is denoted as .
- Calculate the difference between the signal and the average , (potential first IMF).
- Verify if satisfies the two requirements of IMF:
- In the entire data set, the number of extremum and zero-crossings must be equal or differ by no more than one.
- The mean value of the envelope indicated by the local maximum and local minimum is zero at any point.
- 5.
- After subtracting the signal from the IMF, the sifting process is reiterated to break down the data into IMFs.
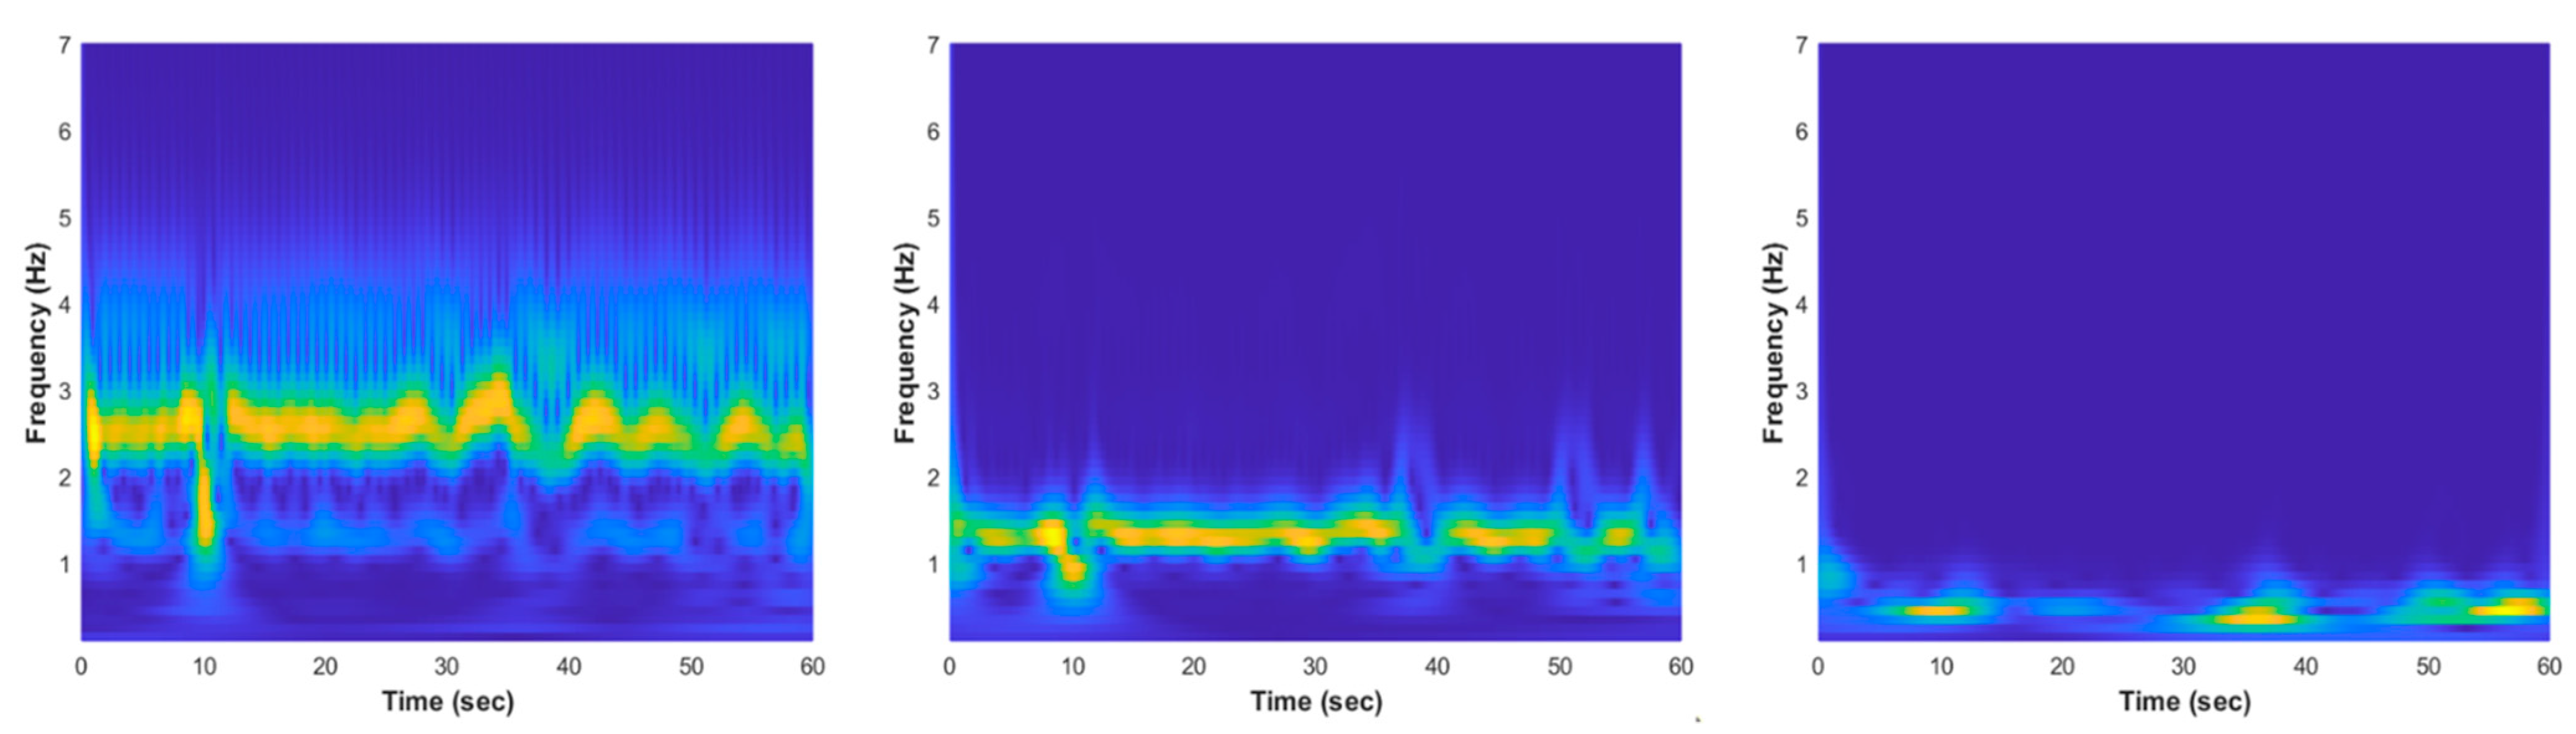
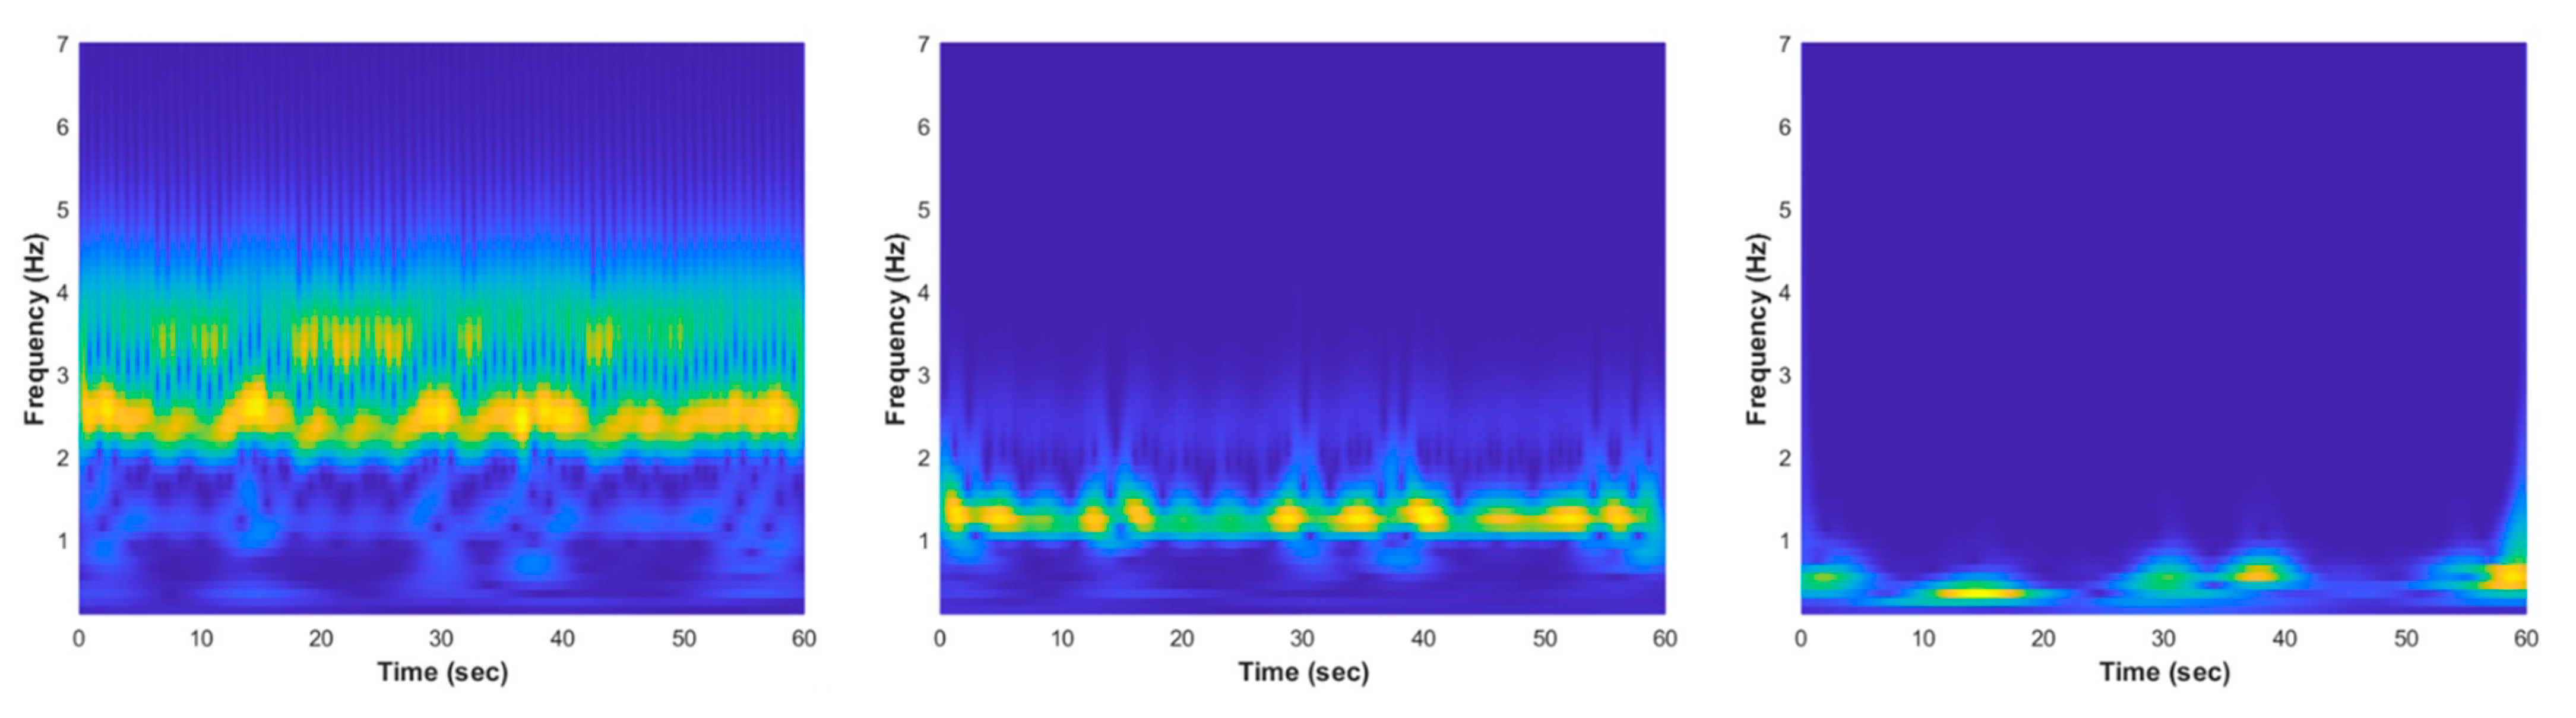
2.5. Feature Transformation Using Continuous Wavelet Transform (CWT)
2.6. Feature Selection Using Neighborhood Component Analysis (NCA)
- Data is divided into training and testing sets. The training data are then partitioned into 10-folds in which the classifier leaves out one-fold for testing and trained on the other nine folds.
- The regularization parameter, value, is tuned and the NCA model was trained for each using each fold in the training set. This process is repeated for all folds and all values.
- The average loss obtained from each fold for each value was computed and the best value was found, which corresponds to the minimum average loss.
- Finally, the features with feature weight greater than the threshold (T) were extracted.
2.7. Data Augmentation Using Synthetic Minority Oversampling Technique (SMOTE)
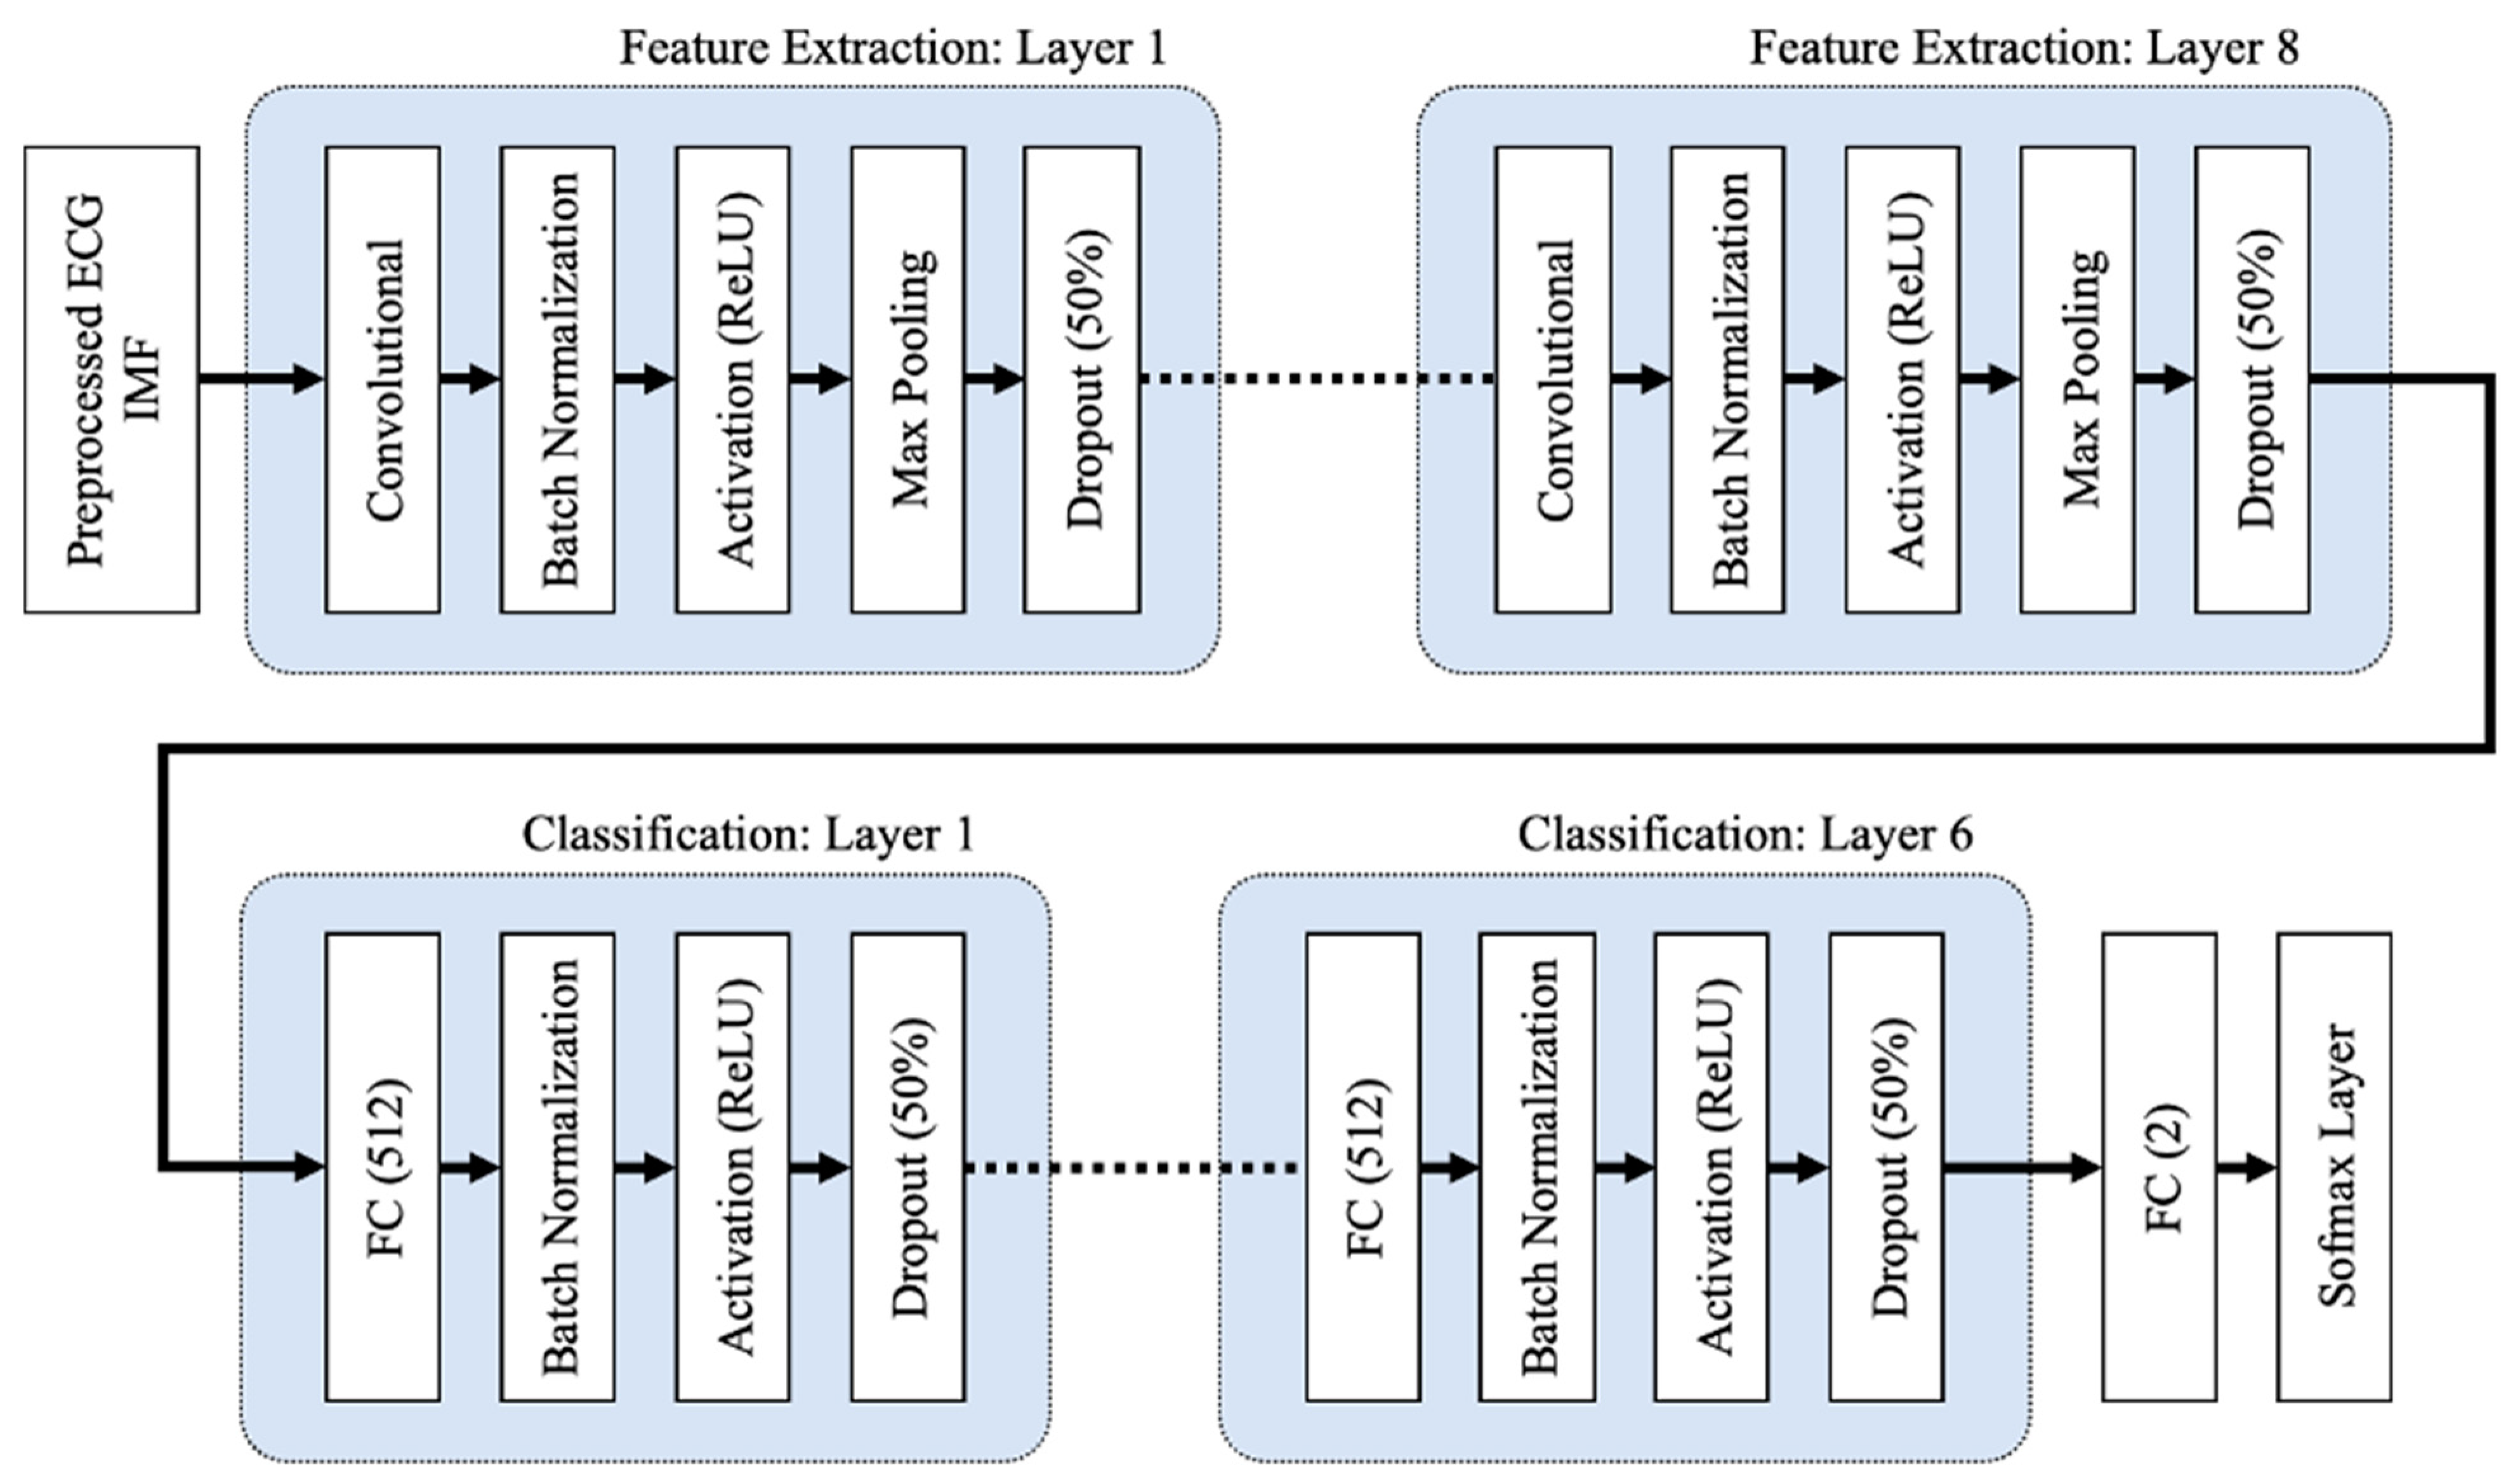
2.8. One-Dimensional Deep Convolutional Neural Network (1D Deep CNN)
2.9. Two-Dimensional Deep Convolutional Neural Network (2D Deep CNN)
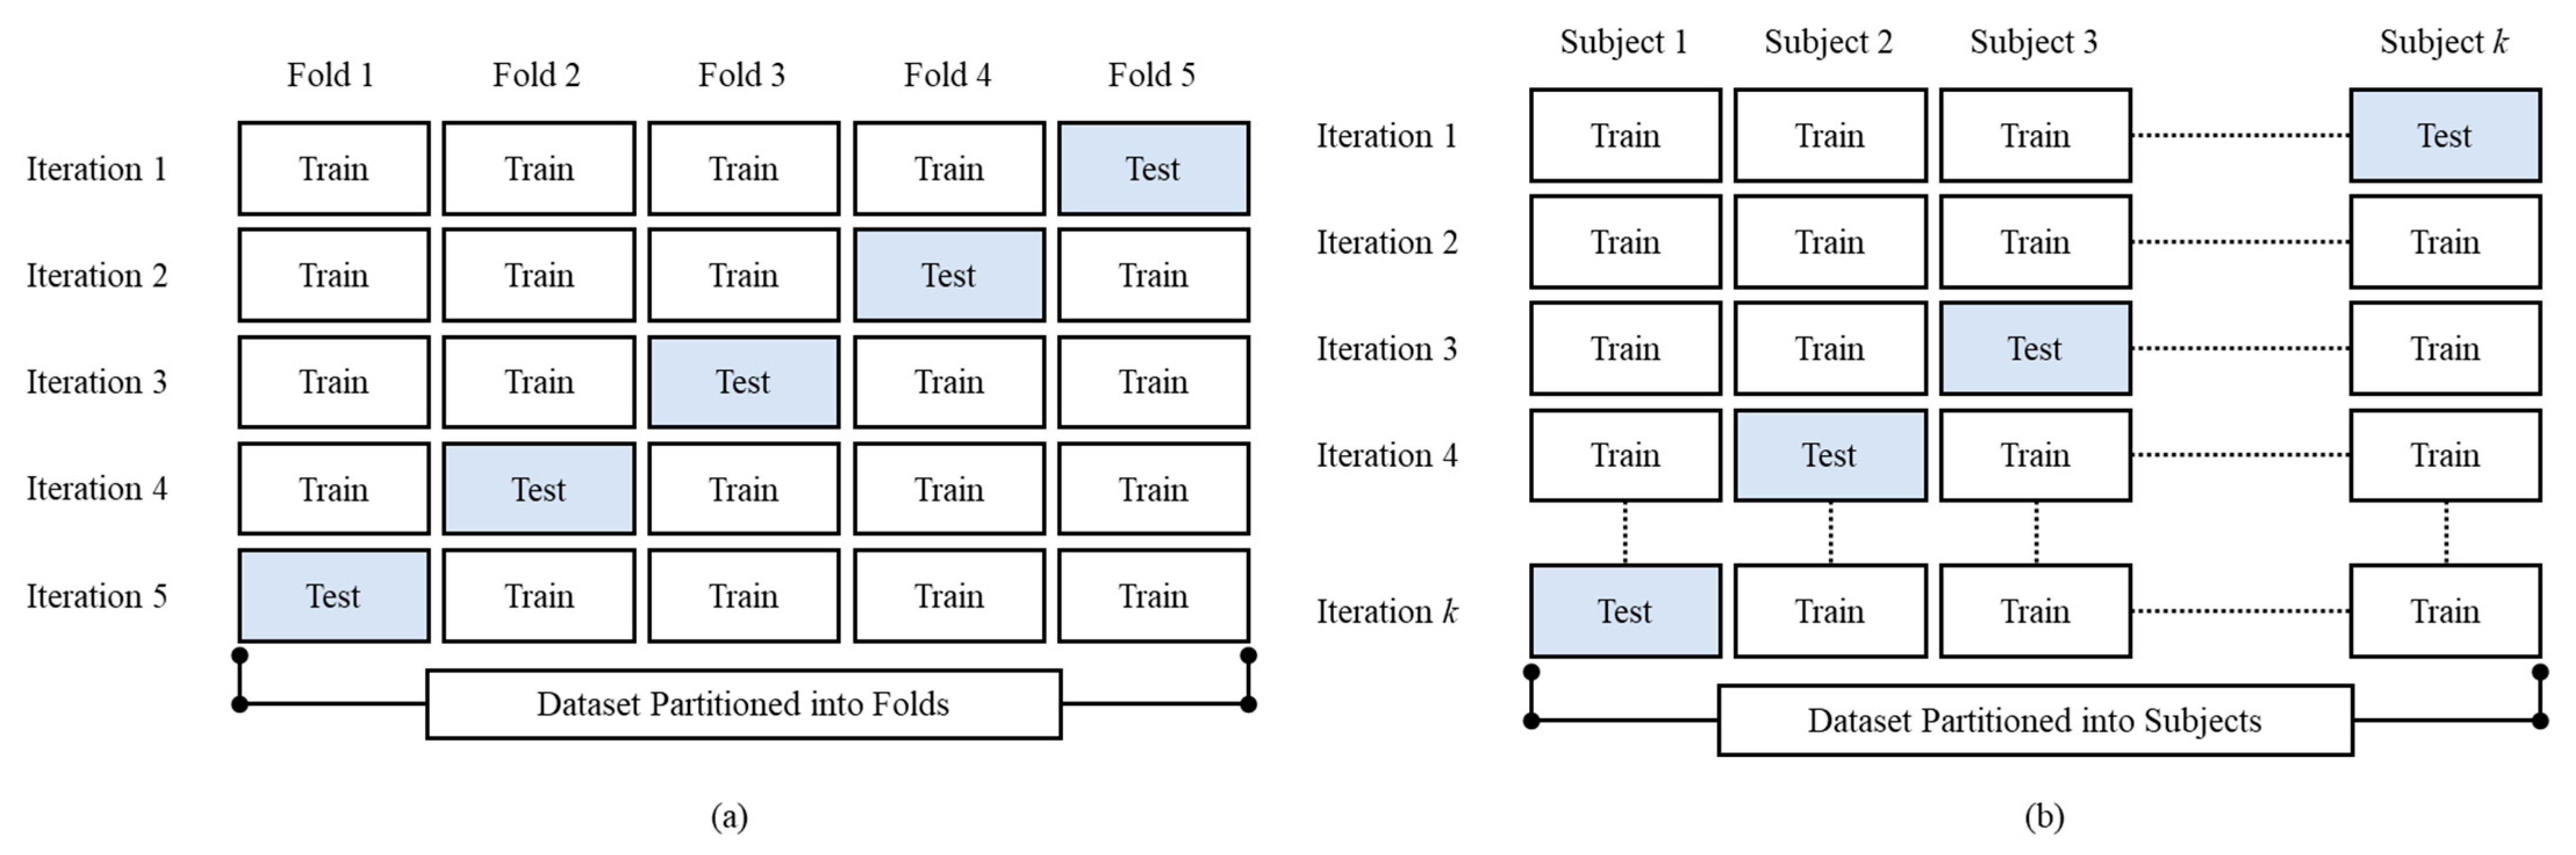
2.10. Cross-Validation
3. Experimental Results
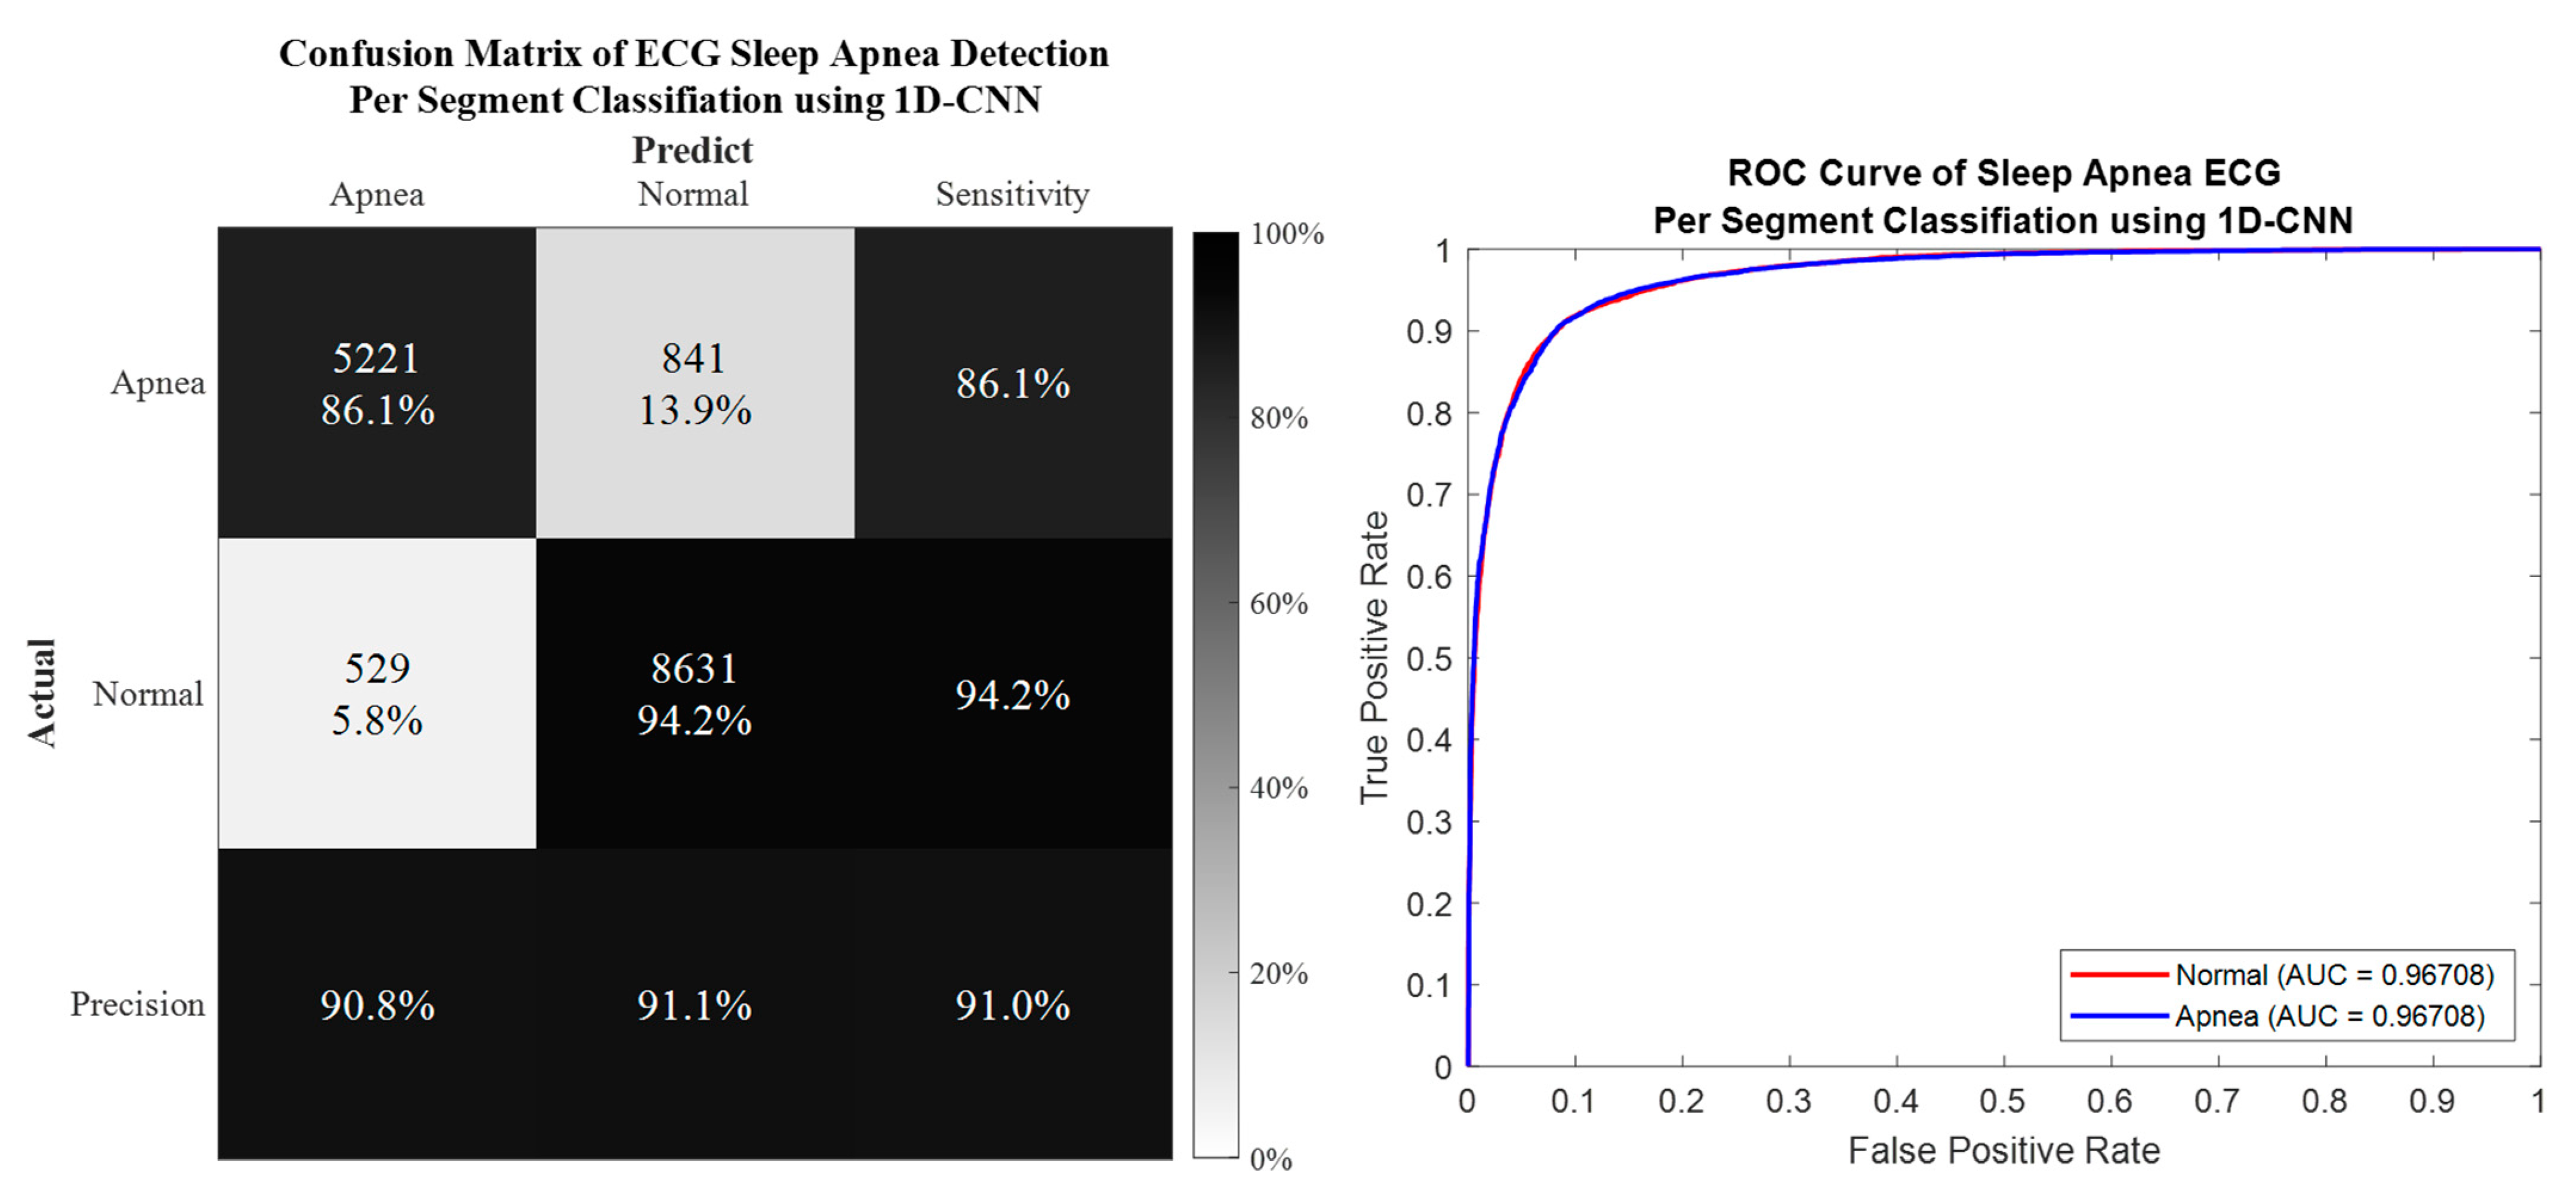
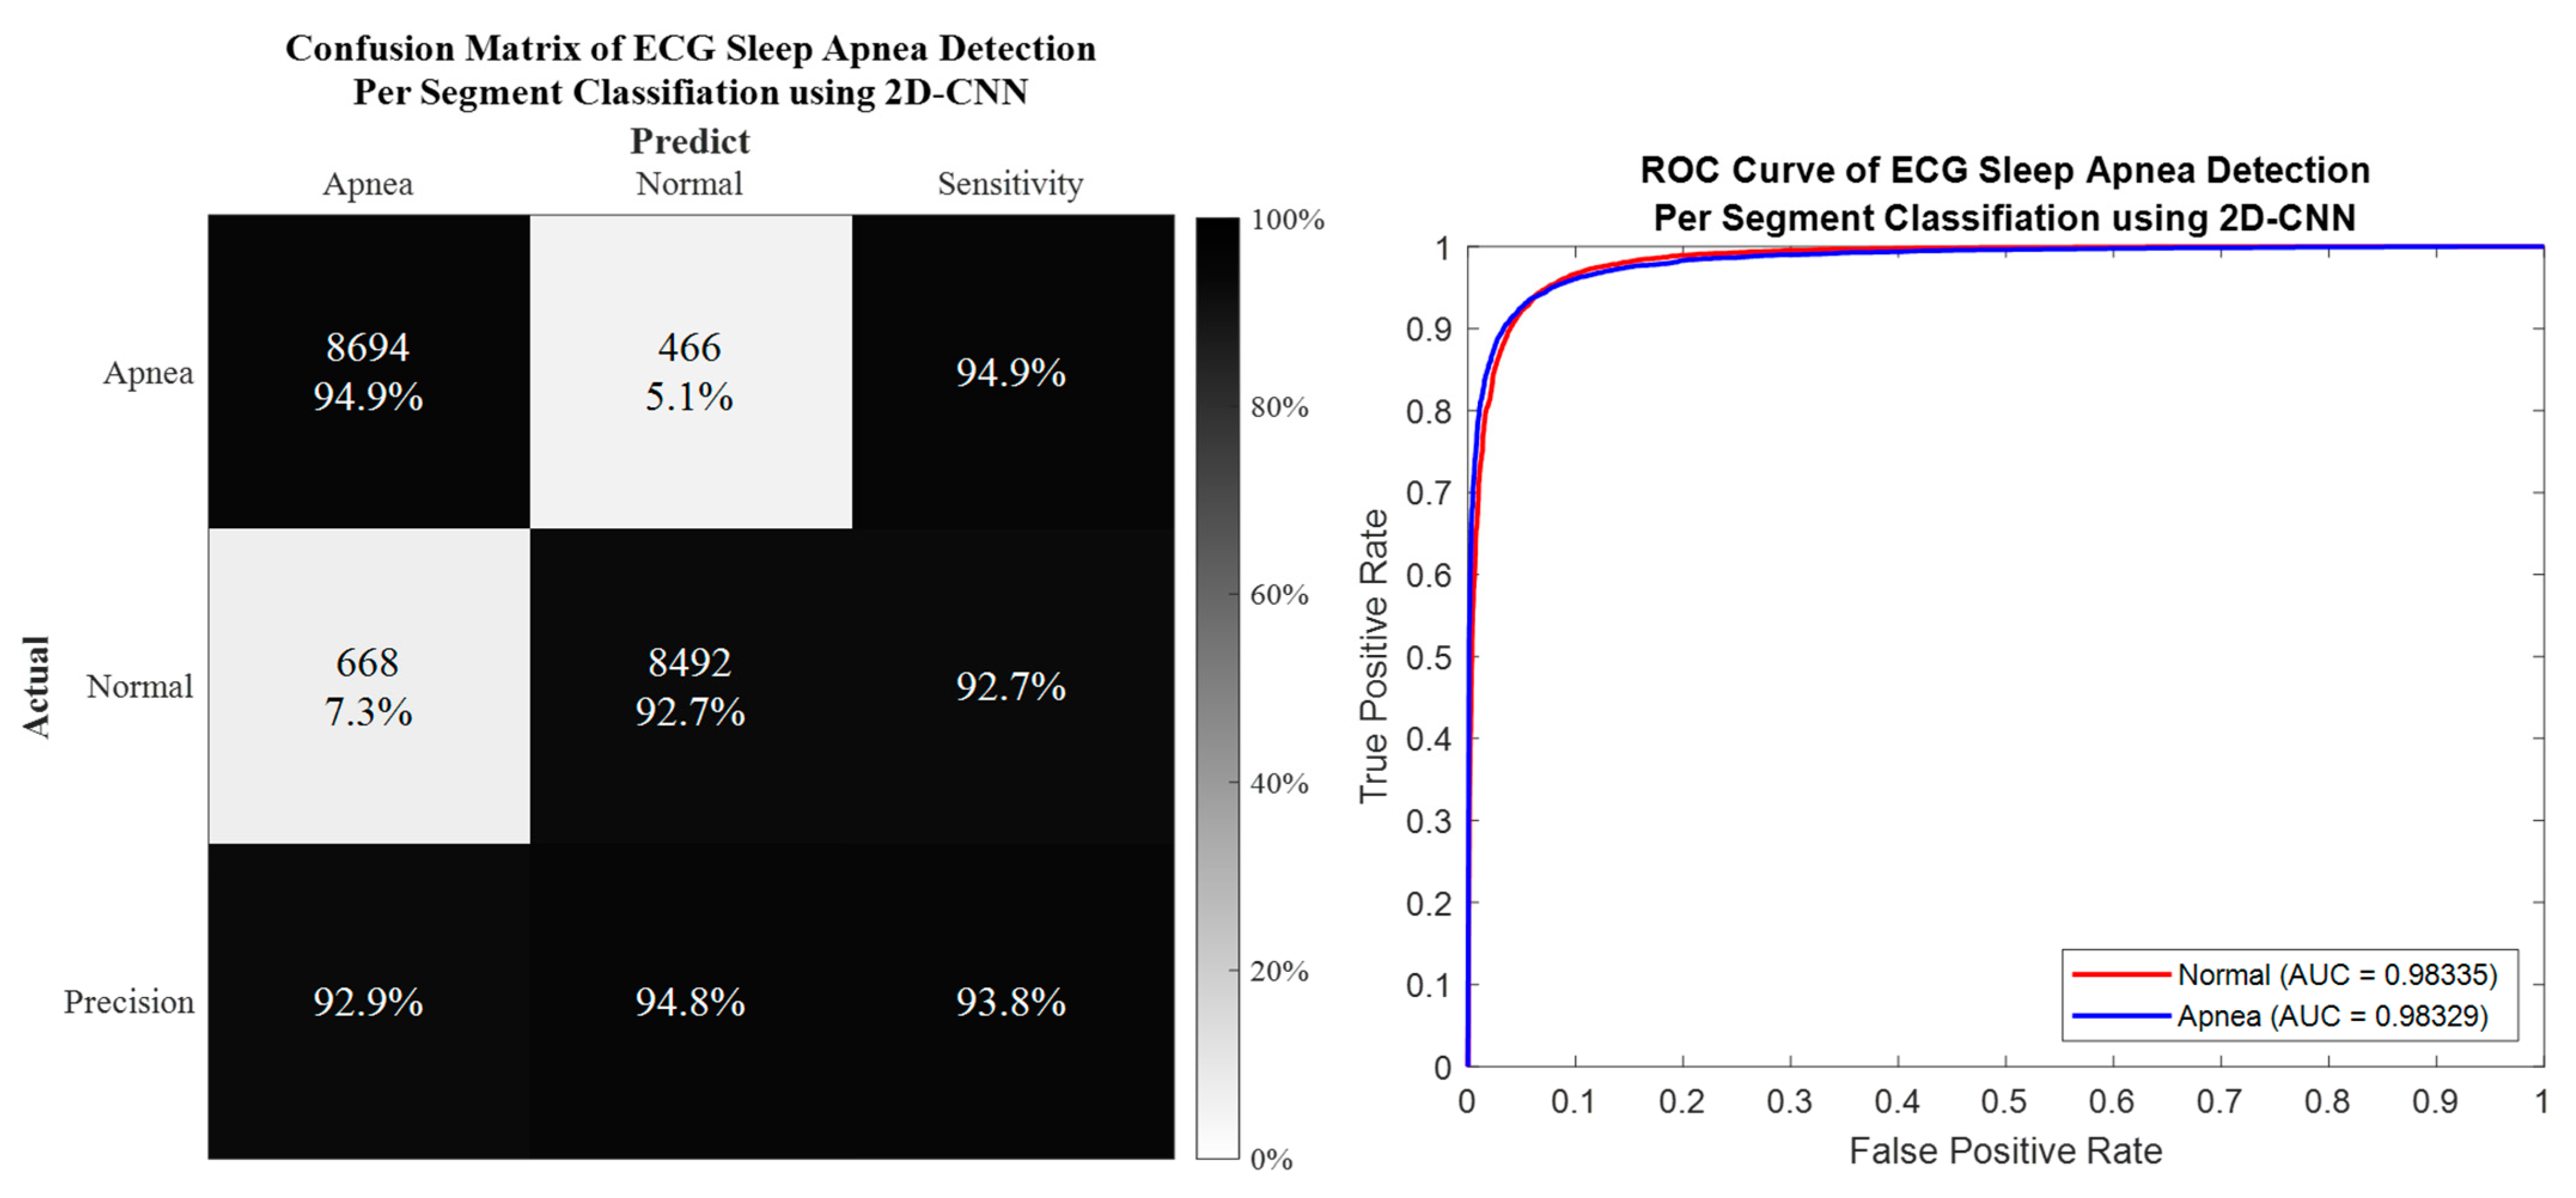
3.1. Per Segment Classification
3.2. Per Subject Classification
4. Discussion
4.1. Performance Comparison between Proposed Method and Existing Literature
4.2. Dealing with Imbalanced Dataset Problem
4.3. Intrinsic Mode Decomposition Feature Phenomenon of Apnea ECG Signal
4.4. Study Limitations and Future Developments
5. Conclusions
Author Contributions
Funding
Institutional Review Board Statement
Informed Consent Statement
Data Availability Statement
Conflicts of Interest
References
- Strollo, P.J., Jr.; Rogers, R.M. Obstructive sleep apnea. N. Engl. J. Med. 1996, 334, 99–104. [Google Scholar] [CrossRef]
- Memon, J.; Manganaro, S.N. Obstructive Sleep-disordered Breathing. In StatPearls [Internet]; StatPearls Publishing: Tampa, FL, USA, 2021. [Google Scholar]
- Benjafield, A.V.; Ayas, N.T.; Eastwood, P.R.; Heinzer, R.; Ip, M.S.; Morrell, M.J.; Nunez, C.M.; Patel, S.R.; Penzel, T.; Pépin, J.-L. Estimation of the global prevalence and burden of obstructive sleep apnoea: A literature-based analysis. Lancet Respir. Med. 2019, 7, 687–698. [Google Scholar] [CrossRef]
- Kapur, V.K.; Auckley, D.H.; Chowdhuri, S.; Kuhlmann, D.C.; Mehra, R.; Ramar, K.; Harrod, C.G. Clinical practice guideline for diagnostic testing for adult obstructive sleep apnea: An American Academy of Sleep Medicine clinical practice guideline. J. Clin. Sleep Med. 2017, 13, 479–504. [Google Scholar] [CrossRef] [PubMed]
- Santilli, M.; Manciocchi, E.; D’Addazio, G.; Di Maria, E.; D’Attilio, M.; Femminella, B.; Sinjari, B. Prevalence of obstructive sleep apnea syndrome: A single-center retrospective study. Int. J. Environ. Res. Public Health 2021, 18, 10277. [Google Scholar] [CrossRef] [PubMed]
- Ontario, H.Q. Polysomnography in patients with obstructive sleep apnea: An evidence-based analysis. Ont Health Technol. Assess Ser. 2006, 6, 1–38. [Google Scholar]
- Álvarez, D.; Cerezo-Hernández, A.; Crespo, A.; Gutiérrez-Tobal, G.C.; Vaquerizo-Villar, F.; Barroso-García, V.; Moreno, F.; Arroyo, C.A.; Ruiz, T.; Hornero, R. A machine learning-based test for adult sleep apnoea screening at home using oximetry and airflow. Sci. Rep. 2020, 10, 5332. [Google Scholar] [CrossRef]
- Mendonça, F.; Mostafa, S.S.; Morgado-Dias, F.; Ravelo-García, A.G. An oximetry based wireless device for sleep apnea detection. Sensors 2020, 20, 888. [Google Scholar] [CrossRef]
- Haidar, R.; Koprinska, I.; Jeffries, B. Sleep apnea event detection from nasal airflow using convolutional neural networks. In Proceedings of the International Conference on Neural Information Processing, Guangzhou, China, 14–18 November 2017; pp. 819–827. [Google Scholar]
- Yue, H.; Lin, Y.; Wu, Y.; Wang, Y.; Li, Y.; Guo, X.; Huang, Y.; Wen, W.; Zhao, G.; Pang, X. Deep learning for diagnosis and classification of obstructive sleep apnea: A nasal airflow-based multi-resolution residual network. Nat. Sci. Sleep 2021, 13, 361. [Google Scholar] [CrossRef]
- Lin, Y.-Y.; Wu, H.-T.; Hsu, C.-A.; Huang, P.-C.; Huang, Y.-H.; Lo, Y.-L. Sleep apnea detection based on thoracic and abdominal movement signals of wearable piezoelectric bands. IEEE J. Biomed. Health Inform. 2016, 21, 1533–1545. [Google Scholar] [CrossRef]
- Zhao, X.; Wang, X.; Yang, T.; Ji, S.; Wang, H.; Wang, J.; Wang, Y.; Wu, Q. Classification of sleep apnea based on EEG sub-band signal characteristics. Sci. Rep. 2021, 11, 5824. [Google Scholar] [CrossRef]
- Bhattacharjee, A.; Saha, S.; Fattah, S.A.; Zhu, W.-P.; Ahmad, M.O. Sleep apnea detection based on rician modeling of feature variation in multiband EEG signal. IEEE J. Biomed. Health Inform. 2018, 23, 1066–1074. [Google Scholar] [CrossRef] [PubMed]
- Bhattacharjee, A.; Fattah, S.A.; Zhu, W.-P.; Ahmad, M.O. VMD-RiM: Rician modeling of temporal feature variation extracted from variational mode decomposed EEG signal for automatic sleep apnea detection. IEEE Access 2018, 6, 77440–77453. [Google Scholar] [CrossRef]
- Taran, S.; Bajaj, V. Sleep apnea detection using artificial bee colony optimize hermite basis functions for EEG signals. IEEE Trans. Instrum. Meas. 2019, 69, 608–616. [Google Scholar] [CrossRef]
- Penzel, T.; Moody, G.B.; Mark, R.G.; Goldberger, A.L.; Peter, J.H. The apnea-ECG database. Proc. Comput. Cardiol. 2000, 27, 255–258. [Google Scholar]
- Penzel, T.; Kantelhardt, J.W.; Grote, L.; Peter, J.-H.; Bunde, A. Comparison of detrended fluctuation analysis and spectral analysis for heart rate variability in sleep and sleep apnea. IEEE Trans. Biomed. Eng. 2003, 50, 1143–1151. [Google Scholar] [CrossRef] [PubMed]
- Janbakhshi, P.; Shamsollahi, M.B. ECG-derived respiration estimation from single-lead ECG using gaussian process and phase space reconstruction methods. Biomed. Signal Processing Control 2018, 45, 80–90. [Google Scholar] [CrossRef]
- Guilleminault, C.; Winkle, R.; Connolly, S.; Melvin, K.; Tilkian, A. Cyclical variation of the heart rate in sleep apnoea syndrome: Mechanisms, and usefulness of 24 h electrocardiography as a screening technique. Lancet 1984, 323, 126–131. [Google Scholar] [CrossRef]
- Lin, C.-Y.; Wang, Y.-W.; Setiawan, F.; Trang, N.T.H.; Lin, C.-W. Sleep apnea classification algorithm development using a machine-learning framework and bag-of-features derived from electrocardiogram spectrograms. J. Clin. Med. 2021, 11, 192. [Google Scholar] [CrossRef]
- Qin, H.; Liu, G. A dual-model deep learning method for sleep apnea detection based on representation learning and temporal dependence. Neurocomputing 2022, 473, 24–36. [Google Scholar] [CrossRef]
- Yeh, C.-Y.; Chang, H.-Y.; Hu, J.-Y.; Lin, C.-C. Contribution of Different Subbands of ECG in Sleep Apnea Detection Evaluated Using Filter Bank Decomposition and a Convolutional Neural Network. Sensors 2022, 22, 510. [Google Scholar] [CrossRef]
- Feng, K.; Qin, H.; Wu, S.; Pan, W.; Liu, G. A sleep apnea detection method based on unsupervised feature learning and single-lead electrocardiogram. IEEE Trans. Instrum. Meas. 2020, 70, 1–12. [Google Scholar] [CrossRef]
- Sheta, A.; Turabieh, H.; Thaher, T.; Too, J.; Mafarja, M.; Hossain, M.S.; Surani, S.R. Diagnosis of obstructive sleep apnea from ecg signals using machine learning and deep learning classifiers. Appl. Sci. 2021, 11, 6622. [Google Scholar] [CrossRef]
- Chang, H.-Y.; Yeh, C.-Y.; Lee, C.-T.; Lin, C.-C. A sleep apnea detection system based on a one-dimensional deep convolution neural network model using single-lead electrocardiogram. Sensors 2020, 20, 4157. [Google Scholar] [CrossRef]
- Zarei, A.; Asl, B.M. Automatic classification of apnea and normal subjects using new features extracted from HRV and ECG-derived respiration signals. Biomed. Signal Processing Control 2020, 59, 101927. [Google Scholar] [CrossRef]
- Bozkurt, F.; Uçar, M.K.; Bozkurt, M.R.; Bilgin, C. Detection of abnormal respiratory events with single channel ECG and hybrid machine learning model in patients with obstructive sleep apnea. Irbm 2020, 41, 241–251. [Google Scholar] [CrossRef]
- Viswabhargav, C.S.; Tripathy, R.; Acharya, U.R. Automated detection of sleep apnea using sparse residual entropy features with various dictionaries extracted from heart rate and EDR signals. Comput. Biol. Med. 2019, 108, 20–30. [Google Scholar] [CrossRef]
- Zarei, A.; Asl, B.M. Automatic detection of obstructive sleep apnea using wavelet transform and entropy-based features from single-lead ECG signal. IEEE J. Biomed. Health Inform. 2018, 23, 1011–1021. [Google Scholar] [CrossRef]
- Singh, S.A.; Majumder, S. A novel approach osa detection using single-lead ECG scalogram based on deep neural network. J. Mech. Med. Biol. 2019, 19, 1950026. [Google Scholar] [CrossRef]
- Li, K.; Pan, W.; Li, Y.; Jiang, Q.; Liu, G. A method to detect sleep apnea based on deep neural network and hidden Markov model using single-lead ECG signal. Neurocomputing 2018, 294, 94–101. [Google Scholar] [CrossRef]
- Sharma, M.; Agarwal, S.; Acharya, U.R. Application of an optimal class of antisymmetric wavelet filter banks for obstructive sleep apnea diagnosis using ECG signals. Comput. Biol. Med. 2018, 100, 100–113. [Google Scholar] [CrossRef]
- Tripathy, R. Application of intrinsic band function technique for automated detection of sleep apnea using HRV and EDR signals. Biocybern. Biomed. Eng. 2018, 38, 136–144. [Google Scholar] [CrossRef]
- Surrel, G.; Aminifar, A.; Rincón, F.; Murali, S.; Atienza, D. Online obstructive sleep apnea detection on medical wearable sensors. IEEE Trans. Biomed. Circuits Syst. 2018, 12, 762–773. [Google Scholar] [CrossRef] [PubMed]
- Hassan, A.R.; Haque, M.A. An expert system for automated identification of obstructive sleep apnea from single-lead ECG using random under sampling boosting. Neurocomputing 2017, 235, 122–130. [Google Scholar] [CrossRef]
- Sharma, H.; Sharma, K. An algorithm for sleep apnea detection from single-lead ECG using Hermite basis functions. Comput. Biol. Med. 2016, 77, 116–124. [Google Scholar] [CrossRef] [PubMed]
- Song, C.; Liu, K.; Zhang, X.; Chen, L.; Xian, X. An obstructive sleep apnea detection approach using a discriminative hidden Markov model from ECG signals. IEEE Trans. Biomed. Eng. 2015, 63, 1532–1542. [Google Scholar] [CrossRef]
- Varon, C.; Caicedo, A.; Testelmans, D.; Buyse, B.; Van Huffel, S. A novel algorithm for the automatic detection of sleep apnea from single-lead ECG. IEEE Trans. Biomed. Eng. 2015, 62, 2269–2278. [Google Scholar] [CrossRef]
- Hassan, A.R. Automatic screening of obstructive sleep apnea from single-lead electrocardiogram. In Proceedings of the 2015 International Conference on Electrical Engineering and Information Communication Technology (ICEEICT), Dhaka, Bangladesh, 21–23 May 2015; pp. 1–6. [Google Scholar]
- Goldberger, A.L.; Amaral, L.A.; Glass, L.; Hausdorff, J.M.; Ivanov, P.C.; Mark, R.G.; Mietus, J.E.; Moody, G.B.; Peng, C.-K.; Stanley, H.E. PhysioBank, PhysioToolkit, and PhysioNet: Components of a new research resource for complex physiologic signals. Circulation 2000, 101, e215–e220. [Google Scholar] [CrossRef]
- Zeiler, A.; Faltermeier, R.; Keck, I.R.; Tomé, A.M.; Puntonet, C.G.; Lang, E.W. Empirical mode decomposition—An introduction. In Proceedings of the 2010 International Joint Conference on Neural Networks (IJCNN), Barcelona, Spain, 18–23 July 2010; pp. 1–8. [Google Scholar]
- Rioul, O.; Duhamel, P. Fast algorithms for discrete and continuous wavelet transforms. IEEE Trans. Inf. Theory 1992, 38, 569–586. [Google Scholar] [CrossRef]
- Goldberger, J.; Hinton, G.E.; Roweis, S.; Salakhutdinov, R.R. Neighbourhood components analysis. Adv. Neural Inf. Processing Syst. 2004, 17, 513–520. [Google Scholar]
- Yang, W.; Wang, K.; Zuo, W. Neighborhood component feature selection for high-dimensional data. J. Comput. 2012, 7, 161–168. [Google Scholar] [CrossRef]
- Chawla, N.V.; Bowyer, K.W.; Hall, L.O.; Kegelmeyer, W.P. SMOTE: Synthetic minority over-sampling technique. J. Artif. Intell. Res. 2002, 16, 321–357. [Google Scholar] [CrossRef]
- LeCun, Y.; Bengio, Y.; Hinton, G. Deep learning. Nature 2015, 521, 436–444. [Google Scholar] [CrossRef] [PubMed]
- Krizhevsky, A.; Sutskever, I.; Hinton, G.E. Imagenet classification with deep convolutional neural networks. Commun. ACM 2017, 60, 84–90. [Google Scholar] [CrossRef]
- Szegedy, C.; Liu, W.; Jia, Y.; Sermanet, P.; Reed, S.; Anguelov, D.; Erhan, D.; Vanhoucke, V.; Rabinovich, A. Going deeper with convolutions. In Proceedings of the IEEE Conference on Computer Vision and Pattern Recognition, Boston, MA, USA, 7–12 June 2015; pp. 1–9. [Google Scholar]
- He, K.; Zhang, X.; Ren, S.; Sun, J. Deep residual learning for image recognition. In Proceedings of the IEEE Conference on Computer Vision and Pattern Recognition, Boston, MA, USA, 7–12 June 2015; pp. 770–778. [Google Scholar]
- Refaeilzadeh, P.; Tang, L.; Liu, H. Cross-validation. Encycl. Database Syst. 2009, 5, 532–538. [Google Scholar]
- Fawcett, T. An introduction to ROC analysis. Pattern Recognit. Lett. 2006, 27, 861–874. [Google Scholar] [CrossRef]
- Youden, W.J. Index for rating diagnostic tests. Cancer 1950, 3, 32–35. [Google Scholar] [CrossRef]
- Zhao, A.; Qi, L.; Dong, J.; Yu, H. Dual channel LSTM based multi-feature extraction in gait for diagnosis of Neurodegenerative diseases. Knowl.-Based Syst. 2018, 145, 91–97. [Google Scholar] [CrossRef]
- Shen, Q.; Qin, H.; Wei, K.; Liu, G. Multiscale deep neural network for obstructive sleep apnea detection using RR interval from single-lead ECG signal. IEEE Trans. Instrum. Meas. 2021, 70, 1–13. [Google Scholar] [CrossRef]
- Azimi, H.; Xi, P.; Bouchard, M.; Goubran, R.; Knoefel, F. Machine learning-based automatic detection of central sleep apnea events from a pressure sensitive mat. IEEE Access 2020, 8, 173428–173439. [Google Scholar] [CrossRef]
- Van Steenkiste, T.; Groenendaal, W.; Deschrijver, D.; Dhaene, T. Automated sleep apnea detection in raw respiratory signals using long short-term memory neural networks. IEEE J. Biomed. Health Inform. 2018, 23, 2354–2364. [Google Scholar] [CrossRef]
- Hassan, A.R. Computer-aided obstructive sleep apnea detection using normal inverse Gaussian parameters and adaptive boosting. Biomed. Signal Processing Control 2016, 29, 22–30. [Google Scholar] [CrossRef]
- Langley, P.; Bowers, E.J.; Murray, A. Principal component analysis as a tool for analyzing beat-to-beat changes in ECG features: Application to ECG-derived respiration. IEEE Trans. Biomed. Eng. 2009, 57, 821–829. [Google Scholar] [CrossRef] [PubMed]
- Hwang, S.H.; Lee, Y.J.; Jeong, D.-U.; Park, K.S. Apnea–hypopnea index prediction using electrocardiogram acquired during the sleep-onset period. IEEE Trans. Biomed. Eng. 2016, 64, 295–301. [Google Scholar]
- Mendez, M.; Corthout, J.; Van Huffel, S.; Matteucci, M.; Penzel, T.; Cerutti, S.; Bianchi, A.M. Automatic screening of obstructive sleep apnea from the ECG based on empirical mode decomposition and wavelet analysis. Physiol. Meas. 2010, 31, 273. [Google Scholar] [CrossRef] [PubMed]


| Author (Year) | Framework | Method | |
|---|---|---|---|
| ECG Feature | Classifier | ||
| Lin et al. (2022) [20] | ML | Raw ECG | CWT + BoF + SVM/KNN/EL |
| Qin et al. (2022) [21] | DL | RRI | 1D-CNN + BiGRU |
| Yeh et al. (2022) [22] | DL | Preprocessed ECG | Filter Bank Decomposition + 1D-CNN |
| Feng et al. (2021) [23] | DL | RRI | Stacked SAE + TDCS 1 |
| Sheta et al. (2021) [24] | DL | Preprocessed ECG | CNN + LSTM |
| Chang et al. (2020) [25] | DL | Preprocessed ECG | 1D-CNN |
| Zarei et al. (2020) [26] | ML | HRV and EDR | Feature Engineering 2 + ML Classifiers |
| Bozkurt et al. (2020) [27] | ML | HRV and ECG | Feature Engineering 2 + Fisher + EL |
| Viswabhargav et al. (2019) [28] | ML | RRI and EDR | SRE + SVM |
| Zarei et al. (2019) [29] | ML | Preprocessed ECG | DWT + Feature Engineering 2 + ML Classifiers |
| Singh et al. (2019) [30] | DL | ECG | CWT + CNN + SVM |
| Li et al. (2018) [31] | DL | RRI | Stacked SAE + Decision Fusion 3 |
| Sharma et al. (2018) [32] | ML | Preprocessed ECG | BAWFB + FE and LE Features + LS-SVM |
| Tripathy (2018) [33] | ML | HRV and EDR | FDM + FE and Energy Features + KELM |
| Surrel et al. (2018) [34] | ML | RRI and RSA | Apnea Scoring (Energy) + SVM |
| Hassan et al. (2017) [35] | ML | Raw ECG | TQWT + RUSBoost |
| Sharma et al. (2016) [36] | ML | QRS and RRI | Hermite basis function + ML Classifiers |
| Song et al. (2016) [37] | ML | RRI and EDR | HMM + SVM/LR/LDA/KNN |
| Varon et al. (2015) [38] | ML | EDR | Feature Engineering 2 + LDA/SVM/LS-SVM |
| Hassan (2015) [39] | ML | Raw ECG | EMD + Feature Engineering 2 + ELM |
| ID | Age (Year) | Gender | Weight (kg) | Height (cm) | AHI | A (min) | N (min) |
|---|---|---|---|---|---|---|---|
| a01 | 51 | M | 102 | 175 | 69.6 | 461 | 19 |
| a02 | 38 | M | 120 | 180 | 69.5 | 381 | 99 |
| a03 | 54 | M | 80 | 168 | 39.1 | 222 | 258 |
| a04 | 52 | M | 121 | 173 | 77.4 | 441 | 39 |
| a05 | 58 | M | 78 | 176 | 41 | 244 | 176 |
| a06 | 63 | M | 104 | 179 | 24.7 | 183 | 297 |
| a07 | 44 | M | 105 | 177 | 63 | 294 | 186 |
| a08 | 51 | M | 88 | 179 | 42 | 187 | 293 |
| a09 | 52 | M | 82 | 178 | 31.7 | 366 | 114 |
| a10 | 58 | M | 78 | 176 | 21 | 83 | 397 |
| a11 | 58 | M | 103 | 168 | 14 | 182 | 238 |
| a12 | 52 | M | 121 | 173 | 80.2 | 439 | 41 |
| a13 | 51 | M | 88 | 179 | 42 | 235 | 245 |
| a14 | 51 | M | 102 | 175 | 54.7 | 383 | 97 |
| a15 | 60 | M | 113 | 176 | 52 | 356 | 124 |
| a16 | 44 | M | 105 | 177 | 41 | 320 | 160 |
| a17 | 40 | M | 96 | 179 | 33 | 138 | 222 |
| a18 | 52 | M | 82 | 178 | 82.4 | 429 | 51 |
| a19 | 55 | M | 90 | 178 | 34 | 185 | 295 |
| a20 | 58 | M | 78 | 176 | 41 | 295 | 185 |
| Total Event | 5824 | 3536 | |||||
| ID | Age (Year) | Gender | Weight (kg) | Height (cm) | AHI | A (Min) | N (Min) |
|---|---|---|---|---|---|---|---|
| b01 | 44 | F | 63 | 170 | 0.24 | 19 | 461 |
| b02 | 53 | M | 85 | 176 | 19 | 93 | 387 |
| b03 | 53 | M | 85 | 176 | 24 | 65 | 355 |
| b04 | 42 | M | 64 | 180 | 0.7 | 10 | 410 |
| Total Event | 187 | 1613 | |||||
| ID | Age (Year) | Gender | Weight (kg) | Height (cm) | AHI | A (Min) | N (Min) |
|---|---|---|---|---|---|---|---|
| c01 | 31 | M | 74 | 184 | 0 | 0 | 480 |
| c02 | 37 | M | 83 | 180 | 1 | 0 | 479 |
| c03 | 39 | M | 65 | 184 | 0 | 0 | 420 |
| c04 | 41 | F | 65 | 180 | 0 | 0 | 480 |
| c06 | 28 | F | 65 | 171 | 0.25 | 1 | 419 |
| c07 | 30 | F | 56 | 168 | 0 | 4 | 416 |
| c08 | 42 | M | 64 | 180 | 0 | 0 | 480 |
| c09 | 37 | M | 83 | 180 | 0 | 2 | 418 |
| c10 | 27 | M | 72 | 184 | 0 | 1 | 419 |
| Total Event | 6 | 4011 | |||||
| Layers | Parameters | Output Size (1D) |
|---|---|---|
| Input | [6000, 1] | |
| Feature Extraction Layer 1 | ||
| Convolution | filters = 45, kernel size = 32 padding = ‘same’ kernel initializer = ‘he_normal’ | [6000, 45] |
| Batch Normalization | [6000, 45] | |
| Activation | ReLU | [6000, 45] |
| Max Pooling | pool size = 2, strides = 2 | [3000, 45] |
| Dropout | dropout rate = 0.5 | [3000, 45] |
| … | ||
| Feature Extraction Layer 8 | ||
| Convolution | filters = 45, kernel size = 32 padding = ‘same’ kernel initializer = ‘he_normal’ | [46, 45] |
| Batch Normalization | [46, 45] | |
| Activation | ReLU | [46, 45] |
| Max Pooling | pool size = 2, strides = 2 | [23, 45] |
| Dropout | dropout rate = 0.5 | [23, 45] |
| Classification Layer 1 | ||
| Fully Connected | units = 512 kernel initializer = ‘he_normal’ | 512 |
| Batch Normalization | 512 | |
| Activation | ReLU | 512 |
| Dropout | dropout rate = 0.5 | 512 |
| … | ||
| Classification Layer 6 | ||
| Fully Connected | units = 512 kernel initializer = ‘he_normal’ | 512 |
| Batch Normalization | 512 | |
| Activation | ReLU | 512 |
| Dropout | dropout rate = 0.5 | 512 |
| Fully Connected | Softmax | 2 |
| Characteristic Comparison | 2D Deep CNN Architecture | ||
|---|---|---|---|
| AlexNet | GoogLeNet | ResNet-50 | |
| Number of Layers | 8 | 22 | 50 |
| Input Size | |||
| Number of Conv-Pool Layers | 5 | 21 | 49 |
| Number of Fully Connected Layers | 3 | 1 | 1 |
| Salient Feature | Deeper | Wider (parallel kernels) | Shortcut connections |
| Number of Parameters (Weights) | 60.97 million | 7 million | 25.56 million |
| Memory | 232.5 MB | 26.3 MB | 97.2 MB |
| FLOPs | |||
| Training Time (5fold-CV/LOSO-CV) | 2.88/20.55 h | 4.56/25.41 h | 4.78/28.94 h |
| Input System | Evaluation Parameters | ||||
|---|---|---|---|---|---|
| Dataset | IMF Feature | Acc (%) | Sens (%) | Spec (%) | AUC |
| 1D Deep CNN | |||||
| Imbalanced | 89.8 | 83.5 | 94 | 0.9629 | |
| 88.6 | 87 | 89.7 | 0.9516 | ||
| 90.5 | 84.7 | 94.3 | 0.9656 | ||
| 91 # | 86.1 # | 94.2# | 0.9671 # | ||
| Balanced using SMOTE | 91.7 | 91.2 | 92.3 | 0.9721 | |
| 89.9 | 88.6 | 91.3 | 0.9622 | ||
| 91.5 | 93.4 | 90.5 | 0.9714 | ||
| 91.8 # | 91 # | 92.6# | 0.9732 # | ||
| 2D Deep CNN: AlexNet | |||||
| Imbalanced | 90.8 | 89.4 | 91.7 | 0.9665 | |
| 84.5 | 82.3 | 85.9 | 0.9182 | ||
| 91.1 # | 92.2 # | 90.3 # | 0.9689 # | ||
| 91.3 | 89.1 | 92.8 | 0.9684 | ||
| Balanced using SMOTE | 91.8 | 92 | 91.6 | 0.9730 | |
| 86.7 | 83.6 | 89.9 | 0.9399 | ||
| 92.3 # | 92 # | 92.6 # | 0.9771 # | ||
| 92 | 90.2 | 93.8 | 0.9779 | ||
| 2D Deep CNN: GoogLeNet | |||||
| Imbalanced | 90.9 | 91 | 90.8 | 0.9678 | |
| 86.3 | 83.3 | 88.2 | 0.9344 | ||
| 91.6 # | 90.1 # | 92.6 # | 0.9706# | ||
| 91.3 | 89 | 92.8 | 0.9684 | ||
| Balanced using SMOTE | 92.3 | 91.6 | 93.1 | 0.9754 | |
| 88.4 | 84.4 | 92.3 | 0.9539 | ||
| 92.2 | 91 | 93.5 | 0.9780 | ||
| 92.9 # | 91.9 # | 93.9 # | 0.9797 # | ||
| 2D Deep CNN: ResNet-50 | |||||
| Imbalanced | 92.2 | 91.3 | 92.7 | 0.9740 | |
| 88.8 | 87.8 | 89.4 | 0.9535 | ||
| 92.5 # | 91.4 # | 93.1 # | 0.9758 # | ||
| 92.3 | 91 | 93.3 | 0.9751 | ||
| Balanced using SMOTE | 93.4 | 94.3 | 92.5 | 0.9811 | |
| 90 | 92.6 | 87.5 | 0.9645 | ||
| 93.6 | 94.7 | 92.5 | 0.9825 | ||
| 93.8 # | 94.9 # | 92.7 # | 0.9833 # | ||
| Evaluation Parameter | Subject ID | ||||||||||||
| a01 | a02 | a03 | a04 | a05 | a06 | a07 | a08 | a09 | a10 | a11 | a12 | a13 | |
| Accuracy | 96 | 28.7 | 59.2 | 48.5 | 65 | 59.4 | 66.9 | 80.2 | 79.4 | 59.4 | 56.2 | 74.6 | 83.9 |
| Sensitivity | 15.8 | 94.9 | 48.1 | 87.2 | 36.9 | 83.5 | 16.1 | 89.1 | 56.1 | 64.5 | 92.9 | 29.3 | 78.7 |
| Specificity | 99.3 | 11.5 | 72.1 | 45.1 | 85.2 | 20.2 | 99 | 66.3 | 86.6 | 34.9 | 8.2 | 78.8 | 89.4 |
| Evaluation Parameter | Subject ID | ||||||||||||
| a14 | a15 | a16 | a17 | a18 | a19 | a20 | b01 | b02 | b03 | b04 | c01 | c02 | |
| Accuracy | 79.6 | 66.9 | 68.5 | 71.1 | 89.8 | 77.1 | 48.3 | 71.7 | 74.2 | 74 | 95.3 | 6.4 | 49.6 |
| Sensitivity | 1 | 12.9 | 93.1 | 62.5 | 49 | 67.1 | 35.1 | 72.5 | 75.2 | 83.9 | 98 | 100 | 100 |
| Specificity | 99.5 | 85.7 | 56.2 | 84.1 | 94.6 | 93 | 56.6 | 52.6 | 69.9 | 20 | 0 | 6.4 | 49.6 |
| Evaluation Parameter | Subject ID | Average | |||||||||||
| c03 | c04 | c06 | c07 | c08 | c09 | c10 | |||||||
| Accuracy | 69.8 | 63.8 | 41.9 | 51.9 | 80 | 90.8 | 98.6 | 67.5 | |||||
| Sensitivity | 100 | 100 | 41.8 | 51.7 | 100 | 100 | 98.9 | 67.8 | |||||
| Specificity | 69.8 | 63.8 | 100 | 75 | 80 | 90.8 | 0 | 62 | |||||
| Evaluation Parameter | Subject ID | ||||||||||||
| a01 | a02 | a03 | a04 | a05 | a06 | a07 | a08 | a09 | a10 | a11 | a12 | a13 | |
| Accuracy | 95.8 | 61.5 | 70.4 | 71.5 | 79.5 | 70.6 | 71.7 | 76.9 | 62.9 | 83.3 | 74.8 | 87.1 | 85 |
| Sensitivity | 96.7 | 54.9 | 43.7 | 69.8 | 75.8 | 30.6 | 99.7 | 60.4 | 54.9 | 56.6 | 46.7 | 92 | 79.1 |
| Specificity | 73.7 | 86.9 | 93.4 | 89.7 | 84.7 | 95.3 | 27.4 | 87.4 | 88.6 | 88.9 | 96.2 | 34.1 | 90.6 |
| Evaluation Parameter | Subject ID | ||||||||||||
| a14 | a15 | a16 | a17 | a18 | a19 | a20 | b01 | b02 | b03 | b04 | c01 | c02 | |
| Accuracy | 86.9 | 81.9 | 83.5 | 63.3 | 87.9 | 91.9 | 60.2 | 95 | 92.7 | 92.1 | 95.8 | 98.6 | 100 |
| Sensitivity | 91.6 | 89.3 | 80 | 8 | 93.2 | 84.9 | 38.3 | 21.1 | 78.5 | 90.8 | 10 | 100 | 100 |
| Specificity | 68 | 60.5 | 90.6 | 100 | 43.1 | 96.3 | 95.1 | 98 | 96.1 | 92.4 | 98.3 | 98.6 | 100 |
| Evaluation Parameter | Subject ID | Average | |||||||||||
| c03 | c04 | c06 | c07 | c08 | c09 | c10 | |||||||
| Accuracy | 95 | 60.2 | 97.6 | 93.3 | 91.9 | 98.9 | 98.6 | 83.2 | |||||
| Sensitivity | 100 | 100 | 0 | 0 | 100 | 100 | 0 | 72.7 | |||||
| Specificity | 95 | 60.2 | 97.9 | 94.2 | 91.9 | 98.8 | 98.9 | 90.4 | |||||
| Evaluation Parameter | Subject ID | ||||||||||||
| a01 | a02 | a03 | a04 | a05 | a06 | a07 | a08 | a09 | a10 | a11 | a12 | a13 | |
| Accuracy | 96.2 | 76.2 | 87.7 | 97.7 | 77.9 | 75.2 | 73.5 | 81.2 | 77.7 | 71.7 | 70.7 | 57.5 | 82.3 |
| Sensitivity | 78.9 | 76.9 | 79.3 | 98.6 | 81.6 | 44.3 | 95.2 | 82.9 | 88.5 | 86.7 | 34.1 | 55.1 | 71.5 |
| Specificity | 97 | 73.7 | 95 | 87.2 | 72.7 | 94.3 | 39.2 | 80.2 | 43 | 68.5 | 98.7 | 82.9 | 92.6 |
| Evaluation Parameter | Subject ID | ||||||||||||
| a14 | a15 | a16 | a17 | a18 | a19 | a20 | b01 | b02 | b03 | b04 | c01 | c02 | |
| Accuracy | 89.2 | 84.2 | 81.2 | 62.7 | 85 | 89 | 78.5 | 96.2 | 90.2 | 82.6 | 87.8 | 95.5 | 98.6 |
| Sensitivity | 97.4 | 92.4 | 75.6 | 7.2 | 88.8 | 74.1 | 74.6 | 10.5 | 66.7 | 76.9 | 30 | 100 | 100 |
| Specificity | 56.7 | 60.5 | 92.5 | 99.5 | 52.9 | 98.3 | 84.9 | 99.8 | 95.9 | 83.7 | 89.4 | 95.5 | 98.6 |
| Evaluation Parameter | Subject ID | Average | |||||||||||
| c03 | c04 | c06 | c07 | c08 | c09 | c10 | |||||||
| Accuracy | 74.5 | 26.7 | 95.2 | 96 | 98.3 | 98.3 | 99.4 | 82.9 | |||||
| Sensitivity | 100 | 100 | 0 | 0 | 100 | 100 | 0 | 78.8 | |||||
| Specificity | 74.5 | 26.7 | 95.5 | 96.9 | 98.3 | 98.3 | 99.7 | 85.6 | |||||
| Evaluation Parameter | Subject ID | ||||||||||||
| a01 | a02 | a03 | a04 | a05 | a06 | a07 | a08 | a09 | a10 | a11 | a12 | a13 | |
| Accuracy | 96.2 | 69 | 84 | 93.8 | 80 | 77.1 | 77.5 | 81.9 | 68.1 | 82.7 | 58.1 | 82.3 | 83.3 |
| Sensitivity | 97.8 | 63.5 | 75.2 | 95 | 75.8 | 50.3 | 95.2 | 74.9 | 60.9 | 66.3 | 4.9 | 84.7 | 77.9 |
| Specificity | 57.9 | 89.9 | 91.5 | 79.5 | 85.8 | 93.6 | 49.5 | 86.3 | 91.2 | 86.1 | 98.7 | 56.1 | 88.5 |
| Evaluation Parameter | Subject ID | ||||||||||||
| a14 | a15 | a16 | a17 | a18 | a19 | a20 | b01 | b02 | b03 | b04 | c01 | c02 | |
| Accuracy | 87.9 | 81.9 | 82.1 | 70.5 | 91.7 | 79 | 61.7 | 94.2 | 89.4 | 76.2 | 95.6 | 96 | 99.5 |
| Sensitivity | 93.5 | 95.8 | 78.1 | 29 | 98.1 | 47 | 40.3 | 0 | 78.5 | 87.7 | 10 | 100 | 100 |
| Specificity | 66 | 41.9 | 90 | 98.1 | 37.3 | 99 | 95.7 | 98 | 92 | 74.1 | 98 | 96 | 99.5 |
| Evaluation Parameter | Subject ID | Average | |||||||||||
| c03 | c04 | c06 | c07 | c08 | c09 | c10 | |||||||
| Accuracy | 70 | 86.2 | 97.1 | 85.7 | 94.2 | 99.4 | 86.9 | 83.5 | |||||
| Sensitivity | 100 | 100 | 0 | 0 | 100 | 100 | 100 | 75.9 | |||||
| Specificity | 70 | 86.2 | 97.4 | 86.5 | 94.2 | 99.4 | 86.9 | 88.7 | |||||
| Framework | Author (Year) | Input System | Method | Evaluation Parameters (%) | |||
|---|---|---|---|---|---|---|---|
| Acc | Sens | Spec | AUC | ||||
| DL | The proposed method | ECG | EMD + SMOTE + 1D deep CNN | 91.8 | 91 | 92.6 | 0.9732 |
| Qin et al. (2022) [21] | RRI | ADASYN + 1D deep CNN + BiGRU | 91.1 | 88.9 | 92.4 | 0.9520 | |
| Yeh et al. (2022) [22] | ECG | Filter Bank Decomposition + 1D deep CNN | 88.6 | 83.8 | 91.5 | - | |
| Feng et al. (2021) [23] | RRI | Stacked SAE + TDCS 1 | 85.1 | 86.2 | 84.4 | - | |
| Sheta et al. (2021) [24] | ECG | CNNLSTM | 86.3 | 88.8 | - | 0.9510 | |
| Chang et al. (2020) [25] | ECG | 1D deep CNN | 87.9 | 92 | 81.1 | 0.9400 | |
| Singh et al. (2019) [30] | ECG | CWT + AlexNet CNN + SVM | 86.2 | 90 | 83.8 | 0.8800 | |
| Li et al. (2018) [53] | RRI | Stacked SAE + Decision Fusion 2 | 84.7 | 88.9 | 82.1 | 0.8690 | |
| ML | Lin et al. (2022) [20] | ECG | CWT + EL | 91.4 | 89.8 | 92.4 | - |
| Bozkurt et al. (2020) [27] | ECG and HRV | Feature Engineering + Fisher + EL | 85.1 | 85 | 86 | - | |
| Surrel et al. (2018) [34] | RRI and RSA | Apnea Scoring (Energy) + SVM | 85.7 | 81.4 | 88.4 | - | |
| Hassan et al. (2017) [35] | ECG | TQWT + RUSBoost | 88.9 | 87.6 | 91.5 | - | |
| Author (Year) | Input | Method | ||
|---|---|---|---|---|
| Feature Extraction | Data Augmentation | Classifier | ||
| Qin et al. [21] (2022) | ECG | Christov algorithm | ADASYN | 1D-CNN-RLM, BiGRU-TDM |
| Shen et al. [54] (2021) | RRI | MSDA-1D-CNN | WCLF | WLTD (HMM) |
| Azimi et al. [55] (2020) | PSM | N/A | SMOTE | Linear SVM, BiLSTM, TCN |
| Van Steenkiste et al. [56] (2019) | Respiration | N/A | Balanced Bootstrapping | LSTM NNs + aggregated prediction |
| Hassan et al. [35] (2017) | ECG | TQWT + statistical features | RUSBoost | ELM, PNN, Bagging, kNN, SVM, LS-SVM, RF, AdaBoost |
| Hassan [57] (2016) | ECG | NIG TQWT | AdaBoost | DT |
| Balancing Method | IMF Feature | Evaluation Parameters | |||
|---|---|---|---|---|---|
| Acc (%) | Sens (%) | Spec (%) | AUC | ||
| ROS | 93.7 | 95.9 | 91.5 | 0.9816 | |
| 90.9 | 93.8 | 88 | 0.9666 | ||
| 94.1 # | 95.4 # | 92.8 # | 0.9834 # | ||
| 93.8 | 95 | 92.5 | 0.9817 | ||
| RUS | 90.1 | 89.7 | 90.4 | 0.9615 | |
| 85.7 | 84.6 | 86.9 | 0.9312 | ||
| 90.1 | 89.5 | 90.6 | 0.9613 | ||
| 90.4 | 90.6 | 90.2 | 0.9637 | ||
| SMOTE | 93.4 | 94.3 | 92.5 | 0.9811 | |
| 90 | 92.6 | 87.5 | 0.9645 | ||
| 93.6 | 94.7 | 92.5 | 0.9825 | ||
| 93.8 # | 94.9 # | 92.7 # | 0.9833 # | ||
Publisher’s Note: MDPI stays neutral with regard to jurisdictional claims in published maps and institutional affiliations. |
© 2022 by the authors. Licensee MDPI, Basel, Switzerland. This article is an open access article distributed under the terms and conditions of the Creative Commons Attribution (CC BY) license (https://creativecommons.org/licenses/by/4.0/).
Share and Cite
Setiawan, F.; Lin, C.-W. A Deep Learning Framework for Automatic Sleep Apnea Classification Based on Empirical Mode Decomposition Derived from Single-Lead Electrocardiogram. Life 2022, 12, 1509. https://doi.org/10.3390/life12101509
Setiawan F, Lin C-W. A Deep Learning Framework for Automatic Sleep Apnea Classification Based on Empirical Mode Decomposition Derived from Single-Lead Electrocardiogram. Life. 2022; 12(10):1509. https://doi.org/10.3390/life12101509
Chicago/Turabian StyleSetiawan, Febryan, and Che-Wei Lin. 2022. "A Deep Learning Framework for Automatic Sleep Apnea Classification Based on Empirical Mode Decomposition Derived from Single-Lead Electrocardiogram" Life 12, no. 10: 1509. https://doi.org/10.3390/life12101509
APA StyleSetiawan, F., & Lin, C.-W. (2022). A Deep Learning Framework for Automatic Sleep Apnea Classification Based on Empirical Mode Decomposition Derived from Single-Lead Electrocardiogram. Life, 12(10), 1509. https://doi.org/10.3390/life12101509