Article

Impact TMPRSS2–ERG Molecular Subtype on Prostate Cancer Recurrence

by
Anastasiya A. Kobelyatskaya
1,2,*,
Elena A. Pudova
1,
Anastasiya V. Snezhkina
1,
Maria S. Fedorova
1,
Vladislav S. Pavlov
1,
Zulfiya G. Guvatova
1,
Maria V. Savvateeva
1,
Nataliya V. Melnikova
1,
Alexey A. Dmitriev
1,
Dmitry Y. Trofimov
3,
Gennady T. Sukhikh
3,
Kirill M. Nyushko
4,
Boris Y. Alekseev
4,
Sergey V. Razin
2,
George S. Krasnov
1 and
Anna V. Kudryavtseva
1,*
1
Engelhardt Institute of Molecular Biology, Russian Academy of Sciences, 119991 Moscow, Russia
2
Institute of Gene Biology, Russian Academy of Sciences, 119334 Moscow, Russia
3
Gynecology and Perinatology named after Academician V.I. Kulakov, National Medical Research Center for Obstetrics, Ministry of Health of the Russian Federation, 117997 Moscow, Russia
4
National Medical Research Radiological Center, Ministry of Health of the Russian Federation, 125284 Moscow, Russia
*
Authors to whom correspondence should be addressed.
Life 2021, 11(6), 588; https://doi.org/10.3390/life11060588
Submission received: 30 April 2021 / Revised: 7 June 2021 / Accepted: 16 June 2021 / Published: 21 June 2021
(This article belongs to the Section Physiology and Pathology)

Abstract

:
Currently, seven molecular subtypes of prostate cancer (PCa) are known, the most common of which being the subtype characterized by the presence of the TMPRSS2–ERG fusion transcript. While there is a considerable amount of work devoted to the influence of this transcript on the prognosis of the disease, data on its role in the progression and prognosis of PCa remain controversial. The present study is devoted to the analysis of the association between the TMPRSS2–ERG transcript and the biochemical recurrence of PCa. The study included two cohorts: the RNA–Seq sample of Russian patients with PCa (n = 72) and the TCGA–PRAD data (n = 203). The results of the analysis of the association between the TMPRSS2–ERG transcript and biochemical recurrence were contradictory. The differential expression analysis (biochemical recurrence cases versus biochemical recurrence-free) and the gene set enrichment analysis revealed a list of genes involved in major cellular pathways. The GNL3, QSOX2, SSPO, and SYS1 genes were selected as predictors of the potential prognostic model (AUC = 1.000 for a cohort of Russian patients with PCa and AUC = 0.779 for a TCGA–PRAD cohort).

1. Introduction

Currently, seven major molecular subtypes of prostate cancer (PCa), identified by the Cancer Genome Atlas Research Network, TCGA–PRAD project [1], are known. Four of the seven subtypes are characterized by the presence of fusion transcripts between the TMPRSS2 exons and the exons of genes encoding members of the erythroblast transformation-specific (ETS) family of transcription factors: ERG, ETV1, ETV4, and FLI1 (the frequency of the subtypes is 46%, 8%, 4%, and 1%, respectively). Three other subtypes are characterized by the presence of point mutations in one of the following genes: SPOP, FOXA1, or IDH1 (the frequency of the subtypes is 11%, 3%, and 1%, respectively) [1,2]. Thus, about half of all PCa cases have a TMPRSS2–ERG fusion transcript, which is formed due to an intrachromosomal rearrangement leading to the fusion of two genes: TMPRSS2 and ERG. The TMPRSS2 gene is characterized by a higher expression level compared with that of ERG gene expression in the prostate tissue [3]; however, their fusion leads to a manifold increase in ERG expression [4,5,6]. Furthermore, a number of studies have described TMPRSS2–ERG-mediated feed-forward regulation of wild-type ERG, inducing its overexpression [7,8]. ERG is a pro-oncogenic transcription factor involved in the regulation of embryonic development, cell proliferation, and differentiation. Multiple increases in the expression of the ERG entail serious transcriptomic reprogramming and altered cell signaling (for example, activation of WNT/TGF-beta and NOTCH pathways). It is believed that the fusion of TMPRSS2 and ERG is an early driver event of PCa tumorigenesis. The TMPRSS2–ERG fusion transcript is found in prostatic intraepithelial neoplasia (PIN); the presence of this fusion transcript is associated with an unfavorable prognosis and more aggressive PCa [9,10,11].
Predicting PCa recurrence is a nontrivial task, despite the existing stratification schemes for risk groups based on traditional clinical parameters, such as the Gleason score, lymphatic dissemination, and preoperative prostate-specific antigen (PSA). The most widely used method to classify patients is that of D’Amico, which identifies three risk groups: low, intermediate, and high [12]. However, these risk groups do not accurately reflect the likelihood of recurrence in PCa. Biochemical recurrence (BCR) is established at postoperative PSA ≥ 0.2 ng/mL and, as a rule, occurs only in some high-risk patients but can also be observed in some intermediate-risk patients [10,13,14], which are cases with an unfavorable prognosis. Therefore, it is necessary to search for more precise prognostic markers. The TMPRSS2–ERG fusion transcript can be a potential marker of an unfavorable prognosis in PCa.
To date, a number of studies have been published that confirm the association of TMPRSS2–ERG with an unfavorable prognosis. For example, a study of several cohorts of PCa patients found less recurrence-free survival (RFS) for TMPRSS2–ERG-positive PCa cases [15]. At the same time, an important aspect is the quantitative level of expression of the TMPRSS2–ERG fusion transcript and the ERG gene, not just their presence [16]. On the other hand, several studies have shown that TMPRSS2–ERG is a precursor of a favorable prognosis. A recent study showed better survival in TMPRSS2–ERG-positive patients than in TMPRSS2–ERG-negative patients [17]. Several other studies on numerous cohorts of PCa patients also did not reveal a direct relation between TMPRSS2–ERG gene rearrangement and BCR [18,19]. Thus, the data on the association of the TMPRSS2–ERG fusion transcript with BCR are contradictory, and its role in the progression of PCa remains unclear.
In this work, we studied the association between the presence and expression level of the TMPRSS2–ERG fusion transcript and BCR using a cohort of 72 PCa samples obtained from Russian patients. We also searched for potential prognostic markers based on differential gene expression for the TMPRSS2–ERG molecular subtype using RNA–Seq data from the cohort of Russian patients and The Cancer Genome Atlas project (TCGA–PRAD).

2. Materials and Methods

2.1. Materials

The study used two cohorts: 72 tumor samples of PCa obtained from Russian patients and RNA–Seq data of the TCGA–PRAD project. Tumor samples of PCa with paired adjacent morphologically normal tissues were collected and characterized at the P.A. Herzen of the Ministry of Health of Russia (Table 1). The patients provided written informed consent to participate in this study. Samples were collected from patients not undergoing neoadjuvant therapy. Each sample contained a minimum of 70% of tumor cells.
For differential expression analysis, we used RNA–Seq data for locally advanced PCa cases from TCGA–PRAD [20] obtained from patients without neoadjuvant therapy and belonging to the Caucasian population. For these cases, the disease recurrence status and tumor molecular subtype were known (Table 1).

2.2. Methods

2.2.1. Isolation of RNA and Reverse Transcription

Total RNA was isolated from fresh, frozen samples using the MagNA Pure Compact RNA Isolation Kit (Roche, Basel, Switzerland) according to the manufacturer’s protocol. The concentration of the isolated RNA was determined on a Qubit 2.0 fluorometer (Thermo Fisher Scientific, Waltham, MA, USA) using a Qubit RNA BR Assay Kit (Thermo Fisher Scientific). The quality of the isolated RNA was assessed on an Agilent 2100 Bioanalyzer (Agilent Technologies, Santa Clara, CA, USA) using an Agilent RNA 6000 Nano Kit (Agilent Technologies). The RNA integrity number (RIN) was no less than 8.0. Reverse transcription was performed using Mint reverse transcriptase (Evrogen, Moscow, Russia) according to the manufacturer’s protocol.

2.2.2. Quantitative PCR (qPCR)

The TaqMan Gene Expression Assays Hs03063375_ft (Thermo Fisher Scientific) was used to assess the expression level of the TMPRSS2–ERG fusion transcript. The RPN1 gene [21] was used as a control gene (primer and probe sequences for RPN1 [22]). qPCR was performed with an Applied Biosystems 7500 Real-Time PCR System (Thermo Fisher Scientific). The following process was used for amplification: 95 °C for 15 min; 40 cycles at 95 °C for 15 s; 60 °C for 60 s. Each qPCR reaction was repeated three times. To assess the level of expression, the method of relative measurements (ΔCT) was used and calculations were performed using the ATG program (Analysis of Transcription of Genes) [23].

2.2.3. RNA Sequencing

The mRNA libraries were prepared using a TruSeq® Stranded mRNA LT kit (Illumina, San Diego, CA, USA) according to the manufacturer’s protocol. Sequencing was performed on the NextSeq500 System (read length—75 nt, single-end mode) using the NextSeq 500/550 High Output Kit v2.5 (Illumina).

2.2.4. Data Analysis

FastqQC (v.0.11.9, Cambridge, UK) [24] and Trimmomatic (v.0.33, Jülich, Germany) [25] were used for the quality control and trimming of reads, respectively. The STAR splice-aware aligner (v.2.7.1, Cold Spring Harbor, NY, USA) [26] was used to map the reads to the reference genome (GRCh37.p13, GENCODE, Cambridge, UK) [27]. FeatureCounts (Subread package v.1.6.4, Parkville, Australia) [28] was used to calculate the read counts per gene. Differential expression analysis was carried out in the R environment (v.3.6.3, Vienna, Austria) [29] using the edgeR package (v.3.24.3, NSW, Australia) [30]. Gene set enrichment analysis (GSEA) was performed using the clusterProfiler package (v.3.14.3, Guangzhou, China) with the Gene Ontology (GO), Kyoto Encyclopedia of Genes and Genomes (KEGG), and REACTOME databases [31]. The specificity and sensitivity of candidate genes predicting unfavorable prognosis were estimated by the random forest (RF) method and receiver operating characteristic (ROC) analysis with the area under the ROC curve (AUC) calculation using the randomForest (v.4.6-14, Rahway, NJ, USA) [32] and pROC (v.1.17.0.1, Geneva, Switzerland) packages [33]. Both cohorts (Russian patients and TCGA) were used to train and test the random forest model. Each cohort was split multiple times into two groups (70% tumors—training set; 30% tumors—testing set). The impact of TMPRSS2–ERG fusion presence on RFS was accessed by Kaplan–Meier survival analysis using survminer R package (v. 0.4.8, Montpellier, France) [34].

2.2.5. Statistics

The analysis of associations between the presence/level of expression of TMPRSS2–ERG and BCR was performed in the R environment (v.3.6.3) [29]. Pearson’s chi-squared test (χ2) and odds ratio quantity (OR) were used to assess the relationship between the TMPRSS2–ERG transcript presence and the presence of biochemical recurrence. To assess the association between the TMPRSS2–ERG expression level and biochemical recurrence, the Mann–Whitney U-test (MW test) and fold change (FC) quantity were used. Differences were considered statistically significant at a p-value ≤ 0.05.
The quasi-likelihood (QLF test) and the MW tests were used to assess the significance of changes in gene expression. Genes that passed a QLF p-value ≤ 0.05 were considered differentially expressed.

3. Results

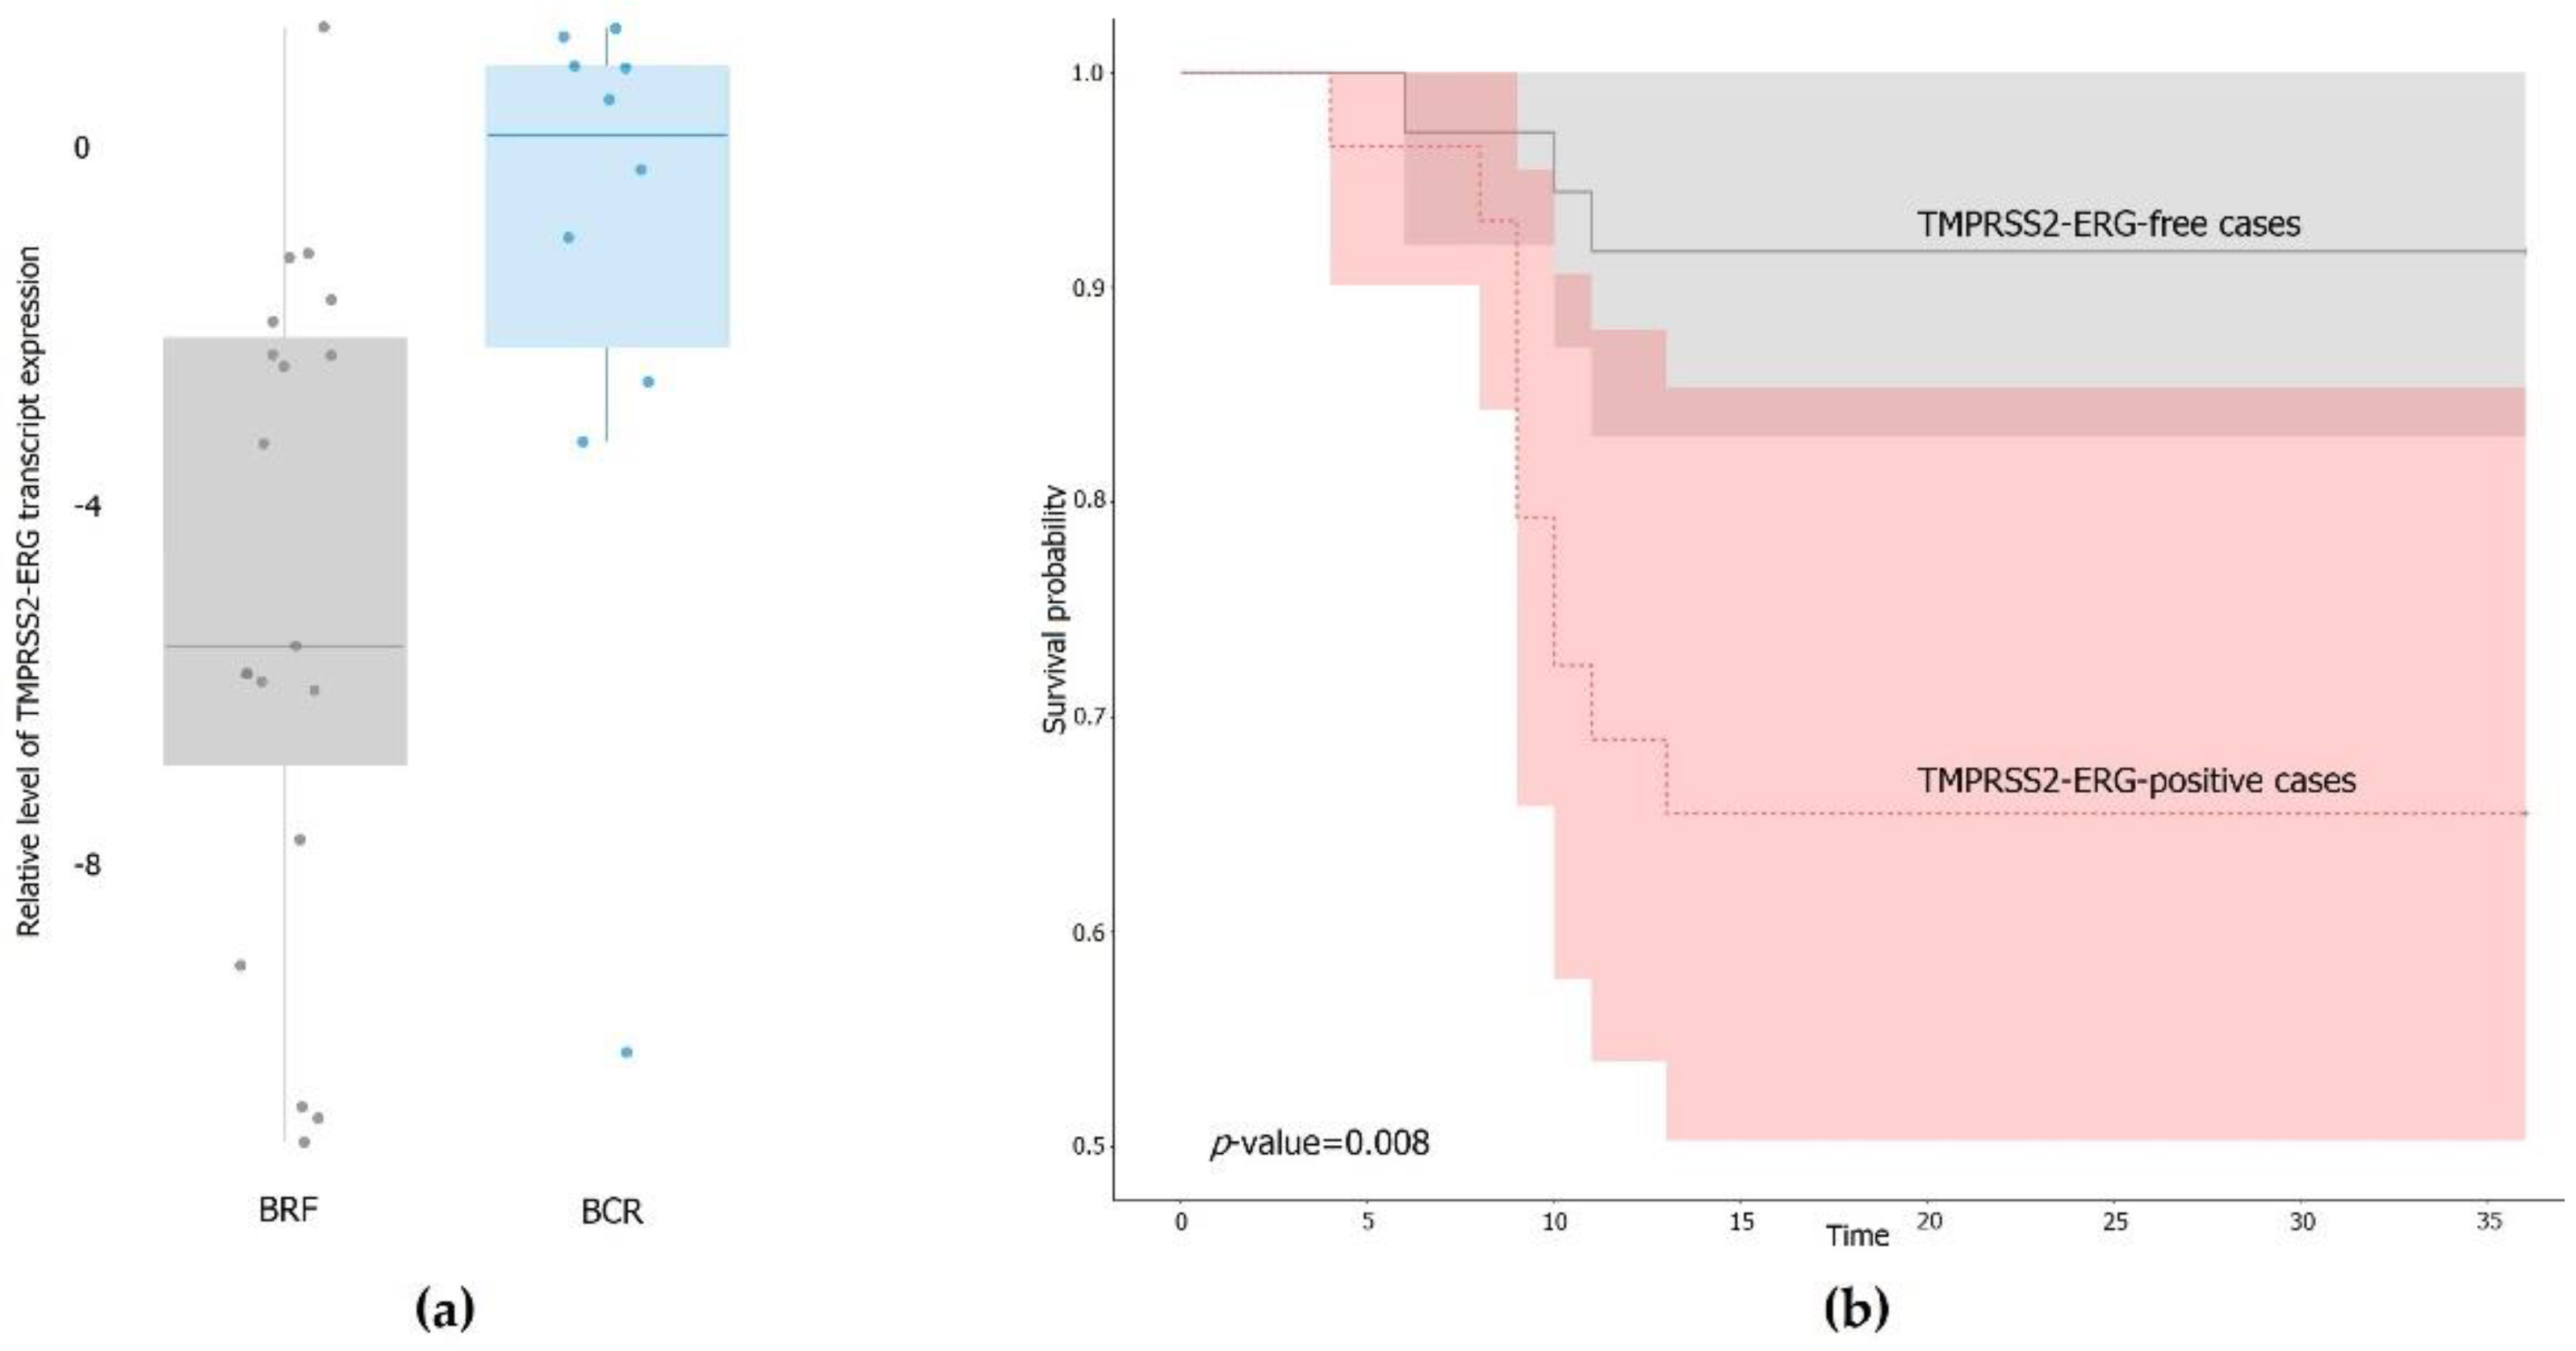
3.1. Expression of the TMPRSS2–ERG Fusion Transcript in PCa Samples

Using qPCR, we assessed the expression of TMPRSS2–ERG transcript in 72 tumor samples of PCa and in paired adjacent normal tissues obtained from Russian patients. In all tested samples of normal prostate tissue, the expression of the TMPRSS2–ERG fusion transcript was not detected. The expression of TMPRSS2–ERG transcript was detected in 50% (36/72) of PCa tumor samples.
Furthermore, the whole cohort was divided into two groups based on postoperative PSA values: (1) BCR (PSA ≥ 0.2 ng/mL) consisting of 13 samples, and (2) the biochemical recurrence-free (BRF, favorable prognosis) group (PSA < 0.2 ng/mL) consisting of 52 samples (seven cases lacked postoperative PSA values data).
For these two groups of samples, factor analysis of the association of TMPRSS2–ERG fusion transcript presence with BCR was performed using the χ2 test and OR value calculation. The OR value predicting the direction of changes was 3.56 with χ2 p-value = 0.165.
To evaluate the expression level of TMPRSS2–ERG transcript, ΔCT was calculated relative to the reference gene (RPN1) for TMPRSS2–ERG-positive samples (n = 36). By analogy with the whole cohort, these samples were also divided into two groups: (1) BCR (10 samples), and (2) BRF (19 samples). There was a significant increase in the expression level of the TMPRSS2–ERG fusion transcript in the BCR group by an average of 5.8 times (p-value = 0.04) (Figure 1a). Survival analysis showed significantly less RFS for TMPRSS2–ERG-positive cases (Figure 1b, p-value = 0.009).
Additionally, we analyzed the association between the presence of the TMPRSS2–ERG fusion transcript and BCR using a cohort of 203 PCa samples from the TCGA–PRAD project, which was also divided into the groups of BCR (n = 52) and BRF (n = 151). The OR value for this cohort was 0.83 with χ2 p-value = 0.80.

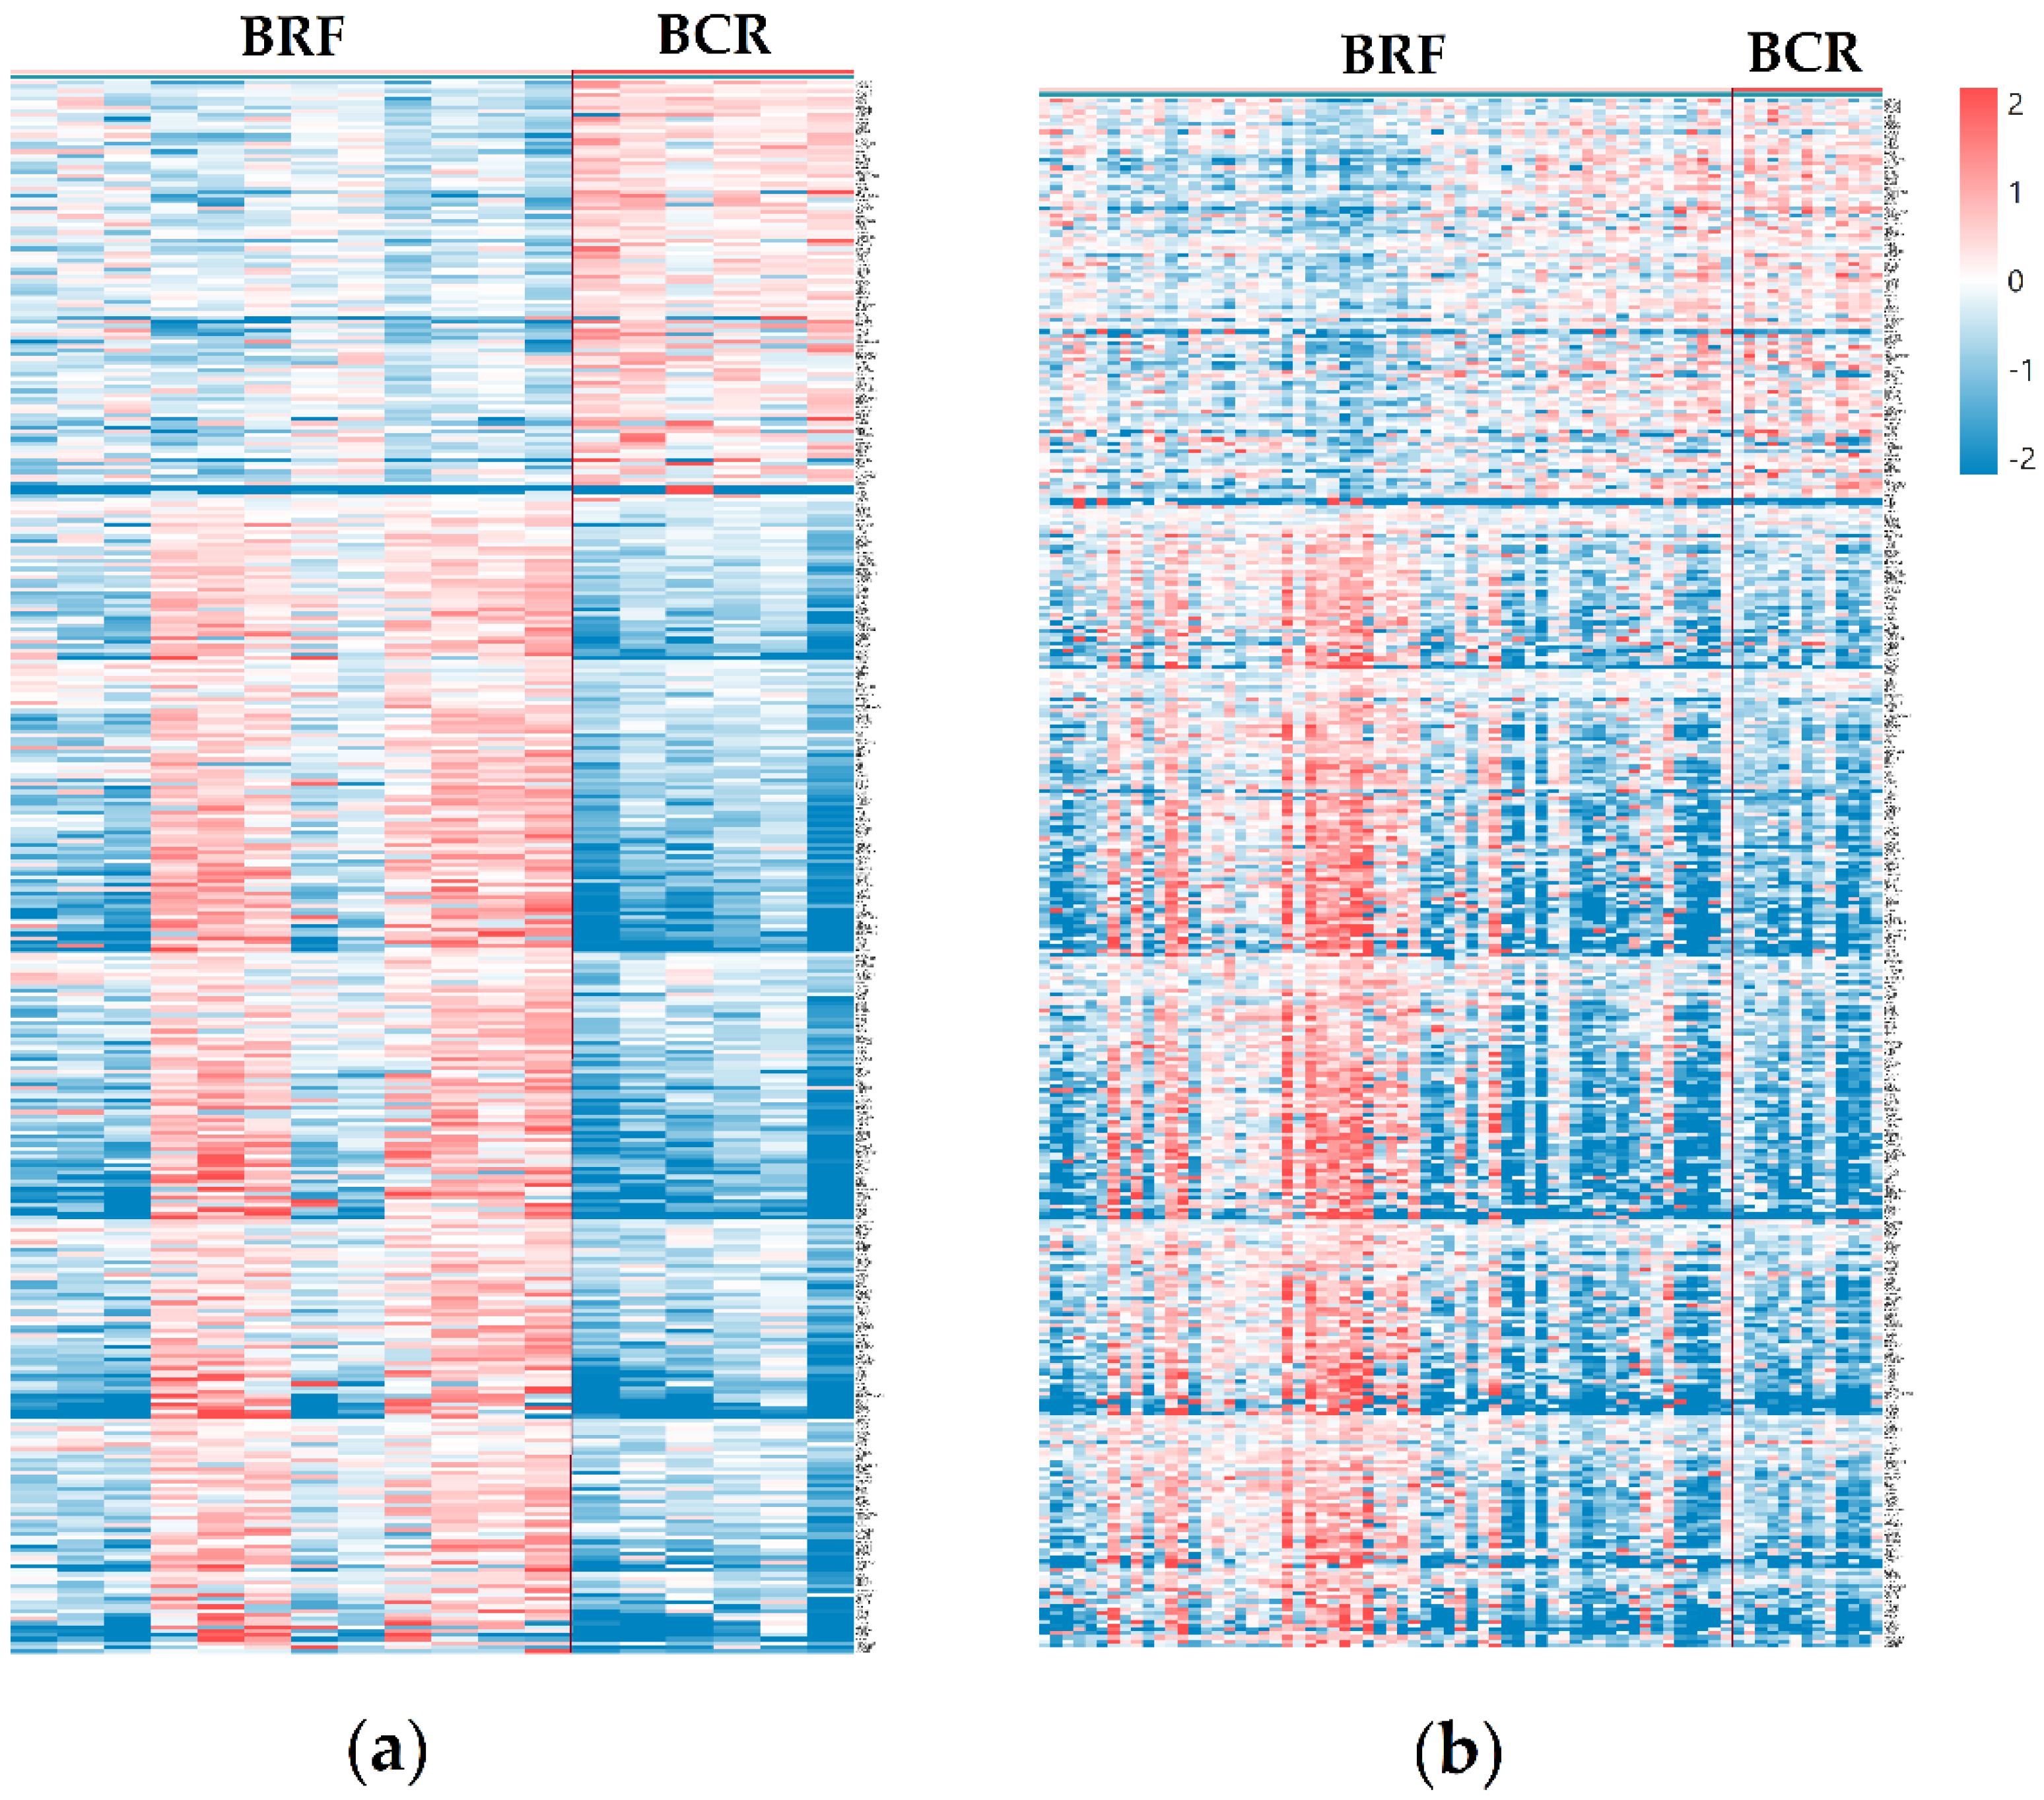
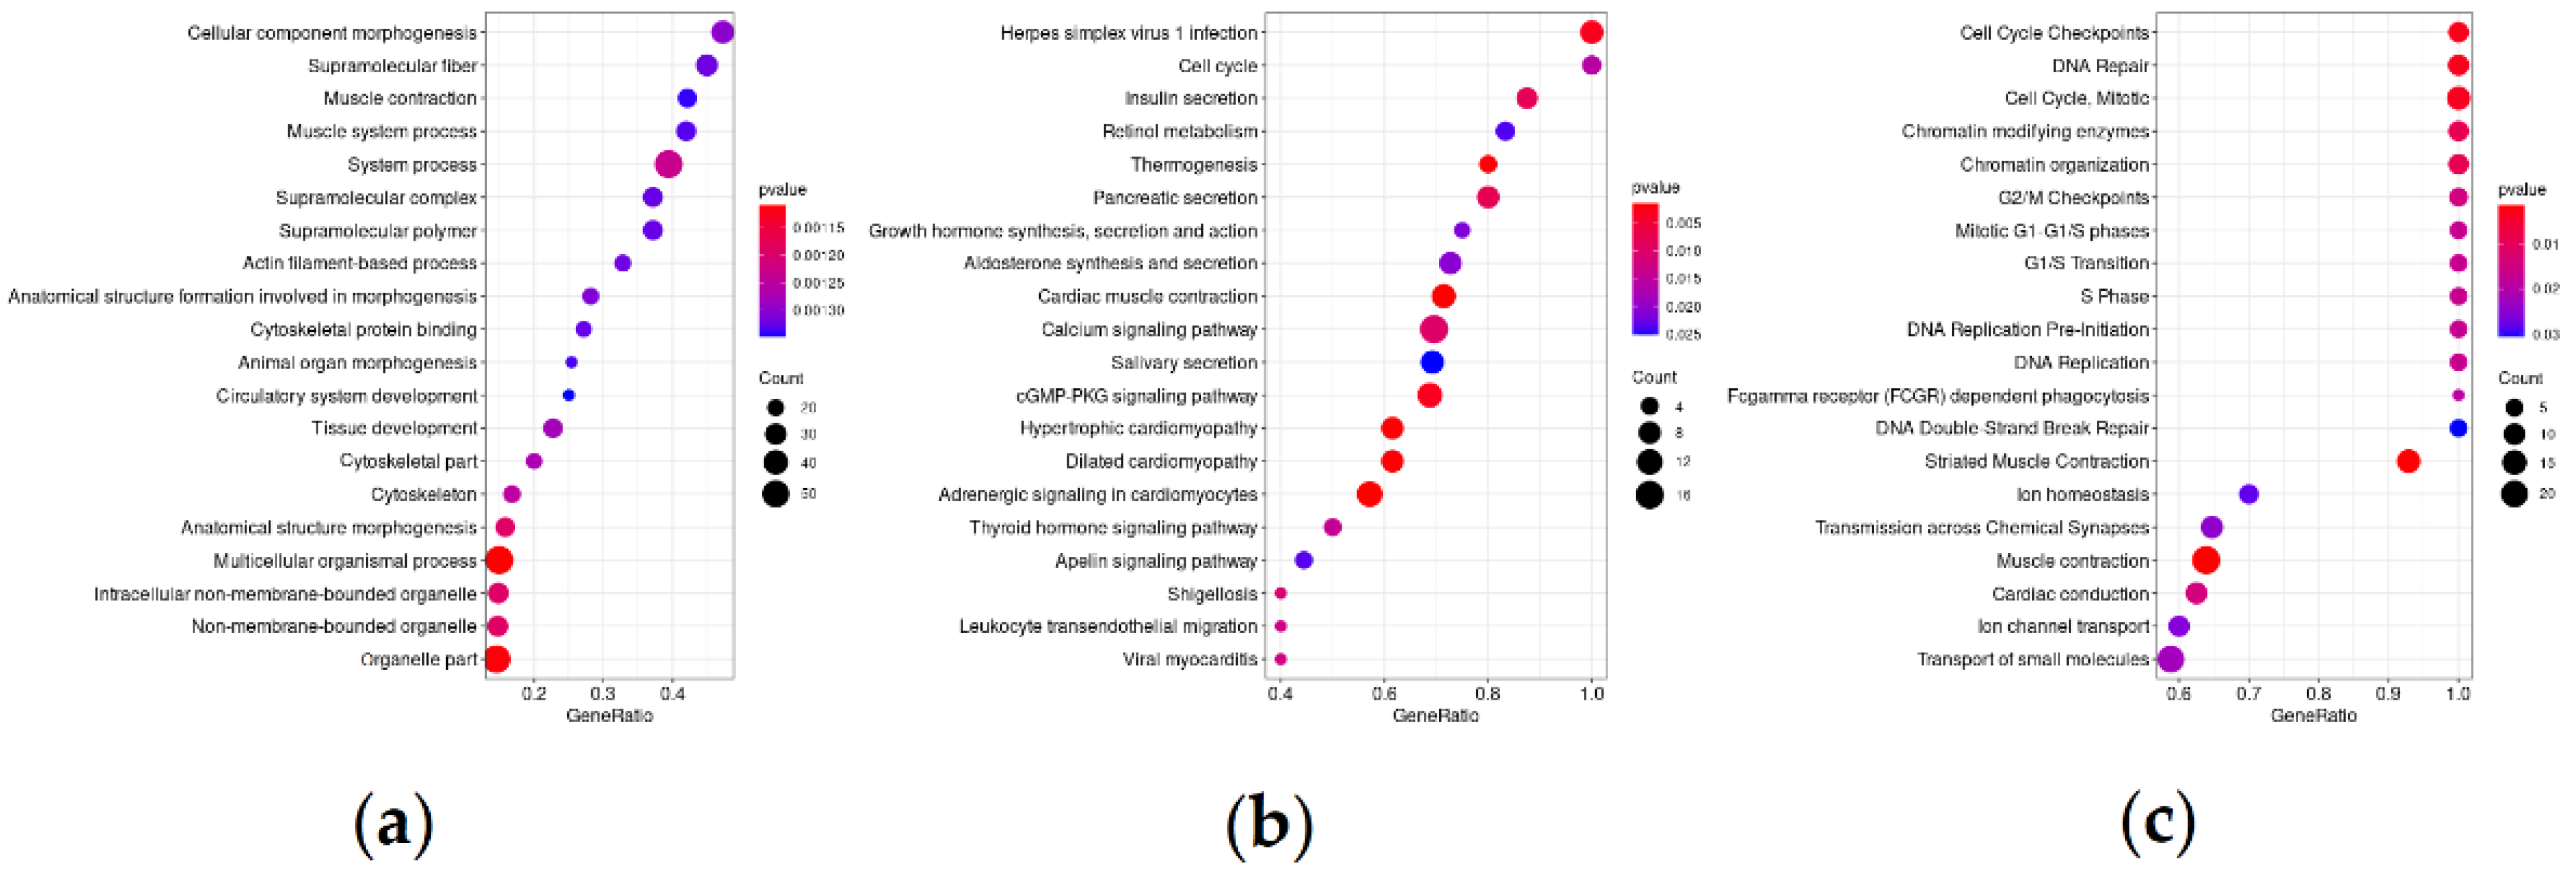
3.2. Differentially Expressed Genes and Significantly Enriched Pathways

Earlier, we performed an analysis of differentially expressed genes (DEGs) between groups of favorable and unfavorable prognoses for the lymph-node-negative LAPC and for the TMPRSS2–ERG-positive LAPC TCGA–PRAD cohort [35].
In the current study, we analyzed differential gene expression using an expanded cohort of PCa samples obtained from Russian patients and the TCGA–PRAD cohort. The following groups of comparisons were formed: (1) BCR versus BRF cases within the TMPRSS2–ERG molecular subtype and (2) BCR versus BRF cases within the TMPRSS2–ERG molecular subtype in the TCGA–PRAD cohort. As a result, 388 DEGs (QLF p-value ≤ 0.05, logCPM ≥ 3) were filtered for BCR within the TMPRSS2–ERG molecular subtype, which overlapped between the two studied cohorts (Figure 2, Supplementary Table S1). A total of 104 identified genes were characterized by an increase in expression in the BCR group within the TMPRSS2–ERG molecular subtype, while the expression levels of 284 genes decreased (Supplementary Table S1).
Using GSEA, enrichment with genes participating in several pathways related to the cytoskeleton, cell cycle, hormones, and secretion (insulin secretion, retinol, growth hormone pathways, calcium signaling), repair, and cell transport was revealed (Figure 3). The complete GSEA results are presented in Supplementary Table S2.

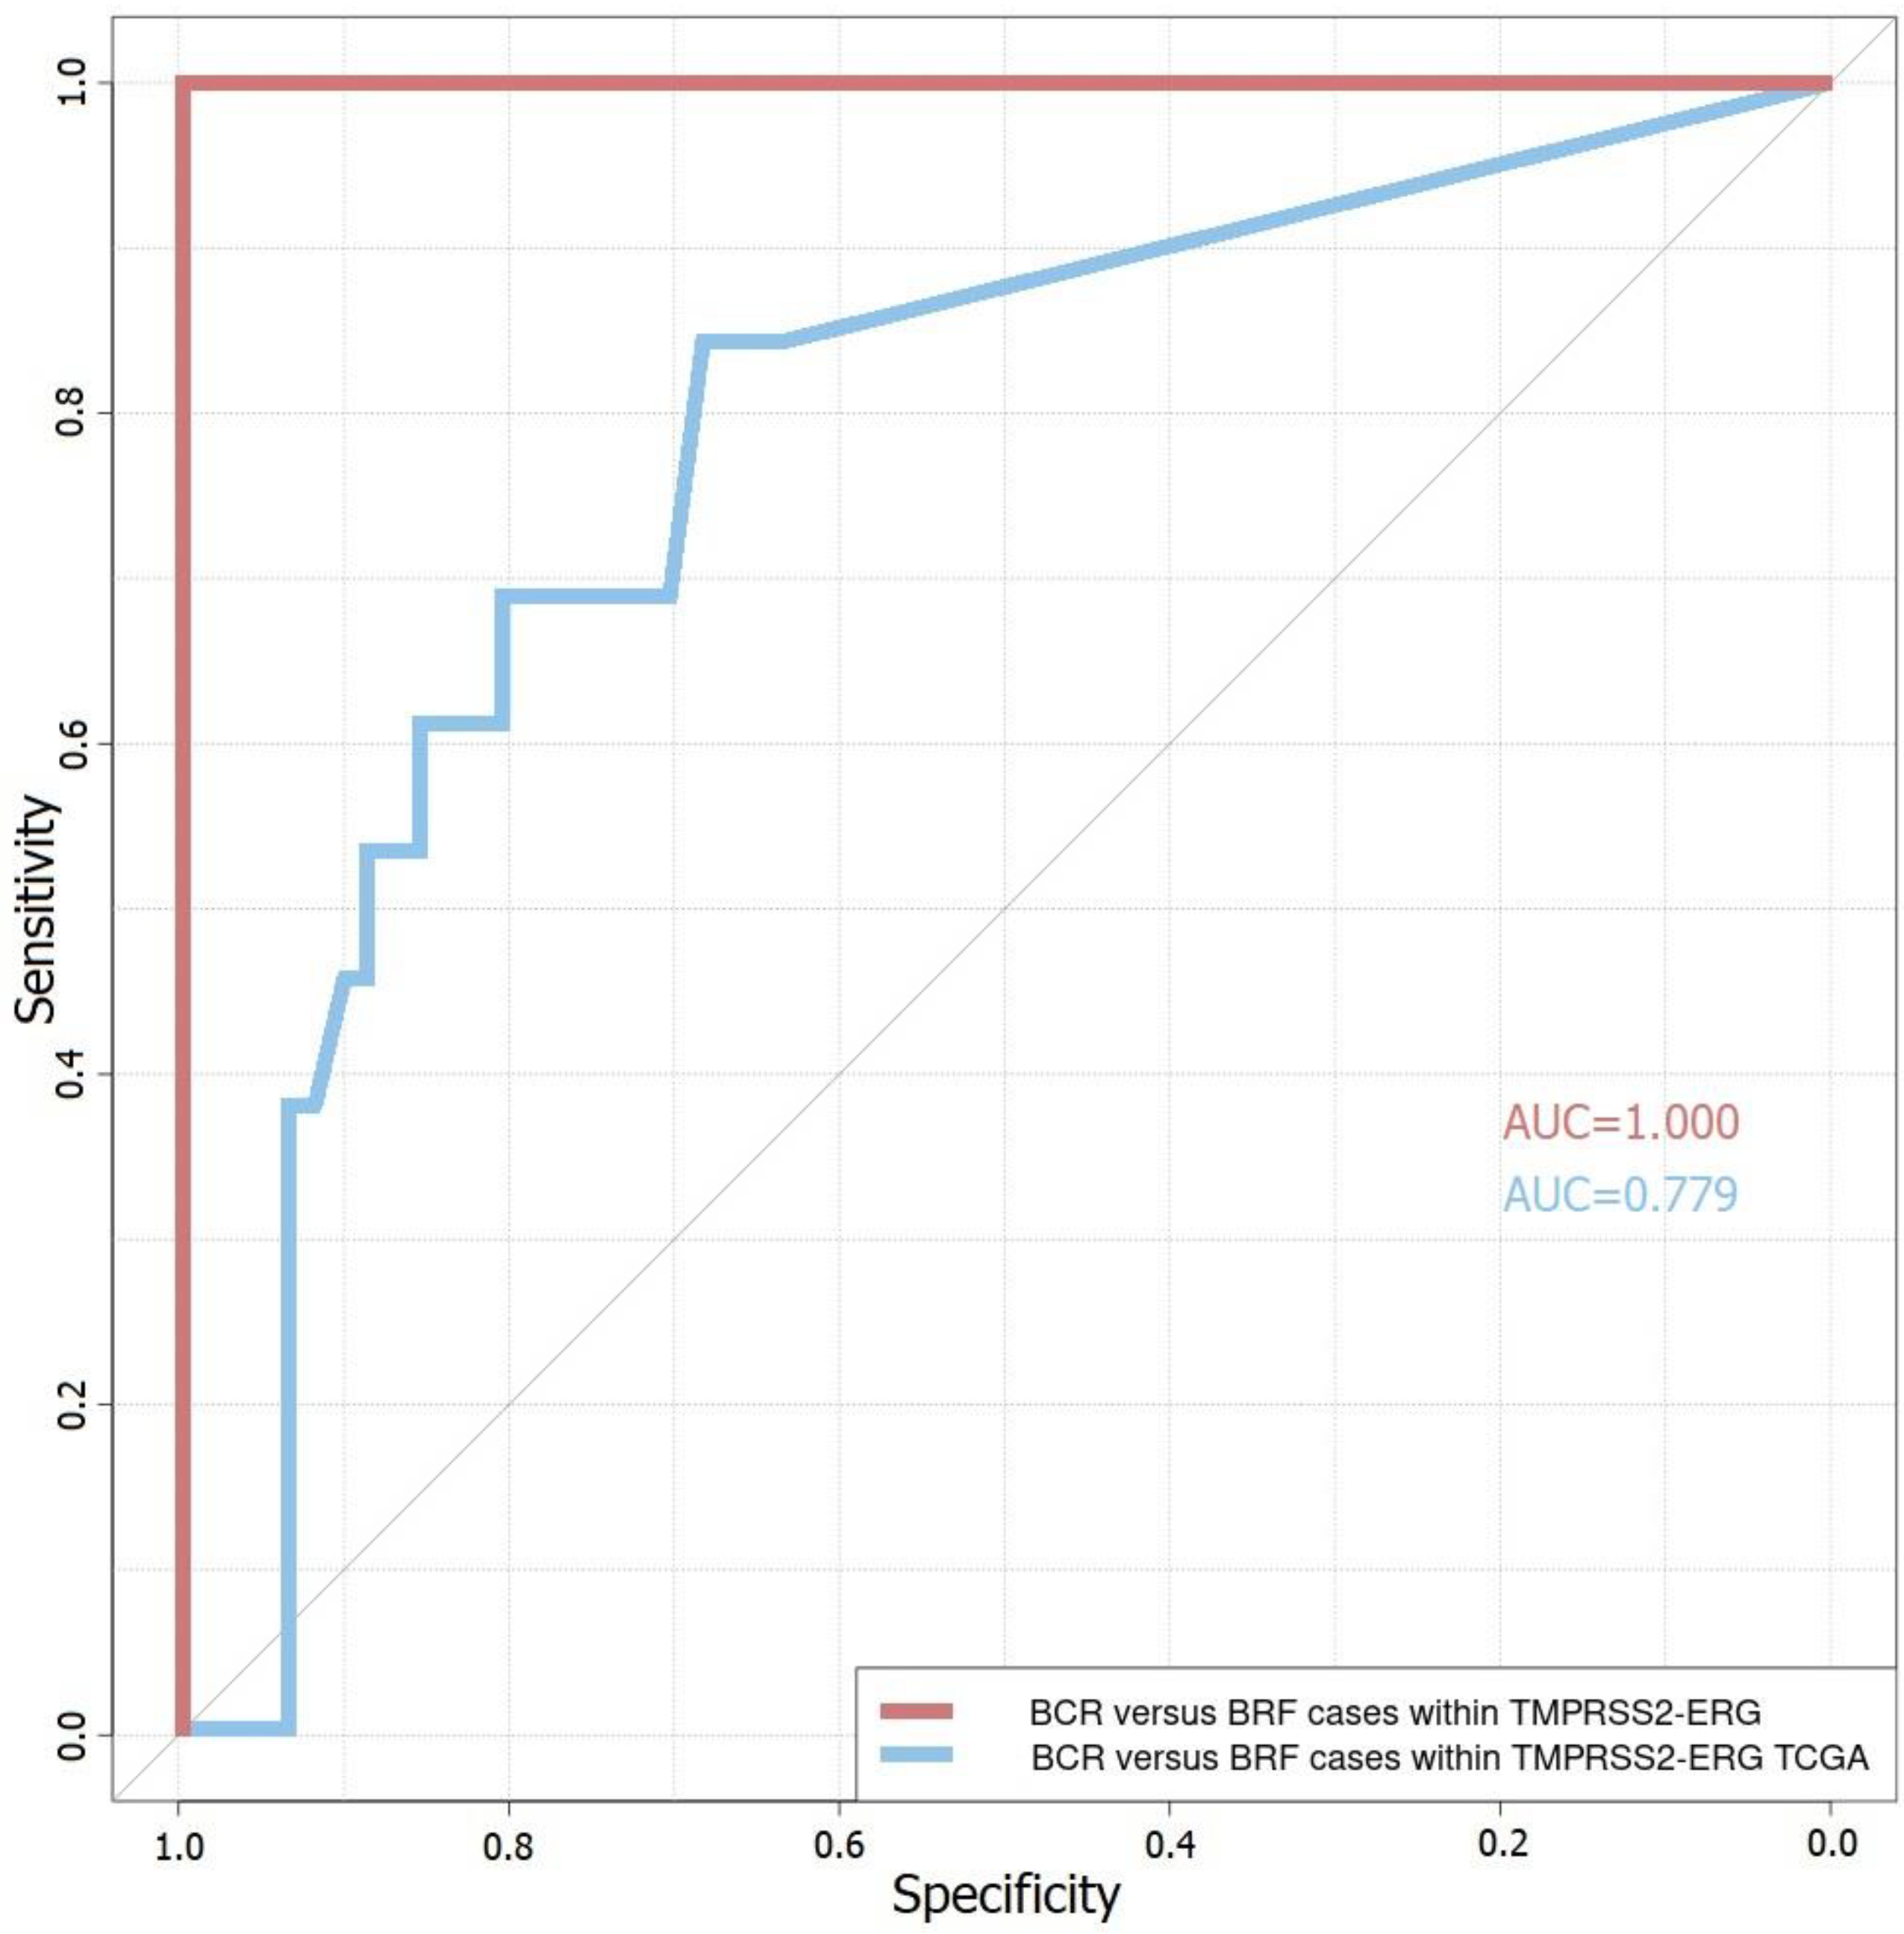
3.3. Four-Gene Prognostic Model

Among the 388 identified DEGs, seven candidate genes were highlighted as the most promising markers of unfavorable prognosis based on the distribution of differential expression between groups in both cohorts: GNL3, ODF2, PAXBP1, QSOX2, SSPO, SYS1, and ZNF302 (Figure 2).
To determine a potential predictive model based on combinations of the aforementioned candidate genes, ROC analysis was performed. The combination of the genes GNL3, QSOX2, SSPO, and SYS1 showed the best prognostic characteristics as a predictive model in both analyzed cohorts (AUC = 1 for the cohort of Russian patients, sensitivity = 1, specificity = 1; AUC = 0.779 for the TCGA cohort, sensitivity = 0.526, specificity = 0.870) (Figure 4). The results of other possible predictive models are presented in Supplementary Table S3. In our research, we identified GNL3, QSOX2, and SSPO as upregulated genes and SYS1 as downregulated for the BCR group within TMPRSS2–ERG-positive PCa (Table 2).

4. Discussion

Currently, the question of whether the presence and/or expression level of the TMPRSS2–ERG fusion transcript is a factor of unfavorable prognosis in PCa remains unclear. Several studies show contradictory results. In this work, we analyzed the association of the presence/expression level of the TMPRSS2–ERG fusion transcript with BCR in PCa.
A significant increase in the level of TMPRSS2–ERG expression was revealed in the BCR group in a cohort of Russian patients. At the same time, no statistically significant association between BCR and the presence of the TMPRSS2–ERG fusion transcript in the tumor was observed for both studied cohorts. However, less recurrence-free survival was observed for TMPRSS2–ERG-positive cases.
Since there is no unambiguous association of the TMPRSS2–ERG transcript with PCa recurrence, and the known markers of PCa do not have sufficient predictive power, the second part of our work was devoted to the search for potential prognostic markers of an unfavorable prognosis of PCa. Given the high biological heterogeneity of PCa [36], the search for potential markers was carried out within the TMPRSS2–ERG molecular sub-type, which is characterized by the highest occurrence (46% of all cases of PCa) [1].
Previously, we searched for potential prognostic markers for the cohort of Russian patients and the TCGA cohort [35,37]. However, we considered potential prognosis markers for a cohort of Russian patients without taking into account the TMPRSS2–ERG molecular subtype in view of the cohort size (n = 32). In addition, in the present study, a different study design was used for the TCGA cohort, including comparison groups and bioinformatic data processing.
As a result of the analysis, we obtained a list of DEGs (388 genes) common to both studied cohorts. The identified genes are involved in molecular pathways related to the regulation of the cytoskeleton, cell cycle and repair pathways, secretion pathways, and hormone signaling. The above pathways have also been associated with an unfavorable prognosis in lymph-node-negative PCa [35].
The following genes were selected as potential markers of unfavorable prognosis: GNL3, ODF2, PAXBP1, QSOX2, SSPO, SYS1, and ZNF302. Based on the results of the ROC analysis, the best primary predictive model that was identified relied on the combination of the GNL3, QSOX2, SSPO, and SYS1 genes (AUC = 1 for the cohort of Russian patients; AUC = 0.779 for the TCGA cohort) for the TMPRSS2–ERG molecular subtype. At the same time, an increase in expression was noted for the GNL3, QSOX2, and SSPO genes, while the expression of the SYS1 gene decreased in the group with an unfavorable prognosis.
The GNL3 gene encodes for guanine nucleotide-binding protein-like 3, also known as the nucleostemin, which is required to maintain the proliferative capacity of stem cells. The nucleostemin is concentrated in the nucleus and extracellular matrix. It stabilizes the MDM2 protein by preventing its ubiquitination and, hence, proteasomal degradation. In this way, the GNL3 protein may interact with p53 and may be involved in tumorigenesis. The QSOX2 gene encodes quiescin sulfhydryl oxidase 2, a member of the sulfhydryl oxidase/quiescin-6 (Q6) family (QSOX1), which are involved in the sensitization of neuro-blastoma cells for IFN-gamma (IFNG)-induced cell death. The QSOX2 protein is localized as QSOX1 in the nucleus, Golgi apparatus, and extracellular matrix.
The SSPO (or SSPOP) is a pseudogene also known as SCO-spondin, which is involved in the modulation of neuronal aggregation. The SSPO may be involved in developmental events during the formation of the central nervous system. There are the metabolism of proteins and the O-glycosylation of TSR domain-containing proteins among its related pathways.
The SYS1 gene encodes the SYS1 Golgi trafficking protein, which forms a complex with ADP-ribosylation factor-related protein ARFRP1 and targets ARFRP1 to the Golgi apparatus. The SYS1 protein is mostly localized in Golgi apparatus and cytosol.
A number of studies have also described the association of GNL3 gene overexpression with tumor progression and poor survival in cancer of the prostate [38], stomach [39], colon [40], breast [41,42], and lung [43]. For three other identified genes (QSOX2, SSPO, and SYS1), we have described potential involvement in PCa for the first time.
In conclusion, the high expression level of the TMPRSS2–ERG fusion transcript was associated with unfavorable prognosis. Despite the lack of significant association of the unfavorable prognosis and presence of the TMPRSS2–ERG fusion transcript, comprehension of the TMPRSS2–ERG fusion transcript status in tumor is important to clarify which PCa prognostic model is appropriate for application. The most perspective prognostic model for TMPRSS2–ERG-positive PCa was based on expression profiles of GNL3, QSOX2, SSPO, and SYS1 genes. The above model demonstrated sufficiently high predictive potential. However, further experimental research to validate this model on an expanded cohort by qPCR is needed.

Supplementary Materials

The following are available online at https://www.mdpi.com/article/10.3390/life11060588/s1, Table S1: DEA results, Table S2: GSEA results, Table S3: ROC results.

Author Contributions

Conceptualization, A.A.K., B.Y.A. and A.V.K.; data curation, V.S.P., Z.G.G., A.A.D., D.Y.T., G.T.S. and K.M.N.; formal analysis, M.V.S., V.S.P., D.Y.T. and G.T.S.; funding acquisition, A.V.K.; investigation, A.A.K., M.S.F. and Z.G.G.; methodology, A.V.S., M.S.F., Z.G.G., N.V.M., A.A.D. and S.V.R.; project administration, G.S.K. and A.V.K.; resources, A.V.K. and S.V.R.; software, E.A.P., S.V.R. and G.S.K.; supervision, A.V.K.; visualization, A.A.K., V.S.P. and N.V.M.; writing—original draft, A.A.K.; writing—review and editing, E.A.P., A.V.S. and G.S.K. All authors have read and agreed to the published version of the manuscript.

Funding

This research was financially supported by the Russian Science Foundation, grant 18-75-10127.

Institutional Review Board Statement

The studies involving human participants were reviewed and approved by the Ethics Committee of P.A. Hertsen Moscow Cancer Research Institute, Ministry of Health of the Russian Federation. The patients/participants provided their written informed consent to participate in this study.

Informed Consent Statement

Not applicable.

Data Availability Statement

PRJNA726203.

Acknowledgments

The authors thank the National Medical Research Center of Radiology for assistance in data interpretation and discussion, and the Center for Precision Genome Editing and Genetic Technologies for Biomedicine, EIMB RAS for providing the computing power and techniques for the data analysis. The authors thank the Institute of Gene Biology for assistance in data interpretation. This work was performed using the equipment of EIMB RAS “Genome” center (http://www.eimb.ru/ru1/ckp/ccu_genome_c.php, accessed on 3 March 2021).

Conflicts of Interest

The authors declare no conflict of interest.

References

  1. The Cancer Genome Atlas Research Network. The Molecular Taxonomy of Primary Prostate Cancer. Cell 2015, 163, 1011–1025. [Google Scholar] [CrossRef] [Green Version]
  2. Arora, K.; Barbieri, C.E. Molecular Subtypes of Prostate Cancer. Curr. Oncol. Rep. 2018, 20, 58. [Google Scholar] [CrossRef]
  3. The Human Protein Atlas. Available online: https://www.proteinatlas.org/ (accessed on 9 April 2021).
  4. Tandefelt, D.G.; Boormans, J.; Hermans, K.; Trapman, J. ETS fusion genes in prostate cancer. Endocr. Relat. Cancer 2014, 21, R143–R152. [Google Scholar] [CrossRef]
  5. Tomlins, S.A.; Rhodes, D.R.; Perner, S.; Dhanasekaran, S.M.; Mehra, R.; Sun, X.-W.; Varambally, S.; Cao, X.; Tchinda, J.; Kuefer, R.; et al. Recurrent Fusion of TMPRSS2 and ETS Transcription Factor Genes in Prostate Cancer. Science 2005, 310, 644–648. [Google Scholar] [CrossRef]
  6. Esgueva, R.; Perner, S.; LaFargue, C.; Scheble, V.; Stephan, C.; Lein, M.; Fritzsche, F.R.; Dietel, M.; Kristiansen, G.; Rubin, M.A. Prevalence of TMPRSS2–ERG and SLC45A3–ERG gene fusions in a large prostatectomy cohort. Mod. Pathol. 2010, 23, 539–546. [Google Scholar] [CrossRef] [Green Version]
  7. Mani, R.-S.; Iyer, M.K.; Cao, Q.; Brenner, J.C.; Wang, L.; Ghosh, A.; Cao, X.; Lonigro, R.J.; Tomlins, S.A.; Varambally, S.; et al. TMPRSS2–ERG-Mediated feed-forward regulation of wild-type erg in human prostate cancers. Cancer Res. 2011, 71, 5387–5392. [Google Scholar] [CrossRef] [PubMed] [Green Version]
  8. Zammarchi, F.; Boutsalis, G.; Cartegni, L. 5′ UTR control of native erg and of Tmprss2:Erg variants activity in prostate cancer. PLoS ONE 2013, 8, e49721. [Google Scholar] [CrossRef] [Green Version]
  9. Hägglöf, C.; Hammarsten, P.; Strömvall, K.; Egevad, L.; Josefsson, A.; Stattin, P.; Granfors, T.; Bergh, A. TMPRSS2-ERG expression predicts prostate cancer survival and associates with stromal biomarkers. PLoS ONE 2014, 9, e86824. [Google Scholar] [CrossRef] [Green Version]
  10. Pettersson, A.; Graff, R.E.; Bauer, S.R.; Pitt, M.J.; Lis, R.T.; Stack, E.C.; Martin, N.E.; Kunz, L.; Penney, K.L.; Ligon, A.H.; et al. The TMPRSS2:ERG rearrangement, erg expression, and prostate cancer outcomes: A cohort study and meta-analysis. Cancer Epidemiol. Biomark. Prev. 2012, 21, 1497–1509. [Google Scholar] [CrossRef] [Green Version]
  11. Sabaliauskaite, R.; Jarmalaite, S.; Petroska, D.; Dasevicius, D.; Laurinavicius, A.; Jankevicius, F.; Lazutka, J.R. Combined analysis ofTMPRSS2-ERGandTERTfor improved prognosis of biochemical recurrence in prostate cancer. Genes Chromosom. Cancer 2012, 51, 781–791. [Google Scholar] [CrossRef] [PubMed]
  12. D’Amico, A.V.; Whittington, R.; Malkowicz, S.B.; Schultz, D.; Blank, K.; Broderick, G.; Tomaszewski, J.E.; Renshaw, A.A.; Kaplan, I.; Beard, C.J.; et al. Biochemical outcome after radical prostatectomy, external beam radiation therapy, or interstitial radiation therapy for clinically localized prostate cancer. JAMA 1998, 280, 969–974. [Google Scholar] [CrossRef]
  13. Cucchiara, V.; Cooperberg, M.R.; Dall’Era, M.; Lin, D.W.; Montorsi, F.; Schalken, J.A.; Evans, C.P. Genomic Markers in Prostate Cancer Decision Making. Eur. Urol. 2018, 73, 572–582. [Google Scholar] [CrossRef]
  14. Rebello, R.J.; Oing, C.; Knudsen, K.E.; Loeb, S.; Johnson, D.C.; Reiter, R.E.; Gillessen, S.; Van der Kwast, T.; Bristow, R.G. Prostate cancer. Nat. Rev. Dis. Prim. 2021, 7, 1–27. [Google Scholar] [CrossRef]
  15. Barwick, B.G.; Abramovitz, M.; Kodani, M.; Moreno, C.S.; Nam, R.; Tang, W.; Bouzyk, M.; Seth, A.; Leyland-Jones, B. Prostate cancer genes associated with TMPRSS2–ERG gene fusion and prognostic of biochemical recurrence in multiple cohorts. Br. J. Cancer 2010, 102, 570–576. [Google Scholar] [CrossRef]
  16. Font-Tello, A.; Juanpere, N.; de Muga, S.; Lorenzo, M.; Lorente, J.A.; Fumado, L.; Serrano, L.; Serrano, S.; Lloreta, J.; Hernández, S. Association of ERG and TMPRSS2-ERG with grade, stage, and prognosis of prostate cancer is dependent on their expression levels. Prostate 2015, 75, 1216–1226. [Google Scholar] [CrossRef] [PubMed]
  17. Kim, S.H.; Kim, S.H.; Joung, J.Y.; Lee, G.K.; Hong, E.K.; Kang, K.M.; Yu, A.; Nam, B.H.; Chung, J.; Seo, H.K.; et al. Overexpression of ERG and Wild-Type PTEN Are Associated with Favorable Clinical Prognosis and Low Biochemical Recurrence in Prostate Cancer. PLoS ONE 2015, 10, e0122498. [Google Scholar] [CrossRef]
  18. Liu, R.; Zhou, J.; Xia, S.; Li, T. The impact of PTEN deletion and ERG rearrangement on recurrence after treatment for prostate cancer: A systematic review and meta-analysis. Clin. Transl. Oncol. 2020, 22, 694–702. [Google Scholar] [CrossRef] [PubMed]
  19. Gerke, J.S.; Orth, M.F.; Tolkach, Y.; Romero-Pérez, L.; Wehweck, F.S.; Stein, S.; Musa, J.; Knott, M.M.; Hölting, T.L.; Li, J.; et al. Integrative clinical transcriptome analysis reveals TMPRSS2-ERG dependency of prognostic biomarkers in prostate adenocarcinoma. Int. J. Cancer 2020, 146, 2036–2046. [Google Scholar] [CrossRef] [Green Version]
  20. GDC. Available online: https://portal.gdc.cancer.gov (accessed on 3 February 2021).
  21. Krasnov, G.S.; Kudryavtseva, A.V.; Snezhkina, A.V.; Lakunina, V.A.; Beniaminov, A.D.; Melnikova, N.V.; Dmitriev, A.A. Pan-Cancer Analysis of TCGA Data Revealed Promising Reference Genes for qPCR Normalization. Front. Genet. 2019, 10, 97. [Google Scholar] [CrossRef] [Green Version]
  22. Krasnov, G.; Oparina, N.; Dmitriev, A.A.; Kudryavtseva, A.; Anedchenko, E.A.; Kondrat’Eva, T.T.; Zabarovsky, E.R.; Senchenko, V. RPN1, a new reference gene for quantitative data normalization in lung and kidney cancer. Mol. Biol. 2011, 45, 211–220. [Google Scholar] [CrossRef]
  23. Melnikova, N.V.; Dmitriev, A.A.; Belenikin, M.S.; Koroban, N.V.; Speranskaya, A.S.; Krinitsina, A.A.; Krasnov, G.S.; Lakunina, V.A.; Snezhkina, A.V.; Sadritdinova, A.F.; et al. Identification, Expression Analysis, and Target Prediction of Flax Genotroph MicroRNAs Under Normal and Nutrient Stress Conditions. Front. Plant Sci. 2016, 7, 399. [Google Scholar] [CrossRef] [Green Version]
  24. Babraham Bioinformatics—FastQC A Quality Control Tool for High throughput Sequence Data. Available online: https://www.bioinformatics.babraham.ac.uk/projects/fastqc/ (accessed on 3 March 2021).
  25. Bolger, A.M.; Lohse, M.; Usadel, B. Trimmomatic: A flexible trimmer for Illumina sequence data. Bioinformatics 2014, 30, 2114–2120. [Google Scholar] [CrossRef] [PubMed] [Green Version]
  26. Dobin, A.; Davis, C.A.; Schlesinger, F.; Drenkow, J.; Zaleski, C.; Jha, S.; Batut, P.; Chaisson, M.; Gingeras, T.R. STAR: Ultrafast universal RNA-seq aligner. Bioinformatics 2013, 29, 15–21. [Google Scholar] [CrossRef] [PubMed]
  27. GENCODE—Human Release 19. Available online: https://www.gencodegenes.org/human/release_19.html (accessed on 25 April 2021).
  28. Liao, Y.; Smyth, G.K.; Shi, W. featureCounts: An efficient general purpose program for assigning sequence reads to genomic features. Bioinformatics 2013, 30, 923–930. [Google Scholar] [CrossRef] [PubMed] [Green Version]
  29. R: The R Project for Statistical Computing. Available online: https://www.r-project.org/ (accessed on 3 March 2021).
  30. Robinson, M.D.; McCarthy, D.J.; Smyth, G.K. edgeR: A Bioconductor package for differential expression analysis of digital gene expression data. Bioinformatics 2010, 26, 139–140. [Google Scholar] [CrossRef] [PubMed] [Green Version]
  31. Yu, G.; Wang, L.-G.; Han, Y.; He, Q.-Y. clusterProfiler: An R package for comparing biological themes among gene clusters. OMICS A J. Integr. Biol. 2012, 16, 284–287. [Google Scholar] [CrossRef]
  32. randomForest Package—Rdocumentation. Available online: https://www.rdocumentation.org/packages/randomForest/versions/4.6-14 (accessed on 3 March 2021).
  33. Robin, X.A.; Turck, N.; Hainard, A.; Tiberti, N.; Lisacek, F.; Sanchez, J.-C.; Muller, M.J. pROC: An open-source package for R and S+ to analyze and compare ROC curves. BMC Bioinform. 2011, 12, 77. [Google Scholar] [CrossRef]
  34. survminer: Survival Analysis and Visualization. Available online: https://github.com/kassambara/survminer (accessed on 3 March 2021).
  35. Pudova, E.A.; Lukyanova, E.N.; Nyushko, K.M.; Mikhaylenko, D.S.; Zaretsky, A.R.; Snezhkina, A.V.; Savvateeva, M.V.; Kobelyatskaya, A.A.; Melnikova, N.V.; Volchenko, N.N.; et al. Differentially Expressed Genes Associated With Prognosis in Locally Advanced Lymph Node-Negative Prostate Cancer. Front. Genet. 2019, 10, 730. [Google Scholar] [CrossRef]
  36. Pernar, C.H.; Ebot, E.M.; Wilson, K.M.; Mucci, L.A. The Epidemiology of Prostate Cancer. Cold Spring Harb. Perspect. Med. 2018, 8, a030361. [Google Scholar] [CrossRef]
  37. Kudryavtseva, A.V.; Lukyanova, E.N.; Kharitonov, S.L.; Nyushko, K.M.; Krasheninnikov, A.A.; Pudova, E.A.; Guvatova, Z.G.; Alekseev, B.Y.; Kiseleva, M.V.; Kaprin, A.D.; et al. Bioinformatic identification of differentially expressed genes associated with prognosis of locally advanced lymph node-positive prostate cancer. J. Bioinform. Comput. Biol. 2019, 17, 1950003. [Google Scholar] [CrossRef]
  38. Lee, M.; Williams, K.A.; Hu, Y.; Andreas, J.; Patel, S.J.; Zhang, S.; Crawford, N.P.S. GNL3 and SKA3 are novel prostate cancer metastasis susceptibility genes. Clin. Exp. Metastasis 2015, 32, 769–782. [Google Scholar] [CrossRef] [PubMed]
  39. Chen, J.; Dong, S.; Hu, J.; Duan, B.; Yao, J.; Zhang, R.; Zhou, H.; Sheng, H.; Gao, H.; Li, S.; et al. Guanine nu-cleotide binding protein-like 3 is a potential prognosis indicator of gastric cancer. Int. J. Clin. Exp. Pathol. 2015, 8, 13273–13278. [Google Scholar]
  40. Tang, X.; Zha, L.; Li, H.; Liao, G.; Huang, Z.; Peng, X.; Wang, Z. Upregulation of GNL3 expression promotes colon cancer cell proliferation, migration, invasion and epithelial-mesenchymal transition via the Wnt/β-catenin signaling pathway. Oncol. Rep. 2017, 38, 2023–2032. [Google Scholar] [CrossRef] [PubMed] [Green Version]
  41. Sami, M.M.; Hachim, M.Y.; Hachim, I.Y.; Elbarkouky, A.H.; López-Ozuna, V.M. Nucleostemin expression in breast cancer is a marker of more aggressive phenotype and unfavorable patients’ outcome. Medicine 2019, 98, e14744. [Google Scholar] [CrossRef] [PubMed]
  42. Kobayashi, T.; Masutomi, K.; Tamura, K.; Moriya, T.; Yamasaki, T.; Fujiwara, Y.; Takahashi, S.; Yamamoto, J.; Tsuda, H. Nucleostemin expression in invasive breast cancer. BMC Cancer 2014, 14, 215. [Google Scholar] [CrossRef] [PubMed] [Green Version]
  43. Li, W.; Li, N.; Gao, L.; You, C. Integrated analysis of the roles and prognostic value of RNA binding proteins in lung adenocarcinoma. PeerJ 2020, 8, e8509. [Google Scholar] [CrossRef]
Figure 1. TMPRSS2–ERG fusion transcript in PCa samples. (a) Relative level of transcript expression in positive PCa samples. Y axis is relative level of TMPRSS2–ERG transcript expression (log2 transformation). BCR—biochemical recurrence group (blue), BRF—biochemical recurrence-free group (gray). (b) Recurrence-free survival (RFS) curves (with 95% CI—shaded areas) for TMPRSS2–ERG-free cases (grey) and TMPRSS2–ERG-positive cases (red). X axis is time in months, Y is the survival probability.
Life 11 00588 g001
Figure 2. Heatmap of 388 differential expressed genes between BCR and BRF for TMPRSS2–ERG molecular subtype of the cohort of Russian patients and TCGA–PRAD cohort. (a) BCR versus BRF cases within TMPRSS2–ERG molecular subtype; (b) BCR versus BRF cases within TMPRSS2–ERG molecular subtype in TCGA–PRAD cohort. BCR—biochemical recurrence group, BRF—biochemical recurrence-free group. Red color indicates upregulated genes, blue—downregulated.
Life 11 00588 g002
Figure 3. Dotplots showing top 20 enriched pathways. Y axes—pathways, X—gene ratio (number of input genes for this pathway/number of genes for this pathway), count—number of input genes for this pathway. (a) GO; (b) KEGG; (c) Reactome.
Life 11 00588 g003
Figure 4. The ROC curves based on GNL3, QSOX2, SSPO, and SYS1 gene expression within TMPRSS2–ERG-positive PCa. BCR—biochemical recurrence group, BRF—biochemical recurrence-free group; red line—ROC curve for Russian patient cohort (AUC = 1.000), blue line—TCGA–PRAD cohort (AUC = 0.779).
Life 11 00588 g004
Table 1. Clinical and pathological characteristics of the studied cohorts.
CriterionCohort of Russian
Patients with PCa
TCGA–PRAD
Cohort
PCa samples, total
Age (years), mean (range)
72203
63 (41–73)62 (46–78)
pT, npT3a3598
pT3b37105
pN, npN043139
pN12964
pM, npM072203
pM100
Gleason score, n678
74177
81030
9138
1012
Biochemical recurrence (PSA ≥ 0.2 ng/mL), n1363
Table 2. Differentially expressed genes associated with biochemical recurrence within TMPRSS2–ERG molecular subtype included in the prognostic model on ROC analysis. FC—fold change, logCPM—log2 counts per million, QLF—quasi-likelihood F-test, MW—Mann-Whitney U-test.
Russian PatientsTCGA–PRAD
GeneFClogCPMQLF
p-Value
MW
p-Value
FClogCPMQLF
p-Value
MW
p-Value
GNL31.377.270.00950.00321.297.270.00430.0048
QSOX21.455.040.00860.00691.415.070.00050.0002
SSPO2.654.620.00080.00832.083.320.00160.0012
SYS1−1.334.900.00730.0001−1.235.400.00680.0052
Publisher’s Note: MDPI stays neutral with regard to jurisdictional claims in published maps and institutional affiliations.

