
Orthosiphon stamineus Proteins Alleviate Hydrogen Peroxide Stress in SH-SY5Y Cells


Abstract
1. Introduction
2. Materials and Methods
2.1. Materials, Chemicals, and Apparatuses
2.2. Software and Equipment
2.3. Experimental Design
2.3.1. Extraction and Identification of Proteins by Nanoflow Liquid Chromatography Electrospray Ionization Coupled with Tandem Mass Spectrometry/Mass Spectrometry (Nanoflow-ESI-LCMS/MS)
2.3.2. SH-SY5Y Cells—Initial Culture, Sub-Culture, and Seeding Conditions
2.3.3. Evaluation of Cytotoxic Effects of OSLPs on SH-SY5Y Cells (24 and 48 h)
2.3.4. Hydrogen Peroxide (H2O2) Induction and Determination of Half-Maximal Inhibitory Concentration (IC50)
2.3.5. Evaluation of OSLP Protective Effects on SH-SY5Y Cells
2.3.6. Microscopic Examination Using Bright-Field Imaging
2.4. Protein Expression Study
2.4.1. Protein Expression Profiling with Mass Spectrometry-Based Label-Free Quantitative Proteomics (LFQ)
2.4.2. Protein Extraction from SH-SY5Y Cells
2.4.3. Protein Estimation by Bradford Protein Assay
2.4.4. In-Solution Digestion of Proteins
2.4.5. De-Salting of Proteins
2.4.6. Mass-Spectrometry-Based Label-Free Quantitative Proteomics (LFQ) Using Nanoflow-ESI-LCMS/MS
2.4.7. Peptide and Protein Identification by Automated De Novo Sequencing and LFQ Analysis
2.5. Bioinformatics Analysis
2.6. Statistical Analysis
3. Results
3.1. Evaluation of Cytotoxic Effects of OSLP on SH-SY5Y Cells (24 and 48 h)
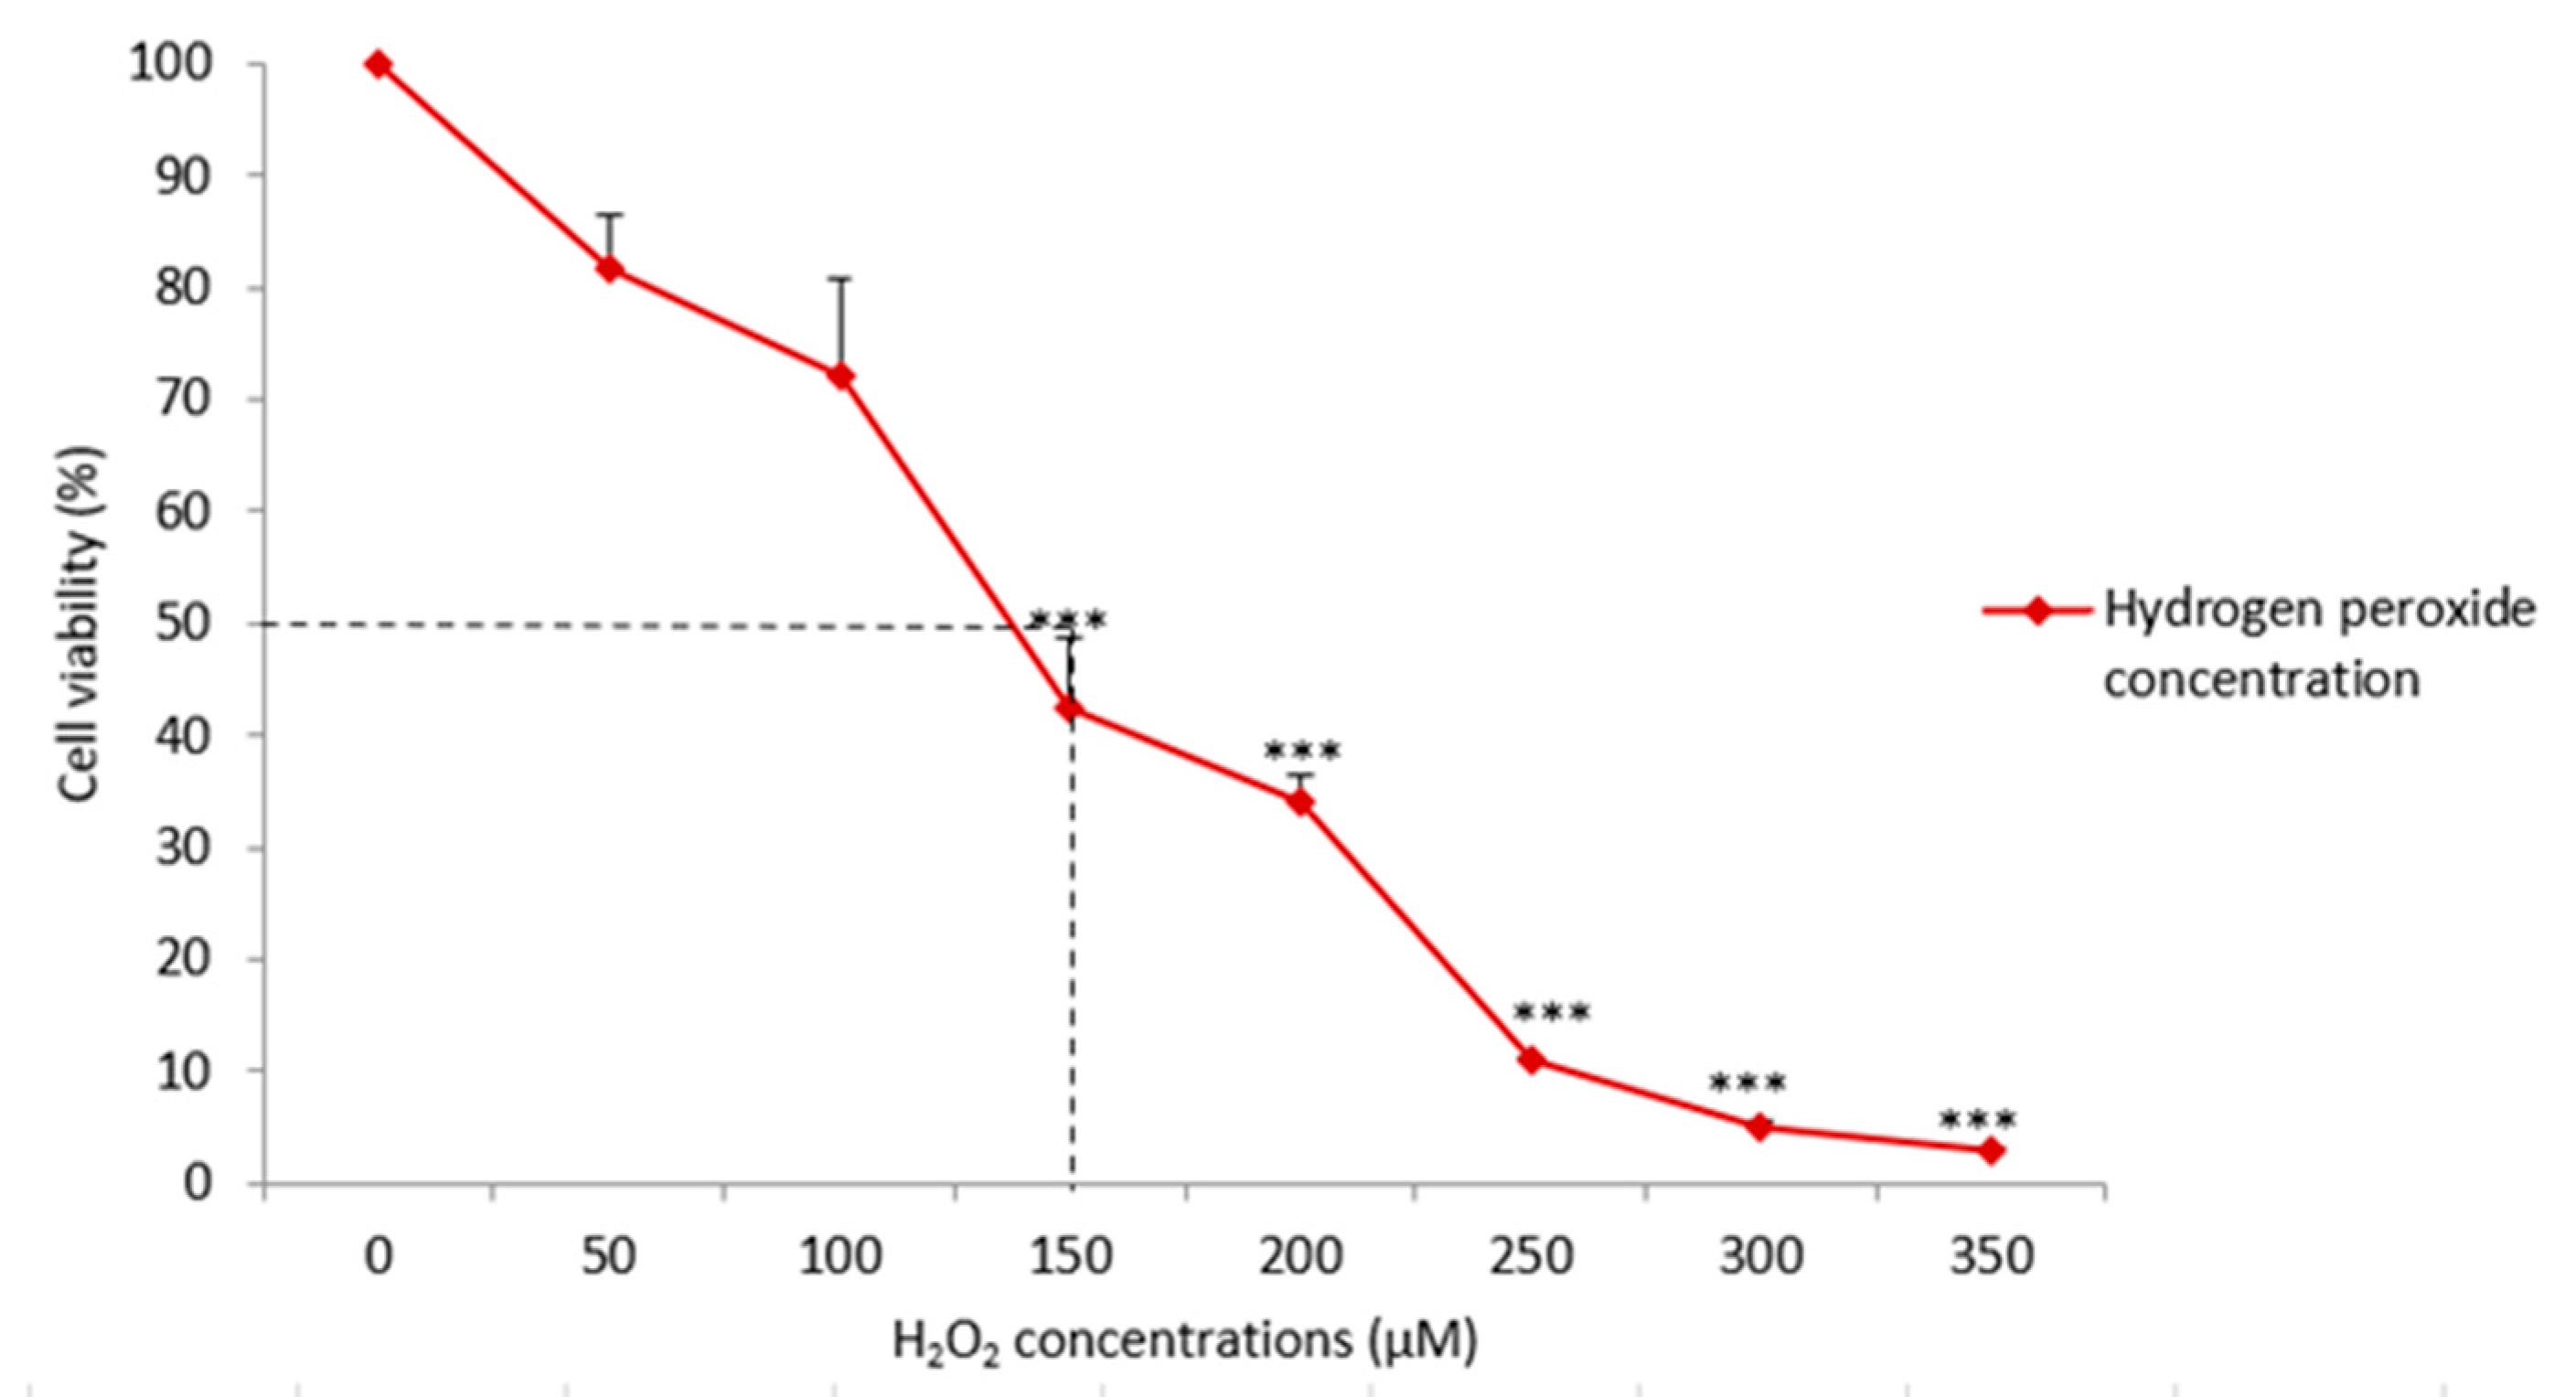
3.2. Hydrogen Peroxide (H2O2) Induction and Determination of Half-Maximal Inhibitory Concentration (IC50)
3.3. Evaluation of OSLP Protective Effects on SH-SY5Y Cells
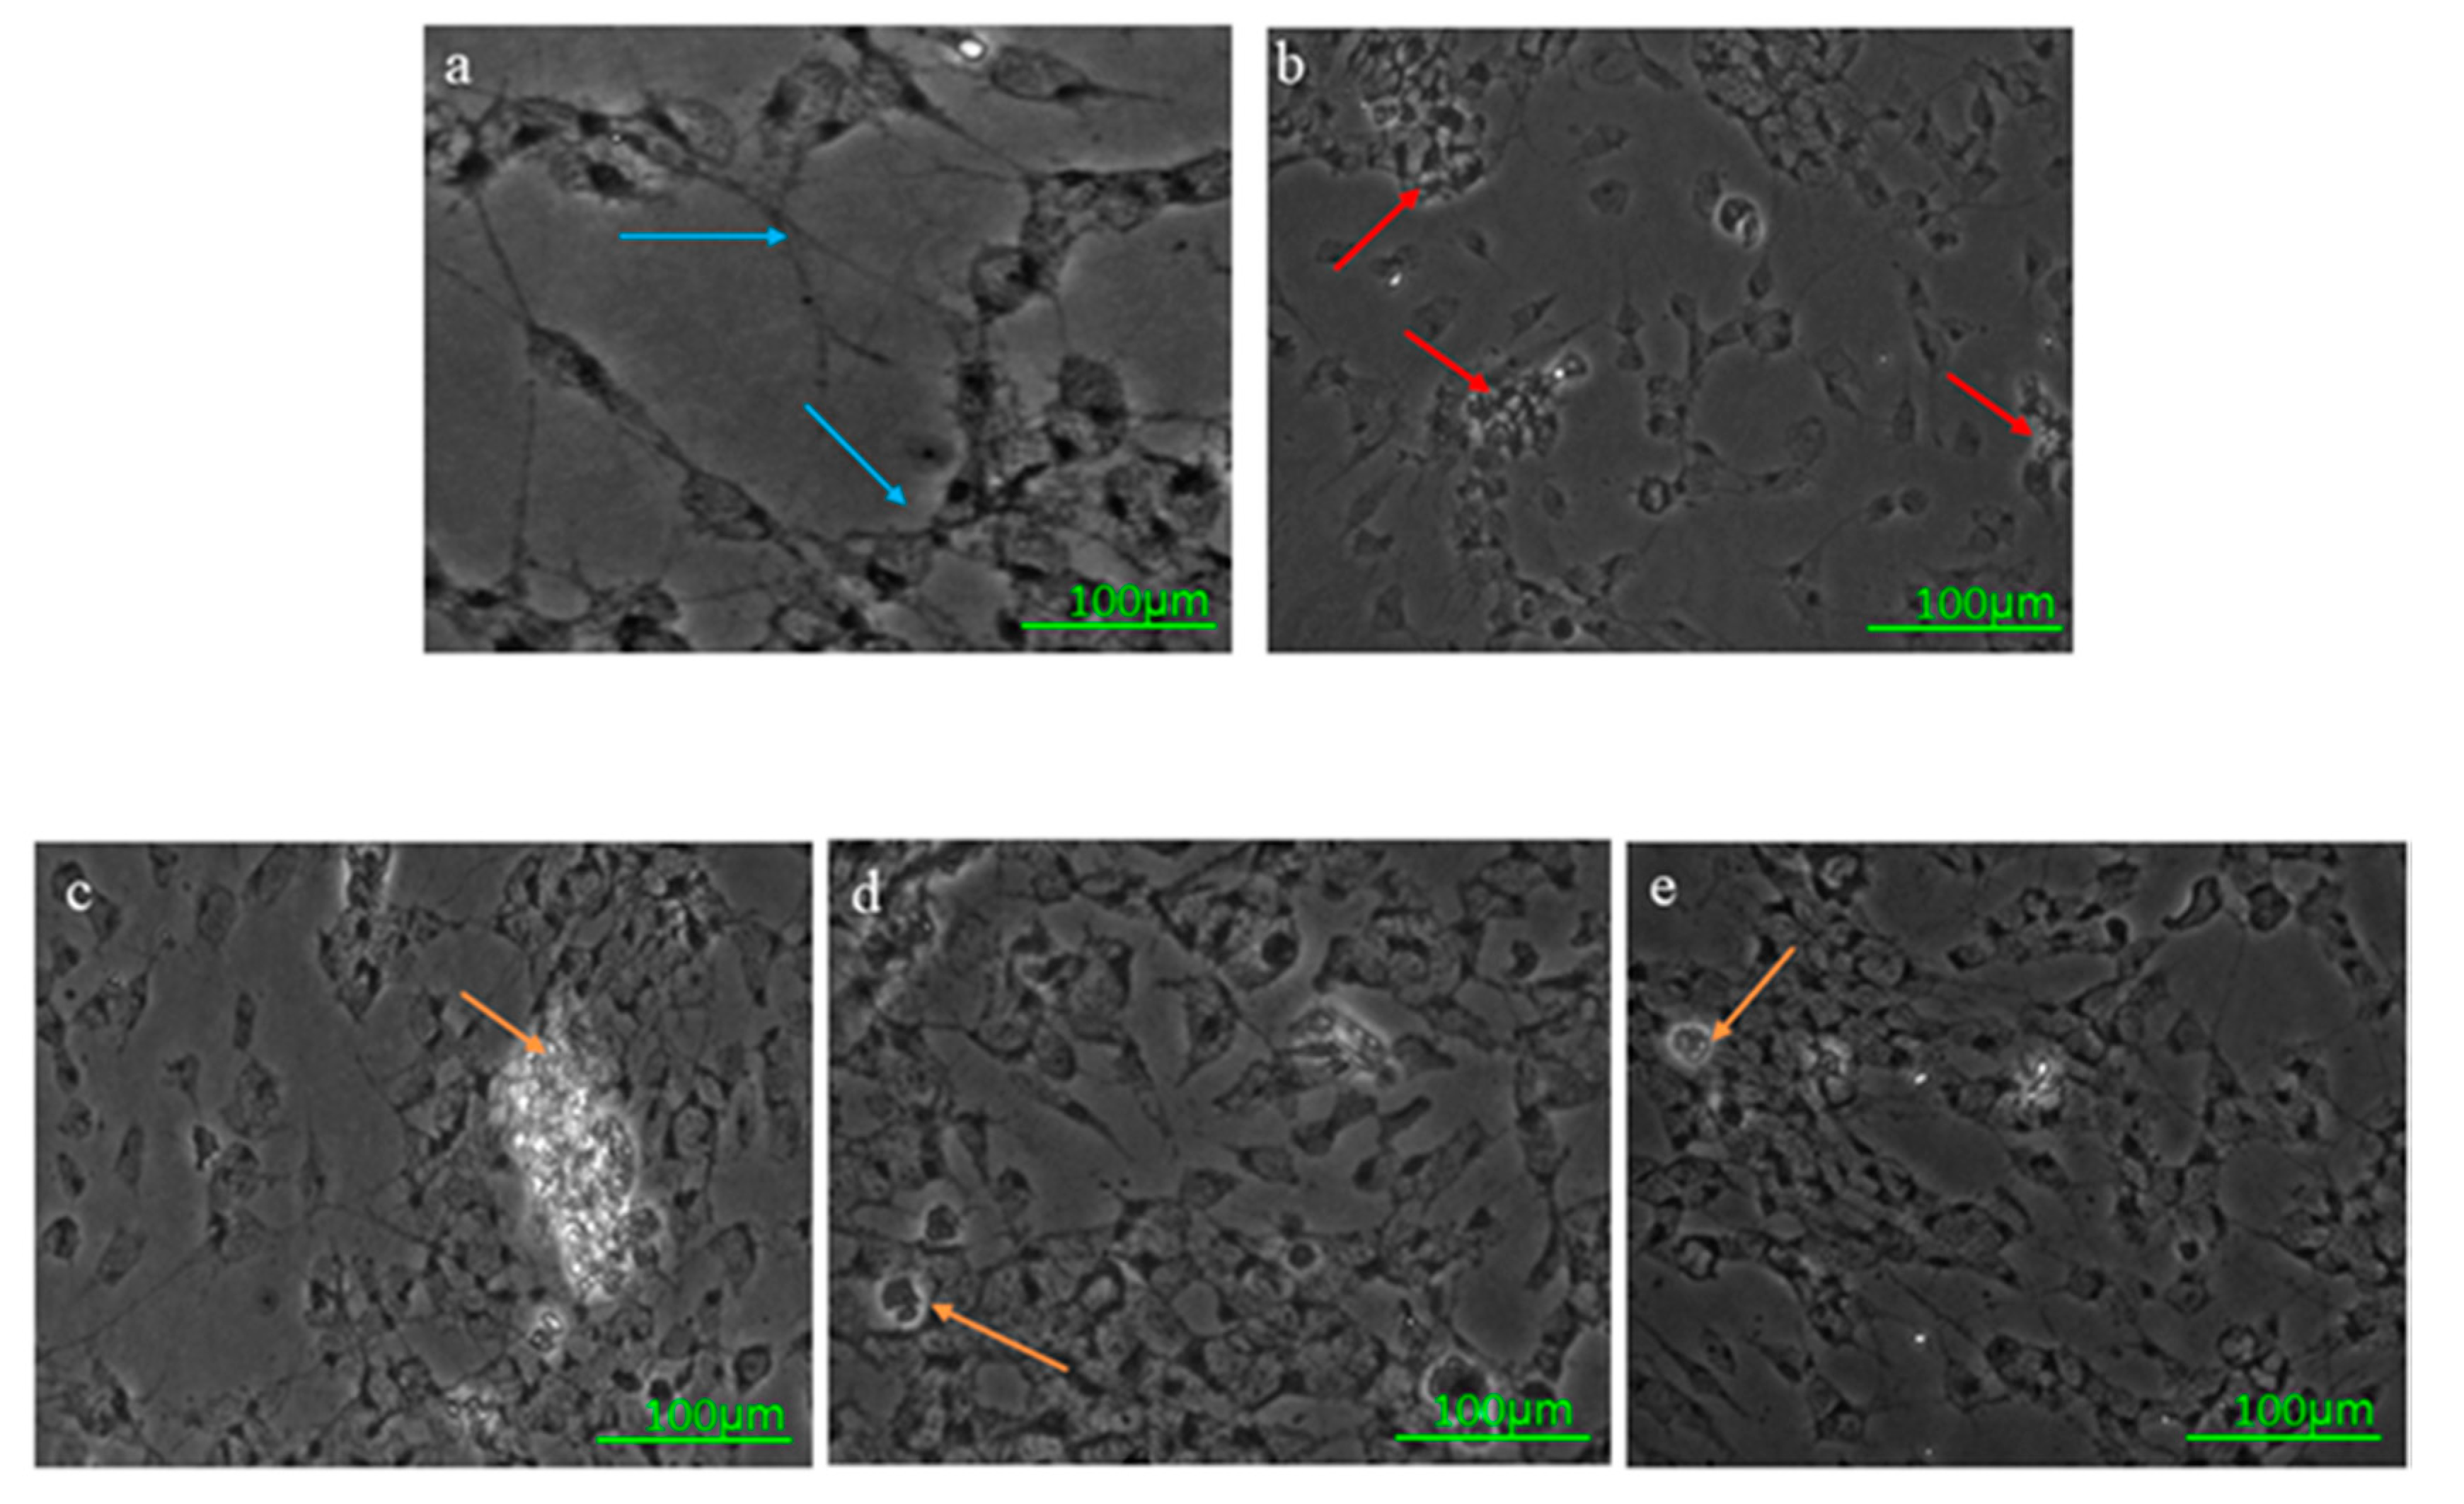
Microscopic Examination Using Bright-Field Imaging
3.4. Protein Expression Study
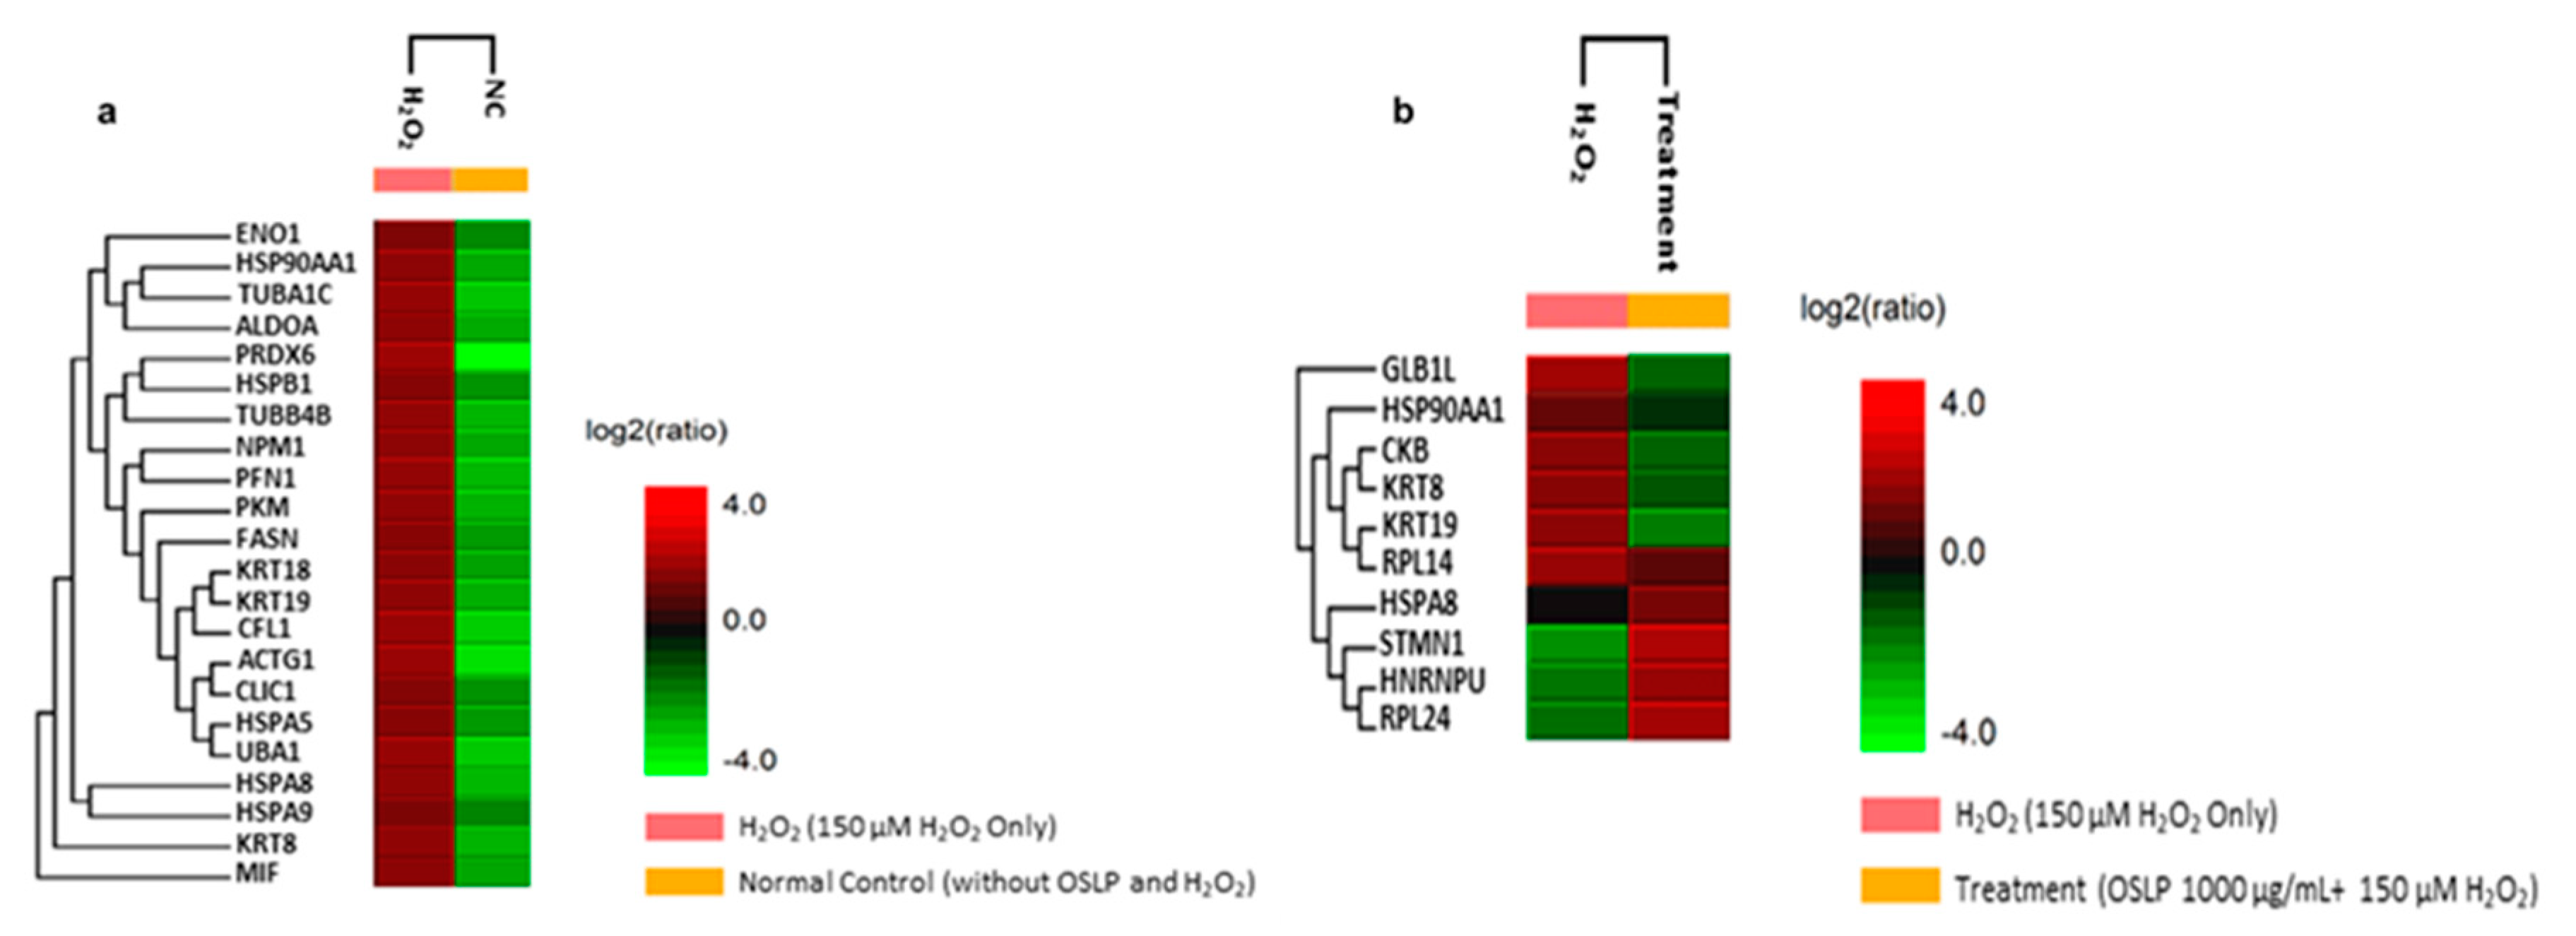
3.4.1. Protein Expression Analysis with Mass-Spectrometry-Based Quantitative Label-Free Proteomics (LFQ)
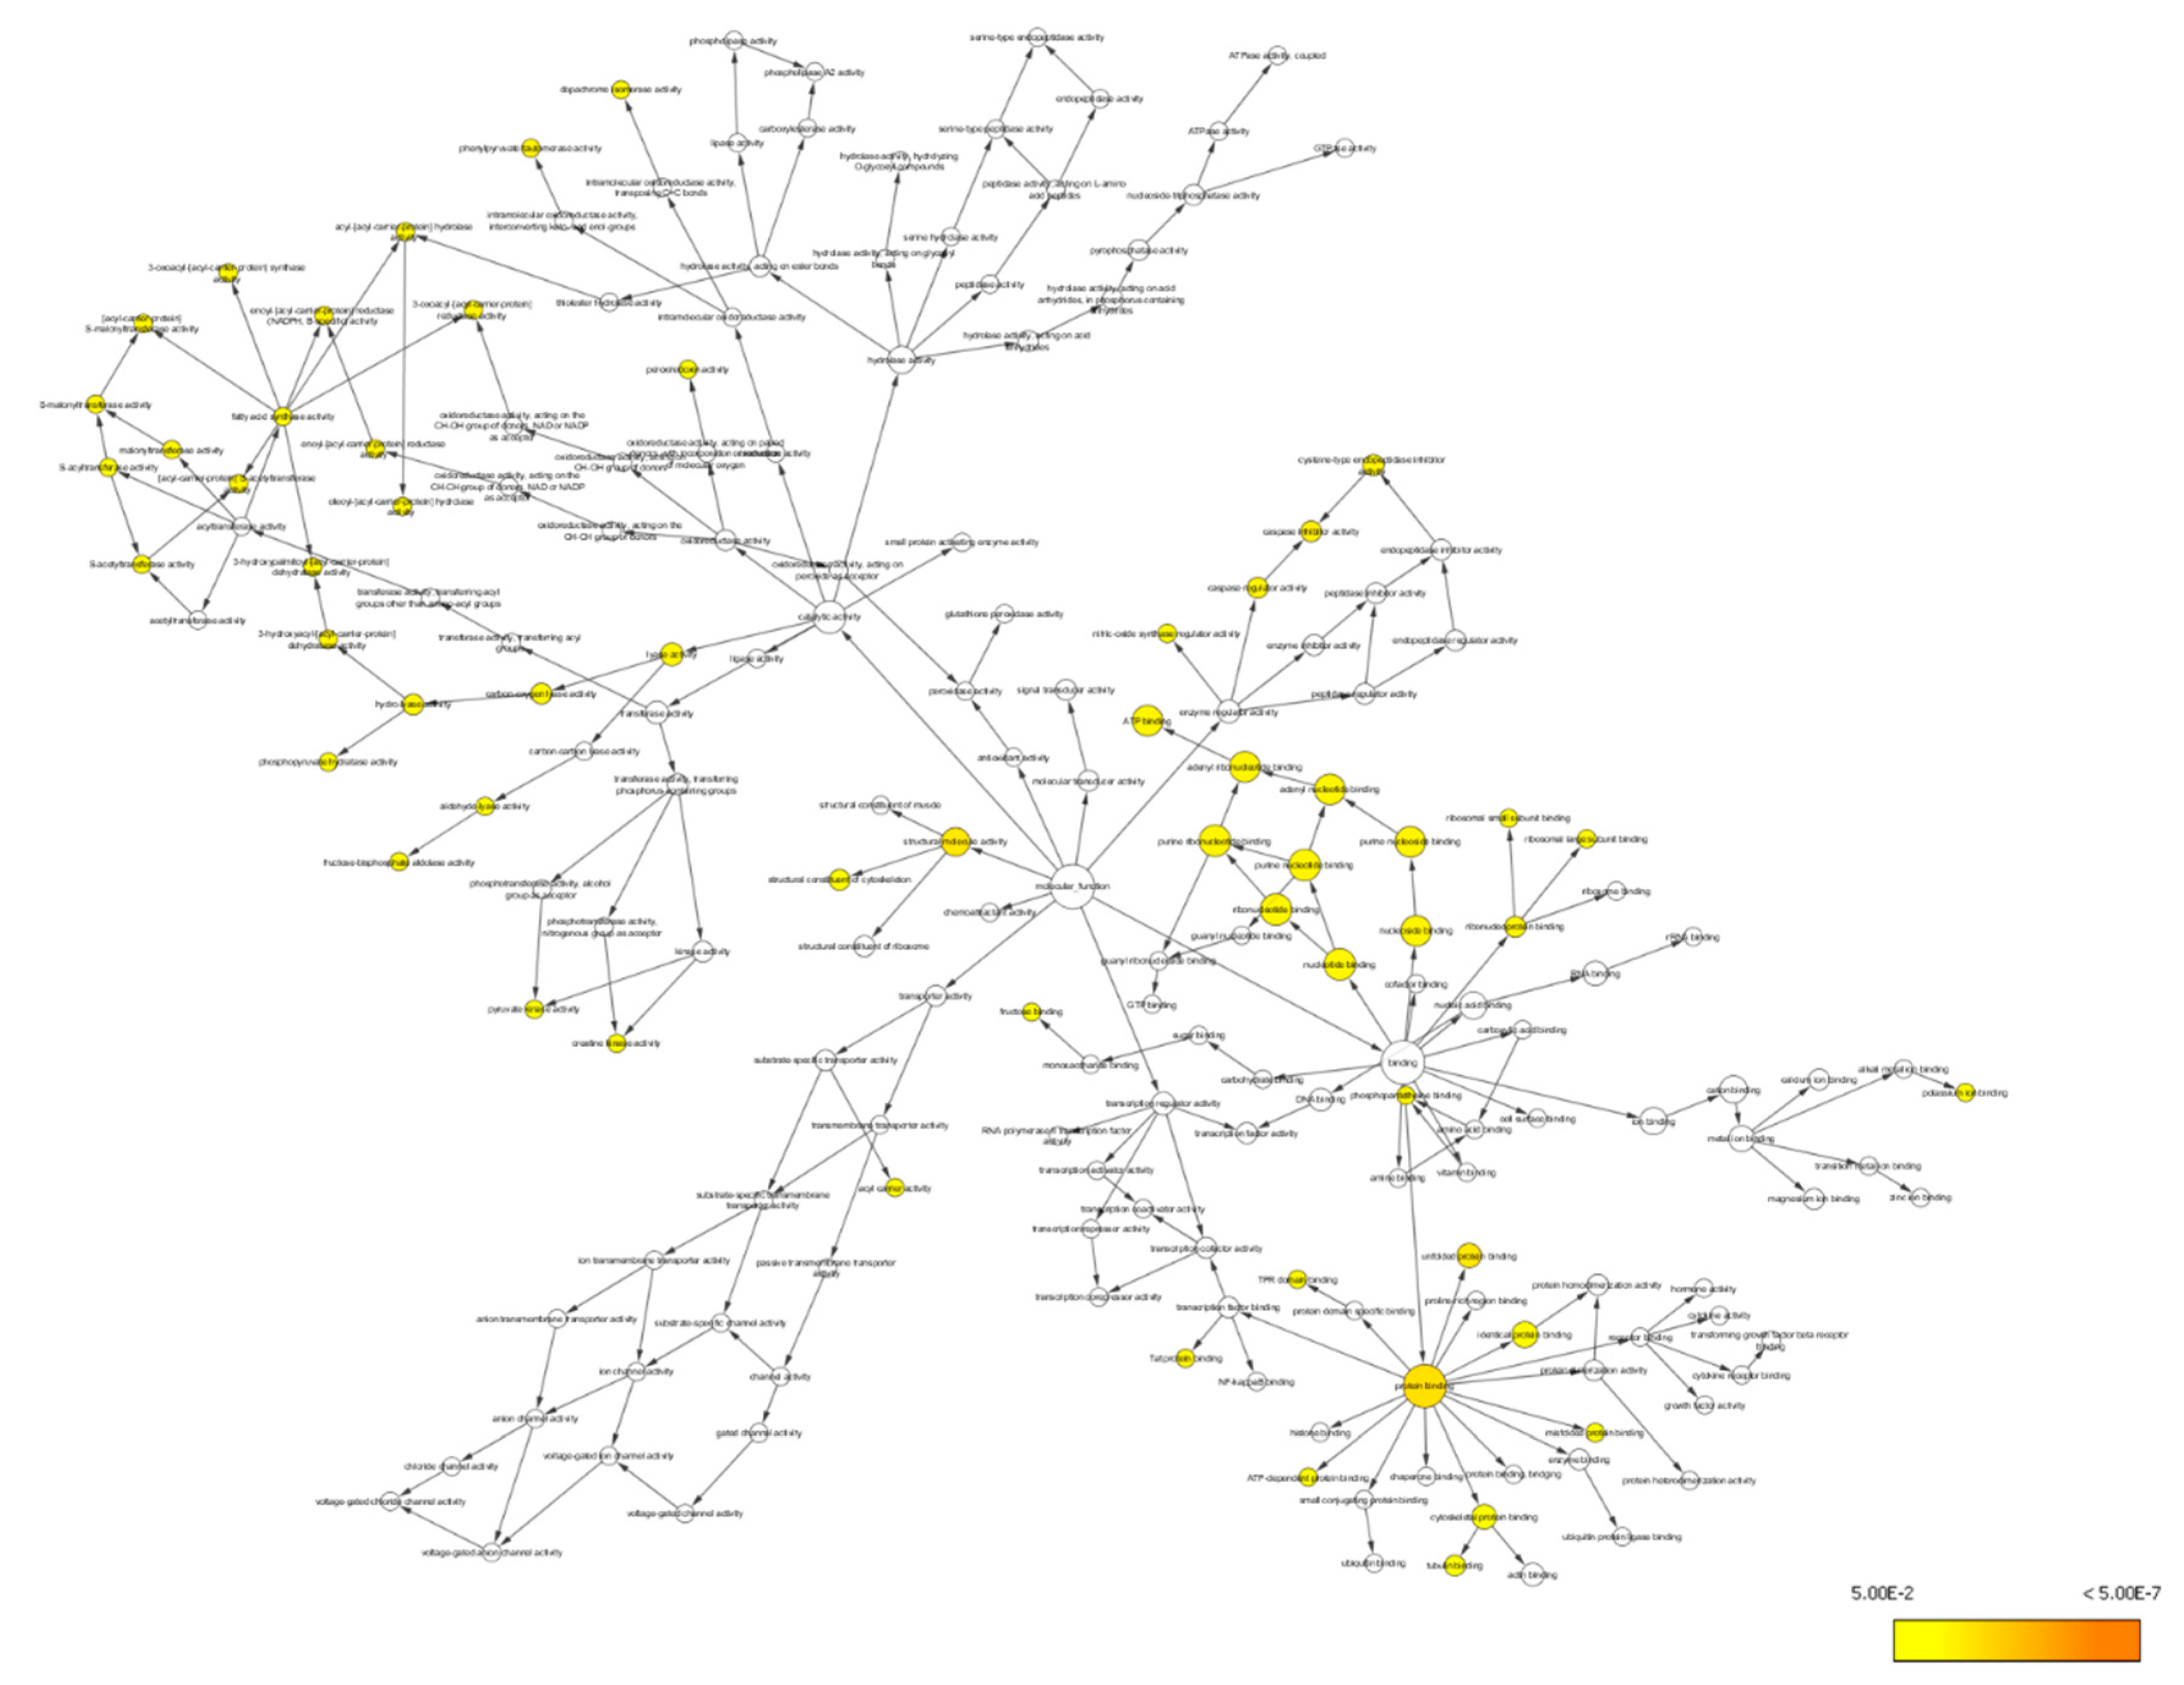
3.4.2. Bioinformatics Analysis
3.4.3. Systematic Pathway Enrichment Analysis
4. Discussion
5. Concluding Remarks
Supplementary Materials
Author Contributions
Funding
Institutional Review Board Statement
Informed Consent Statement
Data Availability Statement
Acknowledgments
Conflicts of Interest
References
- WHO. Neurological Disorders Public Health Challenges. Scitech Book News 2007, 31, 7–25. [Google Scholar]
- Feigin, V.L.; Abajobir, A.A.; Abate, K.H.; Abd-Allah, F.; Abdulle, A.M.; Abera, S.F.; Abyu, G.Y.; Ahmed, M.B.; Aichour, A.N.; Aichour, I.; et al. Global, regional, and national burden of neurological disorders during 1990–2015: A systematic analysis for the Global Burden of Disease Study 2015. Lancet Neurol. 2017, 16, 877–897. [Google Scholar] [CrossRef]
- Jellinger, K.A. Basic mechanisms of neurodegeneration: A critical update. J. Cell. Mol. Med. 2010, 14, 457–487. [Google Scholar] [CrossRef] [PubMed]
- Vajda, F.J.E. Neuroprotection and neurodegenerative disease. In Alzheimer’s Disease; Springer: Berlin/Heidelberg, Germany, 2004; pp. 235–243. [Google Scholar]
- Lin, X.; Zhang, N. Berberine: Pathways to protect neurons. Phytother. Res. 2018, 32, 1501–1510. [Google Scholar] [CrossRef] [PubMed]
- Rehman, M.U.; Wali, A.F.; Ahmad, A.; Shakeel, S.; Rasool, S.; Ali, R.; Rashid, S.M.; Madkhali, H.; Ganaie, M.A.; Khan, R. Neuroprotective Strategies for Neurological Disorders by Natural Products: An update. Curr. Neuropharmacol. 2019, 17, 247–267. [Google Scholar] [CrossRef] [PubMed]
- Clark, A.I.; Vissel, B. Excess cerebral TNF causing glutamate excitotoxicity rationalizes treatment of neurodegenerative diseases and neurogenic pain by anti-TNF agents. J. Neuroinflamm. 2016, 13, 236. [Google Scholar] [CrossRef]
- Lalkovičová, M.; Danielisová, V. Neuroprotection and antioxidants. Neural Regen. Res. 2016, 11, 865. [Google Scholar] [CrossRef]
- Schapira, A.H. Neuroprotection in Parkinson’s disease. In Blue Books of Neurology; Elsevier: Amsterdam, The Netherlands, 2010; pp. 301–320. [Google Scholar]
- Adnyana, I.K.; Setiawan, F.; Insanu, M. From ethnopharmacology to clinical study of Orthosiphon stamineus Benth. Int. J. Pharm. Pharm. Sci. 2013, 5, 66. [Google Scholar]
- Ameer, O.Z.; Salman, I.M.; Asmawi, M.Z.; Ibraheem, Z.O.; Yam, M.F. Orthosiphon stamineus: Traditional uses, phytochemistry, pharmacology, and toxicology. J. Med. Food. 2012, 15, 678–690. [Google Scholar] [CrossRef]
- Chung, Y.S.; Choo, B.K.M.; Ahmed, P.K.; Othman, I.; Shaikh, M.F. A Systematic Review of the Protective Actions of Cat’s Whiskers (Misai Kucing) on the Central Nervous System. Front. Pharmacol. 2020, 11, 692. [Google Scholar] [CrossRef]
- Chung, Y.S.; Choo, B.K.M.; Ahmed, P.K.; Othman, I.; Shaikh, M. Orthosiphon stamineus Proteins Alleviate Pentylenetetrazol-Induced Seizures in Zebrafish. Biomedicines 2020, 8, 191. [Google Scholar] [CrossRef]
- Aebersold, R.; Mann, M. Mass-spectrometric exploration of proteome structure and function. Nature 2016, 537, 347–355. [Google Scholar] [CrossRef] [PubMed]
- Patterson, S.D.; Aebersold, R.H. Proteomics: The first decade and beyond. Nat. Genet. 2003, 33, 311–323. [Google Scholar] [CrossRef] [PubMed]
- Fabregat, A.; Jupe, S.; Matthews, L.; Sidiropoulos, K.; Gillespie, M.; Garapati, P.; Haw, R.; Jassal, B.; Korninger, F.; May, B.; et al. The Reactome Pathway Knowledgebase. Nucleic Acids Res. 2018, 46, D649–D655. [Google Scholar] [CrossRef] [PubMed]
- Fabregat, A.; Sidiropoulos, K.; Viteri, G.; Forner, O.; Marin-Garcia, P.; Arnau, V.; D’Eustachio, P.; Stein, L.; Hermjakob, H. Reactome pathway analysis: A high-performance in-memory approach. BMC Bioinform. 2017, 18, 142. [Google Scholar] [CrossRef] [PubMed]
- Poonia, S.; Chawla, S.; Kaushik, S.; Sengupta, D. Pathway Informatics. In Encyclopedia of Bioinformatics and Computational Biology; Ranganathan, S., Nakai, K., Schonbach, C., Eds.; Academic Press: Oxford, UK, 2019; pp. 796–804. [Google Scholar]
- Kovalevich, J.; Langford, D. Considerations for the Use of SH-SY5Y Neuroblastoma Cells in Neurobiology. Methods Mol. Biol. 2013, 1078, 9–21. [Google Scholar] [PubMed]
- Shipley, M.M.; Mangold, C.A.; Szpara, M.L. Differentiation of the SH-SY5Y Human Neuroblastoma Cell Line. J. Vis. Exp. JoVE 2016, 53193. [Google Scholar] [CrossRef]
- Feeney, C.J.; Frantseva, M.V.; Carlen, P.L.; Pennefather, P.S.; Shulyakova, N.; Shniffer, C.; Mills, L.R. Vulnerability of glial cells to hydrogen peroxide in cultured hippocampal slices. Brain Res. 2008, 1198, 1–15. [Google Scholar] [CrossRef]
- van der Vliet, A.; Janssen-Heininger, Y.M.W. Hydrogen peroxide as a damage signal in tissue injury and inflammation: Murderer, mediator, or messenger? J. Cell. Biochem. 2014, 115, 427–435. [Google Scholar] [CrossRef]
- Wittmann, C.; Chockley, P.; Singh, S.K.; Pase, L.; Lieschke, G.J.; Grabher, C. Hydrogen Peroxide in Inflammation: Messenger, Guide, and Assassin. Adv. Hematol. 2012, 2012, 541471. [Google Scholar] [CrossRef]
- Smaczniak, C.; Li, N.; Boeren, S.; America, T.; Van Dongen, W.; Goerdayal, S.S.; De Vries, S.; Angenent, G.C.; Kaufmann, K. Proteomics-based identification of low-abundance signaling and regulatory protein complexes in native plant tissues. Nat. Protoc. 2012, 7, 2144. [Google Scholar] [CrossRef]
- Isaacson, T.; Damasceno, C.M.; Saravanan, R.S.; He, Y.; Catalá, C.; Saladié, M.; Rose, J.K. Sample extraction techniques for enhanced proteomic analysis of plant tissues. Nat. Protoc. 2006, 1, 769. [Google Scholar] [CrossRef]
- Salem, M.A.; Jüppner, J.; Bajdzienko, K.; Giavalisco, P. Protocol: A fast, comprehensive and reproducible one-step extraction method for the rapid preparation of polar and semi-polar metabolites, lipids, proteins, starch and cell wall polymers from a single sample. Plant Methods 2016, 12, 45. [Google Scholar] [CrossRef]
- Zhang, J.; Xin, L.; Shan, B.; Chen, W.; Xie, M.; Yuen, D.; Zhang, W.; Zhang, Z.; Lajoie, G.A.; Ma, B. PEAKS DB: De Novo sequencing assisted database search for sensitive and accurate peptide identification. Mol. Cell. Proteom. 2011, 11, M111-010587. [Google Scholar]
- Chevret, S. Maximum Tolerable Dose (MTD). In Wiley StatsRef: Statistics Reference Online; Balakrishnan, N., Colton, T., Everitt, B., Piegorsch, W., Ruggeri, F., Teugels, J.L., Eds.; John Wiley & Sons: Chichester, UK, 2014. [Google Scholar]
- Marques, J.; Vilanova, E.; Mourão, P.A.; Fernàndez-Busquets, X. Marine organism sulfated polysaccharides exhibiting significant antimalarial activity and inhibition of red blood cell invasion by Plasmodium. Sci. Rep. 2016, 6, 24368. [Google Scholar] [CrossRef]
- Encinas, M.; Iglesias, M.; Liu, Y.; Wang, H.; Muhaisen, A.; Cena, V.; Gallego, C.; Comella, J.X. Sequential Treatment of SH-SY5Y Cells with Retinoic Acid and Brain-Derived Neurotrophic Factor Gives Rise to Fully Differentiated, Neurotrophic Factor-Dependent, Human Neuron-Like Cells. J. Neurochem. 2000, 75, 991–1003. [Google Scholar] [CrossRef] [PubMed]
- Sree, N.V.; Sri, P.U.; Ramarao, N. Neuro-Protective Properties Of Orthosiphon Staminus (Benth) Leaf Methanolic Fraction Through Antioxidant Mechanisms On SH-SY5Y Cells: An In-Vitro Evaluation. Int. J. Pharm. Sci. Res. 2015, 6, 1115. [Google Scholar]
- Forster, J.I.; Köglsberger, S.; Trefois, C.; Boyd, O.; Baumuratov, A.S.; Buck, L.; Balling, R.; Antony, P.M.A. Characterization of Differentiated SH-SY5Y as Neuronal Screening Model Reveals Increased Oxidative Vulnerability. J. Biomol. Screen. 2016, 21, 496–509. [Google Scholar] [CrossRef] [PubMed]
- Zhang, Y.; Jiao, G.; Song, C.; Gu, S.; Brown, R.E.; Zhang, J.; Zhang, P.; Gagnon, J.; Locke, S.; Stefanova, R.; et al. An Extract from Shrimp Processing By-Products Protects SH-SY5Y Cells from Neurotoxicity Induced by Aβ25–35. Mar. Drugs 2017, 15, 83. [Google Scholar] [CrossRef]
- Pratt, W.B.; Morishima, Y.; Peng, H.M.; Osawa, Y. Proposal for a role of the Hsp90/Hsp70-based chaperone machinery in making triage decisions when proteins undergo oxidative and toxic damage. Exp. Biol. Med. 2010, 235, 278–289. [Google Scholar] [CrossRef]
- Picard, D. Heat-shock protein 90, a chaperone for folding and regulation. Cell. Mol. Life Sci. CMLS 2002, 59, 1640–1648. [Google Scholar] [CrossRef] [PubMed]
- Sevin, M.; Girodon, F.; Garrido, C.; De Thonel, A. HSP90 and HSP70: Implication in Inflammation Processes and Therapeutic Approaches for Myeloproliferative Neoplasms. Mediat. Inflamm. 2015, 2015, 970242. [Google Scholar] [CrossRef] [PubMed]
- Li, J.; Soroka, J.; Buchner, J. The Hsp90 chaperone machinery: Conformational dynamics and regulation by co-chaperones. Biochim. Biophys. Acta BBA Mol. Cell Res. 2012, 1823, 624–635. [Google Scholar] [CrossRef] [PubMed]
- Stankiewicz, T.R.; Linseman, D.A. Rho family GTPases: Key players in neuronal development, neuronal survival, and neurodegeneration. Front. Cell. Neurosci. 2014, 8, 314. [Google Scholar] [CrossRef]
- Chen, Y.; Wang, B.; Liu, D.; Li, J.J.; Xue, Y.; Sakata, K.; Zhu, L.Q.; Heldt, S.A.; Xu, H.; Liao, F.F. Hsp90 chaperone inhibitor 17-AAG attenuates Aβ-induced synaptic toxicity and memory impairment. J. Neurosci. 2014, 34, 2464–2470. [Google Scholar] [CrossRef]
- Garcia, S.M.; Casanueva, M.O.; Silva, M.C.; Amaral, M.D.; Morimoto, R.I. Neuronal signaling modulates protein homeostasis in Caenorhabditis elegans post-synaptic muscle cells. Genes Dev. 2007, 21, 3006–3016. [Google Scholar] [CrossRef]
- Gerges, N.Z.; Tran, I.C.; Backos, D.S.; Harrell, J.M.; Chinkers, M.; Pratt, W.B.; Esteban, J.A. Independent Functions of hsp90 in Neurotransmitter Release and in the Continuous Synaptic Cycling of AMPA Receptors. J. Neurosci. 2004, 24, 4758–4766. [Google Scholar] [CrossRef]
- Zhang, Y.; Liu, J.; Luan, G.; Wang, X. Inhibition of the small GTPase Cdc42 in regulation of epileptic-seizure in rats. Neuroscience 2015, 289, 381–391. [Google Scholar] [CrossRef]
- Dukay, B.; Csoboz, B.; Tóth, M.E. Heat-Shock Proteins in Neuroinflammation. Front. Pharmacol. 2019, 10, 920. [Google Scholar] [CrossRef]
- Weeks, S.D.; Muranova, L.K.; Heirbaut, M.; Beelen, S.; Strelkov, S.V.; Gusev, N.B. Characterization of human small heat shock protein HSPB1 α-crystallin domain localized mutants associated with hereditary motor neuron diseases. Sci. Rep. 2018, 8, 688. [Google Scholar] [CrossRef]
- Etienne-Manneville, S.; Hall, A. Rho GTPases in cell biology. Nature 2002, 420, 629–635. [Google Scholar] [CrossRef]
- Henstridge, D.C.; Whitham, M.; Febbraio, M.A. Chaperoning to the metabolic party: The emerging therapeutic role of heat-shock proteins in obesity and type 2 diabetes. Mol. Metab. 2014, 3, 781–793. [Google Scholar] [CrossRef] [PubMed]
- Taylor, J.P.; Hardy, J.; Fischbeck, K.H. Toxic proteins in neurodegenerative disease. Science 2002, 296, 1991–1995. [Google Scholar] [CrossRef] [PubMed]
- Mori, S.; Maher, P.; Conti, B. Neuroimmunology of the Interleukins 13 and 4. Brain Sci. 2016, 6, 18. [Google Scholar] [CrossRef]
- McCormick, S.; Heller, N.M. Commentary: IL-4 and IL-13 receptors and signaling. Cytokine 2015, 75, 38–50. [Google Scholar] [CrossRef] [PubMed]
- Walsh, J.T.; Hendrix, S.; Boato, F.; Smirnov, I.; Zheng, J.; Lukens, J.R.; Gadani, S.; Hechler, D.; Gölz, G.; Rosenberger, K.; et al. MHCII-independent CD4+ T cells protect injured CNS neurons via IL-4. J. Clin. Investig. 2015, 125, 699–714. [Google Scholar] [CrossRef]
- Yu, J.T.; Lee, C.H.; Yoo, K.Y.; Choi, J.H.; Li, H.; Park, O.K.; Yan, B.; Hwang, I.K.; Kwon, Y.G.; Kim, Y.M.; et al. Maintenance of anti-inflammatory cytokines and reduction of glial activation in the ischemic hippocampal CA1 region preconditioned with lipopolysaccharide. J. Neurol. Sci. 2010, 296, 69–78. [Google Scholar] [CrossRef]
- Zhao, X.; Wang, H.; Sun, G.; Zhang, J.; Edwards, N.J.; Aronowski, J. Neuronal Interleukin-4 as a Modulator of Microglial Pathways and Ischemic Brain Damage. J. Neurosci. 2015, 35, 11281–11291. [Google Scholar] [CrossRef]
- Kolosowska, N.; Keuters, M.H.; Wojciechowski, S.; Keksa-Goldsteine, V.; Laine, M.; Malm, T.; Goldsteins, G.; Koistinaho, J.; Dhungana, H. Peripheral Administration of IL-13 Induces Anti-inflammatory Microglial/Macrophage Responses and Provides Neuroprotection in Ischemic Stroke. Neurotherapeutics 2019, 16, 1304–1319. [Google Scholar] [CrossRef]
- Rossi, S.; Mancino, R.; Bergami, A.; Mori, F.; Castelli, M.; De Chiara, V.; Studer, V.; Mataluni, G.; Sancesario, G.; Parisi, V.; et al. Potential role of IL-13 in neuroprotection and cortical excitability regulation in multiple sclerosis. Mult. Scler. J. 2011, 17, 1301–1312. [Google Scholar] [CrossRef]
- Strauss, K.I.; Elisevich, K.V. Brain region and epilepsy-associated differences in inflammatory mediator levels in medically refractory mesial temporal lobe epilepsy. J. Neuroinflamm. 2016, 13, 270. [Google Scholar] [CrossRef]
- Liu, H.; Prayson, R.A.; Estes, M.L.; Drazba, J.A.; Barnett, G.H.; Bingaman, W.; Liu, J.; Jacobs, B.S.; Barna, B.P. In vivo expression of the interleukin 4 receptor alpha by astrocytes in epilepsy cerebral cortex. Cytokine 2000, 12, 1656–1661. [Google Scholar] [CrossRef] [PubMed]
- Wong, H.R. Endogenous Cytoprotective Mechanisms. In NeuroImmune Biology; Bertók, L., Chow, D.A., Eds.; Elsevier: Amsterdam, The Netherlands, 2005; pp. 49–65. [Google Scholar]
- Miller, D.; Fort, P.E. Heat Shock Proteins Regulatory Role in Neurodevelopment. Front. Neurosci. 2018, 12, 821. [Google Scholar] [CrossRef] [PubMed]
- Pratt, W.B.; Gestwicki, J.E.; Osawa, Y.; Lieberman, A.P. Targeting Hsp90/Hsp70-based protein quality control for treatment of adult onset neurodegenerative diseases. Annu. Rev. Pharmacol. Toxicol. 2015, 55, 353–371. [Google Scholar] [CrossRef] [PubMed]
- Reddy, S.J.; La Marca, F.; Park, P. The role of heat shock proteins in spinal cord injury. Neurosurg. Focus 2008, 25, E4. [Google Scholar] [CrossRef]
- Zhou, Z.B.; Huang, G.X.; Lu, J.J.; Ma, J.; Yuan, Q.J.; Cao, Y.; Zhu, L. Up-regulation of heat shock protein 27 inhibits apoptosis in lumbosacral nerve root avulsion-induced neurons. Sci. Rep. 2019, 9, 11468. [Google Scholar] [CrossRef]
- Schwarz, P.E.; Gallein, G.; Ebermann, D.; Müller, A.; Lindner, A.; Rothe, U.; Nebel, I.T.; Müller, G. Global diabetes survey—an annual report on quality of diabetes care. Diabetes Res. Clin. Pract. 2013, 100, 11–18. [Google Scholar] [CrossRef]
- Schwarz, N.; Windoffer, R.; Magin, T.M.; Leube, R.E. Dissection of keratin network formation, turnover and reorganization in living murine embryos. Sci. Rep. 2015, 5, 9007. [Google Scholar] [CrossRef]
- Schreurs, O.; Karatsaidis, A.; Balta, M.G.; Grung, B.; Hals, E.K.; Schenck, K. Expression of keratins 8, 18, and 19 in epithelia of atrophic oral lichen planus. Eur. J. Oral Sci. 2020, 128, 7–17. [Google Scholar] [CrossRef]
- Moll, R.; Divo, M.; Langbein, L. The human keratins: Biology and pathology. Histochem. Cell Biol. 2008, 129, 705–733. [Google Scholar] [CrossRef]
- Wang, Z.L.; Wang, S.; Kuang, Y.; Hu, Z.M.; Qiao, X.; Ye, M. A comprehensive review on phytochemistry, pharmacology, and flavonoid biosynthesis of Scutellaria baicalensis. Pharm. Biol. 2018, 56, 465–484. [Google Scholar] [CrossRef] [PubMed]
- Li, P.; Wang, X.; Zhang, J. Baicalein administration protects against pentylenetetrazole-induced chronic epilepsy in rats. Trop. J. Pharm. Res. 2018, 17, 293–298. [Google Scholar] [CrossRef]
- Liu, P.-F.; Han, F.-G.; Duan, B.-B.; Deng, T.-S.; Hou, X.-L.; Zhao, M.-Q. Purification and antioxidant activities of baicalin isolated from the root of huangqin (Scutellaria baicalensis gcorsi). J. Food Sci. Technol. 2013, 50, 615–619. [Google Scholar]
- Yin, F.; Liu, J.; Ji, X.; Wang, Y.; Zidichouski, J.; Zhang, J. Baicalin prevents the production of hydrogen peroxide and oxidative stress induced by Aβ aggregation in SH-SY5Y cells. Neurosci. Lett. 2011, 492, 76–79. [Google Scholar] [CrossRef]
- Kim, G.D.; Park, Y.S.; Jin, Y.H.; Park, C.S. Production and applications of rosmarinic acid and structurally related compounds. Appl. Microbiol. Biotechnol. 2015, 99, 2083–2092. [Google Scholar] [CrossRef]
- Choo, B.K.M.; Kundap, U.P.; Kumari, Y.; Hue, S.M.; Othman, I.; Shaikh, M.F. Orthosiphon stamineus Leaf Extract Affects TNF-α and Seizures in a Zebrafish Model. Front. Pharmacol. 2018, 9, 139. [Google Scholar] [CrossRef] [PubMed]


| Group | Treatment |
|---|---|
| NC | Normal control (untreated cells) |
| H2O2 | H2O2 induction (150 µM H2O2) |
| 25 | OSLP 25 µg/mL + 150 µM H2O2 |
| 50 | OSLP 50 µg/mL + 150 µM H2O2 |
| 125 | OSLP 125 µg/mL + 150 µM H2O2 |
| 250 | OSLP 250 µg/mL + 150 µM H2O2 |
| 500 | OSLP 500 µg/mL + 150 µM H2O2 |
| 1000 | OSLP 1000 µg/mL + 150 µM H2O2 |
| Group | Treatment |
|---|---|
| NC | Normal control (untreated cells) |
| H2O2 | H2O2 induction (150 µM H2O2) |
| 250 | OSLP 250 µg/mL + 150 µM H2O2 |
| 500 | OSLP 500 µg/mL + 150 µM H2O2 |
| 1000 | OSLP 1000 µg/mL + 150 µM H2O2 |
| Uniprot Accession ID | Uniprot Protein Name | Significance (≥13) | Coverage (%) | #Peptides | #Unique | Avg. Mass | Group Profile (Ratio of NC/H2O2) | Ensembl Protein |
|---|---|---|---|---|---|---|---|---|
| P11142 | Heat shock cognate 71 kDa protein | 34.31 | 16 | 7 | 5 | 67,980 | 0.34:1.00 | HSPA8 |
| P04075 | Fructose-bisphosphate aldolase A | 24.61 | 25 | 5 | 5 | 39,818 | 0.20:1.00 | ALDOA |
| P68371 | Tubulin beta-4B chain | 24.00 | 15 | 5 | 1 | 49,831 | 0.12:1.00 | TUBB4B |
| P05787 | Keratin, type II cytoskeletal 8 | 23.26 | 63 | 31 | 15 | 53,704 | 0.20:1.00 | KRT8 |
| O00299 | Chloride intracellular channel protein 1 | 23.2 | 8 | 1 | 1 | 26,794 | 0.02:1.00 | CLIC1 |
| P06733 | Alpha-enolase | 22.22 | 23 | 7 | 7 | 47,169 | 0.28:1.00 | ENO1 |
| P05783 | Keratin, type I cytoskeletal 18 | 20.41 | 63 | 19 | 17 | 48,030 | 0.16:1.00 | KRT18 |
| P38646 | Stress-70 protein, mitochondrial | 20.12 | 13 | 6 | 6 | 72,401 | 0.20:1.00 | HSPA9 |
| P04792 | Heat shock protein beta-1 | 19.50 | 40 | 6 | 6 | 22,783 | 0.15:1.00 | HSPB1 |
| P23528 | Cofilin-1 | 18.80 | 28 | 4 | 4 | 22,728 | 0.17:1.00 | CFL1 |
| P07737 | Profilin-1 | 18.10 | 46 | 5 | 5 | 15,054 | 0.25:1.00 | PFN1 |
| P14618 | Pyruvate kinase PKM | 17.35 | 18 | 6 | 3 | 57,937 | 0.23:1.00 | PKM/PK3 |
| P30041 | Peroxiredoxin-6 | 16.95 | 21 | 1 | 1 | 11,161 | 0.18:1.00 | PRDX6 |
| P22314 | Ubiquitin-like modifier-activating enzyme 1 | 16.61 | 3 | 2 | 2 | 117,849 | 0.10:1.00 | UBA1 |
| P63261 | Actin, cytoplasmic 2 | 16.55 | 33 | 11 | 1 | 41,793 | 0.07:1.00 | ACTG1 |
| P49327 | Fatty acid synthase | 16.33 | 3 | 4 | 4 | 273,424 | 0.29:1.00 | FASN |
| Q9BQE3 | Tubulin alpha-1C chain | 15.94 | 18 | 7 | 7 | 57,730 | 0.26:1.00 | TUBA1C |
| P14174 | Macrophage migration inhibitory factor | 14.39 | 10 | 1 | 1 | 12,476 | 0.11:1.00 | MIF |
| P08727 | Keratin, type I cytoskeletal 19 | 13.91 | 34 | 10 | 8 | 44,106 | 0.15:1.00 | KRT19 |
| P07900 | Heat shock protein HSP 90-alpha | 13.79 | 12 | 6 | 3 | 68,372 | 0.36:1.00 | HSP90AA1 |
| P11021 | Endoplasmic reticulum chaperone BiP | 13.35 | 7 | 3 | 2 | 66,914 | 0.17:1.00 | HSPA5 |
| P06748 | Nucleophosmin | 13.27 | 15 | 2 | 2 | 28,400 | 0.21:1.00 | NPM1 |
| Uniprot Accession ID | Uniprot Protein Name | Significance (≥13) | Coverage (%) | #Peptides | #Unique | Avg. Mass | Group Profile (Ratio of H2O2/Treatment) | Ensembl Protein |
|---|---|---|---|---|---|---|---|---|
| Q, | Heterogeneous nuclear ribonucleoprotein U | 31.91 | 2 | 1 | 1 | 67,980 | 1.00:1.72 | HNRNPU |
| P05787 | Keratin, type II cytoskeletal 8 | 25.07 | 69 | 41 | 20 | 39,818 | 1.00:0.44 | KRT8 |
| P11142 | Heat shock cognate 71 kDa protein | 18.72 | 21 | 11 | 2 | 49,831 | 1.00:0.94 | HSPA8 |
| P83731 | 60S ribosomal protein L24 | 16.92 | 11 | 1 | 1 | 53,704 | 1.00:2.79 | RPL24 |
| P50914 | 60S ribosomal protein L14 | 16.33 | 6 | 1 | 1 | 26,794 | 1.00:0.58 | RPL14 |
| P16949 | Stathmin | 15.88 | 15 | 2 | 2 | 47,169 | 1.00:2.24 | STMN1 |
| Q6UWU2 | Beta-galactosidase-1-like protein | 15.63 | 2 | 1 | 1 | 48,030 | 1.00:0.38 | GLB1L |
| P08727 | Keratin, type I cytoskeletal 19 | 14.96 | 43 | 14 | 12 | 72,401 | 1.00:0.27 | KRT19 |
| P12277 | Creatine kinase B-type | 14.25 | 12 | 2 | 2 | 22,783 | 1.00:0.41 | CKB |
| P07900 | Heat shock protein HSP 90-alpha | 13.00 | 20 | 11 | 3 | 22,728 | 1.00:0.49 | HSP90AA1 |
| Reactome Pathway Name | Reactome Pathway Identifier | Entities p-Value |
|---|---|---|
| Signal transduction | ||
| Signaling by Rho GTPases | ||
| RHO GTPases activate IQGAPs | R-HSA-5626467 | 1.38 × 10⁻⁶ |
| RHO GTPases activate formins | R-HSA-5663220 | 1.45 × 10⁻⁴ |
| Vesicle-mediated transport | ||
| Membrane trafficking | ||
| Microtubule-dependent trafficking of connexons from Golgi to the plasma membrane | R-HSA-190840 | 2.41 × 10⁻⁶ |
| Transport of connexons to the plasma membrane | R-HSA-190872 | 2.87 × 10⁻⁶ |
| Gap junction trafficking | R-HSA-190828 | 3.36 × 10⁻⁴ |
| Gap junction trafficking and regulation | R-HSA-157858 | 4.56 × 10⁻⁴ |
| Translocation of SLC2A4 (GLUT4) to the plasma membrane | R-HSA-1445148 | 0.001455 |
| Cellular responses to external stimuli | ||
| Cellular responses to stress | ||
| HSP90 chaperone cycle for steroid hormone receptors (SHRs) | R-HSA-3371497 | 4.24 × 10⁻⁶ |
| Attenuation phase | R-HSA-3371568 | 0.001068 |
| Metabolism of proteins | ||
| Protein folding | ||
| Post-chaperonin tubulin folding pathway | R-HSA-389977 | 1.48 × 10⁻⁵ |
| Formation of tubulin folding intermediates by CCT/TriC | R-HSA-389960 | 9.10 × 10⁻⁵ |
| Prefoldin mediated transfer of substrate to CCT/TriC | R-HSA-389957 | 2.49 × 10⁻⁴ |
| Cooperation of Prefoldin and TriC/CCT in actin and tubulin folding | R-HSA-389958 | 9.66 × 10⁻⁴ |
| Post-translational protein modification | ||
| Carboxyterminal post-translational modifications of tubulin | R-HSA-8955332 | 6.85 × 10⁻⁵ |
| Cell cycle | ||
| Cell cycle, mitotic | ||
| Recruitment of NuMA to mitotic centrosomes | R-HSA-380320 | 5.42 × 10⁻⁵ |
| Sealing of the nuclear envelope (NE) by ESCRT-III | R-HSA-9668328 | 2.37 × 10⁻⁴ |
| The role of GTSE1 in G2/M progression after G2 checkpoint | R-HSA-8852276 | 0.001135 |
| Neuronal system | ||
| Post N-methyl-D-aspartate (NMDA) receptor activation events | ||
| Activation of AMPK downstream of NMDARs | R-HSA-9619483 | 5.89 × 10⁻⁵ |
| Activation of NMDA receptors and postsynaptic events | ||
| Assembly and cell surface presentation of NMDA receptors | R-HSA-9609736 | 9.66 × 10⁻⁴ |
| Autophagy | ||
| Macroautophagy | ||
| Aggrephagy | R-HSA-9646399 | 1.02 × 10⁻⁴ |
| Metabolism | ||
| Glucose metabolism | ||
| Glycolysis | R-HSA-70171 | 1.70 × 10⁻⁴ |
| Metabolism of Carbohydrates | R-HSA-70326 | 0.001332 |
| Glucose metabolism | ||
| Developmental biology | ||
| Nervous system development | ||
| Recycling pathway of L1 | R-HSA-437239 | 3.81 × 10⁻⁴ |
| Haemostasis | ||
| Response to elevated platelet cytosolic Ca2+ | ||
| Platelet degranulation | R-HSA-114608 | 7.68 × 10⁻⁴ |
| Immune system | ||
| Innate immune system | ||
| Neutrophil degranulation | R-HSA-6798695 | 8.23 × 10⁻⁴ |
| Reactome Pathway Name | Reactome Pathway Identifier | Entities p-Value |
|---|---|---|
| Immune system | ||
| Cytokine signaling in immune system | ||
| Interleukin-4 and Interleukin-13 signaling | R-HSA-6785807 | 4.29 × 10⁻⁴ |
| Cellular responses to external stimuli | ||
| Cellular responses to stress | ||
| HSF1-dependent transactivation | R-HSA-3371571 | 0.001867 |
| Attenuation phase | R-HSA-3371568 | 0.001204 |
| HSP90 chaperone cycle for steroid hormone receptors (SHRs) | R-HSA-3371497 | 0.005152 |
| Developmental biology | ||
| Keratinisation | ||
| Formation of the cornified envelope | R-HSA-6809371 | 0.001410 |
| Keratinisation | R-HSA-6805567 | 0.003672 |
| Disease | ||
| Influenza infection | ||
| Influenza Viral RNA Transcription and Replication | R-HSA-168273 | 0.002496 |
| Diseases of signal transduction by growth factor receptors & second messengers | ||
| Resistance of ERBB2 KD mutants to sapitinib | R-HSA-9665244 | 0.0053 |
| Resistance of ERBB2 KD mutants to trastuzumab | R-HSA-9665233 | 0.0053 |
| Resistance of ERBB2 KD mutants to afatinib | R-HSA-9665249 | 0.0053 |
Publisher’s Note: MDPI stays neutral with regard to jurisdictional claims in published maps and institutional affiliations. |
© 2021 by the authors. Licensee MDPI, Basel, Switzerland. This article is an open access article distributed under the terms and conditions of the Creative Commons Attribution (CC BY) license (https://creativecommons.org/licenses/by/4.0/).
Share and Cite
Chung, Y.-S.; Ahmed, P.K.; Othman, I.; Shaikh, M.F. Orthosiphon stamineus Proteins Alleviate Hydrogen Peroxide Stress in SH-SY5Y Cells. Life 2021, 11, 585. https://doi.org/10.3390/life11060585
Chung Y-S, Ahmed PK, Othman I, Shaikh MF. Orthosiphon stamineus Proteins Alleviate Hydrogen Peroxide Stress in SH-SY5Y Cells. Life. 2021; 11(6):585. https://doi.org/10.3390/life11060585
Chicago/Turabian StyleChung, Yin-Sir, Pervaiz Khalid Ahmed, Iekhsan Othman, and Mohd. Farooq Shaikh. 2021. "Orthosiphon stamineus Proteins Alleviate Hydrogen Peroxide Stress in SH-SY5Y Cells" Life 11, no. 6: 585. https://doi.org/10.3390/life11060585
APA StyleChung, Y.-S., Ahmed, P. K., Othman, I., & Shaikh, M. F. (2021). Orthosiphon stamineus Proteins Alleviate Hydrogen Peroxide Stress in SH-SY5Y Cells. Life, 11(6), 585. https://doi.org/10.3390/life11060585