Article

Radiological Risk to Human and Non-Human Biota Due to Radioactivity in Coastal Sand and Marine Sediments, Gulf of Oman

by
Ibrahim I. Suliman
1,* and
Khalid Alsafi
2
1
Department of Physics, College of Science, Imam Mohammad Ibn Saud Islamic University (IMSIU), Riyadh 11642, Saudi Arabia
2
Department of Radiology, Medical Physics Unit, King Abdulaziz University, P.O. Box 80215, Jeddah 21589, Saudi Arabia
*
Author to whom correspondence should be addressed.
Life 2021, 11(6), 549; https://doi.org/10.3390/life11060549
Submission received: 3 May 2021 / Revised: 6 June 2021 / Accepted: 7 June 2021 / Published: 11 June 2021
(This article belongs to the Special Issue Radioactive Pollution and Biological Effects of Radioactivity)

Abstract

:
Natural and 137Cs radioactivity in coastal marine sediment samples was measured using gamma spectrometry. Samples were collected at 16 locations from four beaches along the coastal area of Muscat City, Gulf of Oman. Radioactivity in beach sand was used to estimate the radiological risk parameters to humans, whereas the radioactivity in marine sediments was used to assess the radiological risk parameters to non-human biota, using the ERICA Tool. The average radioactivity concentrations (Bqkg−1) of 226Ra, 232Th, 40K, 210Pb and 137Cs in sediments (sand) were as follows: 16.2 (16.3), 34.5(27.8), 54.7 (45.6), 46.8 (44.9) and 0.08 (0.10), respectively. In sand samples, the estimated average indoor ( D in ) and outdoor ( D out ) air absorbed dose rates due to natural radioactivity were 49.26 and 27.4 and the total effective dose ( AED Total ; µSvy−1) ranged from 150.2 to 498.9 (average: 275.2). The measured radioactivity resulted in an excess lifetime cancer risk (ELCR) in the range of 58–203 (average: 111) in and an average gonadal dose (AGD; µGy.y−1) ranged from 97.3 to 329.5 (average: 181.1). Total dose rate per marine organism ranged from 0.035 µGy h−1 (in zooplankton) to 0.564 µGy h−1 (in phytoplankton). The results showed marine sediments as an important source of radiation exposure to biota in the aquatic environment. Regular monitoring of radioactivity levels is vital for radiation risk confinement. The results provide an important radiological risk profile parameter to which future radioactivity levels in marine environments can be compared.

1. Introduction

Radioactivity naturally exists in the environment in different conditions such as soil, underground water, marine sediment, and biota. Radioactivity enters the marine environment through different pathways, including via river and rainwater transport into the sea; however, this is often due to nuclear waste disposal, which is discharged from nuclear power plants as well as from medical, industrial, research, and educational uses of radionuclides [1,2,3]. Sources of marine radioactivity are numerous: uranium isotopes are present in large amounts in seas and oceans; thorium in water is hydrolysed and attached to particle surfaces, and is thus not as soluble in water; and 226Ra and 40K are highly soluble in water. On the other hand, 210Pb enters the atmosphere via 222Rn diffusion and in rainfall. 137Cs in the environment poses radiation protection concerns given its high yield, long half-life, and significant uptake and retention in biological organisms. The principal sources of 137Cs released in the environment have included atmospheric nuclear weapons testing and releases during nuclear reactor accidents [4].
Regarding the radiation risk to non-human biota, the concerning biological effects include those that could lead to changes in population size or structure. Among these endpoints are early mortality, some forms of morbidity, impairment of reproductive capacity, and the induction of chromosomal damage. Therefore, it is necessary to estimate the doses received and then compare such data with the nearest relevant data for reference organisms to evaluate the likely radiation effects for such organisms in an environmental context [5].
Assessing radiation exposure among humans requires a better understanding of the radionuclide’s behaviour in pertinent environments [6,7,8]. Thus, the primary aims of nearly all marine radioactivity studies have been to form a scientific foundation upon which to determine the radiological risk of radioisotopes in marine environments. This is an enormously important issue that is in alignment with the present radiation protection standards [6,7]. Considering the importance of the subject, several radioactivity studies were performed in the marine environments of Gulf countries [9,10,11,12,13]. The results revealed a high degree of variability in radioactivity levels and emphasised the importance of such studies from a radiation protection standpoint. In Oman, not much work has been done to explore environmental and marine radioactivity. In fact, the only study we found was carried out by Salih, who studies radioactivity levels in marine environments [14]. In these studies, the radiological risk to non-human biota was not covered.
Thus, we sought to assess radiation exposure, radiological hazards, and attributed cancer risk from naturally occurring radioactivity found in marine sediments along the coastal area of the Gulf of Oman. This is important, as oceans and seas are directly impacted and ultimately serve as a sink of radioactivity and other contaminants, as they link diverse geographical areas with one another, representing a major source of marine pollution.

2. Materials and Methods

2.1. Study Location

The study was performed in the Muscat principality in Oman (23.5859° N, 58.4059° E) which had a population of approximately 1.28 million in 2015. Figure 1 shows the map of Oman, which highlights Muscat city and the four sample locations. These are Manuma Beach (A), Seeb Beach (B), Aziba Beach (C), and Qurum Beach (D), which are the four major beaches. These beaches are important sightseeing destinations and are among the most abundantly frequented in the city, especially in summer. Thus, it is essential that radioactivity levels are studied to determine the extent of the associated radiological hazards.
For the coastal sands, each sample was taken at a depth of 5 cm at an average interval of 200 m between two locations. Samples of marine sediment were taken from the area covered by sea water at about 20 m from the beach to provide a fair representation of the area’s geological and sediment characteristics, which are the greatest determinants of the types of radionuclides present. The samples were taken to the laboratory at the Medical Physics Department, Sultan Qaboos University, where they were dried for 24 h in an oven set at 80 °C. To better estimate the specific activity of radium, samples were tightly sealed in Marinelli beakers and left for 4 weeks to achieve equilibrium.

2.2. Radioactivity Measurements

Spectrometric measurements were performed using a p-type high purity germanium (HPGe) detector, with a relative efficiency of 40% to that of NaI spectrometry (ORTEC, Oak Ridge, TN, USA). Gamma Vision-32 software was used for spectrum analysis (ORTEC, Oak Ridge, TN, USA). Energy and efficiency calibrations were performed before the measurements were taken using a standard mixture of sources from the International Atomic Energy Agency (IAEA). Background measurements were performed without a sample in place, and these measurements were subsequently subtracted from the measured activity concentrations.
The 226Ra activity was estimated from the 214Pb and 214Bi radionuclide activities measured directly determined from their gamma-ray energy lines 351.92 keV and 609.31 keV, respectively. The activity of 232Th was estimated from the 212Bi, 212Pb, and 228Ac radionuclide activities measured directly from their gamma-ray energy lines 727.17, 238.63, and 911.60 keV, respectively. The activity concentrations of 40K, 210Pb, and 137Cs were measured directly using their gamma ray lines 1460.81, 46.5, and 662 keV, respectively [4]. Using these parameters, the specific activity (A) of a given radionuclide in the sample was determined as follows:
A = N PE · · Tc · M · k
where M is the mass of the sample in kg, N is the sample net area in the peak range, PE is the gamma emission probability, Tc is the counting time, and is the photo peak efficiency [7]. k is the product of all correction factors ( k = k 1 · k 2 · k 3 · k 4 · k 5 ); where k 1 , k 2 , k 3 , k 4 , and k 5 are correction factors to account for the radionuclide decay, the nuclide decay during counting, self-attenuation, pulses loss due to random summing, and the coincidence, respectively [15,16].
u ( A ) A = ( u ( N ) N ) 2 + ( u ( P E ) P E ) 2 + ( u ( ) ) 2 + ( u ( T C ) T C ) 2 + ( u ( M ) M ) 2 + ( u ( k ) k ) 2
where u ( N ) N , u ( P E ) P E , u ( ) , u ( T C ) T C , u ( M ) M and u ( k ) k are the relative uncertainties of the counting rate, gamma emission probability, photo peak efficiency, counting time, sample mass and correction factors, respectively. The standard uncertainty in the correction factors is determined as: ( u ( k ) k = ( u ( k 1 ) k 1 ) 2 + ( u ( k 2 ) k 2 ) 2 + ( u ( k 3 ) k 3 ) 2 + ( u ( k 4 ) k 4 ) 2 + ( u ( k 5 ) k 5 ) 2 ).
The standard uncertainties in activity measurements for 40K, 210Pb and 137Cs radionuclides were used for the determination of the expanded uncertainty. For 226Ra and 232Th which are determined from other radionuclides, the combined uncertainty was determined as the square root of the quadratic sum of the relative standard uncertainties of respective radionuclides as shown in Equations (3) and (4) [15,16].
u ( A Ra 226 ) A Ra 226 = ( u ( A Pb 214 ) A Pb 214 ) 2 + ( u ( A Bi 214 ) A Bi 214 ) 2
u ( A Ra 226 ) A Ra 226 = ( u ( A Pb 212 ) A Pb 212 ) 2 + ( u ( A Bi 212 ) A Bi 212 ) 2 + ( u ( A Ac 228 ) A Ac 228 ) 2
Standard uncertainty in activity concentrations, as shown in Equation (2), was determined using software. The overall uncertainties in the measurement results were quoted as expanded uncertainty at 95% confidence level with coverage factor (k = 2) [15].

3. Results and Discussion

3.1. Radioactivity Contents in Marine Sediment

This study presents an effort to assess the magnitude of environmental and artificial radionuclides in marine environments. The specific activity (Bqkg−1) of natural radionuclides 226Ra, 232Th, 40K, and 210Pb in coastal marine sands and sediments in the Gulf of Oman are presented in Table 1.
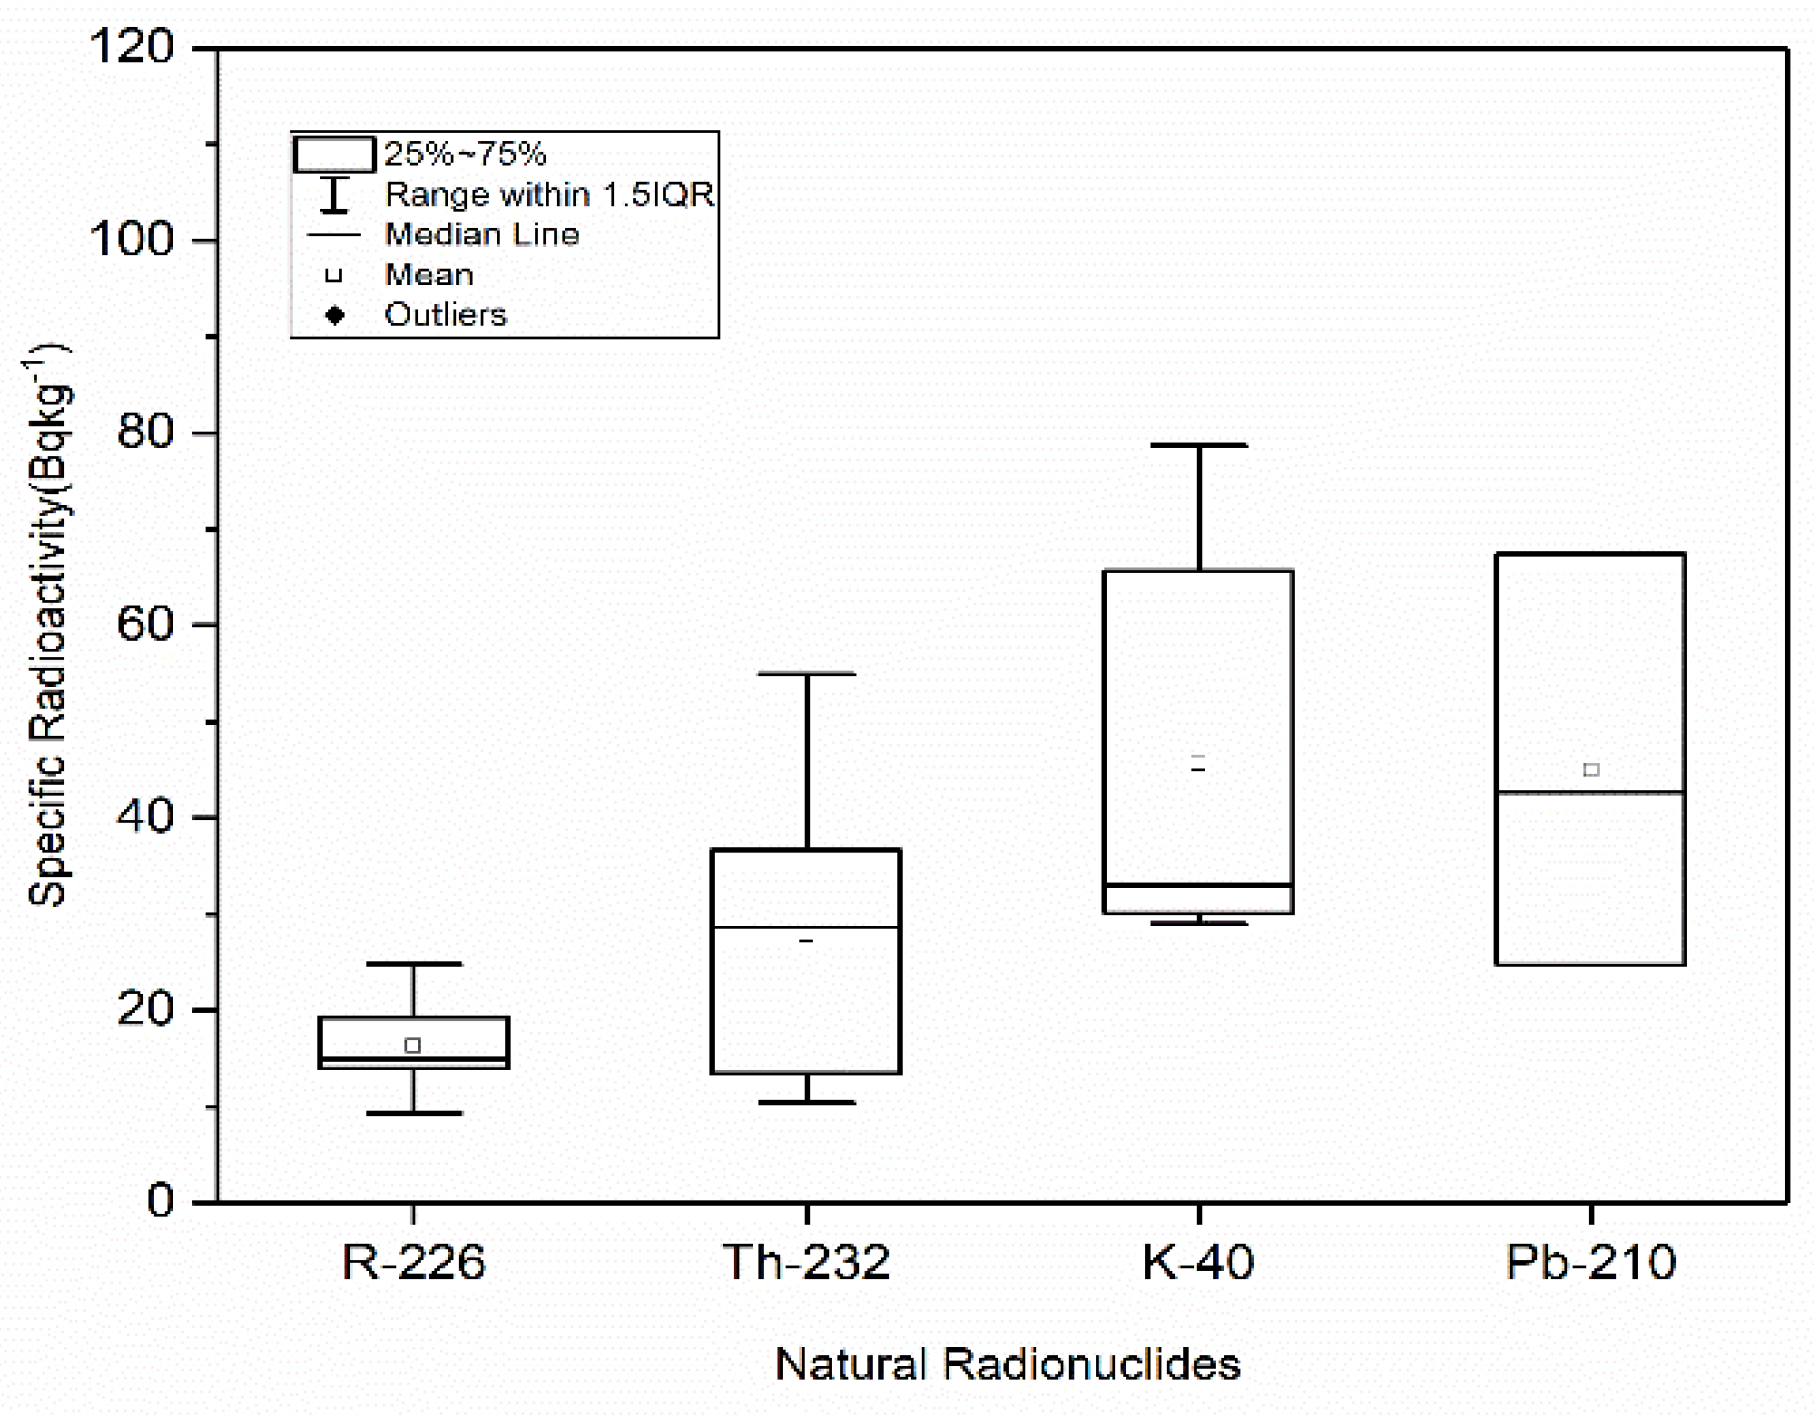
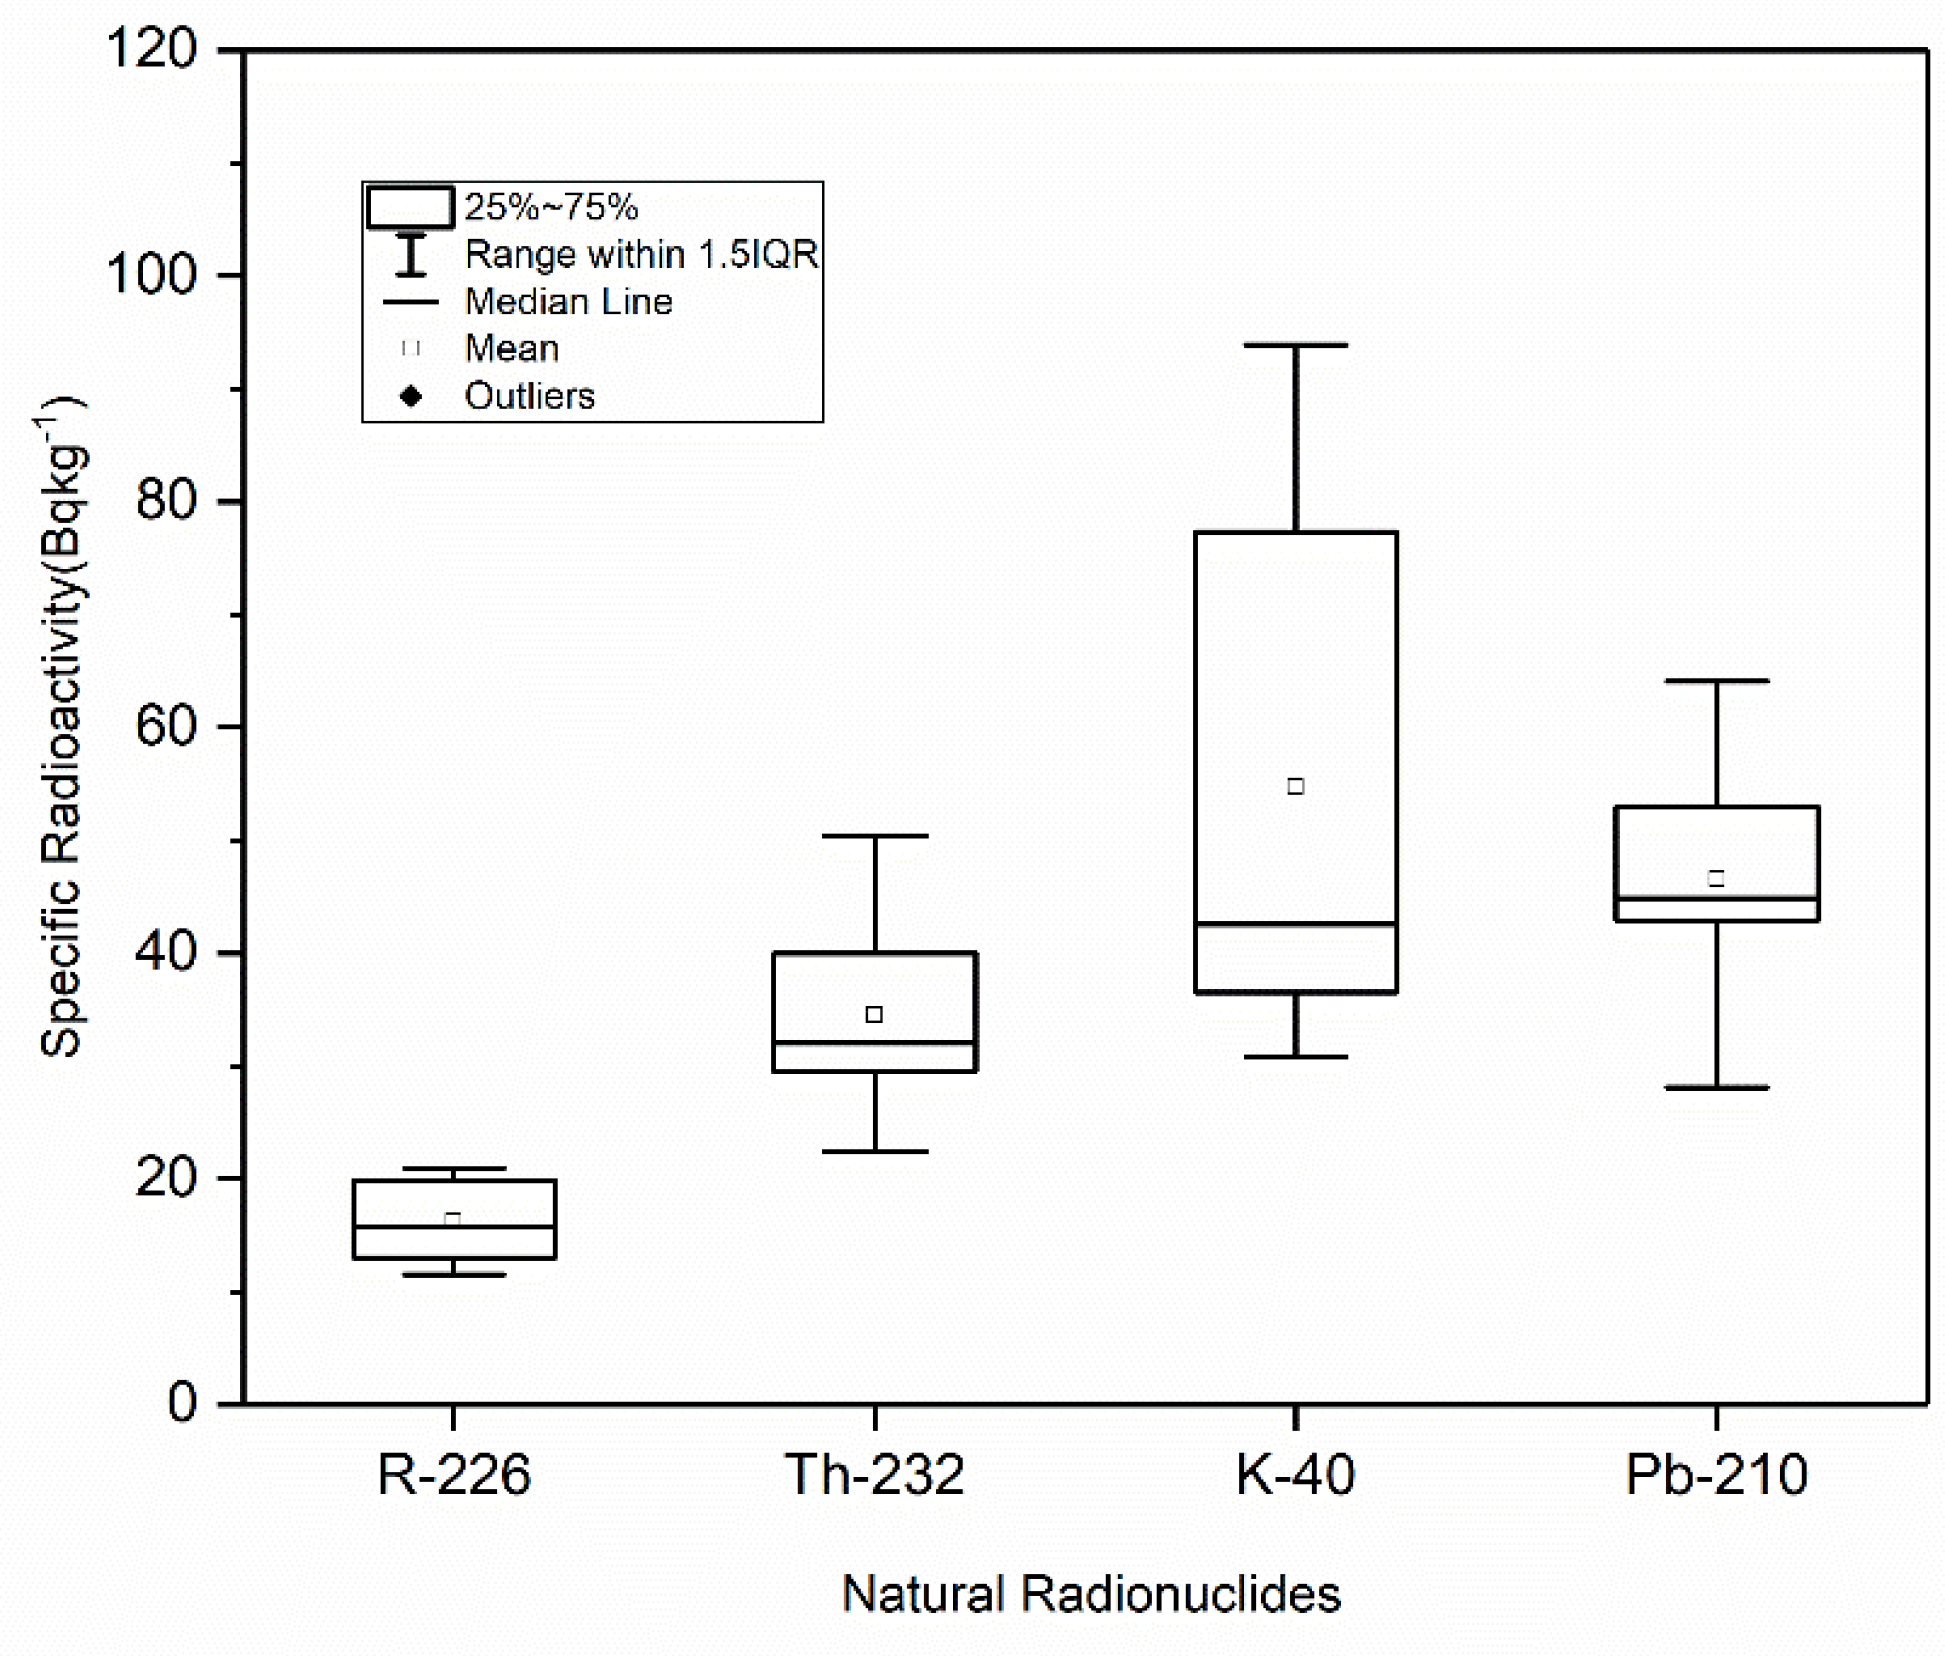
As shown, the radioactivity (Bqkg−1) of 226Ra, 232Th, 40K and 210Pb ranges were 9.324.8 (average: 16.3), 10.4–54.9 (average: 27.8), 29.0–78.7 (average: 45.6), and 24.7–67.4 (average: 44.9) Bqkg−1, respectively, in coastal sands, and from 11.0–21.0 (average: 16.2), 22.0–50.4 (average: 34.5), 30.8–93.4 (average: 54.7), and 28.1–65.1Bqkg−1 (average: 46.8), respectively, in marine sediments. Figure 2 and Figure 3 show the boxplot distribution of the radioactivity distribution of 226Ra, 232Th, 40K, and 210Pb radionuclides in sand and sediment, respectively. A large variability in activity concentrations is shown among radionuclides, reflecting the geological and morphological characteristics of the collected sediments, as well as their respective radionuclide contents. A high degree of variability in the measured radioactivity was shown in the studied samples, as these samples reflect the geological characteristics of their sites of origin. Usually, the radioactivity of 238U and 232Th is linked with heavy minerals, while that of 40K is associated with clay minerals.
The radioisotope of 210Pb revealed relatively high activity concentration (especially in the S05 and S07 sampling locations), considering a potential different origin than that of the local mineralogy, which could be due to submarine groundwater discharge sources in these areas.
In Table 2, a comparison is given of the average (range) radioactivity concentrations (Bqkg−1) obtained in this work versus in the literature. According to the IAEA, when the activity of the 238U or 232Th decay series is ≤1000 Bqkg−1and that of 40K is ≤10,000 Bqkg−1, the radioactive material may not be regarded as naturally occurring and is thus exempt from regulations [14]. The measured 210Pb in marine sediment originated from their parents 222Rn and 226Ra, which depend on several natural and environmental processes [17]. The radioactivity of 210Pb in the present work is comparable to values reported in the literature [9,10,11,12,13,17,18,19].
Figure 4 shows a bar chart illustrating the distribution of activity concentrations of 137Cs among different samples. As shown, the radioactivity concentration of the artificial radionuclide 137Cs varied from 0.04–0.19 Bqkg−1 (average: 0.09). The 137Cs radioactivity levels in the current study were very low in most samples, suggestive of a low level of contamination. 137Cs in marine and other environments may have radiological impacts given its long half live, high yield, and high uptake and retention in biological systems. The results of our study were compared with the results of similar studies reported in different countries around the world (Table 2). As shown, the radioactivity levels in our study are comparable to those reported in Kuwait, Qatar, Saudi Arabia, and Greece, and can be explained by the fact that these studies were carried out in adjacent marine environments in which these radionuclides could be easily transported.
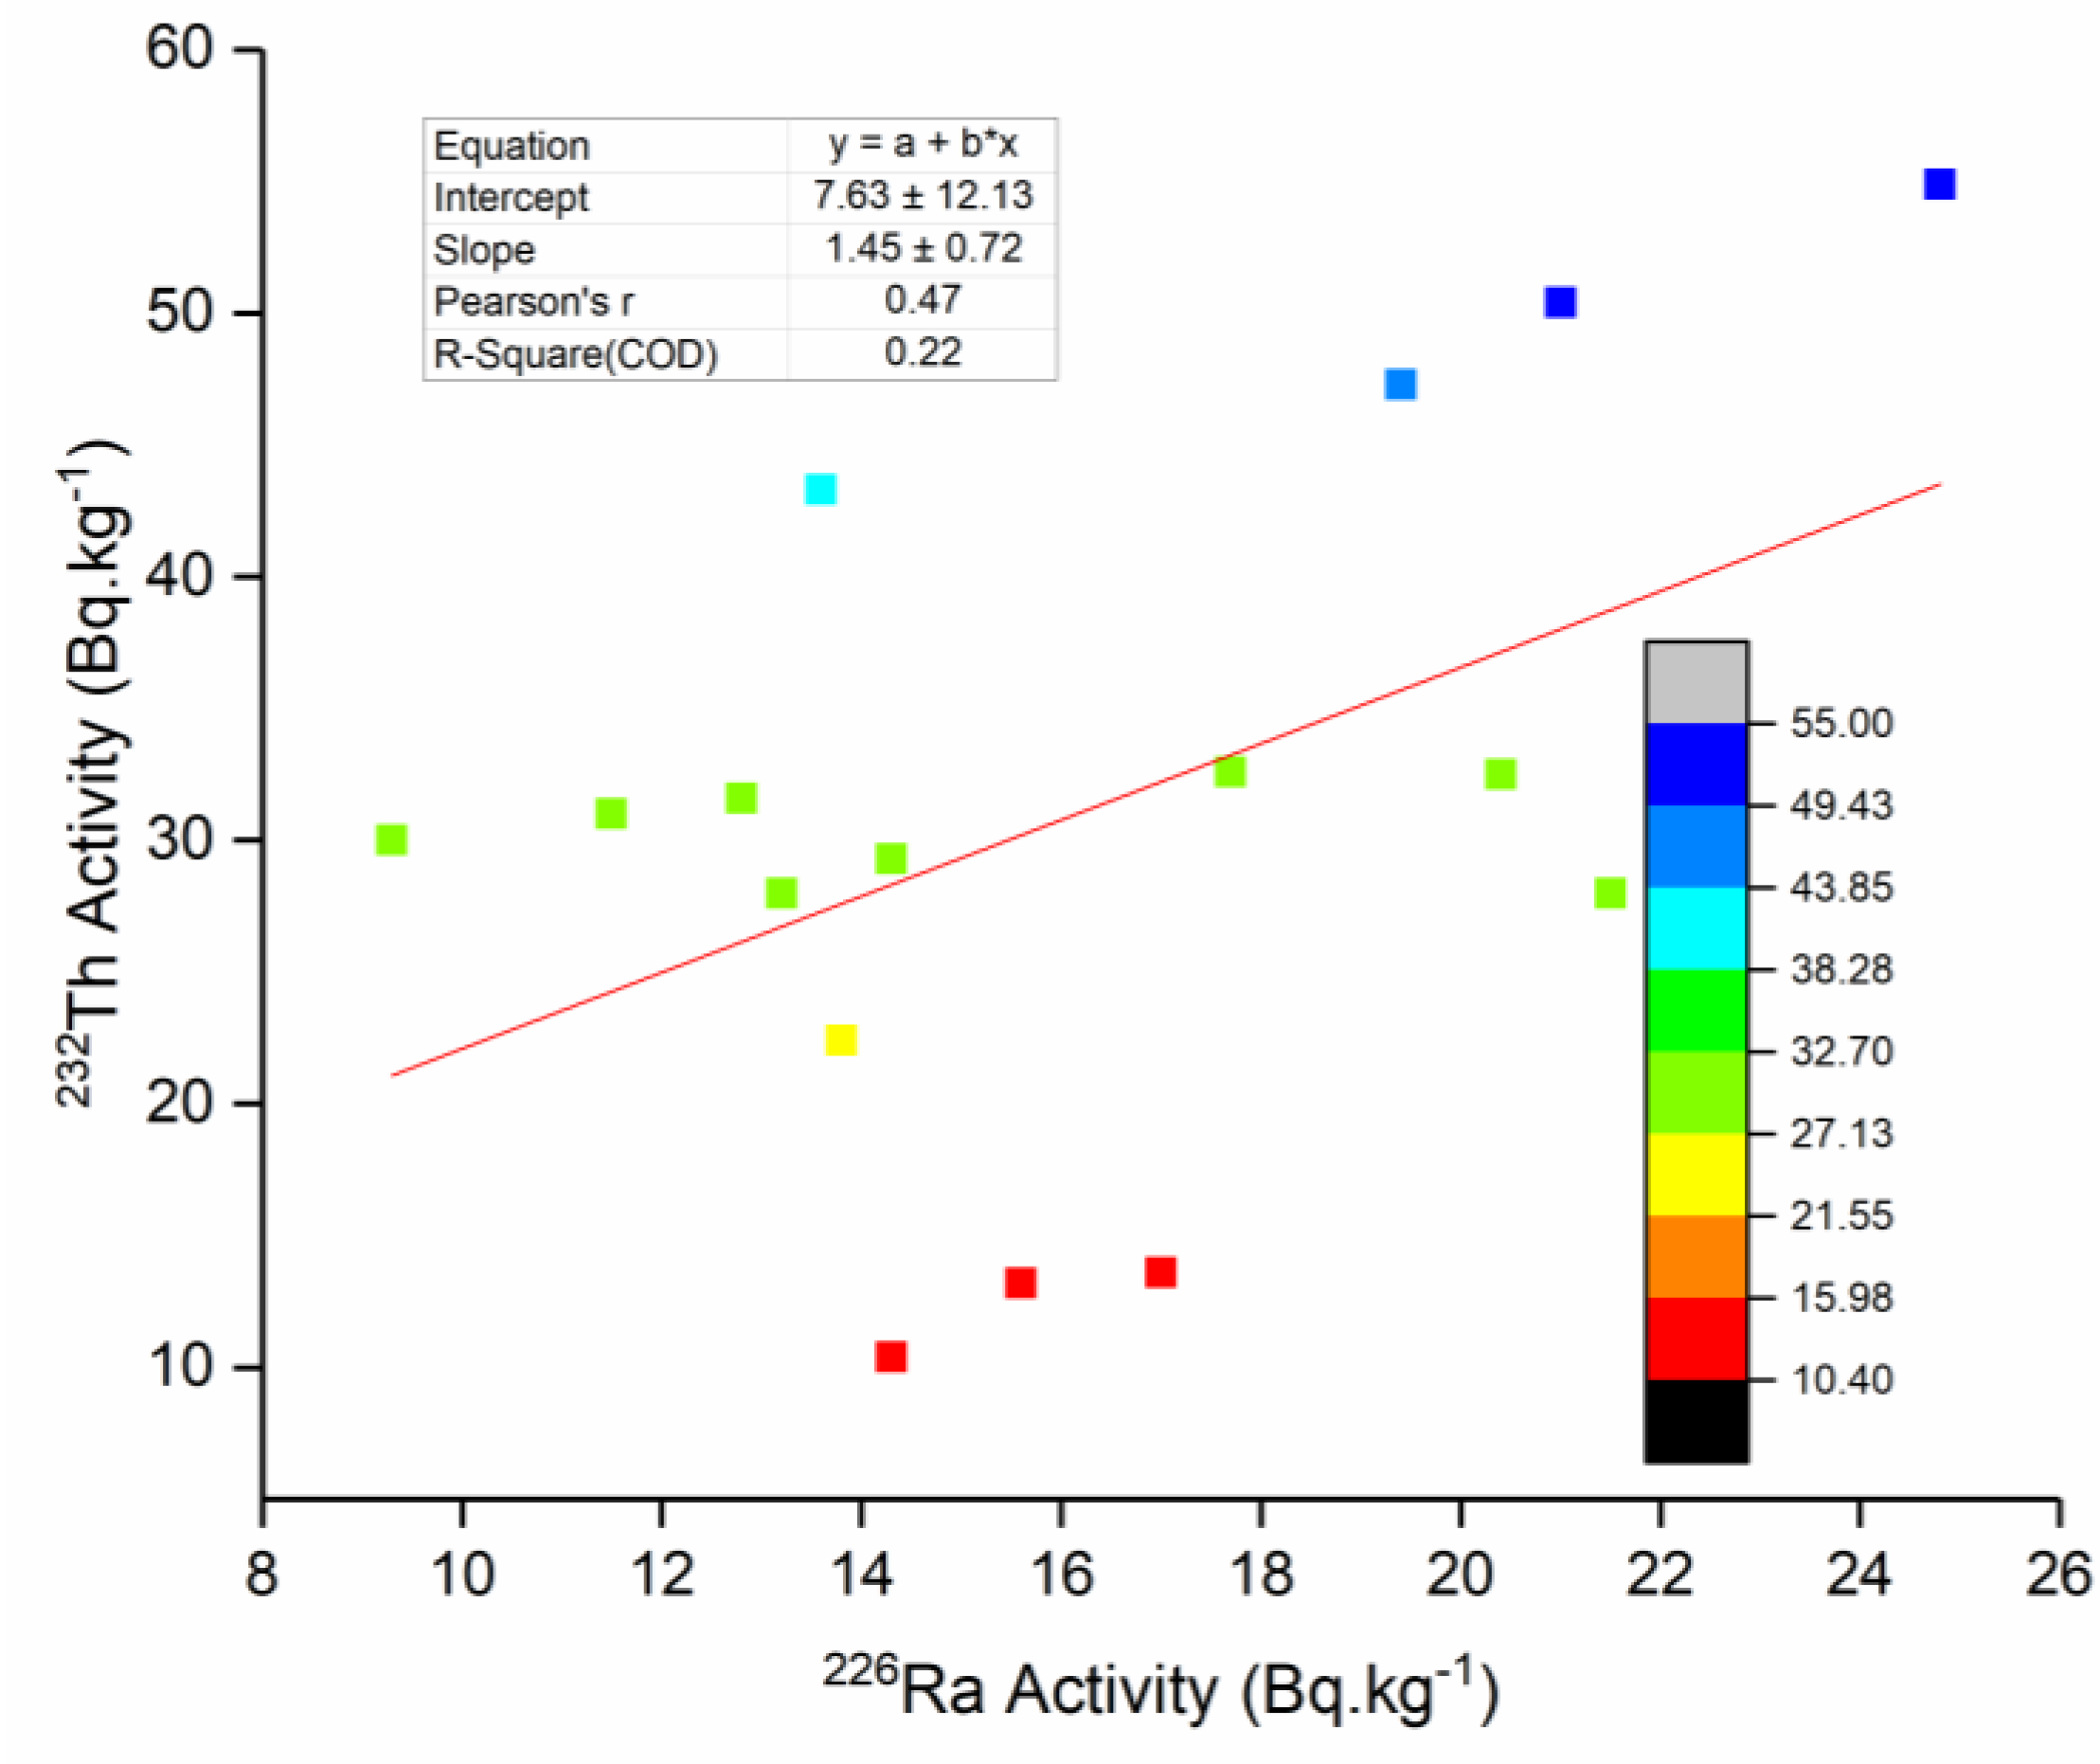
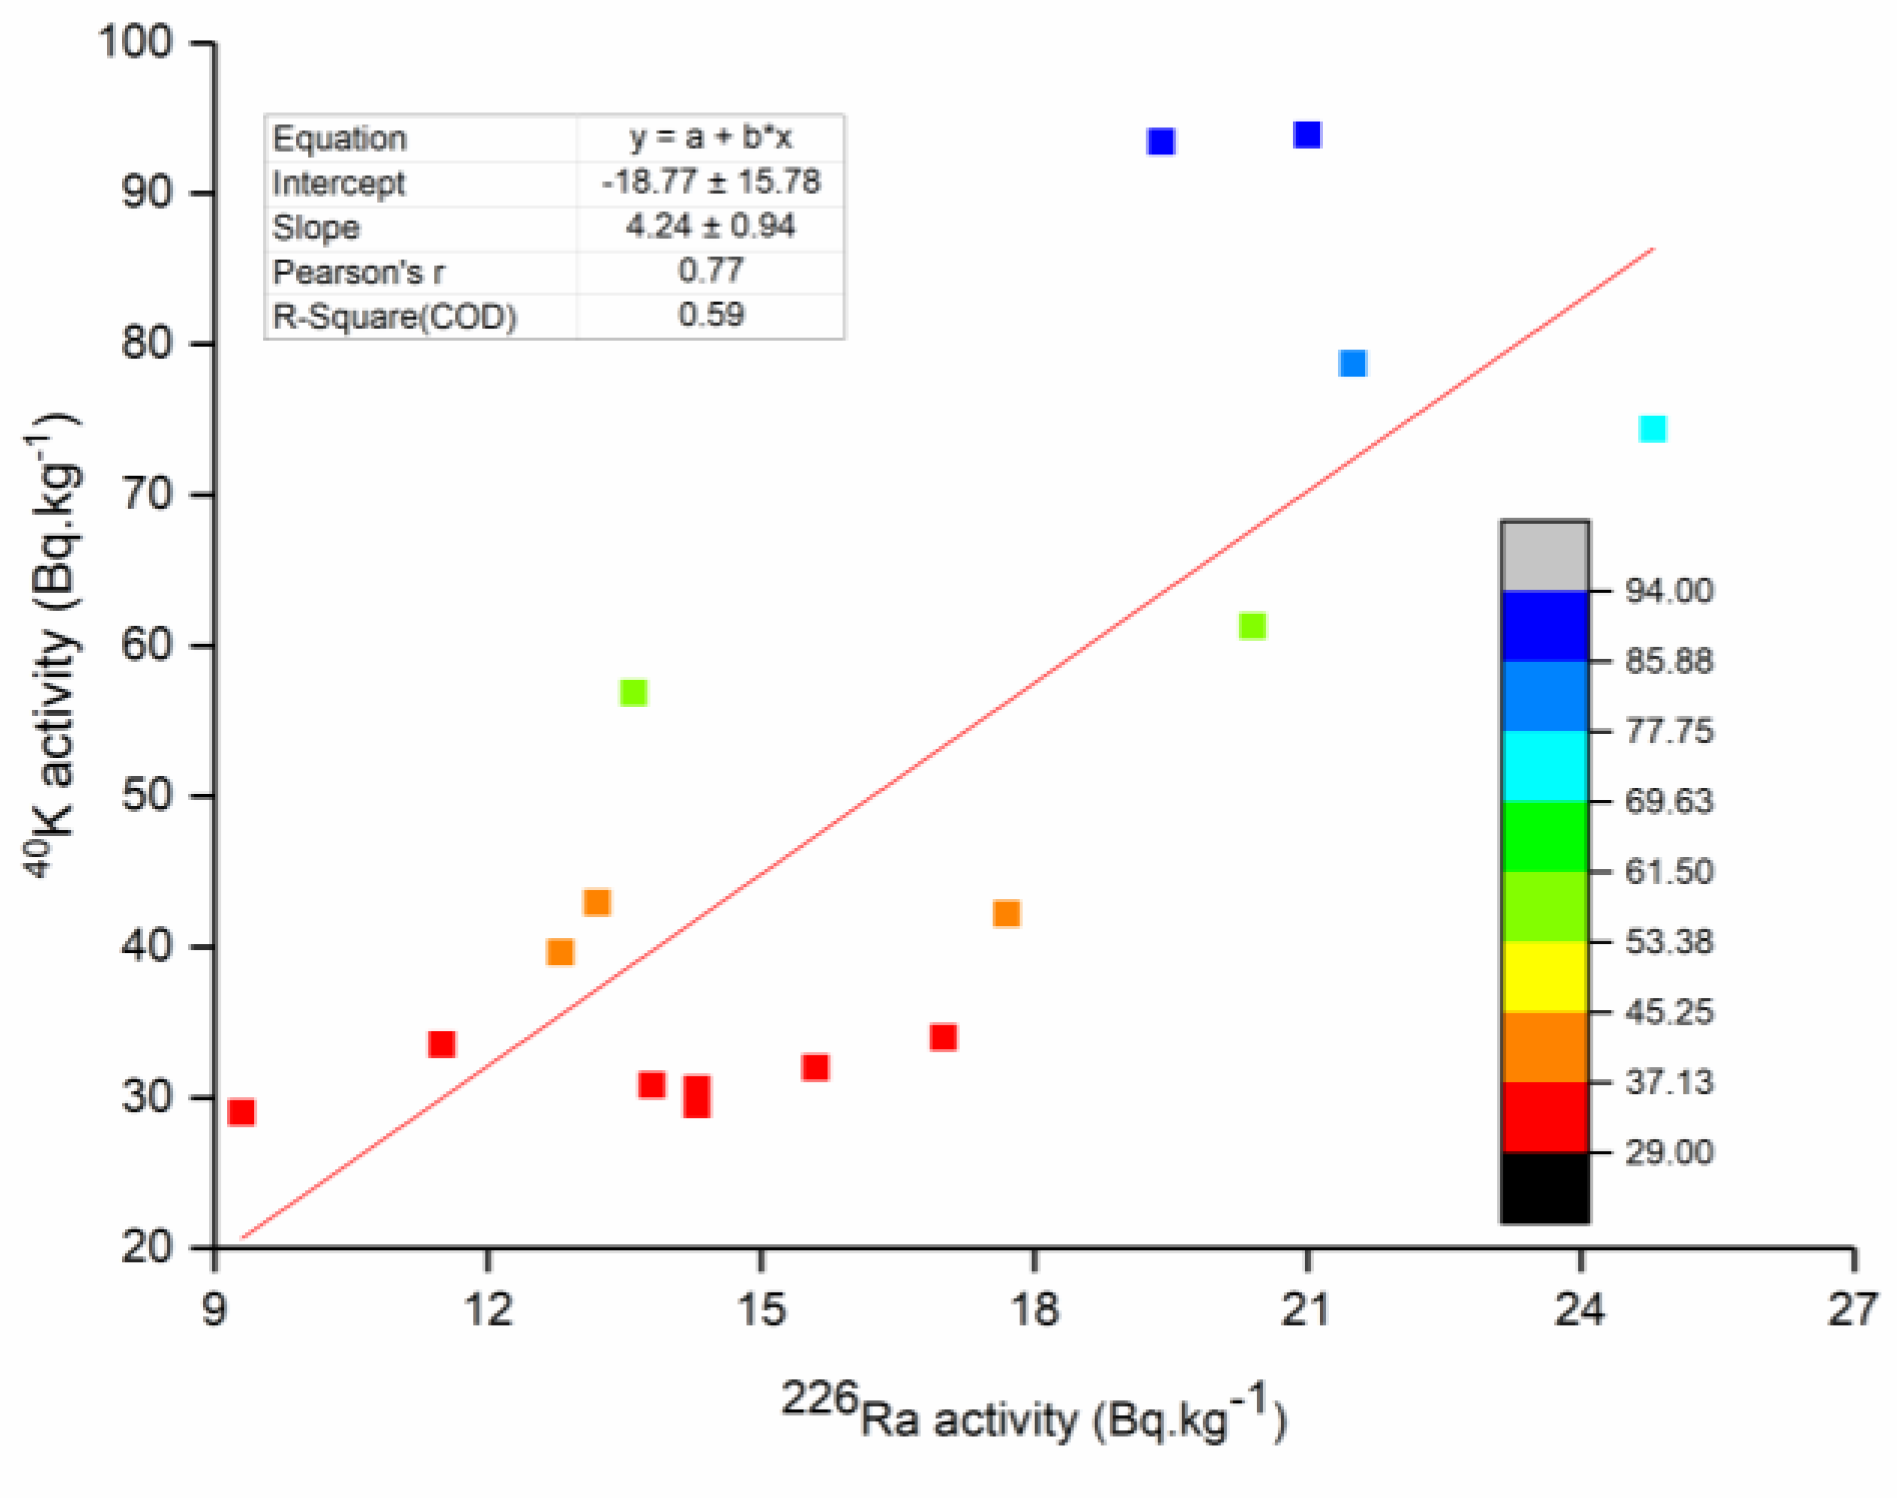
Correlations between the activity concentrations of the radionuclides are presented in Table 3. The results are graphically depicted in Figure 5, showing the correlations between the activity concentrations of 226Ra and 232Th. Figure 6 shows the correlations between the activity concentrations of the naturally occurring radionuclides 226Ra and 40K are illustrated using corresponding colour codes.
The correlation between 226Ra and 232Th was not significant (r = 0.47, p > 0.05), whereas a highly significant correlation was observed between 226Ra and 40K (r = 0.77, p < 0.001) and between 232Th and 40K (r = 0.75, p < 0.001). The observed correlations could be attributed to the origin of these radionuclides.

3.2. Assessing Radiological Hazards

3.2.1. Radium-Equivalent Activity

Radium-equivalent activity (Raeq) is a single parameter that represents the collective risk of 226Ra, 232Th, and 40K radioactivity [21,22]. This parameter can be used to assess whether external doses to the public exceed the recommended annual dose limit of 1 mSv. The Raeq is determined using Equation (5):
Ra eq = A Ra + 1.43 A th + 0.077 A K
where ARa, ATh, and Ak are the specific activities (Bq kg−1) of 226Ra, 232Th, and 40K, respectively, in the studied samples. Table 4 shows the radium equivalent activity ( Ra eq ), absorbed dose rates, effective rates, and external hazard index associated with the radioactivity in sand. As presented, the Raeq ranged from 31.5 to 109.0 Bqkg−1 (average: 59.6), with values < 370 Bqkg−1 representing the recommended limit for radiological risk control [2].

3.2.2. External Hazard Index (Hex)

The external radiation exposure due to natural radioactivity is defined in terms of the external hazard index (Hex), calculated as follows [2,23]:
H ex = ( A Ra 370 + A Th 259 + A K 4810 ) 1
where ARa, ATh, and Ak are the specific activities (Bq kg−1) of 226Ra, 232Th, and 40K, respectively in the studied samples. To comply with the requirements of the 1 mSv annual dose limit for the public, Hex should be <1, as shown above [2]. As seen in Table 4, the Hex values ranged from 0.09 to 0.30. These results ensure that the public’s exposure to the environmental radioactivity of 226Ra, 232Th, and 40K radionuclides in coastal sand remain within acceptable limits.

3.3. External Absorbed Dose Rates

The naturally occurring radioactivity in the environment is a major source of external exposure to the world’s population. The indoor (Din) and outdoor (Dout) external gamma doses due to the presence of 226Ra, 232Th, and 40K in coastal sand 1 m above the ground surface can be calculated as follows [2,23]:
D out ( nGyh 1 ) = 0.427 A Ra + 0.662 A Th + 0.043 A K
D in ( nGyh 1 ) = 0.92 A Ra + 1.1 A Th + 0.081 A K
where ARa, ATh, and Ak are the specific activities (Bq kg−1) of 226Ra, 232Th, and 40K, respectively, in the studied samples. As shown in Table 4, the D in values (nGy.h−1) ranged from 27.0 to 89.2 (average: 49.26), whereas D out values (nGy.h−1) ranged from 14.3 to 50.2 (average: 27.4). The current average dose figures fell below the global average value (55 nGy.h−1) for areas that were deemed to have normal levels of natural background radiation. Our results are lower than the doses reported by in Pakistan (87.47 nGy.h−1) [24]. According to UNSCEAR reports, a conversion coefficient, absorbed dose to effective dose received by adults of 0.7 Sv/Gy, and an outdoor occupancy factor of 0.2 were used [2]. Thus, the annual effective radioactivity dose in coastal sand can be estimated according to the following equations:
AED out ( Svy 1 ) = D out ( nGyh 1 ) × 8760 hy 1 × 0.2 × 0.7 SvGy 1 × 10 3
AED in ( Svy 1 ) = D in ( nGyh 1 ) × 8760 hy 1 × 0.8 × 0.7 SvGy 1 × 10 3
AED total ( Svy 1 ) = AED out + AED in
The total effective dose and AED Total (µSvy−1) ranged from 150.2 to 498.9 (average: 275.2) (Table 4). The global average annual effective dose from natural radionuclides (i.e., the sum of effective doses from both indoor and outdoor occupations) is 0.48 mSvy−1. The results for individual countries generally fall within the range of 0.3–0.6 mSv. The effective dose value obtained in this study is almost half of the value reported in Pakistan (0.92 mSvy−1) [24]. The effective dose is an important dosimetric quantity that allows different ionising radiation exposure categories to be compared and can be used to obtain broad estimates of radiation-attributed cancer incidents.

3.4. Excess Lifetime Cancer Risk (ELCR)

Low doses of ionising radiation, such as those encountered in response to natural radioactivity, are known to cause stochastic effects in the form of cancer. The probability with which these risks occur increases with increasing doses. The International Commission on Radiological Protection (ICRP) has estimated the number of fatalities per 1 Sv effective dose to be 0.05; this is known as the fatal risk factor. The ELCR can thus be determined using Equation (12) [2,23]:
ELCR = AED total ( Svy 1 ) × LF × RF ( Sv 1 )
where AED total ( Svy 1 ) is the annual effective dose calculated from indoor and outdoor exposure, LE is life expectancy (66 years), and RF is fatal risk factor per Sievert, which is 0.05 Sv−1, as per ICRP Report [6]. The average number of ECR per million population ranged from 58–203 (average: 111) due to radioactivity from sand (Table 4).

3.5. Annual Gonadal Dose Equivalent (AGDE)

The AGDE was computed from activity using Equation (13) [2,23]:
AGDE   ( mSv . y 1 ) = 3.09 A Ra + 4.18 A Th + 0.314 A K
where ARa, ATh, and Ak are the specific activities (Bq kg−1) of 226Ra, 232Th, and 40K, respectively, in the studied samples. The average AGD (µGy.y−1) ranged from 97.3 to 329.5 (average: 181.1) in coastal sand (Table 4). The global value is about 300 µGy.y−1 according to UNSCEAR reports [2].

3.6. Radiological Risk to Non-Human Biota

We have used the ERICA Tool software (Environmental Risk from Ionising Contaminants: Assessment and Management) to estimate the radiological risk parameters to non-human biota in marine environments [25]. ERICA Tool is a dosimetric model that enables calculations of internal and external absorbed dose rates to non-human biota covering a wide range of body masses and habitats for all radionuclides of interest. In addition, the software estimates the activity concentrations in biota; total absorbed dose rates, and risk quotients from the media (sediment) activity concentrations.
Table 5 shows the activity concentration in reference organisms in the marine environment determined using ERICA Tool. Total absorbed dose rate per organism as well as risk coefficients to non-human biota are presented in Table 6.
As shown in Table 5, the highest radioactivity was evident in phytoplankton, followed by benthic fish. The levels of 210Pb were significantly high in phytoplankton compared to those of the sediments indicating high 210Pb bioaccumulation in phytoplankton as suggested in the literature [26,27].
Table 6 presents the total absorbed dose rate to marine organisms and risk quotients due to radioactivity in marine sediments calculated using the ERICA Tool.
As shown, excluding phytoplankton, the estimated total dose rate per organism was below the background dose rates (Table 6). However, the total dose rate for phytoplankton exceeds the background dose rate by 48 %, which is due to the radioactivity bioaccumulation in phytoplankton. Thus, the total dose rate and risk quotients are comparable to those presented by Botwe et al. [28] in Ghana.

4. Conclusions

To recapitulate, radioactivity levels were determined for common natural and anthropogenic radionuclides in costal sand and marine sediments. The results show varying levels of natural radioactivity that were comparable to those reported in similar studies. A significant correlation was shown for 232Th and 40K, and for 226Ra and 232Th; these relationships could be attributed to the origin of these radionuclides. The radioactivity levels in sediments are a source of radiation exposure for marine organisms. Regular monitoring of radioactivity levels is vital for radiation risk confinement. The results provide important baseline data to which future radioactivity levels in marine environments can be compared. Considering the fact that oceans and seas form the ultimate sink of contaminants, including radioactivity, future research initiatives that study radioactivity levels in marine environments and assess associated radiological hazards to the population are of utmost importance in order to ensure protection of the marine environment. Such a project should also consider investigating radioactivity from artificial radionuclides.

Author Contributions

Conceptualization and Methodology, I.I.S.; Validation and Formal Analysis, I.I.S. and K.A.; Investigation, K.A.; Resources, I.I.S.; Writing—Original Draft Preparation, K.A.; Writing—Review and Editing, I.I.S. and K.A.; Supervision, I.I.S.; Funding Acquisition, N/A. Both authors have read and agreed to the published version of the manuscript.

Funding

This research received no external funding.

Institutional Review Board Statement

Not applicable.

Informed Consent Statement

Not applicable.

Data Availability Statement

The data presented in this study are available on request from the corresponding author. The data are not publicly available due to privacy reasons.

Conflicts of Interest

The authors declare no conflict of interest.

References

  1. Yii, M.W.; Zaharudin, A.; Abdul-Kadir, I. Distribution of naturally occurring radionuclides activity concentration in East Malaysian marine sediment. Appl. Radiat. Isot. 2009, 67, 630–635. [Google Scholar] [CrossRef] [PubMed]
  2. United Nations Scientific Committee on the Effects of Atomic Radiation (UNSCEAR). Sources, Effects and Risks of Ionization Radiation; Report to the General Assembly, with Scientific Annexes B: Exposures from Natural Radiation Sources; UNSCEAR: New York, NY, USA, 1993. [Google Scholar]
  3. Pálsson, S.E.; Skuterud, L.; Fesenko, S.; Golikov, V. Radionuclide transfer in arctic ecosystems. In Quantification of Radionuclide Transfers in Terrestrial and Freshwater Environments for Radiological Assessments; IAEATECDOC-1616; IAEA: Vienna, Austria, 2009; pp. 381–396. [Google Scholar]
  4. International Atomic Energy Agency (IAEA). Extent of Environmental Contamination by Naturally Occurring Radioactive Material (NORM) and Technological Options for Mitigation; IAEA Technical Reports Series No. 419; IAEA: Vienna, Austria, 2003. [Google Scholar]
  5. Valentin, J. Environmental Protection: The Concept and Use of Reference Animals and Plants. Annals of the ICRP; ICRP Publication 108; ICRP: Ottawa, ON, Canada, 2008. [Google Scholar]
  6. ICRP. The 2007 Recommendations of the International Commission on Radiological Protection (ICRP); ICRP Publication 103; Ann. ICRP 37; Pergamon Press: Oxford, UK, 2007. [Google Scholar]
  7. IAEA. Radiation Protection and Safety of Radiation Sources: International Basic Safety Standards; International Atomic Energy Agency (IAEA): Vienna, Austria, 2014. [Google Scholar]
  8. Adreani, T.E.; Mattar, E.; Alsafi, K.; Sulieman, A.; Suliman, I.I. Natural radioactivity and radiological risk parameters in local and imported building materials used in Sudan. Appl. Ecol. Environ. Res. 2020, 18, 7563–7572. [Google Scholar] [CrossRef]
  9. Al-Qaradawi, I.; Abdel-Moati, M.; Al-Yafei, M.A.A.; Al-Ansari, E.; Al-Maslamani, I.; Holm, E.; Al-Shaikh, I.; Mauring, A.; Pinto, P.V.; Abdulmalik, D.; et al. Radioactivity levels in the marine environment along the Exclusive Economic Zone (EEZ) of Qatar. Mar. Pollut. Bull. 2015, 90, 323–329. [Google Scholar] [CrossRef] [PubMed]
  10. Uddin, S.; Aba, A.; Fowler, S.W.; Behbehani, M.; Ismaeel, A.; Al-Shammari, H.; Alboloushi, A.; Mietelski, J.W.; Al-Ghadban, A.; Al-Ghunaim, A.; et al. Radioactivity in the Kuwait marine environment—Baseline measurements and review. Mar. Pollut. Bull. 2015, 100, 651–661. [Google Scholar] [CrossRef]
  11. Zare, M.R.; Mostajaboddavati, M.; Kamali, M.; Abdi, M.R.; Mortazavi, M.S. 235U, 238U, 232Th, 40K and 137Cs activity concentrations in marine sediments along the northern coast of Oman Sea using high-resolution gamma-ray spectrometry. Mar. Pollut. Bull. 2012, 64, 1956–1961. [Google Scholar] [CrossRef] [PubMed]
  12. Al-Trabulsy, H.A.; Khater, A.E.M.; Habbani, F.I. Radioactivity levels and radiological hazard indices at the Saudi coastline of the Gulf of Aqaba. Radiat. Phys. Chem. 2011, 80, 343–348. [Google Scholar] [CrossRef]
  13. Al-Zamel, A.Z.; Bou-Rabee, F.; Olszewski, M.; Bem, H. Natural radionuclides and 137Cs activity concentration in the bottom sediment cores from Kuwait Bay. J. Radioanal. Nucl. Chem. 2005, 266, 269–276. [Google Scholar] [CrossRef]
  14. Saleh, I.H. Radioactivity of 238U, 232Th, 40 K, and 137Cs and assessment of depleted uranium in soil of the Musandam Peninsula, Sultanate of Oman. Turk. J. Eng. Environ. Sci. 2012, 36, 236–248. [Google Scholar]
  15. ISO; IEC; BIPM OIML. Guide to the Expression of Uncertainty in Measurement; ISO: Geneva, Switzerland, 1995. [Google Scholar]
  16. International Atomic Energy Agency (IAEA). Quantifying Uncertainty in Nuclear Analytical Measurements; IAEA-TECDOC-1401; IAEA: Vienna, Austria, 2004. [Google Scholar]
  17. Pappa, F.K.; Tsabaris, C.; Ioannidou, A.; Patiris, D.L.; Kaberi, H.; Pashalidis, I.; Eleftheriou, G.; Androulakaki, E.G.; Vlastou, R. Radioactivity and metal concentrations in marine sediments associated with mining activities in Ierissos Gulf, North Aegean Sea, Greece. Appl. Radiat. Isot. 2017, 116, 22–33. [Google Scholar] [CrossRef] [PubMed]
  18. Eleftheriou, G.; Tsabaris, C.; Kapsimalis, V.; Patiris, D.L.; Androulakaki, E.G.; Pappa, F.K.; Kokkoris, M.; Vlastou, R. Radionuclides and heavy metals concentrations at the seabed of NW Piraeus, Greece. In Proceedings of the 22nd Conference of the Hellenic Nuclear Physics Society, Athens, Greece, 30 May–1 June 2013. [Google Scholar]
  19. Wang, J.; Du, J.; Bi, Q. Natural radioactivity assessment of surface sediments in the Yangtze Estuary. Mar. Pollut. Bull. 2017, 114, 602–608. [Google Scholar] [CrossRef] [PubMed]
  20. Hanfi, M.Y.; Masoud, M.S.; Ambrosino, F.; Mostafa, M.Y. Natural radiological characterization at the Gabal El Seila region (Egypt). Appl. Radiat. Isot. 2021, 31, 109705. [Google Scholar] [CrossRef] [PubMed]
  21. Beretka, J.; Mathew, P.J. Natural radioactivity of Australian building materials, industrials wastes and by-products. Health Phys. 1985, 48, 87–95. [Google Scholar] [CrossRef] [PubMed]
  22. Hamilton, E.I. The relative radioactivity of building materials. Am. Ind. Hyg. Assoc. J. 1971, 32, 398–403. [Google Scholar] [CrossRef] [PubMed]
  23. NEA-OECD. Exposure to Radiation from the Natural Radioactivity in Building Materials: Report by a Group of Exports of the OECD Nuclear Energy Agency; NEA-OECD: Paris, France, 1979; pp. 13–19. [Google Scholar]
  24. Qureshi, A.A.; Tariq, S.; Din, K.U.; Manzoor, S.; Calligaris, C.; Waheed, A. Evaluation of excessive lifetime cancer risk due to natural radioactivity in the rivers sediments of Northern Pakistan. J. Radiat. Res. Appl. Sci. 2014, 7, 438–447. [Google Scholar] [CrossRef] [Green Version]
  25. Brown, J.E.; Alfonso, B.; Avila, R.; Beresford, N.A.; Copplestone, D.; Pröhl, G.; Ulanovsky, A. The ERICA tool. J. Environ. Radioact. 2008, 99, 1371–1383. [Google Scholar] [CrossRef] [PubMed] [Green Version]
  26. Sirelkhatim, D.A.; Sam, A.K.; Hassona, R.K. Distribution of 226Ra–210Pb–210Po in marine biota and surface sediments of the Red Sea, Sudan. J. Environ. Radioact. 2008, 99, 1825–1828. [Google Scholar] [CrossRef] [PubMed]
  27. Sugandhi, S.; Joshi, V.M.; Ravi, P.M. Studies on natural and anthropogenic radionuclides in sediment and biota of Mumbai Harbour Bay. J. Radioanal. Nucl. Chem. 2014, 300, 67–70. [Google Scholar] [CrossRef]
  28. Botwe, B.O.; Schirone, A.; Delbono, I.; Barsanti, M.; Delfanti, R.; Kelderman, P.; Nyarko, E.; Lens, P.N. Radioactivity concentrations and their radiological significance in sediments of the Tema Harbour (Greater Accra, Ghana). J. Radiat. Res. Appl. Sci. 2017, 10, 63–71. [Google Scholar] [CrossRef] [Green Version]
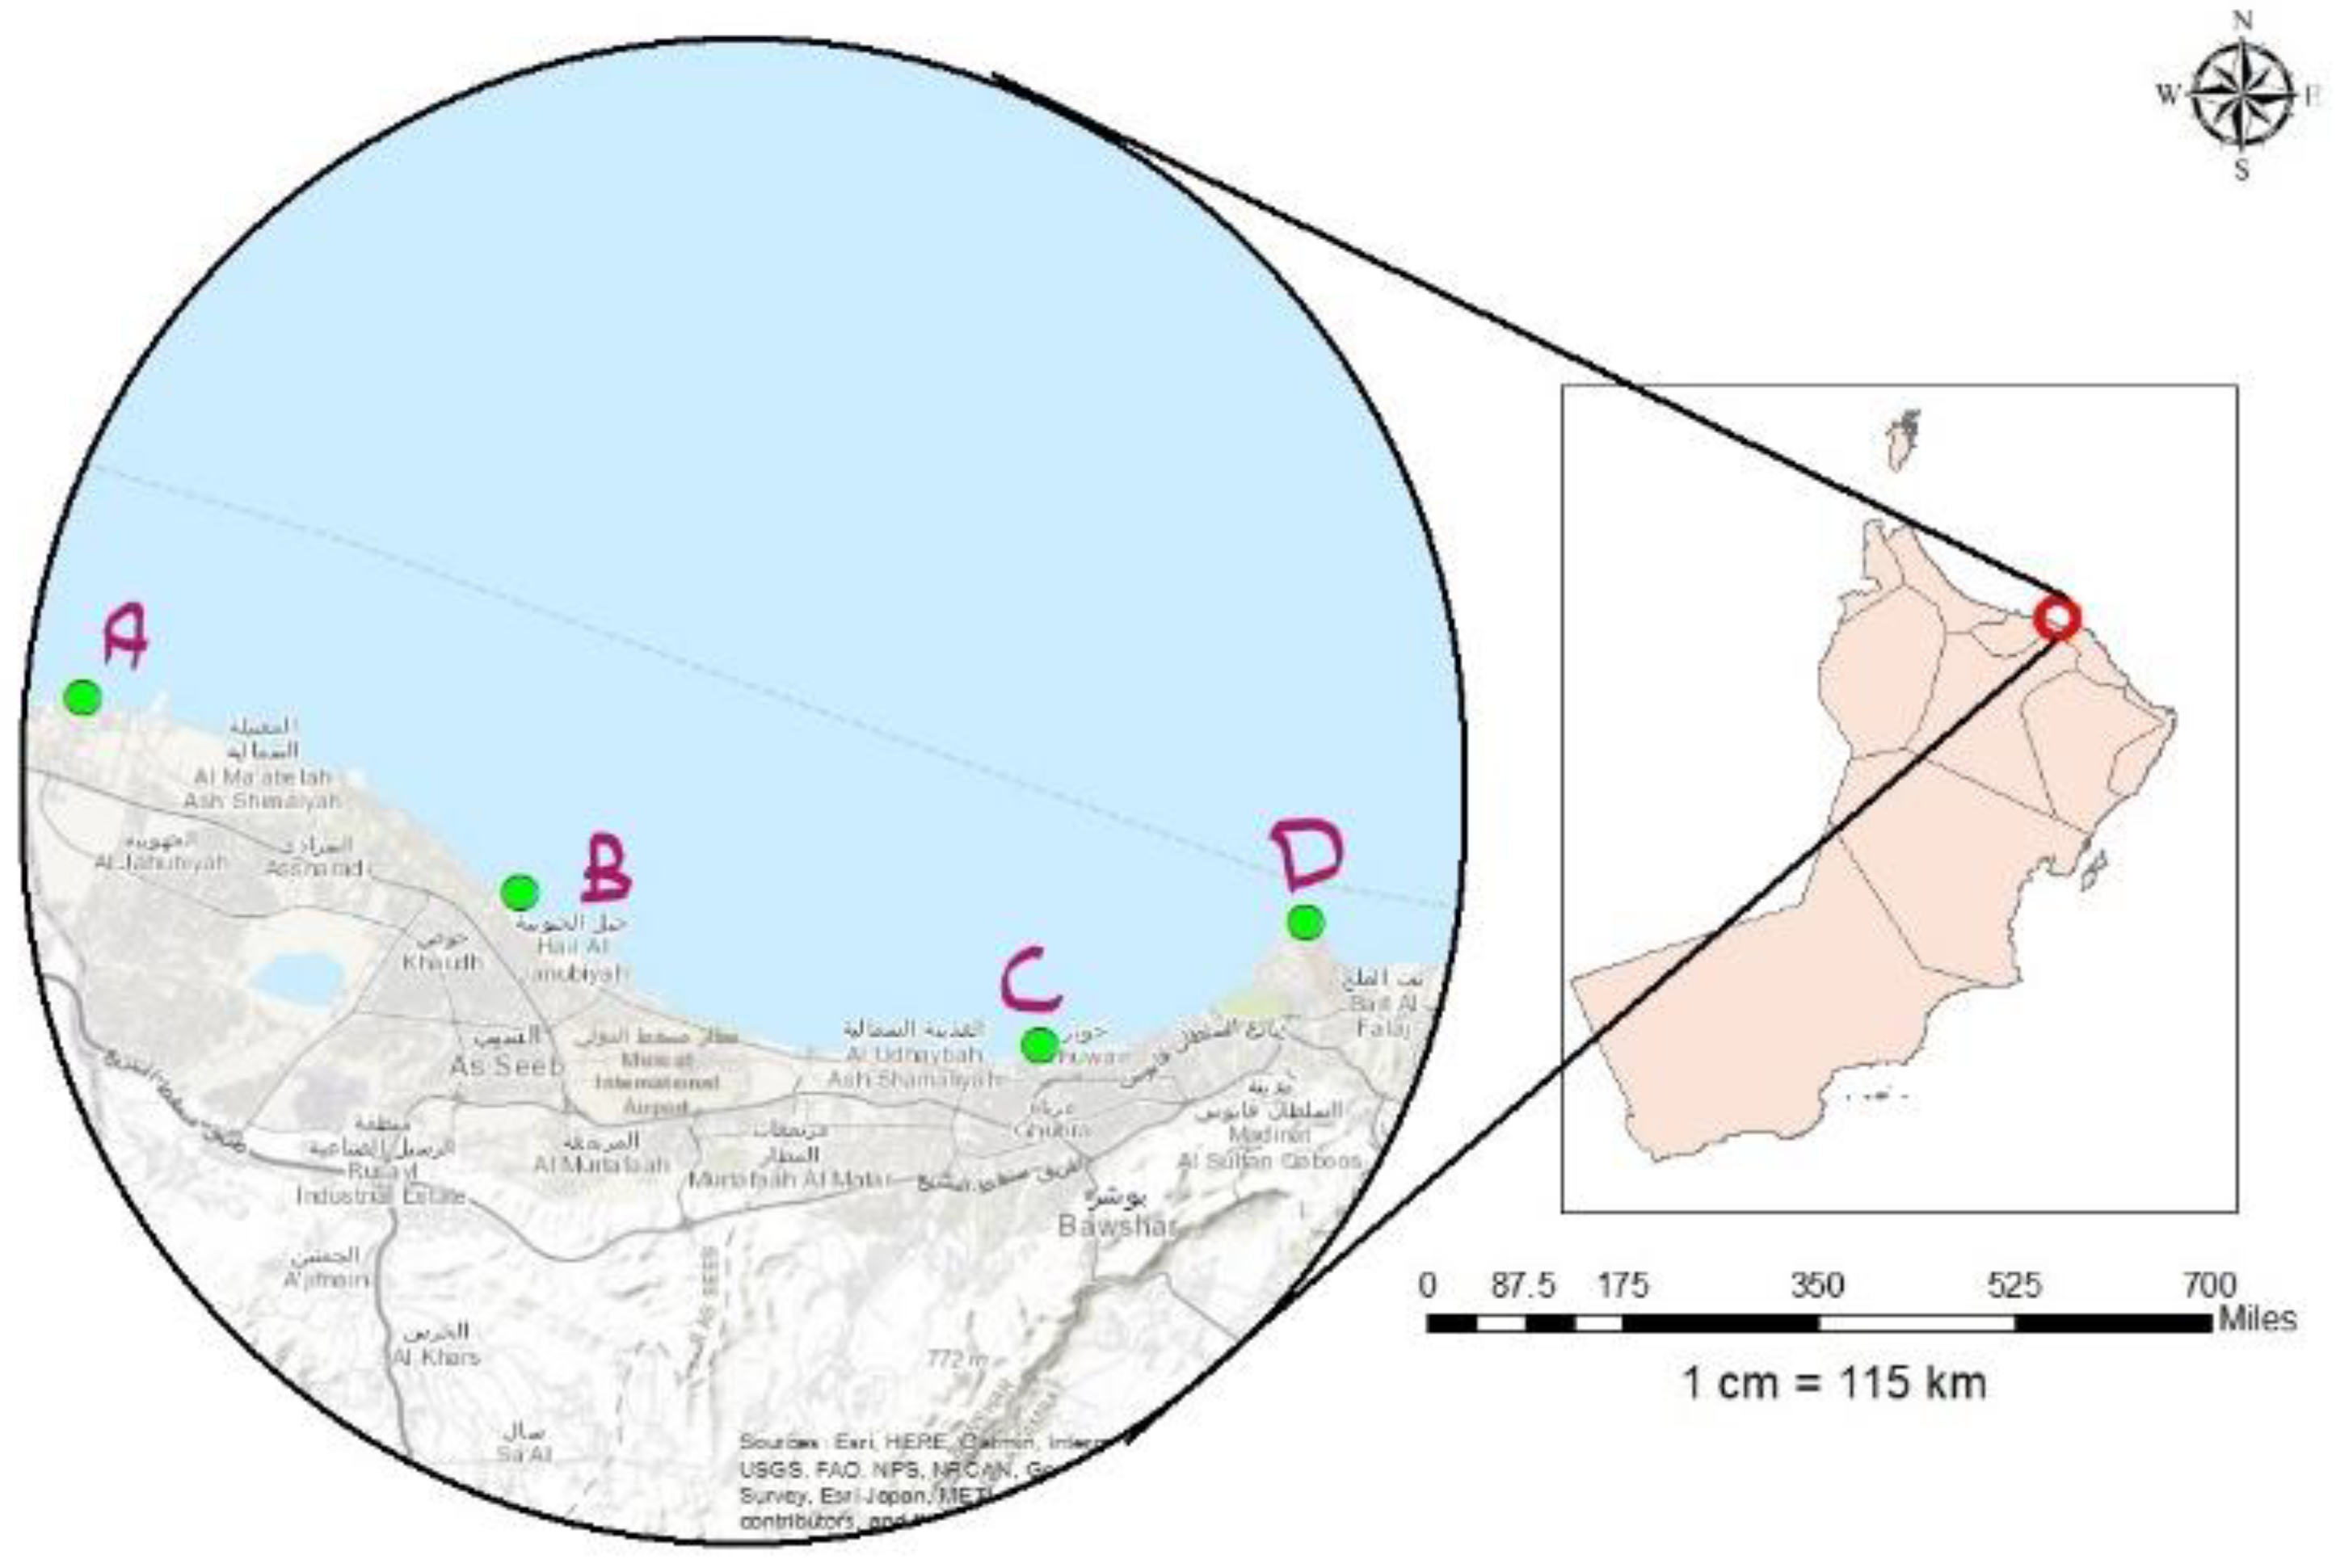
Figure 1. Map of Oman showing Muscat city, Gulf of Oman and the four sample locations: Manuma Beach (A); Seeb Beach (B); Aziba Beach (C); and Qurum Beach (D).
Life 11 00549 g001
Figure 2. Boxplot of distributions of the radioactivity concentrations for 226Ra, 232Th, 40K, and 210Pb (natural radionuclides) in marine coastal sands.
Life 11 00549 g002
Figure 3. Boxplot illustrating the distributions of radioactivity concentrations for 226Ra, 232Th, 40K, and 210Pb natural radionuclides in marine sediments.
Life 11 00549 g003
Figure 4. Bar charts of the radioactivity concentration of the artificial radionuclide, 137Cs.
Life 11 00549 g004
Figure 5. Correlation between the activity concentrations of 226Ra and 232Th (natural radionuclides); the colour codes correspond with 232Th activity.
Life 11 00549 g005
Figure 6. Correlation between the activity concentrations of 226Ra and 40K (natural radionuclides); the colour codes correspond with 40K activity.
Life 11 00549 g006
Table 1. Radioactivity concentrations (Bqkg−1) of 226Ra, 232Th, 40K, 210Pb, and 137Cs in coastal marine sands and sediments.
Sample CodeWeight (kg)Activity Concentrations (Bqkg−1)
226Ra232Th40K210Pb137Cs
Beach Sand
S01142121.5 ± 1.428.0 ± 2.878.7 ± 4.8**0.11
S02137124.8 ± 1.254.9 ± 3.174.4 ± 3.242.7 ± 19.40.05
S05159214.3 ± 1.029.3 ± 2.229.5 ± 2.0(125.5 ± 12.2)0.04
S06156814.3 ± 1.010.4 ± 1.130.6 ± 2.124.7 ± 11.40.07
S09150113.6 ± 0.943.3 ± 3.356.9 ± 3.767.4 ± 13.50.19
S1014149.3 ± 0.730.0 ± 2.629.0 ± 2.1**0.13
S13103815.6 ± 1.013.2 ± 1.332.0 ± 2.1**0.07
S14137617.0 ± 1.113.6 ± 1.334.0 ± 2.3**0.15
Average 16.3027.8445.6444.90.10
Marine sediments
S03136321.0 ±1.050.4 ± 3.093.9 ± 3.844.9 ± 1.90.05
S04142519.4 ± 1.447.3 ± 3.893.4 ± 5.7**0.07
S07153212.8 ± 0.831.6 ± 1.239.6 ± 2.3(158.9 ± 12.9)0.07
S08175011.5 ± 0.831.0 ± 2.433.5 ± 2.642.9 ± 12.50.09
S11149613.8 ± 0.822.4 ± 2.230.8 ± 2.853.0 ± 11.40.13
S12142113.2 ± 1.028.0 ± 1.842.9 ± 2.0**0.08
S15133217.7 ± 1.432.6 ± 2.642.2 ± 3.965.1 ± 14.20.09
S16142320.4 ± 1.232.5 ± 1.661.3 ± 2.728.1 ± 13.30.08
Average 16.234.554.746.80.08
The results in the brackets ( ) are outliers and are excluded from the average; ** indicate that the activity is less than the minimum detectable activity (MDA).
Table 2. Comparison of average (range) radioactivity concentrations (Bqkg−1) obtained in this work versus those in the literature.
Location226Ra232Th40K210Pb137CsReferences
World3530400****[2]
Qatar4.2–19.51.0–6.011–188**0.18–0.66[9]
Kuwait17.3–20.515–16.4353–44523.6–44.31.0–3.1[10]
Iran11.8–22.710.7–25223–535**0.14–2.8[11]
Saudi Arabia4.4–19.35.3–58.9324.6–1133**0.6–8.7[12]
Kuwait18.6–21.414.0–17.1351.2–404.0**1.5–2.9[13]
Greece18–8620–31368–61047–1050.7–3.8[17]
China13.7–52.26.1–71.9392–898****[19]
Egypt38.51**33.35659.18**[20]
Oman16.2 (16.3)34.5 (27.8)54.7 (45.6)46.8 (44.9)0.1 (0.1)This stud
** indicate that the activity is less than the minimum detectable activity (MDA).
Table 3. Correlation between activity concentrations of natural radionuclides.
RadionuclideStatistics226Ra232Th40K
226RaCorrelation coefficient10.470.77
p-value-0.07<0.001
232ThCorrelation coefficient0.4710.75
p-value0.07-<0.001
40KCorrelation coefficient0.770.75-
p-value<0.001<0.001<0.001
Table 4. Radium-equivalent activity, absorbed dose rates, effective rates, excessive cancer risk, annual gonadal dose and external hazard index (Hex) associated with the radioactivity in coastal sand.
Sample Code Raq (Bqkg−1) Dose Rate (nGy.h−1) A E D T o t a l (µSvy−1) ELCR
per 10−6
AGD
µGy.y−1
Hex
D i n D o u t
S0167.6 ± 5.756.931.1317.2126208.20.18
S02109.0 ± 4.689.250.2498.9203329.50.30
S0558.5 ± 3.147.726.8267.1108175.90.16
S0631.5 ± 2.627.014.3150.25897.30.09
S0979.5 ± 5.064.736.9362.6149240.90.22
S1054.4 ± 3.443.925.1246.0101163.20.15
S1336.9 ± 2.731.416.8174.868113.40.10
S1439.1 ± 2.933.317.7185.272120.10.11
Average 59.5649.2627.4275.2111181.10.16
Raq is the radium equivalent activity, D i n and D o u t are the indoor and outdoor air absorbed, respectively. A E D T o t a l is the total effective doses due to internal and external radiation exposure. ECR, excessive cancer risk. AGD (µGy.y−1), annual gonadal dose and Hex is the external hazard index.
Table 5. Activity concentration in organism [Bq kg−1 f.w.].
IsotopeActivity in Sediment (Bqkg−1 d.w.)Activity Concentration in Organism (Bq kg−1 f.w.)
Benthic FishMacroalgaeMollusc-BivalvePelagic FishPhytoplanktonZooplankton
Ra-22616.20.430.270.200.433.480.25
Th-23234.30.010.0200.010.013.150.031
Pb-21046.805.800.181.115.8084.32.99
Cs-1370.080.00060.00070.00040.00060.00010.0010
Table 6. Total dose rate per organism and risk coefficients due to radioactivity in marine sediments calculated using the ERICA Tool.
OrganismBackground Dose RatesScreening Value [µGy h−1]Total Dose Rate per Organism [µGy h−1]Risk Quotient
Benthic fish0.58100.0670.007
Macroalgae0.87100.0480.005
Mollusc-bivalve2.0100.0360.004
Pelagic fish0.42100.0590.006
Phytoplankton0.38100.5640.056
Zooplankton0.94100.0350.003
Publisher’s Note: MDPI stays neutral with regard to jurisdictional claims in published maps and institutional affiliations.