Abstract
(1) Introduction: High sensitivity C-reactive protein (hs-CRP) and CRP are inflammatory biomarkers associated with several inflammatory diseases. In both pediatric and adult individuals with Obstructive Sleep Apnea (OSA) higher hs-CRP and CRP were observed, compared to controls. With the present systematic review, meta-analysis and meta-regression we expand upon previous meta-analyses in four ways: (1) We included 109 studies (96 in adults and 13 in children); (2) we reported subgroup and meta-regression analyses in adults with OSA compared to controls on the serum and plasma levels of hs-CRP; (3) we reported subgroup and meta-regression analyses in adults with OSA compared to controls on the serum and plasma levels of CRP; (4) we reported serum and plasma levels of both hs-CRP and CRP in children with OSA, always compared to controls. (2) Materials and Methods: The PubMed/Medline, Scopus, Cochrane Library, and Web of Science databases were searched to retrieve articles published until 31 May 2020, with no restrictions. The data included basic information involving the first author, publication year, country of study, ethnicity of participants in each study, age, BMI, and AHI of both groups, and mean and standard deviation (SD) of plasma and serum levels of CRP and hs-CRP. (3) Results: A total of 1046 records were retrieved from the databases, and 109 studies were selected for the analysis (96 studies reporting the blood levels of hs-CRP/CRP in adults and 13 studies in children). For adults, 11 studies reported plasma hs-CRP, 44 serum hs-CRP, 9 plasma CRP, and 32 serum CRP levels. For children, 6 studies reported plasma hs-CRP, 4 serum hs-CRP, 1 plasma CRP, and 2 serum CRP levels. Compared to controls, the pooled MD of plasma hs-CRP levels in adults with OSA was 0.11 mg/dL (p < 0.00001). Compared to controls, the pooled MD of serum hs-CRP levels in adults with OSA was 0.09 mg/dL (p < 0.00001). Compared to controls, the pooled MD of plasma CRP levels in adults with OSA was 0.06 mg/dL (p = 0.72). Compared to controls, the pooled MD of serum CRP levels in adults with OSA was 0.36 mg/dL (p < 0.00001). Compared to controls, the pooled MD of plasma hs-CRP, serum hs-CRP, plasma hs-CRP, and serum hs-CRP in children with OSA was 1.17 mg/dL (p = 0.005), 0.18 mg/dL (p = 0.05), 0.08 mg/dL (p = 0.10), and 0.04 mg/dL (p = 0.33), respectively. The meta-regression showed that with a greater apnea-hypapnea index (AHI), serum hs-CRP levels were significantly higher. (4) Conclusions: The results of the present systematic review, meta-analysis and meta-regression showed that compared to healthy controls plasma and serum levels of hs-CRP and serum CRP level were higher in adults with OSA; for children, and compared to controls, just plasma hs-CRP levels in children with OSA were higher.
Keywords:
obstructive sleep apnea; inflammation; C-reactive protein; children; adults; meta-analysis 1. Introduction
Repeated episodes of partial or complete obstruction of the airways during sleep characterize Obstructive Sleep Apnea (OSA) [1]. Polysomnographically measured Apnea–Hypopnea Index (AHI) as ≥5 [2,3] and AHI ≥ 1 events per hour [4] define OSA. A systematic review in 2017 found that the overall prevalence of OSA ranged from 9 to 38% of the general adult population, from 13 to 33% and 6 to 19% in males and females, respectively, with higher prevalence rates in elderly individuals [5]. Therefore, OSA is more prevalent in males than females [6], and OSA increases with age in adults [7]. Further, OSA is related to overweight: the prevalence of OSA varies from 60% to 70% in obese people, and reaches more than 90% in individuals with severe obesity [8,9]. OSA may be associated with structural brain alternations [10], and two recent meta-analyses showed that compared to healthy controls inflammation biomarkers such as interleukin (IL)-6 and tumor necrosis factor (TNF)-α (two pro-inflammatory cytokines) were higher in individuals with OSA [11,12].
Another inflammatory biomarker is the high sensitivity C-reactive protein (hs-CRP). The expression of hs-CRP is IL-6 dependent in the kidney and largely under the IL-6 regulation [13,14]. Further, higher hs-CRP plasma levels predicted the risk of the cardiovascular disease (CVD), diabetes and impaired cognitive functions [14]. Likewise, elevated serum levels of hs-CRP and CRP are independent risk factors of CVD [15]. Unlike other cytokines, CRP levels can be quite stable over twenty-four hours and may reflect the inflammatory response level [16].
As mentioned above, OSA has a particularly close relationship with obesity [7], and up to 40% of the risk of OSA is genetically predisposed [17]. Further, obesity is associated with the condition of chronic low-grade inflammation, characterized by an increase in some inflammatory markers such as CRP [18].
Until now, there were four meta-analyses related to the association between OSA and CRP. The first meta-analysis in 2013 reported blood levels of CRP based on 25 studies [19]; the second meta-analysis in 2015 included 11 studies (5 related to CRP and 6 related to hs-CRP) [20]; the third meta-analysis in 2017 included 15 studies (7 related to CRP and 8 related to hs-CRP) [21], and fourth meta-analysis in 2019 reported five studies in adult non-smoking individuals with OSA [22]. The overall results were that CRP circulating levels in individuals with OSA were significantly higher, compared to healthy matched controls. Further, individuals with OSA, particularly those with moderate–severe OSA and BMI ≥ 30 kg/m2, had significantly elevated levels of CRP/hs-CRP. Next, levels of CRP were positively associated with the severity of OSA, and higher AHI indices were correlated with higher CRP levels. While these results were already of clinical and practical importance to increase the understanding of the underlying pathophysiology and above all inflammation-related mechanisms of OSA, the present meta-analysis expanded upon previous meta-analyses in four ways:
- We included 109 studies (96 in adults and 13 in children)
- We reported subgroup and meta-regression analyses in adults with OSA compared to controls on the serum and plasma levels of hs-CRP
- We reported subgroup and meta-regression analyses in adults with OSA compared to controls on the serum and plasma levels of CRP
- We reported serum and plasma levels of both hs-CRP and CRP in children with OSA, always compared to controls.
We claim that the present results may further improve the understanding of the inflammation-related physiological mechanisms both in children and adults with OSA.
2. Materials and Methods
To report the results of the in systematic review, we followed the Preferred Reporting Items for Systematic Reviews and Meta-Analyses (PRISMA) guidelines [23].
2.1. Search Strategy and Study Selection
One author (M.S.) comprehensively searched PubMed/Medline, Scopus, Cochrane Library, and Web of Science databases to retrieve articles published until 31 May 2020, with no restrictions. The searched terms were (“obstructive sleep apnea” or “sleep apnea” or “OSA” or “obstructive sleep apnea syndrome” or “OSAS”) and (“C-reactive protein” or “CRP” or “high sensitivity C-reactive protein” or “hs-CRP”) and (“plasma” or “serum”). We manually searched the references (meta-analyses and original and review articles) related to our topics. The titles and abstracts of the retrieved studies were independently read by two authors (M.M.I. and F.F.). Then, the two authors (M.M.I. and F.F.) selected the relevant studies and another author (M.S) retrieved the full-texts of the articles.
2.2. Eligibility Criteria
Inclusion criteria were: 1. case-control studies evaluating the association between plasma or serum and hs-CRP and CRP levels and OSA without age, sex or BMI restrictions; 2. OSA was diagnosed as apnea-hypopnea index (AHI) > 5 events/h in adults, and AHI > 1 events/h in children; 3. OSA was determined with polysomnography; 4. There are no other systemic diseases such as diabetes, neurological disorders such as multiple sclerosis, neurodegenerative disorders such as Alzheimer’s disease in two groups (individuals with OSA and controls); 5. studies reporting pretreatment morning serum or plasma levels of hs-CRP and CRP (around 6–10 am); 6. studies reporting sufficient data to compute the mean difference (MD) and 95% confidence interval (CI) in two groups; 7. studies with more than 10 cases included as in two groups.
Exclusion criteria were: 1. studies with irrelevant or insufficient data or without clinical data; 2. meta-analyses, review articles, animal studies, book chapters, and conference papers; 3. studies without a control group; 4. studies reporting levels of hs-CRP and CRP in obstructive sleep apnea hypopnea syndrome (OSAHS) or sleep-disordered breathing (SDB); 5. studies reporting controls with AHI > 5 events/h in adults and AHI > 1 events/h in children; 5. studies with overlapped data with other studies already included in the present analysis.
2.3. Data Extraction
The data from each study included in the meta-analysis were independently extracted by two authors (S.B. and M.S). If there was a disagreement between both authors, the third author (M.M.I.) helped to make a final decision. The data included fundamental information involving the first author, publication year, country of study, ethnicity of participants in each study, age, BMI, and AHI of both groups, and mean and standard deviation (SD) of plasma and serum levels of CRP and hs-CRP.
2.4. Quality Assessment
The quality of the studies included in the analysis was evaluated by one author (M.S.) using the Newcastle-Ottawa Scale (NOS); nine was a maximum total score of each study [24].
2.5. Statistical Analyses
The data were analyzed by one author (M.S.) to calculate the raw MD and 95% CI. Review Manager 5.3 (RevMan 5.3) software was used that evaluated the significance of the pooled MD with Z test. Heterogeneity was examined during the studies using both Cochrane Q [25] and I2 metrics with scores ranging from 0 to 100% [26]. In addition, when there were heterogeneity values of (Pheterogeneity or Ph < 0.1) and I2 > 50%, this means a statistically significant heterogeneity, a random-effects model analysis was performed to evaluate the pooled MD and 95% CI values. Otherwise, we used fixed-effects model.
The results of the bias (Begg’s [27] and Egger’s [28] tests) were estimated by the Comprehensive Meta-Analysis version 2.0 (CMA 2.0) software. Subgroup analyses were performed based on ethnicity, AHI, BMI, and number of participants. The sensitivity analyses, namely the “cumulative analysis” and “one study removed”, were used to evaluate the consistency/stability of the results. If the p-value (2-tailed) was less than 0.05, there was a statistically significant difference.
The meta-regression as a quantitative method was used in meta-analyses to estimate the impact of moderator variables on study effect sizes based on the year of publication, the mean age, the mean BMI, the mean AHI, and number of participants.
The trim-and-fill method aims to estimate potentially missing studies due to publication bias in the funnel plot and to adjust the overall effect estimate [29].
Some studies reported values of CRP or hs-CRP in standard errors (SE); in this case, SEs were changed into standard deviation (SD), (SE = SD/√ N; N = number of individuals). Some studies reported “median and interquartile values” or “median and range”; in this case these indices were changed into “mean and SD” utilizing methods outlined by Hozo et al. [30,31].
The serum and plasma hs-CRP and CRP levels were reported in milligram per deciliter (mg/dL). Cases with a BMI more than 30 kg/m2 were considered obese [32]. For studies with data reported on the graphs, we used GetData Graph Digitizer 2.26 software.
3. Results
3.1. Study Selection
A total of 1046 records were retrieved from the databases (Figure 1). After removing duplicates, 558 records were screened; next, 339 records were excluded, and therefore 219 full text articles were evaluated for eligibility. Then, 110 full text articles were excluded for the following reasons (9 reviews. 4 meta-analyses. 39 articles had no control group or included control group with an AHI > 5 in adults. 3 articles included control group with an AHI > 1 in children. 1 article didn’t show AHI. 4 articles included groups under treatment. 4 articles included overlap data with other studies. 8 articles included OSA participations with other diseases. 17 articles included OSAS. 5 articles included less than 10 cases in one group or both groups (case or control groups). 3 letters to editor. 2 animal studies. 4 included participants with SDB. 2 articles didn’t include data. 1 book chapter. 4 articles reported irrelevant data). At last, 109 studies were selected for the analysis.
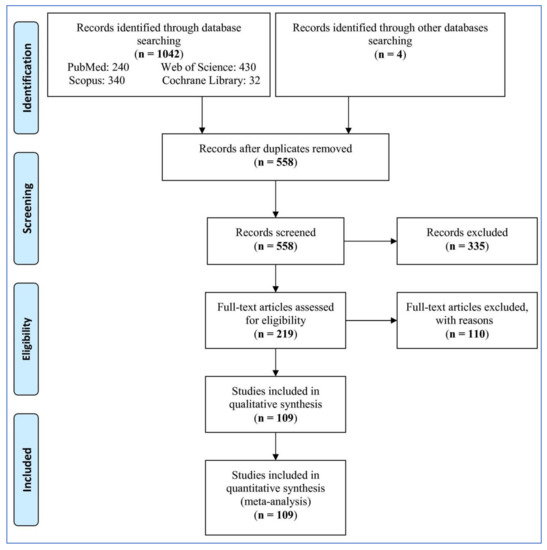
Figure 1.
Flowchart of the study selection.
3.2. Features of the Studies
The characteristics of the studies entered in the analysis are shown in Table 1. Of the 109 studies, 96 studies reported blood levels of hs-CRP/CRP in adults, and 13 studies reported blood levels of hs-CRP/CRP in children. The studies were published from 2002 to 2020. Of the 96 studies on blood levels of hs-CRP/CRP in adults, 11 studies reported plasma hs-CRP, 44 studies reported serum hs-CRP, 9 studies reported plasma CRP, and 32 studies reported serum CRP levels. Six out of 13 studies in children reported plasma hs-CRP, 4 studies reported serum hs-CRP, one study reported plasma CRP, and 2 studies reported serum CRP levels.

Table 1.
Characteristics of studies included in the meta-analysis (n = 109).
3.3. Plasma hs-CRP Levels in Adults with Obstructive Sleep Apnea
Eleven studies of plasma hs-CRP levels in adults involved 1365 individuals with OSA and 1629 controls (Table 2). The pooled MD of plasma hs-CRP levels in individuals with OSA in comparison to controls was 0.11 mg/dL [95% CI: 0.07, 0.16; p < 0.00001; I2 = 89% (Pheterogeneity or ph < 0.00001)]. Thus, plasma hs-CRP levels were significantly higher in individuals with OSA than in controls.
Table 2.
The results of forest plot analysis of plasma high-sensitivity C-reactive protein (hs-CRP) levels in adults.
3.4. Serum hs-CRP Levels in Adults with Obstructive Sleep Apnea
Forty-four studies of serum hs-CRP levels in adults involved 3857 individuals with OSA and 1240 controls (Table 3). The pooled MD of serum hs-CRP levels in individuals with OSA in comparison to controls was 0.09 mg/dL [95% CI: 0.07, 0.11; p < 0.00001; I2 = 96% (ph < 0.00001)]. Thus, serum hs-CRP levels were significantly higher in individuals with OSA than in controls.
Table 3.
The results of forest plot analysis of serum high-sensitivity C-reactive protein (hs-CRP) levels in adults.
3.5. Plasma CRP Levels in Adults with Obstructive Sleep Apnea
Nine studies of plasma CRP levels in adults involved 592 individuals with OSA and 346 controls (Table 4). The pooled MD of plasma CRP levels in individuals with OSA in comparison to controls was 0.06 mg/dL [95% CI: −0.24, 0.36; p = 0.72; I2 = 99% (ph < 0.00001)]. Thus, plasma CRP levels had no significant difference in individuals with OSA compared to controls.
Table 4.
The results of forest plot analysis of plasma C-reactive protein (CRP) levels in adults.
3.6. Serum CRP Levels in Adults with Obstructive Sleep Apnea
Thirty-two studies of serum CRP levels in adults involved 2562 individuals with OSA and 1315 controls (Table 5). The pooled MD of serum CRP levels in individuals with OSA in comparison to controls was 0.36 mg/dL [95% CI: 0.28, 0.45; p < 0.00001; I2 = 96% (ph < 0.00001)]. Thus, serum CRP levels were significantly higher in individuals with OSA than in controls.
Table 5.
The results of forest plot analysis of serum C-reactive protein (CRP) levels in adults.
3.7. Plasma and Serum Levels of hs-CRP and CRP in Children with Obstructive Sleep Apnea
Six studies of plasma hs-CRP levels involved 600 children with OSA and 704 controls, four studies of serum hs-CRP levels involved 177 individuals with OSA and 95 controls, one study of plasma CRP levels involved 84 individuals with OSA and 22 controls, and two studies of serum CRP levels involved 93 individuals with OSA and 69 controls, in children (Table 6). The pooled MD of plasma hs-CRP, serum hs-CRP, plasma hs-CRP, and serum hs-CRP in individuals with OSA in comparison to controls was 1.17 mg/dL [95% CI: 0.35, 1.98; p = 0.005; I2 = 94% (ph < 0.00001)], 0.18 mg/dL [95% CI: −0.00, 0.35; p = 0.05; I2 = 98% (ph < 0.00001)], 0.08 mg/dL [95% CI: − 0.02, 0.18; p = 0.10], and 0.04 mg/dL [95% CI: −0.04, 0.13; p = 0.33; I2 = 0% (ph = 0.36)], respectively. Thus, just plasma hs-CRP levels were significantly higher in individuals with OSA than in controls.
Table 6.
Forest plot of random- or fixed-effects analysis of plasma and serum levels of high-sensitivity C-reactive protein (hs-CRP) and CRP in children.
3.8. Subgroup Analysis of Blood hs-CRP Levels in Adults with Obstructive Sleep Apnea
3.8.1. Ethnicity
Subgroup analyses of plasma and serum hs-CRP levels in adults are reported in Table 7. The pooled analysis showed that for those with OSA, plasma hs-CRP levels in Caucasian (MD = 0.10 mg/dL, p = 0.004) and Asian (MD = 0.12 mg/dL, p = 0.003) ethnicities were significantly higher than the plasma hs-CRP levels of the respective controls, not for and mixed ethnicity (MD = 0.24 mg/dL, p = 0.47). In addition, the pooled analysis showed that for those with OSA, serum hs-CRP levels in Caucasian (MD = 0.18 mg/dL, p < 0.00001) and Asian (MD = 0.08 mg/dL, p < 0.00001) ethnicities were significantly higher than the serum hs-CRP levels of the respective controls, not for mixed ethnicity (MD = 0.05 mg/dL, p = 0.28). Therefore, ethnicity could be an effective factor on the serum and plasma levels of hs-CRP as the significant difference was found for Asian and Caucasian ethnicities, not for mixed ethnicity.
Table 7.
Subgroup analysis on serum and plasma levels of high-sensitivity C-reactive protein (hs-CRP) in adult participants.
3.8.2. Mean BMI of Participants
With regards to mean BMI of participants with OSA, the pooled MD of plasma hs-CRP levels of individuals with OSA was significantly higher than in controls, irrespective of their BMI: mean BMI ≤ 30 kg/m2 (MD = 0.11 mg/dL, p = 0.003), but there was no for mean BMI > 30 kg/m2 (MD = 0.10 mg/dL, p = 0.15). The pooled MD of serum hs-CRP levels of individuals with OSA was significantly higher than in controls, irrespective of their BMI: mean BMI > 30 kg/m2 (MD = 0.18 mg/dL, p < 0.0001); or mean BMI ≤ 30 kg/m2 (MD = 0.08 mg/dL, p < 0.00001). With regards to mean BMI of controls, the pooled MD of plasma hs-CRP levels was significantly higher in individuals with OSA compared to controls, irrespective of whether the BMI of controls was ≤30 kg/m2 (MD = 0.11 mg/dL, p < 0.001), but there was no significant difference for mean BMI > 30 kg/m2 (MD = 0.15 mg/dL, p = 0.30). The pooled MD of serum hs-CRP levels of individuals with OSA was significantly higher than in controls, irrespective of whether the BMI of controls was >30: mean BMI > 30 kg/m2 (MD = 0.11 mg/dL, p = 0.004); or mean BMI ≤ 30 kg/m2 (MD = 0.09 mg/dL, p < 0.00001). Therefore, BMI could be an effective factor on the plasma level of hs-CRP as the significant difference was found for participants with BMI ≤ 30 kg/m2, not for BMI > 30 kg/m2. However, BMI couldn’t be an effective factor on the serum level of hs-CRP.
3.8.3. Total Number of Participants
With regard to the number of participants in each study, the pooled MD of plasma hs-CRP levels in those studies with more than 100 cases across OSA and control groups was 0.14 mg/dL (p = 0.04); the pooled MD of the studies with ≤100 cases across the two groups was 0.11 mg/dL (p < 0.0002). In contrast, the MD of serum hs-CRP levels in studies with more than 100 cases was 0.10 mg/dL (p < 0.00001), and in studies with less than 100 cases across two groups was 0.08 mg/dL (p < 0.00001). Therefore, number of participants couldn’t be an effective factor on the plasma and serum levels of hs-CRP.
3.8.4. Mean AHI of Participants with Obstructive Sleep Apnea
With regard to the mean AHI of participants with OSA, the pooled MD of plasma hs-CRP levels in the studies including a mean AHI > 30 events/h was 0.14 mg/dL (p = 0.02); the pooled MD of the studies with a mean AHI ≤ 30 events/h was 0.10 mg/dL (p = 0.01). In contrast, the MD of serum hs-CRP levels in the studies including a mean AHI > 30 events/h was 0.11 mg/dL (p < 0.00001) and in the studies including a mean AHI ≤ 30 events/h was 0.07 mg/dL (p < 0.00001). Therefore, AHI couldn’t be an effective factor on the plasma and serum levels of hs-CRP.
3.9. Subgroup Analysis of Blood CRP Levels in Adults with Obstructive Sleep Apnea
3.9.1. Ethnicity
Subgroup analyses of plasma and serum CRP levels in adults are reported in Table 8. The pooled analysis showed that for those with OSA, there was no significant difference for plasma CRP levels in Caucasian (MD = 0.22 mg/dL, p = 0.39) and Asian (MD = 0.21 mg/dL, p = 0.18) ethnicities, compared to the respective controls. In addition, the pooled analysis showed that for those with OSA, serum CRP levels in Caucasian (MD = 0.38 mg/dL, p < 0.00001) and Asian (MD = 0.38 mg/dL, p < 0.00001) ethnicities were significantly higher than serum CRP levels of the respective controls, not for mixed ethnicity (MD = 0.06 mg/dL, p = 0.37). Therefore, ethnicity couldn’t be an effective factor on the plasma and serum levels of CRP.
Table 8.
Subgroup analysis on serum and plasma levels of C-reactive protein (CRP) in adult participants.
3.9.2. Mean BMI
With regards to mean BMI of participants with OSA, the pooled MD of plasma CRP levels had no significant difference in individuals with OSA compared to controls, irrespective of their BMI: mean BMI ≤ 30 kg/m2 (MD = 0.95 mg/dL, p = 0.001). In contrast, for mean BMI > 30 kg/m2 (MD = −0.088 mg/dL, p = 0.04) pooled MD of plasma CRP levels was significantly lower than in controls. The pooled MD of serum CRP levels of individuals with OSA was significantly higher than in controls, irrespective of their BMI: mean BMI > 30 kg/m2 (MD = 0.31 mg/dL, p < 0.00001); or mean BMI ≤ 30 kg/m2 (MD = 0.41 mg/dL, p < 0.00001). With regards to mean BMI of controls, there was no significant difference for the pooled MD of plasma CRP levels in individuals with OSA, compared to controls, whether the BMI of controls was ≤30 kg/m2 (MD = 0.06 mg/dL, p = 0.72); further, there was no study with individuals with a mean BMI > 30 kg/m2. The pooled MD of serum CRP levels of individuals with OSA was significantly higher than in controls in those studies including a mean BMI > 30 kg/m2 (MD = 0.61 mg/dL, p = 0.002); or mean BMI ≤ 30 kg/m2 (MD = 0.35 mg/dL, p < 0.00001) in controls. Therefore, BMI couldn’t be an effective factor on serum levels of CRP.
3.9.3. Total Number of Participants
With regard to the number of participants in each study, the pooled MD of plasma CRP levels in the studies including ≤100 cases across OSA and control groups was 0.69 mg/dL (p = 0.0003), and there was no significant difference for the studies including more than 100 cases across the two groups (MD = −1.43 mg/dL (p = 0.14). In contrast, the MD of serum CRP levels in the studies with >100 cases was 0.21 mg/dL (p = 0.0003) and in the studies including ≤100 cases across two groups was 0.53 mg/dL (p < 0.00001). Therefore, the number of participants could be an affective factor on plasma levels of CRP as the significant difference was found for the studies with ≤100 cases, not for >100 cases. However, the number of participants couldn’t be an affective factor on serum levels of CRP.
3.9.4. Mean AHI of Participants with Obstructive Sleep Apnea
With regard to the mean AHI of participants with OSA, the pooled MD of plasma CRP levels in the studies including a mean AHI ≤ 30 events/h was 0.18 mg/dL (p = 0.02), and there was no significant difference for the studies with a mean AHI ≤ 30 events/h (MD = 1.64 mg/dL (p = 0.16). In contrast, the MD of serum CRP levels in the studies including a mean AHI > 30 events/h was 0.54 mg/dL (p < 0.00001) and in the studies including a mean AHI ≤ 30 events/h was 0.27 mg/dL (p < 0.00001). Therefore, AHI could be an affective factor on plasma levels of CRP as the significant difference was found for the studies with AHI ≤ 30 events/h, not for AHI > 30 events/h. However, AHI couldn’t be an affective factor on serum levels of CRP.
3.10. Meta-Regression Analysis of Blood hs-CRP Levels in Adults with Obstructive Sleep Apnea
The results of meta-regression of plasma and serum hs-CRP levels are shown in Table 9. The year of publication, mean age, mean BMI, and number of participants had no independent significant effects on serum or plasma hs-CRP levels, whereas with greater AHI, serum hs-CRP levels were significantly higher.
Table 9.
Meta-regression analysis based on some variables for serum and plasma levels of high-sensitivity C-reactive protein (hs-CRP) in obstructive sleep apnea patients compared with controls in adult participants.
3.11. Meta-Regression Analysis of Blood CRP Levels in Adults with Obstructive Sleep Apnea
The results of meta-regression of plasma and serum CRP levels are shown in Table 10. The year of publication, mean age, mean BMI, mean AHI, and number of participants had no independent significant effects on serum or plasma CRP levels.
Table 10.
Meta-regression analysis based on some variables for serum and plasma levels of C-reactive protein (CRP) in obstructive sleep apnea patients compared with controls in adult participants.
3.12. Quality Scores
The quality scores of the studies included in the analysis are shown in Table 11.
Table 11.
Quality assessment scores of the studies included in the meta-analysis.
3.13. Sensitivity Analysis
The “cumulative analysis” and the “one study removed” as two sensitivity analyses revealed the stability of the results in adults and in children.
3.14. Publication Bias of Blood hs-CRP and CRP Levels in Adults with Obstructive Sleep Apnea
The funnel plots of the analysis of plasma and serum levels of CRP and hs-CRP are shown in Figure 2, and Table 12 shows the results of the trim-and-fill method on bias.
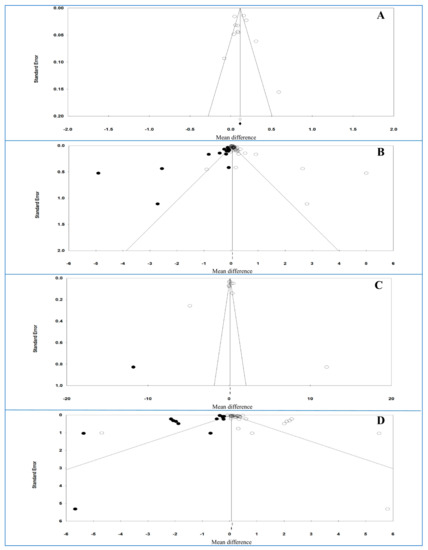
Figure 2.
Funnel plot of analysis of high-sensitivity C-reactive protein (hs-CRP) (A: plasma and B: serum) and CRP levels (C: plasma and D: serum) in adult participants. Open circles represent observed studies. Black circles represent imputed studies. Open diamonds represent the pooled effects from the original studies. Black diamonds represent the pooled effects incorporating the imputed studies.
Table 12.
The results of trim-and-fill method.
For plasma and serum hs-CRP levels, Egger’s test (p = 0.86142 and p = 0.06867, respectively) and Begg’s test (p = 0.93795 and p = 0.10132, respectively) indicated no bias either between or across the studies.
For plasma hs-CRP levels without imputed studies, under the fixed-effects model, the point estimate and 95% CI for the combined studies is 0.114 (0.097, 0.130); using the trim–fill method, the imputed point estimate is similar. In addition, under the random-effects model, the point estimate and 95% CI for the combined studies is 0.115 (0.064, 0.0166); using the trim–fill method, the imputed point estimate is similar. For serum hs-CRP levels and 14 imputed studies, under the fixed-effects model, the point estimate and 95% CI for the combined studies is 0.049 (0.047, 0.052), and using trim–fill method, the imputed point estimate is 0.049 (0.046, 0.051). In addition, under the random-effects model, the point estimate and 95% CI for the combined studies is 0.089 (0.069, 0.109); using the trim–fill method, the imputed point estimate is 0.059 (0.038, 0.080). These findings showed that the overall effect sizes for serum and plasma hs-CRP levels reported in the forest plot appeared to be valid, with a trivial publication bias effect based on fixed-effects or random-effects models, because the observed estimates were similar to the adjusted estimates.
For plasma and serum CRP levels, Egger’s test (p = 0.98284 and p = 0.00341, respectively) revealed a bias for serum level, but not for plasma level, and Begg’s test (p = 0.53161 and p = 0.16860, respectively) indicated no bias either between or across the studies for both samples.
For plasma CRP levels and one imputed study, under the fixed-effects model, the point estimate and 95% CI for the combined studies was 0.131 (0.096, 0.165); using the trim–fill method, the imputed point estimate was 0.125 (0.91, 0.160). In addition, under the random-effects model, the point estimate and 95% CI for the combined studies was 0.107 (−0.256, 0.471); using the trim–fill method, the imputed point estimate was −0.317 (−0.721, 0.087). For serum CRP levels and 13 imputed studies, under the fixed-effects model, the point estimate and 95% CI for the combined studies was 0.094 (0.079, 0.108), and using trim–fill method, the imputed point estimate was 0.55 (0.41, 0.69). In addition, under the random-effects model, the point estimate and 95% CI for the combined studies was 0.304 (0.216, 0.391); using the trim–fill method, the imputed point estimate was 0.083 (−0.011, 0.177). These findings showed that the overall effect sizes for CRP levels reported in the forest plot appeared to be valid, with a trivial publication bias effect based on fixed-effects model for plasma level, because the observed estimates were similar to the adjusted estimates. In contrast, the overall effect sizes on CRP levels reported in the forest plot appeared to be invalid, with a significant publication bias effect based on random-effects model for both samples (serum and plasma levels) and fixed-effects model for serum level, because the observed estimates were substantially different to the adjusted estimates.
4. Discussion
The main findings of the present systematic review, meta-analysis and meta-regression on the plasma and serum levels of hs-CRP and CRP in adults and children were as follows:
- serum and plasma hs-CRP levels and serum CRP levels in adults were significantly higher in individuals with OSA than in controls.
- there was no significant difference in adults with OSA compared to controls for plasma levels of CRP.
- in children, just plasma hs-CRP levels were significantly higher in pediatric individuals with OSA, compared to controls.
- based on subgroup analysis for the plasma and serum levels of hs-CRP, ethnicity and mean BMI in individuals with OSA could impact on the results of plasma hs-CRP levels, and ethnicity on serum levels of hs-CRP.
- based on subgroup analysis for the plasma and serum levels of CRP, number of participants and mean AHI in individuals with OSA could impact on plasma CRP levels, and ethnicity on serum levels of CRP.
- based on meta-regression on the plasma and serum levels of hs-CRP and CRP, just mean AHI of individuals with OSA could be an interfering factor on the results of serum levels of hs-CRP.
It follows that with the present meta-analysis, systematic review and meta-regression, we were able to show that inflammatory markers, here hs-CRP and CRP, are increased in individuals with OSA, though, the pattern of results is not straightforward and uniform; rather, hs-CRP and CRP levels might be higher compared to, or equal to hs-CRP and CRP levels of healthy controls, depending of the blood samples (serum vs. plasma), age (children vs. adults), ethnicity, BMI, sample size and AHI-cut-off values. Given this, it seems conceivable that previous and present results on the associations between hs-CRP and CRP in individuals with OSA appear inconsistent.
Indeed, there were conflicting results for the associations between OSA and hs-CRP [33,52,59,60,80,104] or CRP [36,57,61,65] levels. One meta-analysis [19] included 25 studies reporting the blood levels of CRP in individuals with and without OSA. Its results showed that the pooled standardized mean difference in adults with OSA compared to controls was 1.77 (p < 0.0001). Three meta-analyses [20,21,22] showed serum levels of hsCRP and/or CRP elevated in individuals with OSA compared to controls. The results were in line with our meta-analysis for serum levels, but not plasma levels. Therefore, the type of sample for measuring CRP appears to be important in adults with OSA; however, there was no difference between both samples (plasma or serum) for measuring hs-CRP in our meta-analysis. The meta-regression in the meta-analysis [19] showed significant effects of age, BMI, and AHI on CRP levels similar to the results of the study of Kanbay et al. [140]. In contrast, the meta-regression didn’t show the effect of these factors on serum or plasma levels of CRP; rather, just AHI had a significant effect on serum levels of hs-CRP. Further, in line with two studies [43,46], age was not associated with CRP levels. To explain these conflicting results, it is conceivable that a higher number of studies and the separate analysis of both serum and plasma yielded these differences between the present and former analyses.
For OSA, the following risk factors were reported: Older age, male gender, obesity, heavy drinking, smoking, and anatomical abnormalities, though, obesity appeared to be the strongest risk factor [141]. CRP is a sensitive marker for systemic inflammation, with increased plasma levels in this acute phase reactor indicating increased inflammatory activity in humans. Further, CRP can also be a substitute biomarker of low-grade inflammation related to obesity [58]: Studies [36,42,46] reported that CRP levels were significantly higher in obese individuals with OSA, compared to non-obese individuals with OSA. In contrast, Jung et al. [115] showed that there was no association between BMI and hs-CRP levels and in our meta-analysis, the mean BMI couldn’t be an effective factor on the plasma and serum levels of CRP and hs-CRP.
There were relationships between OSA severity and CRP [33,35,64,92] and hs-CRP [100,106,123] levels. One study [142] showed that hs-CRP levels were related to OSA independently of visceral obesity. Jin et al. [46] reported that serum CRP levels positively correlated with AHI. In our meta-analysis, mean AHI couldn’t be an affective factor on serum levels of CRP. In our subgroup analyses, we found that hs-CRP and CRP levels in the studies with a mean AHI ≤ 30 events/h were higher than in those studies with a mean AHI > 30 events/h. Further, AHI was just a confounding factor for serum hs-CRP levels and our AHI couldn’t be an affective factor on the plasma and serum levels of CRP and hs-CRP.
In children, there was just the association between the plasma hs-CRP level and OSA with a higher level in the participants with OSA compared to the controls. A lack of association for the serum hs-CRP, plasma CRP, and serum CRP could be due to few include studies.
To explain the associations between hs-CRP, plasma CRP and serum CRP, the following assumptions were made: First, C-reactive protein (CRP) is regarded as a significant serum marker of inflammation; as such, CRP is synthesized in the liver, mainly regulated via the expression of IL-6 [13]. IL-6 concentrations are increased in individuals with OSA(S), compared to healthy controls [12]. As such, it appears plausible that higher IL-6 concentrations are associated with higher h-CRP, plasma and serum CRP concentrations. Second, higher CRP concentrations were observed among individuals at increased risk of cardiovascular diseases, such as atherosclerosis, stroke, and myocardial infarction [100,143]. As such, it appeared conceivable that increased serum CRP levels could predict complications such as atherosclerosis [100,143]. In this view, long-term sustained hypoxia could yield activated inflammatory responses with elevated levels of proinflammatory cytokines [144].
The novelty of the results should be balanced against the following limitations: First, in all studies the results were not adjusted based on possible confounding factors such as obesity, smoking, and alcohol consumption, and even in some studies based on gender. Second, there was a high heterogeneity and also a bias between and across studies, all of which could impact on the reliability of the results. Third, studies with a small sample size (less than 100) might have had insufficient power to detect associations between OSA, CRP and hs-CRP levels. Fourth, studies reported various cut-off AHI values, which made it difficult to compare the study results. Fifth, in some studies, CRP and hs-CRP levels were considered as a secondary outcome.
By contrast, the meta-analysis had several strengths: First, the meta-regression showed that higher AHI could be a cofounder factor on serum hs-CRP levels. Second, there were sufficient studies to allow the subgroup analysis. Third, sensitivity analysis illustrated the consistency of results. Fourth, we included the studies written in any language. Fifth, unlike previous meta-analyses, we included also data of children with OSA.
Last, while we focused on significant p-values, we did less rely on effect size calculation. However, a closer inspection showed that when focusing on effect sizes, the overall pattern of results did not change.
5. Conclusions
The findings of this systematic review, meta-analysis and meta-regression demonstrated that higher plasma and serum levels of hs-CRP and serum levels of CRP in individuals with OSA appeared to be associated with the disease severity. Further, higher AHI appeared to impact on the associations between OSA and CRP/hs-CRP levels. Future studies might consider, if and to what extent interventions on OSA (e.g., using CPAP devices) may favorably impact on CRP/hs-CRP levels and possibly also on weight regulation. While it appeared that the use of CPAP did not change the level of inflammatory markers after 12 weeks among women with Obstructive Sleep Apnea [145], it would be of clinical and practical importance to know if changes is hs-CRP and CRP would be associated with weight loss among individuals with OSA.
We claim that the present results are of clinical importance: Individuals with OSA appeared to be at increased risk to suffer from higher hs-CRP and CRP levels; such increased inflammatory levels were associated with a higher risk of suffering from further diseases such as early neurological deterioration following stroke [146] or major cardiovascular events in patients with peripheral artery disease [147]. We hold that the present results are also of practical importance, because individuals with higher hs-CRP or CRP levels appeared to be at a dramatically increased risk of reporting a much severe progress of the COVID-19 [148,149]; indeed; higher CRP levels were an independent factor to predict the severity of COVID-19 [149]; given this, we speculate that individuals with OSA and higher hs-CRP and CRP levels might also be at an increased risk to suffer from severe COVID-19.
Author Contributions
Conceptualization, M.M.I.; M.S., F.F., H.K., S.B.; K.M.D.; A.B. and D.S.-B.; methodology, M.M.I.; M.S., F.F., H.K., S.B.; K.M.D.; A.B. and D.S.-B.; validation, M.M.I.; M.S., F.F., H.K., S.B.; and D.S.-B.; formal analysis, M.M.I.; M.S., F.F., H.K., S.B.; data curation, M.S., F.F., H.K.; K.M.D.; A.B. and D.S.-B.; writing, M.M.I.; M.S., F.F., H.K., S.B.; K.M.D.; A.B. and D.S.-B.; writing—review and editing M.M.I.; M.S., F.F., H.K., S.B.; K.M.D.; A.B. and D.S.-B. All authors have read and agreed to the published version of the manuscript.
Funding
This study was funded by the Research Council of Kermanshah University of Medical Sciences (Grant Number: 980709).
Institutional Review Board Statement
Not applicable.
Informed Consent Statement
Not applicable.
Data Availability Statement
Data made available upon request to experts in the field.
Acknowledgments
This work was performed in partial fulfillment of the requirements for a doctorate degree in General Dentistry (Farid Farokhzadeh), in Faculty of Dentistry, Kermanshah University of Medical Sciences, Kermanshah, Iran. Further, we thank the University of Basel (Basel, Switzerland) to care for the Article Processing Charge (APC).
Conflicts of Interest
The authors declare no conflict of interest.
References
- Park, J.G.; Ramar, K.; Olson, E.J. Updates on Definition, Consequences, and Management of Obstructive Sleep Apnea. Mayo Clin. Proc. 2011, 86, 549–555. [Google Scholar] [CrossRef] [PubMed]
- Lim, D.C.; Pack, A.I. Obstructive Sleep Apnea: Update and Future. Annu. Rev. Med. 2017, 68, 99–112. [Google Scholar] [CrossRef] [PubMed]
- Smith, D.F.; Hossain, M.M.; Hura, A.; Huang, G.; McConnell, K.; Ishman, S.L. Inflammatory milieu and cardiovascular home-ostasis in children with obstructive sleep apnea. Sleep 2017, 40, zsx022. [Google Scholar] [CrossRef] [PubMed]
- Kim, J.; Bhattacharjee, R.; Snow, A.; Capdevila, O.S.; Kheirandish-Gozal, L.; Gozal, D. Myeloid-related protein 8/14 levels in children with obstructive sleep apnoea. Eur. Respir. J. 2010, 35, 843–850. [Google Scholar] [CrossRef]
- Senaratna, C.V.; Perret, J.L.; Lodge, C.J.; Lowe, A.J.; Campbell, B.E.; Matheson, M.C.; Hamilton, G.S.; Dharmage, S.C. Prevalence of obstructive sleep apnea in the general population: A systematic review. Sleep Med. Rev. 2017, 34, 70–81. [Google Scholar] [CrossRef]
- Kapur, V.K. Obstructive sleep apnea: Diagnosis, epidemiology, and economics. Respir. Care 2010, 55, 1155–1167. [Google Scholar]
- Punjabi, N.M. The epidemiology of adult obstructive sleep apnea. Proc. Am. Thorac. Soc. 2008, 5, 136–143. [Google Scholar] [CrossRef]
- Shah, N.; Roux, F. The Relationship of Obesity and Obstructive Sleep Apnea. Clin. Chest Med. 2009, 30, 455–465. [Google Scholar] [CrossRef]
- Young, T.; Shahar, E.; Nieto, F.J.; Redline, S.; Newman, A.B.; Gottlieb, D.J.; Walsleben, J.A.; Finn, L.; Enright, P.; Samet, J.M.; et al. Predictors of sleep-disordered breathing in commu-nity-dwelling adults: The Sleep Heart Health Study. Arch. Intern. Med. 2002, 162, 893–900. [Google Scholar] [CrossRef]
- Rezaei, F.; Abbasi, H.; Sadeghi, M.; Imani, M.M. The effect of obstructive sleep apnea syndrome on serum S100B and NSE levels: A systematic review and meta-analysis of observational studies. BMC Pulm. Med. 2020, 20, 31. [Google Scholar] [CrossRef]
- Imani, M.; Sadeghi, M.; Khazaie, H.; Emami, M.; Bahmani, D.S.; Brand, S. Serum and Plasma Tumor Necrosis Factor Alpha Levels in Individuals with Obstructive Sleep Apnea Syndrome: A Meta-Analysis and Meta-Regression. Life 2020, 10, 87. [Google Scholar] [CrossRef]
- Moslem Imani, M.; Sadeghi, M.; Khazaie, H.; Emami, M.; Sadeghi Bahmani, D.; Brand, S. Evaluation of serum and plasma inter-leukin-6 levels in obstructive sleep apnea syndrome (OSAS): A meta-analysis and meta-regression. Front. Immunol. 2020, 11, 1343. [Google Scholar] [CrossRef]
- Castell, J.V.; Gómez-Lechón, M.J.; David, M.; Fabra, R.; Trullenque, R.; Heinrich, P.C. Acute-phase response of human hepatocytes: Regulation of acute-phase protein synthesis by interleukin-6. Hepatology 1990, 12, 1179–1186. [Google Scholar] [CrossRef]
- Kheirandish-Gozal, L.; Gozal, D. Obstructive sleep apnea and inflammation: Proof of concept based on two illustrative cyto-kines. Int. J. Mol. Sci. 2019, 20, 459. [Google Scholar] [CrossRef]
- Wilson, A.M.; Ryan, M.C.; Boyle, A.J. The novel role of C-reactive protein in cardiovascular disease: Risk marker or pathogen. Int. J. Cardiol. 2006, 106, 291–297. [Google Scholar] [CrossRef]
- Meier-Ewert, H.K.; Ridker, P.M.; Rifai, N.; Price, N.; Dinges, D.F.; Mullington, J.M. Absence of diurnal variation of C-reactive protein concentrations in healthy human subjects. Clin. Chem. 2001, 47, 426–430. [Google Scholar] [CrossRef]
- Kent, B.D.; Ryan, S.; McNicholas, W.T. The genetics of obstructive sleep apnoea. Curr. Opin. Pulm. Med. 2010, 16, 536–542. [Google Scholar] [CrossRef]
- Dalmas, E.; Rouault, C.; Abdennour, M.; Rovere, C.; Rizkalla, S.; Bar-Hen, A.; Nahon, J.-L.; Bouillot, J.-L.; Guerre-Millo, M.; Clément, K.; et al. Variations in circulating inflammatory factors are related to changes in calorie and carbohydrate intakes early in the course of surgery-induced weight reduction. Am. J. Clin. Nutr. 2011, 94, 450–458. [Google Scholar] [CrossRef]
- Nadeem, R.; Molnar, J.; Madbouly, E.M.; Nida, M.; Aggarwal, S.; Sajid, H.; Naseem, J.; Loomba, R. Serum Inflammatory Markers in Obstructive Sleep Apnea: A Meta-Analysis. J. Clin. Sleep Med. 2013, 9, 1003–1012. [Google Scholar] [CrossRef]
- Wang, J.; Yu, W.; Gao, M.; Zhang, F.; Gu, C.; Yu, Y.; Wei, Y. Impact of Obstructive Sleep Apnea Syndrome on Endothelial Function, Arterial Stiffening, and Serum Inflammatory Markers: An Updated Meta-analysis and Metaregression of 18 Studies. J. Am. Heart Assoc. 2015, 4. [Google Scholar] [CrossRef]
- Li, K.; Wei, P.; Qin, Y.; Wei, Y. Is C-reactive protein a marker of obstructive sleep apnea? A meta-analysis. Medicine 2017, 96, e6850. [Google Scholar] [CrossRef]
- Van der Touw, T.; Andronicos, N.M.; Smart, N. Is C-reactive protein elevated in obstructive sleep apnea? a systematic review and meta-analysis. Biomarkers 2019, 429–435. [Google Scholar] [CrossRef]
- Moher, D.; Shamseer, L.; Clarke, M.; Ghersi, D.; Liberati, A.; Petticrew, M.; Shekelle, P.; Stewart, L.A.; PRISMA-P Group. Preferred reporting items for systematic review and meta-analysis protocols (PRISMA-P) 2015 statement. Syst. Rev. 2015, 4, 1. [Google Scholar] [CrossRef]
- Wells, G.; Shea, B.; O’Connell, D.; Peterson, J.; Welch, V.; Losos, M.; Tugwell, P. The Newcastle–Ottawa Scale (NOS) for Assessing the Quality of Non-Randomized Studies in Meta-Analysis. Appl. Eng. Agric. 2014, 18, 727–734. [Google Scholar]
- Zintzaras, E.; Hadjigeorgiou, G.M. The role of G196A polymorphism in the brain-derived neurotrophic factor gene in the cause of Parkinson’s disease: A meta-analysis. J. Hum. Genet. 2005, 50, 560–566. [Google Scholar] [CrossRef]
- Higgins, J.P.T.; Thompson, S.G. Quantifying heterogeneity in a meta-analysis. Stat. Med. 2002, 21, 1539–1558. [Google Scholar] [CrossRef]
- Begg, C.B.; Mazumdar, M. Operating characteristics of a rank correlation test for publication bias. Biometrics 1994, 50, 1088–1101. [Google Scholar] [CrossRef]
- Egger, M.; Smith, G.D.; Schneider, M.; Minder, C. Bias in meta-analysis detected by a simple, graphical test. BMJ 1997, 315, 629–634. [Google Scholar] [CrossRef]
- Duval, S.; Tweedie, R. Trim and fill: A simple funnel-plot–based method of testing and adjusting for publication bias in meta-analysis. Biometrics 2000, 56, 455–463. [Google Scholar] [CrossRef]
- Hozo, S.P.; Djulbegovic, B.; Hozo, I. Estimating the mean and variance from the median, range, and the size of a sample. BMC Med. Res. Methodol. 2005, 5, 13. [Google Scholar] [CrossRef]
- Wan, X.; Wang, W.; Liu, J.; Tong, T. Estimating the sample mean and standard deviation from the sample size, median, range and/or interquartile range. BMC Med. Res. Methodol. 2014, 14, 135. [Google Scholar] [CrossRef] [PubMed]
- Ghiciuc, C.M.; Dima-Cozma, L.C.; Bercea, R.M.; Lupusoru, C.E.; Mihaescu, T.; Cozma, S.; Patacchioli, F.R. Imbalance in the diurnal salivary testosterone/cortisol ratio in men with severe obstructive sleep apnea: An observational study. Braz. J. Otorhinolaryngol. 2016, 82, 529–535. [Google Scholar] [CrossRef] [PubMed]
- Shamsuzzaman, A.S.; Winnicki, M.; Lanfranchi, P.; Wolk, R.; Kara, T.; Accurso, V.; Somers, V.K. Elevated C-Reactive Protein in Patients with Obstructive Sleep Apnea. Circulation 2002, 105, 2462–2464. [Google Scholar] [CrossRef] [PubMed]
- Teramoto, S.; Yamamoto, H.; Ouchi, Y. Increased C-Reactive Protein and Increased Plasma Interleukin-6 May Synergistically Affect the Progression of Coronary Atherosclerosis in Obstructive Sleep Apnea Syndrome. Circulation 2003, 107, E40. [Google Scholar] [CrossRef] [PubMed][Green Version]
- Yokoe, T.; Minoguchi, K.; Matsuo, H.; Oda, N.; Minoguchi, H.; Yoshino, G.; Hirano, T.; Adachi, M. Elevated Levels of C-Reactive Protein and Interleukin-6 in Patients with Obstructive Sleep Apnea Syndrome Are Decreased by Nasal Continuous Positive Airway Pressure. Circulation 2003, 107, 1129–1134. [Google Scholar] [CrossRef] [PubMed]
- Barceló, A.; Barbé, F.; Llompart, E.; Mayoralas, L.R.; Ladaria, A.; Bosch, M.; Agustí, A.G. Effects of obesity on C-reactive protein level and metabolic disturbances in male patients with obstructive sleep apnea. Am. J. Med. 2004, 117, 118–121. [Google Scholar] [CrossRef] [PubMed]
- Guilleminault, C.; Kirisoglu, C.; Ohayon, M.M. C-Reactive Protein and Sleep-Disordered Breathing. Sleep 2004, 27, 1507–1517. [Google Scholar] [CrossRef]
- Minoguchi, K.; Yokoe, T.; Tazaki, T.; Minoguchi, H.; Tanaka, A.; Oda, N.; Okada, S.; Ohta, S.; Naito, H.; Adachi, M. Increased Carotid Intima-Media Thickness and Serum Inflammatory Markers in Obstructive Sleep Apnea. Am. J. Respir. Crit. Care Med. 2005, 172, 625–630. [Google Scholar] [CrossRef]
- Can, M.; Açikgöz, Ş.; Mungan, G.; Bayraktaroğlu, T.; Koçak, E.; Güven, B.; Demirtas, S. Serum Cardiovascular Risk Factors in Obstructive Sleep Apnea. Chest 2006, 129, 233–237. [Google Scholar] [CrossRef]
- Minoguchi, K.; Yokoe, T.; Tanaka, A.; Ohta, S.; Hirano, T.; Yoshino, G.; O’Donnell, C.P.; Adachi, M. Association between lipid peroxidation and inflammation in obstructive sleep apnoea. Eur. Respir. J. 2006, 28, 378–385. [Google Scholar] [CrossRef]
- Shiina, K.; Tomiyama, H.; Takata, Y.; Usui, Y.; Asano, K.; Hirayama, Y.; Nakamura, T.; Yamashina, A. Concurrent presence of metabolic syndrome in obstructive sleep apnea syndrome exacerbates the cardiovascular risk: A sleep clinic cohort study. Hypertens. Res. 2006, 29, 433–441. [Google Scholar] [CrossRef]
- Ryan, S.; Nolan, G.M.; Hannigan, E.; Cunningham, S.; Taylor, C.; McNicholas, W.T. Cardiovascular risk markers in obstructive sleep apnoea syndrome and correlation with obesity. Thorax 2007, 62, 509–514. [Google Scholar] [CrossRef]
- Chung, S.; Yoon, I.-Y.; Shin, Y.-K.; Lee, C.H.; Kim, J.-W.; Lee, T.; Choi, D.-J.; Ahn, H.J. Endothelial Dysfunction and C-Reactive Protein in Relation with the Severity of Obstructive Sleep Apnea Syndrome. Sleep 2007, 30, 997–1001. [Google Scholar] [CrossRef]
- Iesato, K.; Tatsumi, K.; Saibara, T.; Nakamura, A.; Terada, J.; Tada, Y.; Sakao, S.; Tanabe, N.; Takiguchi, Y.; Kuriyama, T. Decreased Lipoprotein Lipase in Obstructive Sleep Apnea Syndrome. Circ. J. 2007, 71, 1293–1298. [Google Scholar] [CrossRef]
- Minoguchi, K.; Yokoe, T.; Tazaki, T.; Minoguchi, H.; Oda, N.; Tanaka, A.; Yamamoto, M.; Ohta, S.; O’Donnell, C.P.; Adachi, M. Silent brain infarction and platelet activation in obstructive sleep apnea. Am. J. Respir. Crit. Care Med. 2007, 175, 612–617. [Google Scholar] [CrossRef]
- Jin, Y.; Hui, L.; Yuan, L.; Xian, L.; Zhu, J.-M. Increased serum levels of C-reactive protein and matrix metalloproteinase-9 in obstructive sleep apnea syndrome. Chin. Med. J. 2007, 120, 1482–1486. [Google Scholar]
- Kapsimalis, F.; Varouchakis, G.; Manousaki, A.; Daskas, S.; Nikita, D.; Kryger, M.; Gourgoulianis, K. Association of Sleep Apnea Severity and Obesity with Insulin Resistance, C-Reactive Protein, and Leptin Levels in Male Patients with Obstructive Sleep Apnea. Lung 2008, 186, 209–217. [Google Scholar] [CrossRef]
- Saletu, M.; Sauter, C.; Lalouschek, W.; Saletu, B.; Kapfhammer, G.; Benesch, T.; Zeitlhofer, J. Is excessive daytime sleepiness a predictor of carotid atherosclerosis in sleep apnea? Atheroscler 2008, 196, 810–816. [Google Scholar] [CrossRef]
- Sharma, S.; Mishra, H.K.; Sharma, H.; Goel, A.; Sreenivas, V.; Gulati, V.; Tahir, M. Obesity, and not obstructive sleep apnea, is responsible for increased serum hs-CRP levels in patients with sleep-disordered breathing in Delhi. Sleep Med. 2008, 9, 149–156. [Google Scholar] [CrossRef]
- Takahashi, K.-I.; Chin, K.; Nakamura, H.; Morita, S.; Sumi, K.; Oga, T.; Matsumoto, H.; Niimi, A.; Fukuhara, S.; Yodoi, J.; et al. Plasma Thioredoxin, a Novel Oxidative Stress Marker, in Patients with Obstructive Sleep Apnea Before and after Nasal Continuous Positive Airway Pressure. Antioxid. Redox Signal. 2008, 10, 715–726. [Google Scholar] [CrossRef]
- Bhushan, B.; Guleria, R.; Misra, A.; Pandey, R.M.; Luthra, K.; Vikram, N.K. Obstructive Sleep Apnoea correlates with C-reactive protein in obese Asian Indians. Nutr. Metab. Cardiovasc. Dis. 2009, 19, 184–189. [Google Scholar] [CrossRef]
- Carneiro, G.; Togeiro, S.M.; Ribeiro-Filho, F.F.; Truksinas, E.; Ribeiro, A.B.; Zanella, M.T.; Tufik, S. Continuous Positive Airway Pressure Therapy Improves Hypoadiponectinemia in Severe Obese Men with Obstructive Sleep Apnea Without Changes in Insulin Resistance. Metab. Syndr. Relat. Disord. 2009, 7, 537–542. [Google Scholar] [CrossRef]
- Cofta, S.; Wysocka, E.; Michalak, S.; Piorunek, T.; Batura-Gabryel, H.; Torlinski, L. Endothelium-derived markers and antioxidant status in the blood of obstructive sleep apnea males. Eur. J. Med. Res. 2009, 14, 49. [Google Scholar] [CrossRef][Green Version]
- Makino, S.; Fujiwara, M.; Suzukawa, K.; Handa, H.; Fujie, T.; Ohtaka, Y.; Komatsu, Y.; Aoki, Y.; Maruyama, H.; Terada, Y.; et al. Visceral Obesity is Associated with the Metabolic Syndrome and Elevated Plasma Retinol Binding Protein-4 Level in Obstructive Sleep Apnea Syndrome. Horm. Metab. Res. 2008, 41, 221–226. [Google Scholar] [CrossRef]
- Sahlman, J.; Miettinen, K.; Peuhkurinen, K.; Seppä, J.; Peltonen, M.; Herder, C.; Punnonen, K.; Vanninen, E.; Gylling, H.; Partinen, M.; et al. The activation of the inflammatory cytokines in overweight patients with mild obstructive sleep apnoea. J. Sleep Res. 2009, 19, 341–348. [Google Scholar] [CrossRef]
- Aihara, K.; Oga, T.; Harada, Y.; Chihara, Y.; Handa, T.; Tanizawa, K.; Watanabe, K.; Tsuboi, T.; Hitomi, T.; Mishima, M.; et al. Comparison of biomarkers of subclinical lung injury in obstructive sleep apnea. Respir. Med. 2011, 105, 939–945. [Google Scholar] [CrossRef]
- Barcelo, A.; Piérola, J.; De La Peña, M.; Esquinas, C.; Fuster, A.; De La Torre, M.S.; Carrera, M.; Alonso-Fernández, A.; Ladaria, A.; Bosch, M.; et al. Free fatty acids and the metabolic syndrome in patients with obstructive sleep apnoea. Eur. Respir. J. 2010, 37, 1418–1423. [Google Scholar] [CrossRef]
- Basoglu, O.K.; Sarac, F.; Sarac, S.; Uluer, H.; Yilmaz, C. Metabolic syndrome, insulin resistance, fibrinogen, homocysteine, leptin, and C-reactive protein in obese patients with obstructive sleep apnea syndrome. Ann. Thorac. Med. 2011, 6, 120–125. [Google Scholar] [CrossRef]
- Fredheim, J.M.; Rollheim, J.; Omland, T.; Hofsø, D.; Røislien, J.; Vegsgaard, K.; Hjelmesæth, J. Type 2 diabetes and pre-diabetes are associated with obstructive sleep apnea in extremely obese subjects: A cross-sectional study. Cardiovasc. Diabetol. 2011, 10, 84. [Google Scholar] [CrossRef]
- Guasti, L.; Marino, F.; Cosentino, M.; Maroni, L.; Maresca, A.M.; Colombo, F.; Maio, R.C.; Castiglioni, L.; Saporiti, F.; Loraschi, A.; et al. Cytokine production from peripheral blood mononuclear cells and polymorphonuclear leukocytes in patients studied for suspected obstructive sleep apnea. Sleep Breath. 2009, 15, 3–11. [Google Scholar] [CrossRef]
- Kanbay, A.; Kaya, E.; Buyukoglan, H.; Ozdogan, N.; Kaya, M.G.; Oymak, F.S.; Gulmez, I.; Demir, R.; Kokturk, O. Serum gamma-glutamyl transferase activity is an independent predictor for cardiovascular disease in Obstructive Sleep Apnea Syndrome. Respir. Med. 2011, 105, 637–642. [Google Scholar] [CrossRef] [PubMed][Green Version]
- Kasai, T.; Inoue, K.; Kumagai, T.; Kato, M.; Kawana, F.; Sagara, M.; Ishiwata, S.; Ohno, M.; Yamaguchi, T.; Momomura, S.; et al. Plasma pentraxin3 and arterial stiffness in men with obstructive sleep apnea. Am. J. Hypertens. 2011, 24, 401–407. [Google Scholar] [CrossRef] [PubMed]
- Balci, M.M.; Arslan, U.; Firat, H.; Kocaoğlu, İ.; Vural, M.G.; Balci, K.G.; Maden, O.; Gürbüz, O.A.; Ardiç, S.; Yeter, E. Serum Levels of Adipocyte Fatty Acid–Binding Protein Are Independently Associated with Left Ventricular Mass and Myocardial Performance Index in Obstructive Sleep Apnea Syndrome. J. Investig. Med. 2012, 60, 1020–1026. [Google Scholar] [CrossRef] [PubMed]
- Chien, M.-Y.; Lee, P.; Tsai, Y.-F.; Yang, P.-C.; Wu, Y.-T. C-reactive protein and heart rate recovery in middle-aged men with severe obstructive sleep apnea. Sleep Breath. 2012, 16, 629–637. [Google Scholar] [CrossRef] [PubMed]
- Feng, X.; Li, P.; Zhou, C.; Jia, X.; Kang, J. Elevated levels of serum chemerin in patients with obstructive sleep apnea syndrome. Biomarkers 2012, 17, 248–253. [Google Scholar] [CrossRef]
- Fornadi, K.; Lindner, A.; Czira, M.E.; Szentkiralyi, A.; Lazar, A.S.; Zoller, R.; Turanyi, C.Z.; Veber, O.; Novak, M.; Mucsi, I.; et al. Lack of association between objectively assessed sleep disorders and inflammatory markers among kidney transplant recipients. Int. Urol. Nephrol. 2011, 44, 607–617. [Google Scholar] [CrossRef]
- Guven, S.F.; Turkkani, M.H.; Ciftci, B.; Ciftci, T.U.; Erdogan, Y. The relationship between high-sensitivity C-reactive protein levels and the severity of obstructive sleep apnea. Sleep Breath. 2012, 16, 217–221. [Google Scholar] [CrossRef]
- Panoutsopoulos, A.; Kallianos, A.; Kostopoulos, K.; Seretis, C.; Koufogiorga, E.; Protogerou, A.; Trakada, G.; Kostopoulos, C.; Zakopoulos, N.; Nikolopoulos, I. Effect of CPAP treatment on endothelial function and plasma CRP levels in patients with sleep apnea. Med. Sci. Monit. 2012, 18, CR747–CR751. [Google Scholar] [CrossRef]
- Chen, P.-C.; Guo, C.-H.; Tseng, C.-J.; Wang, K.-C.; Liu, P.-J. Blood trace minerals concentrations and oxidative stress in patients with obstructive sleep apnea. J. Nutr. Health Aging 2013, 17, 639–644. [Google Scholar] [CrossRef]
- Kosacka, M.; Korzeniewska, A.; Jankowska, R. The evaluation of body composition, adiponectin, C-reactive protein and cho-lesterol levels in patients with obstructive sleep apnea syndrome. Adv. Clin. Exp. Med. 2013, 22, 817–824. [Google Scholar]
- Wang, Q.; Feng, X.; Zhou, C.; Li, P.; Kang, J. Decreased levels of serum omentin-1 in patients with obstructive sleep apnoea syn-drome. Ann. Clin. Biochem. 2013, 50, 230–235. [Google Scholar] [CrossRef]
- Zhang, X.-B.; Lin, Q.-C.; Deng, C.-S.; Chen, G.-P.; Cai, Z.-M.; Chen, H. Elevated serum cystatin C in severe OSA younger men without complications. Sleep Breath. 2013, 17, 235–241. [Google Scholar] [CrossRef]
- Akilli, H.; Kayrak, M.; Bekci, T.T.; Erdogan, H.I.; Aribas, A.; Yildirim, O.; Taner, A.; Erer, M.; Ünlü, A.; Arıbas, A. Gender-Related Changes of the Epicardial Fat Thickness and Leptin in Obstructive Sleep Apnea. Echocardiography 2014, 31, 411–419. [Google Scholar] [CrossRef]
- Ciccone, M.M.; Scicchitano, P.; Zito, A.; Cortese, F.; Boninfante, B.; Falcone, V.A.; Quaranta, V.N.; Ventura, V.A.; Zucano, A.; Di Serio, F.; et al. Correlation between Inflammatory Markers of Atherosclerosis and Carotid Intima-Media Thickness in Obstructive Sleep Apnea. Molecules 2014, 19, 1651–1662. [Google Scholar] [CrossRef]
- Li, W.; Yu, Z.; Jiang, C. Association of Serum YKL-40 with the Presence and Severity of Obstructive Sleep Apnea Syndrome. Lab. Med. 2014, 45, 220–225. [Google Scholar] [CrossRef]
- Niżankowska-Jędrzejczyk, A.; Almeida, F.R.; Lowe, A.A.; Kania, A.; Nastałek, P.; Mejza, F.; Foley, J.H.; Niżankowska-Mogilnicka, E.; Undas, A. Modulation of Inflammatory and Hemostatic Markers in Obstructive Sleep Apnea Patients Treated with Mandibular Advancement Splints: A Parallel, Controlled Trial. J. Clin. Sleep Med. 2014, 10, 255–262. [Google Scholar] [CrossRef]
- Shi, Y.-K.; Chen, J.-X.; Huang, Y.; Li, A.-Y. Serum S100A12 levels are associated with the presence and severity of obstructive sleep apnea syndrome in male patients. Sleep Breath. 2014, 18, 269–274. [Google Scholar] [CrossRef]
- Sökücü, S.N.; Özdemir, C.; Dalar, L.; Karasulu, L.; Aydın, Ş.; Altın, S. Complete blood count alterations after six months of con-tinuous positive airway pressure treatment in patients with severe obstructive sleep apnea. J. Clin. Sleep Med. 2014, 10, 873–878. [Google Scholar] [CrossRef][Green Version]
- Yadav, R.; France, M.; Aghamohammadzadeh, R.; Liu, Y.; Hama, S.; Kwok, S.; Schofield, J.; Turkington, P.; Syed, A.A.; Malik, R.; et al. Impairment of High-Density Lipoprotein Resistance to Lipid Peroxidation and Adipose Tissue Inflammation in Obesity Complicated by Obstructive Sleep Apnea. J. Clin. Endocrinol. Metab. 2014, 99, 3390–3398. [Google Scholar] [CrossRef]
- Yüksel, M.; Okur, H.K.; Pelin, Z.; Öğünç, A.V.; Öztürk, L. Arginase activity and nitric oxide levels in patients with obstructive sleep apnea syndrome. Clinics 2014, 69, 247–252. [Google Scholar] [CrossRef]
- Abakay, O.; Abakay, A.; Palanci, Y.; Yuksel, H.; Sen, H.S.; Evliyaoglu, O.; Tanrikulu, A.C. Relationship between hepcidin levels and periodic limb movement disorder in patients with obstructive sleep apnea syndrome. Sleep Breath. 2015, 19, 459–466. [Google Scholar] [CrossRef]
- Andaku, D.K.; D’Almeida, V.; Carneiro, G.; Hix, S.; Tufik, S.; Togeiro, S.M. Sleepiness, inflammation and oxidative stress markers in middle-aged males with obstructive sleep apnea without metabolic syndrome: A cross-sectional study. Respir. Res. 2015, 16, 1–6. [Google Scholar] [CrossRef]
- da Silva Araújo, L.; Fernandes, J.F.R.; Klein, M.R.S.T.; Sanjuliani, A.F. Obstructive sleep apnea is independently associated with inflammation and insulin resistance, but not with blood pressure, plasma catecholamines, and endothelial function in obese subjects. Nutrition 2015, 31, 1351–1357. [Google Scholar] [CrossRef]
- Asker, S.; Asker, M.; Sarikaya, E.; Sunnetcioglu, A.; Aslan, M.; Demir, H. Oxidative stress parameters and their correlation with clinical, metabolic and polysomnographic parameters in severe obstructive sleep apnea syndrome. Int. J. Clin. Exp. Med. 2015, 8, 11449–11455. [Google Scholar] [PubMed]
- Bakirci, E.M.; Unver, E.; Degirmenci, H.; Kivanc, T.; Gunay, M.; Hamur, H.; Büyüklü, M.; Ceyhun, G.; Topal, E.; Çoban, T.A. Serum YKL–40/chitinase 3–like protein 1 level is an independent predictor of atherosclerosis development in patients with obstructive sleep apnea syndrome. Arch. Turk. Soc. Cardiol. 2015, 43, 333–339. [Google Scholar] [CrossRef] [PubMed]
- Korkmaz, M.; Korkmaz, H.; Küçüker, F.; Ayyıldız, S.N.; Çankaya, S. Evaluation of the association of sleep apnea-related systemic inflammation with CRP, ESR, and neutrophil-to-lymphocyte ratio. Medical science monitor. Int. Med. J. Exp. Clin. Res. 2015, 21, 477–481. [Google Scholar]
- Xu, C.-Y.; Chun-Ling, W.; Wu, C.-L.; Lou, H.-J.; Jiang, H.-W.; Ding, G.-Q. Serum sLOX-1 Levels Are Correlated with the Presence and Severity of Obstructive Sleep Apnea. Genet. Test. Mol. Biomark. 2015, 19, 272–276. [Google Scholar] [CrossRef] [PubMed]
- Altintas, N.; Mutlu, L.C.; Akkoyun, D.C.; Aydin, M.; Bilir, B.; Yilmaz, A.; Malhotra, A. Effect of CPAP on New Endothelial Dysfunction Marker, Endocan, in People with Obstructive Sleep Apnea. Angiology 2015, 67, 364–374. [Google Scholar] [CrossRef]
- Archontogeorgis, K.; Nena, E.; Tsigalou, C.; Voulgaris, A.; Xanthoudaki, M.; Froudarakis, M.; Steiropoulos, P. Cystatin C Levels in Middle-Aged Patients with Obstructive Sleep Apnea Syndrome. Pulm. Med. 2016, 2016, 1–8. [Google Scholar] [CrossRef]
- Borratynska, A.; Stopyra-Pach, K.; Fil, K.; Undas, A. Impaired plasma clot lysis and its determinants in patients with obstructive sleep apnea syndrome. Blood Coagul. Fibrinolysis 2016, 27, 892–898. [Google Scholar] [CrossRef]
- Can, M.; Uygur, F.; Tanrıverdi, H.; Acıkgoz, B.; Alper, B.; Guven, B. Effect of continuous positive airway pressure (CPAP) therapy on IL-23 in patients with obstructive sleep apnea. Immunol. Res. 2016, 64, 1179–1184. [Google Scholar] [CrossRef]
- Cao, Z.; Zhang, P.; He, Z.; Yang, J.; Liang, C.; Ren, Y.; Wu, Z. Obstructive sleep apnea combined dyslipidemia render additive effect on increasing atherosclerotic cardiovascular diseases prevalence. Lipids Health Dis. 2016, 15, 98. [Google Scholar] [CrossRef]
- Kim, J.; Lee, S.J.; Choi, K.-M.; Lee, S.K.; Yoon, D.W.; Lee, S.G.; Shin, C. Obstructive sleep apnea is associated with elevated high sensitivity C-reactive protein levels independent of obesity: Korean genome and epidemiology study. PLoS ONE 2016, 11, e0163017. [Google Scholar] [CrossRef]
- Qi, J.-C.; Huang, J.-C.; Lin, Q.-C.; Zhao, J.-M.; Lin, X.; Chen, L.-D.; Huang, J.-F.; Chen, X. Relationship between obstructive sleep apnea and nonalcoholic fatty liver disease in nonobese adults. Sleep Breath. 2015, 20, 529–535. [Google Scholar] [CrossRef]
- Tanriverdi, H.; Firat Uygur, M.C.; Erboy, F.; Altinsoy, B.; Örnek, T.; Köktürk, F.; Tor, M.M.; Atalay, F. Serum midkine levels in patients with obstructive sleep apnoea. Acta Med. 2016, 32, 127. [Google Scholar]
- Tie, Y.; Fu, Y.; Xu, Z.; Peng, Y. Relationship between C-reactive protein levels and obstructive sleep apnea syndrome. Genet. Mol. Res. 2016, 15, 1–5. [Google Scholar] [CrossRef]
- Vicente, E.; Marin, J.M.; Carrizo, S.J.; Osuna, C.S.; González, R.; Marin-Oto, M.; Forner, M.; Vicente, P.; Cubero, P.; Gil, A.V.; et al. Upper airway and systemic inflammation in obstructive sleep apnoea. Eur. Respir. J. 2016, 48, 1108–1117. [Google Scholar] [CrossRef]
- Uygur, F.; Tanrıverdi, H.; Can, M.; Erboy, F.; Altınsoy, B.; Atalay, F.; Ornek, T.; Damar, M.; Kokturk, F.; Tor, M.; et al. Association between continuous positive airway pressure and circulating omentin levels in patients with obstructive sleep apnoea. Sleep Breath. 2016, 20, 939–945. [Google Scholar] [CrossRef]
- Zhang, H.; Feng, L.; Wu, X.; Niu, Y.; Du, H. Prognostic role of advanced glycation end products in male patients with obstructive sleep apnoea syndrome and hypertension. Int. J. Clin. Exp. Med. 2016, 9, 13135–13141. [Google Scholar]
- Bouloukaki, I.; Mermigkis, C.; Tzanakis, N.; Kallergis, E.; Moniaki, V.; Mauroudi, E.; Schiza, S.E. Evaluation of Inflammatory Markers in a Large Sample of Obstructive Sleep Apnea Patients without Comorbidities. Mediat. Inflamm. 2017, 2017, 4573756. [Google Scholar] [CrossRef]
- Gamsiz-Isik, H.; Kiyan, E.; Bingol, Z.; Baser, U.; Ademoglu, E.; Yalcin, F. Does Obstructive Sleep Apnea Increase the Risk for Periodontal Disease? A Case-Control Study. J. Periodontol. 2017, 88, 443–449. [Google Scholar] [CrossRef]
- Karamanli, H.; Kizilirmak, D.; Akgedik, R.; Bilgi, M. Serum levels of magnesium and their relationship with CRP in patients with OSA. Sleep Breath. 2016, 21, 549–556. [Google Scholar] [CrossRef]
- Kosacka, M.; Porębska, I.; Jankowska, R. Decreased sL-selectin serum levels in sleep apnea syndrome patients with cardiovascular diseases. Adv. Clin. Exp. Med. 2017, 26, 449–453. [Google Scholar] [CrossRef]
- Suliman, L.A.E.M.; Morsy, N.E.; El-Sebaie, A.H.; Omar, N.M.A.-E.; Fathy, A. Modelling obstructive sleep apnea susceptibility using non-invasive inflammatory biomarkers. Egypt. J. Chest Dis. Tuberc. 2017, 66, 657–661. [Google Scholar] [CrossRef]
- Xu, Q.; Du, J.; Ling, X.; Lu, Y. Evaluation of MIh Scoring System in Diagnosis of Obstructive Sleep Apnea Syndrome. Med. Sci. Monit. 2017, 23, 4715–4722. [Google Scholar] [CrossRef]
- Bozic, J.; Borovac, J.A.; Galic, T.; Kurir, T.T.; Supe-Domic, D.; Dogas, Z. Adropin and Inflammation Biomarker Levels in Male Patients with Obstructive Sleep Apnea: A Link with Glucose Metabolism and Sleep Parameters. J. Clin. Sleep Med. 2018, 14, 1109–1118. [Google Scholar] [CrossRef]
- Bozkus, F.; Dikmen, N.; Demir, L.S.; Fulsen, B. Gamma-glutamyl transferase activity as a predictive marker for severity of obstructive sleep apnea syndrome and concomitant hypertension. Clin. Respir. J. 2018, 12, 1964–1973. [Google Scholar] [CrossRef]
- Cengiz, A.; Konuk, S.; Tuğ, T. The Relation between Pregnancy-Associated Plasma Protein A and Obstructive Sleep Apnea Syndrome. Can. Respir. J. 2018, 2018, 1–6. [Google Scholar] [CrossRef]
- Horvath, P.; Tarnoki, D.L.; Tarnoki, A.D.; Karlinger, K.; Lazar, Z.; Losonczy, G.; Kunos, L.; Bikov, A. Complement system activation in obstructive sleep apnea. J. Sleep Res. 2018, 27, e12674. [Google Scholar] [CrossRef]
- Kunos, L.; Horvath, P.; Kis, A.; Tarnoki, D.L.; Tarnoki, A.D.; Lazar, Z.; Bikov, A. Circulating Survivin Levels in Obstructive Sleep Apnoea. Lung 2018, 196, 417–424. [Google Scholar] [CrossRef] [PubMed]
- Ozkok, A.; Ozkok, S.; Takır, M.; Yakar, H.I.; Kanbay, A. Serum heparanase levels are associated with endothelial dysfunction in patients with obstructive sleep apnea. Clin. Respir. J. 2017, 12, 1693–1699. [Google Scholar] [CrossRef] [PubMed]
- Ye, L.; Qian, Y.; Li, Q.; Fang, S.; Yang, Z.; Tan, Y.; Gu, W. Serum Romo1 is significantly associated with disease severity in patients with obstructive sleep apnea syndrome. Sleep Breath. 2018, 22, 743–748. [Google Scholar] [CrossRef] [PubMed]
- Zhang, D.-M.; Pang, X.-L.; Huang, R.; Gong, F.-Y.; Zhong, X.; Xiao, Y. Adiponectin, omentin, ghrelin, and visfatin levels in obese patients with severe obstructive sleep apnea. BioMed Res. Int. 2018, 2018, 3410135. [Google Scholar] [CrossRef] [PubMed]
- Bhatt, S.P.; Guleria, R.; Vikram, N.K.; Gupta, A.K. Non-alcoholic fatty liver disease is an independent risk factor for inflammation in obstructive sleep apnea syndrome in obese Asian Indians. Sleep Breath. 2018, 23, 171–178. [Google Scholar] [CrossRef]
- Jung, J.H.; Park, J.W.; Kim, N.H.; Kim, S.T. The Effects of Obstructive Sleep Apnea on Risk factors for Cardiovascular diseases. Ear Nose Throat J. 2019, 2019. [Google Scholar] [CrossRef]
- Li, K.; Chen, Z.; Qin, Y.; Wei, Y.-X. Plasm YKL-40 Levels Are Associated with Hypertension in Patients with Obstructive Sleep Apnea. BioMed Res. Int. 2019, 2019, 1–7. [Google Scholar] [CrossRef]
- Płóciniczak, A.; Baszczuk, A.; Ludziejewska, A.; Winiarska, H.; Michalak, S.; Kasprzak, G.; Formanowicz, D.; Cofta, S.; Wysocka, E. Paraoxonase 1 Gene L55M Polymorphism and Paraoxonase 1 Activity in Obstructive Sleep Apnea Patients. Adv. Exp. Med. Biol. 2018, 1150, 17–24. [Google Scholar]
- Voulgaris, A.; Archontogeorgis, K.; Nena, E.; Tsigalou, C.; Xanthoudaki, M.; Kouratzi, M.; Tripsianis, G.; Froudarakis, M.; Steiropoulos, P. Serum levels of NGAL and cystatin C as markers of early kidney dysfunction in patients with obstructive sleep apnea syndrome. Sleep Breath. 2019, 23, 161–169. [Google Scholar] [CrossRef]
- Wang, S.; Cui, H.; Zhu, C.; Wu, R.; Meng, L.; Yu, Q.; Huang, X.; Xiao, M.; Wang, S. Obstructive sleep apnea causes impairment of the carotid artery in patients with hypertrophic obstructive cardiomyopathy. Respir. Med. 2019, 150, 107–112. [Google Scholar] [CrossRef]
- Wen, W.-W.; Ning, Y.; Zhang, Q.; Yang, Y.-X.; Jia, Y.-F.; Sun, H.-L.; Qin, Y.-W.; Fang, F.; Wei, Y.-X. TNFRSF11B: A potential plasma biomarker for diagnosis of obstructive sleep apnea. Clin. Chim. Acta 2019, 490, 39–45. [Google Scholar] [CrossRef]
- Bocskei, R.M.; Meszaros, M.; Tarnoki, A.D.; Tarnoki, D.L.; Kunos, L.; Lazar, Z.; Bikov, A. Circulating Soluble Urokinase-Type Plasminogen Activator Receptor in Obstructive Sleep Apnoea. Medicine 2020, 56, 77. [Google Scholar] [CrossRef]
- Chen, D.-D.; Huang, J.-F.; Huang, S.-P.; Chen, X.-F. Association of serum adiponectin level with cystatin C in male patients with obstructive sleep apnea syndrome. Sleep Breath. 2019, 24, 953–960. [Google Scholar] [CrossRef]
- Chien, M.-Y.; Lee, P.-L.; Yu, C.-W.; Wei, S.Y.; Shih, T.T.-F. Intramyocellular Lipids, Insulin Resistance, and Functional Performance in Patients with Severe Obstructive Sleep Apnea. Nat. Sci. Sleep 2020, 12, 69–78. [Google Scholar] [CrossRef]
- Düger, M.; Seyhan, E.C.; Günlüoğlu, M.Z.; Bolatkale, M.; Özgül, M.A.; Turan, D.; Uğur, E.; Ülfer, G. Does ischemia-modified albumin level predict severity of obstructive sleep apnea? Sleep Breath. 2021, 25, 65–73. [Google Scholar] [CrossRef]
- Pákó, J.; Kunos, L.; Mészáros, M.; Tárnoki, D.L.; Tárnoki, Á.D.; Horváth, I.; Bikov, A. Decreased Levels of Anti-Aging Klotho in Obstructive Sleep Apnea. Rejuvenation Res. 2020, 23, 256–261. [Google Scholar] [CrossRef]
- Winiarska, H.M.; Cofta, S.; Bielawska, L.; Płóciniczak, A.; Piorunek, T.; Wysocka, E. Circulating P-Selectin and Its Glycoprotein Ligand in Nondiabetic Obstructive Sleep Apnea Patients. Adv. Exp. Med. Biol. 2020, 1279, 61–69. [Google Scholar]
- Xie, J.-Y.; Liu, W.-X.; Ji, L.; Chen, Z.; Gao, J.-M.; Chen, W.; Chen, G.-F.; Zhu, Q. Relationship between inflammatory factors and arrhythmia and heart rate variability in OSAS patients. Eur. Rev. Med. Pharmacol. Sci. 2020, 24, 2037–2053. [Google Scholar]
- Zhang, L.; Zhang, X.; Meng, H.; Li, Y.; Han, T.; Wang, C. Obstructive sleep apnea and liver injury in severely obese patients with nonalcoholic fatty liver disease. Sleep Breath. 2020, 24, 1515–1521. [Google Scholar] [CrossRef]
- Kaditis, A.G.; Alexopoulos, E.I.; Karathanasi, A.; Ntamagka, G.; Oikonomidi, S.; Kiropoulos, T.S.; Zintzaras, E.; Gourgoulianis, K. Adiposity and low-grade systemic inflammation modulate matrix metalloproteinase-9 levels in Greek children with sleep apnea. Pediatr. Pulmonol. 2010, 45, 693–699. [Google Scholar] [CrossRef]
- Kheirandish-Gozal, L.; Bhattacharjee, R.; Kim, J.; Clair, H.B.; Gozal, D. Endothelial Progenitor Cells and Vascular Dysfunction in Children with Obstructive Sleep Apnea. Am. J. Respir. Crit. Care Med. 2010, 182, 92–97. [Google Scholar] [CrossRef]
- Canapari, C.A.; Hoppin, A.G.; Kinane, T.B.; Thomas, B.J.; Torriani, M.; Katz, E.S. Relationship between Sleep Apnea, Fat Distribution, and Insulin Resistance in Obese Children. J. Clin. Sleep Med. 2011, 7, 268–273. [Google Scholar] [CrossRef] [PubMed]
- Khalyfa, A.; Kheirandish-Gozal, L.; Capdevila, O.S.; Bhattacharjee, R.; Gozal, D. Macrophage migration inhibitory factor gene polymorphisms and plasma levels in children with obstructive sleep apnea. Pediatr. Pulmonol. 2012, 47, 1001–1011. [Google Scholar] [CrossRef] [PubMed]
- Kim, J.; Gozal, D.; Bhattacharjee, R.; Kheirandish-Gozal, L. TREM-1 and Pentraxin-3 Plasma Levels and Their Association with Obstructive Sleep Apnea, Obesity, and Endothelial Function in Children. Sleep 2013, 36, 923–931. [Google Scholar] [CrossRef] [PubMed]
- Iannuzzi, A.; Licenziati, M.R.; De Michele, F.; Verga, M.C.; Santoriello, C.; Di Buono, L.; Renis, M.; Lembo, L.; D’Agostino, B.; Cappetta, D.; et al. C-reactive protein and carotid inti-ma-media thickness in children with sleep disordered breathing. J. Clin. Sleep Med. 2013, 9, 493–498. [Google Scholar] [CrossRef][Green Version]
- Israel, L.P.; Benharoch, D.; Gopas, J.; Goldbart, A.D. A Pro-Inflammatory Role for Nuclear Factor Kappa B in Childhood Obstructive Sleep Apnea Syndrome. Sleep 2013, 36, 1947–1955. [Google Scholar] [CrossRef]
- Gozal, D.; Kheirandish-Gozal, L.; Carreras, A.; Khalyfa, A.; Peris, E. Obstructive Sleep Apnea and Obesity are Associated with Reduced GPR 120 Plasma Levels in Children. Sleep 2014, 37, 935–941. [Google Scholar] [CrossRef]
- Kheirandish-Gozal, L.; Peris, E.; Wang, Y.; Kakazu, M.T.; Khalyfa, A.; Carreras, A.; Gozal, D. Lipopolysaccharide-Binding Protein Plasma Levels in Children: Effects of Obstructive Sleep Apnea and Obesity. J. Clin. Endocrinol. Metab. 2014, 99, 656–663. [Google Scholar] [CrossRef]
- Ye, J.; Liu, H.; Li, P.; Chen, Z.-G.; Zhang, G.-H.; Yang, Q.-T.; Li, Y. CD4+T-lymphocyte subsets in nonobese children with obstructive sleep apnea syndrome. Pediatr. Res. 2015, 78, 165–173. [Google Scholar] [CrossRef]
- Huang, Y.-S.; Guilleminault, C.; Hwang, F.-M.; Cheng, C.; Lin, C.-H.; Li, H.-Y.; Lee, L.-A. Inflammatory cytokines in pediatric obstructive sleep apnea. Medicine 2016, 95, e4944. [Google Scholar] [CrossRef]
- Kanbay, A.; Kaya, E.; Büyükoğlan, H.; Kaya, M.G.; Şimşek, Z.Ö.; Tutar, N.; Demir, R. Correlation between pentraxin-3 and endothelial dysfunction in obstructive sleep apnea syndrome. Ann. Thorac. Med. 2015, 10, 199–203. [Google Scholar] [CrossRef]
- Al Lawati, N.M.; Patel, S.R.; Ayas, N.T. Epidemiology, risk factors, and consequences of obstructive sleep apnea and short sleep duration. Prog. Cardiovasc. Dis. 2009, 51, 285–293. [Google Scholar] [CrossRef]
- Lui, M.M.; Lam, J.C.; Mak, H.K.; Xu, A.; Ooi, C.; Lam, D.C.; Mak, J.C.; Khong, P.L.; Ip, M.S. C-reactive protein is associated with obstructive sleep apnea independent of visceral obesity. Chest 2009, 135, 950–956. [Google Scholar] [CrossRef]
- Bouloukaki, I.; Mermigkis, C.; Kallergis, E.M.; Moniaki, V.; Mauroudi, E.; Schiza, S.E. Obstructive sleep apnea syndrome and cardio-vascular disease: The influence of C-reactive protein. World J. Exp. Med. 2015, 5, 77–83. [Google Scholar] [CrossRef]
- Greenberg, H.; Ye, X.; Wilson, D.; Htoo, A.K.; Hendersen, T.; Liu, S.F. Chronic intermittent hypoxia activates nuclear factor-kappaB in cardiovascular tissues in vivo. Biochem. Biophys. Res. Commun. 2006, 343, 591–596. [Google Scholar] [CrossRef]
- Campos-Rodriguez, F.; Asensio-Cruz, M.I.; Cordero-Guevara, J.; Jurado-Gamez, B.; Carmona-Bernal, C.; Gonzalez-Martinez, M.; Troncoso, M.F.; Sanchez-Lopez, V.; Arellano-Orden, E.; Garcia-Sanchez, M.I.; et al. Effect of continuous positive airway pressure on inflammatory, antioxidant, and depression biomarkers in women with obstructive sleep apnea: A randomized controlled trial. Sleep 2019, 42, zsz145. [Google Scholar] [CrossRef]
- Martin, A.J.; Price, C.I. A Systematic Review and Meta-Analysis of Molecular Biomarkers Associated with Early Neurological Deterioration Following Acute Stroke. Cerebrovasc. Dis. 2019, 46, 230–241. [Google Scholar] [CrossRef]
- Singh, T.P.; Morris, D.R.; Smith, S.; Moxon, J.V.; Golledge, J. Systematic Review and Meta-Analysis of the Association Between C-Reactive Protein and Major Cardiovascular Events in Patients with Peripheral Artery Disease. Eur. J. Vasc. Endovasc. Surg. 2017, 54, 220–233. [Google Scholar] [CrossRef]
- Ji, P.; Zhu, J.; Zhong, Z.; Li, H.; Pang, J.; Li, B.; Zhang, J. Association of elevated inflammatory markers and severe COVID-19: A meta-analysis. Medicine 2020, 99, e23315. [Google Scholar] [CrossRef]
- Liu, F.; Li, L.; Xu, M.; Wu, J.; Luo, D.; Zhu, Y.; Li, B.; Song, X.; Zhou, X. Prognostic value of interleukin-6, C-reactive protein, and procalcitonin in patients with COVID-19. J. Clin. Virol. 2020, 127, 104370. [Google Scholar] [CrossRef]
Publisher’s Note: MDPI stays neutral with regard to jurisdictional claims in published maps and institutional affiliations. |
© 2021 by the authors. Licensee MDPI, Basel, Switzerland. This article is an open access article distributed under the terms and conditions of the Creative Commons Attribution (CC BY) license (https://creativecommons.org/licenses/by/4.0/).