Article

Comparative Genomics Analysis of Repetitive Elements in Ten Gymnosperm Species: “Dark Repeatome” and Its Abundance in Conifer and Gnetum Species

by
Avi Titievsky
1,
Yuliya A. Putintseva
2,
Elizaveta A. Taranenko
1,2,
Sofya Baskin
1,
Natalia V. Oreshkova
2,3,4,5,
Elia Brodsky
6,
Alexandra V. Sharova
1,7,
Vadim V. Sharov
1,3,7,
Julia Panov
1,
Dmitry A. Kuzmin
7,
Leonid Brodsky
1 and
Konstantin V. Krutovsky
2,4,5,8,9,10,*
1
Tauber Bioinformatics Research Center, University of Haifa, Haifa 3498838, Israel
2
Laboratory of Forest Genomics, Genome Research and Education Center, Institute of Fundamental Biology and Biotechnology, Siberian Federal University, 660036 Krasnoyarsk, Russia
3
Laboratory of Genomic Research and Biotechnology, Federal Research Center “Krasnoyarsk Science Center of the Siberian Branch of the Russian Academy of Sciences”, 660036 Krasnoyarsk, Russia
4
Department of Genomics and Bioinformatics, Institute of Fundamental Biology and Biotechnology, Siberian Federal University, 660074 Krasnoyarsk, Russia
5
Scientific and Methodological Center, G. F. Morozov Voronezh State University of Forestry and Technologies, 394087 Voronezh, Russia
6
Pine Biotech Inc., New Orleans, LA 70112, USA
7
Department of High Performance Computing, Institute of Space and Information Technologies, Siberian Federal University, 660074 Krasnoyarsk, Russia
8
Department of Forest Genetics and Forest Tree Breeding, Georg-August University of Göttingen, 37077 Göttingen, Germany
9
Center for Integrated Breeding Research, Georg-August University of Göttingen, 37075 Göttingen, Germany
10
Laboratory of Population Genetics, N. I. Vavilov Institute of General Genetics, Russian Academy of Sciences, 119333 Moscow, Russia
*
Author to whom correspondence should be addressed.
Life 2021, 11(11), 1234; https://doi.org/10.3390/life11111234
Submission received: 24 September 2021 / Revised: 9 November 2021 / Accepted: 9 November 2021 / Published: 15 November 2021
(This article belongs to the Special Issue Life: Computational Genomics)

Abstract

:
Repetitive elements (RE) and transposons (TE) can comprise up to 80% of some plant genomes and may be essential for regulating their evolution and adaptation. The “repeatome” information is often unavailable in assembled genomes because genomic areas of repeats are challenging to assemble and are often missing from final assembly. However, raw genomic sequencing data contain rich information about RE/TEs. Here, raw genomic NGS reads of 10 gymnosperm species were studied for the content and abundance patterns of their “repeatome”. We utilized a combination of alignment on databases of repetitive elements and de novo assembly of highly repetitive sequences from genomic sequencing reads to characterize and calculate the abundance of known and putative repetitive elements in the genomes of 10 conifer plants: Pinus taeda, Pinus sylvestris, Pinus sibirica, Picea glauca, Picea abies, Abies sibirica, Larix sibirica, Juniperus communis, Taxus baccata, and Gnetum gnemon. We found that genome abundances of known and newly discovered putative repeats are specific to phylogenetically close groups of species and match biological taxa. The grouping of species based on abundances of known repeats closely matches the grouping based on abundances of newly discovered putative repeats (kChains) and matches the known taxonomic relations.

1. Introduction

Gymnosperm genomes are relatively large and variable in size, spanning from 12 Gb in Larix sibirica, 20 Gb in Picea [1,2], and up to 30 Gb in some Pinus species [3,4]. Almost 80% of gymnosperm genomes are constituted by repetitive elements (REs), including transposable elements (TE) [1,2,5,6,7,8,9]. The number of well-supported genes in conifer genomes is similar to Arabidopsis thaliana, whose genome is about 100 times smaller [2]. A combination of polyploidy, high levels of repetitive DNA (RE) amplification [10], and low rates of DNA removal due to the lack of an efficient transposon suppression mechanism [2,3] can explain these differences in genome sizes.
Only a few whole-genome sequencing data sets of conifers are currently available [1,2,5,6,7,9,11,12] compared to more than 100 other plant genomes that have been assembled [13]. The size is not the only challenge for conifer genome study and de novo assembly. Conifers have a high embryonic genetic load of about eight lethal equivalents per embryo on average [14]. In addition, inbred lines that usually facilitate genome assembly do not exist in conifers [2]. Conifers are highly heterozygous, although their nucleotide substitution rates are lower than those of most angiosperms [15] and they have high synteny [11,16]. In addition to high allelic variation [15,17], they have high non-allelic variation due to more complex and extended multiple gene families [18,19,20]. All these factors add to the complexity of in-depth genomic studies.
Repetitive elements (REs) may be among the most important internal sources of genotypic variation between species due to their ability to generate mutations, alter gene expression, and promote chromosomal aberrations [21,22,23,24,25,26]. The key environmental factors affecting plant evolution include wildfires, droughts, and frost. Such extreme stress factors can activate retrotransposons [21,22,27], leading to variation in abundance of repetitive elements in different species [28]. Previously, it has been suggested that the abundance of RE in the genome of a species carries phylogenetic signals; moreover, repetitive elements in the genomes of biologically related species are differentially amplified and evolve independently after speciation [29,30]. Thus, the genomic abundance of repetitive elements may be used for inferring the evolutionary relationship between organisms.
Here, we identified and analyzed the most abundant repetitive DNA, both known families of repeats and newly identified putative repeats, in the genomes of ten gymnosperm plants: Pinus taeda, Pinus sylvestris, Pinus sibirica, Picea glauca, Picea abies, Abies sibirica, Larix sibirica, Juniperus communis, Taxus baccata, and Gnetum gnemon. Comparison of the abundance of repetitive DNA revealed that the abundances of repeats are specific to groups of species and match biological taxa. Moreover, the abundance of repeats contains phylogenetic signal and the phylogenetic relations inferred from this signal are close to, but do not exactly match, the known phylogeny of the studied plants.

2. Materials and Methods

2.1. Whole-Genome Sequencing Data

We collected a set of whole-genome sequencing data generated from ten conifer species with three replicates per species (Table S1). To normalize the samples in size and thus be able to compare the abundance of repetitive elements in each sample, we randomly chose 10 Gb of raw genomic reads from each sample, 300 Gb of raw sequencing reads in total, for our analysis.

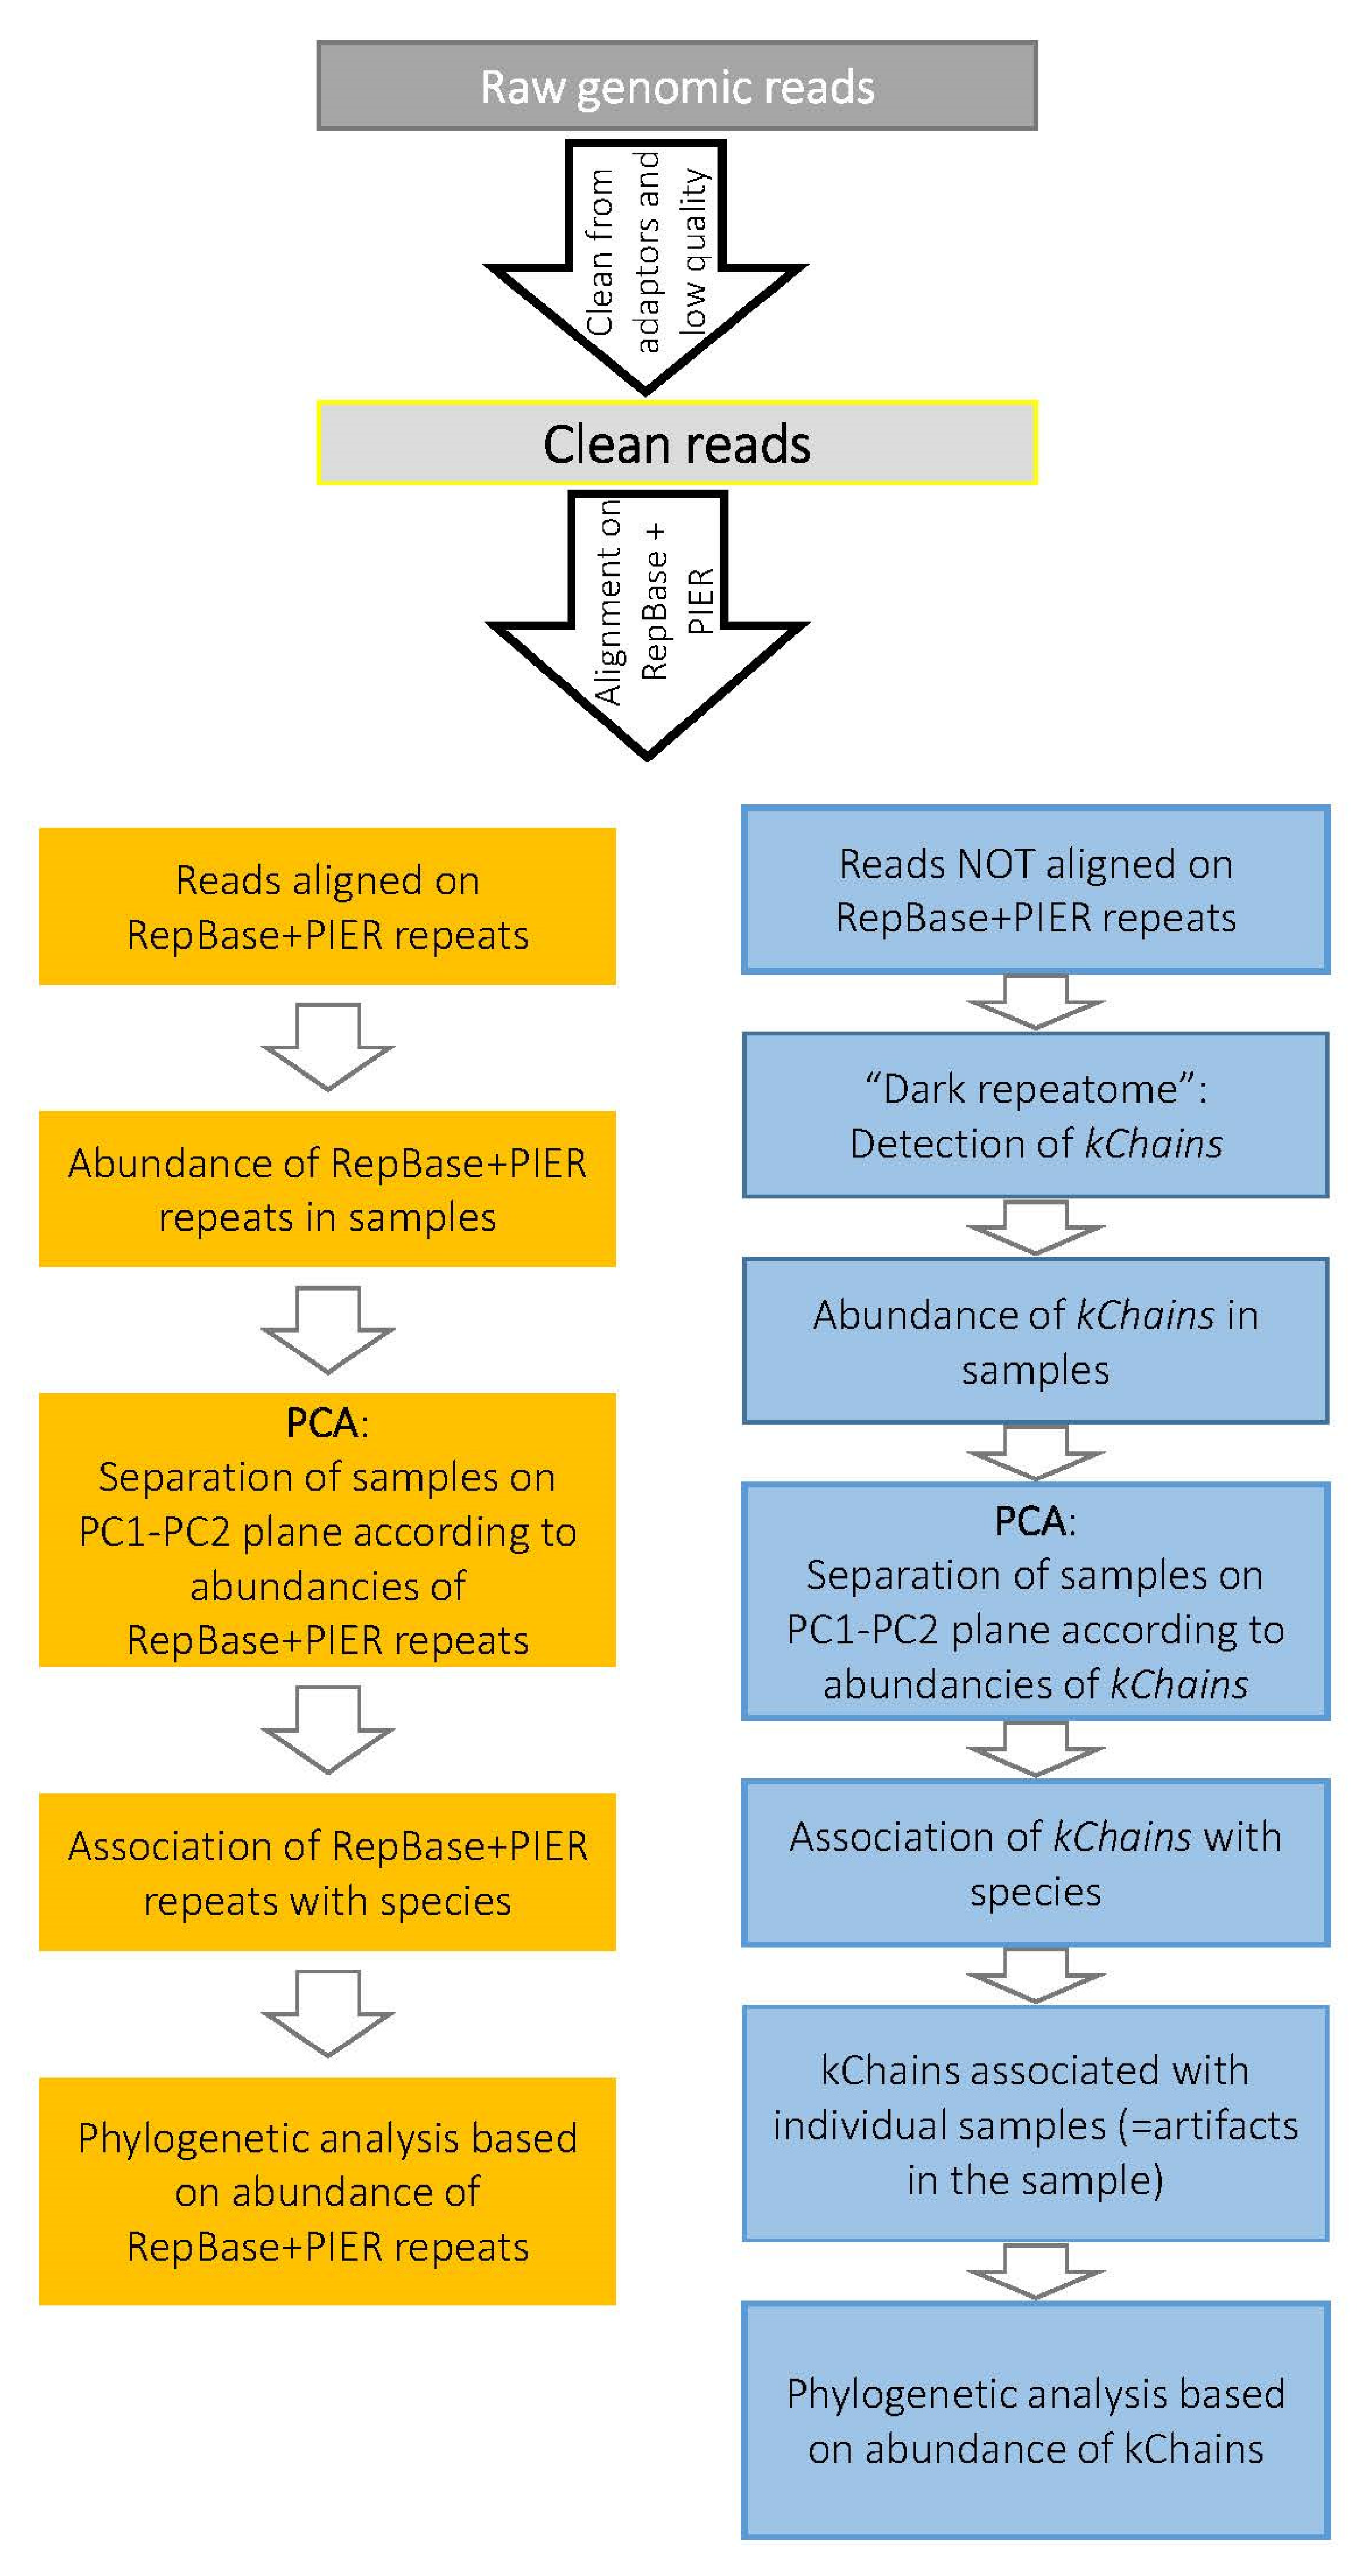
2.2. Bioinformatics Analysis

The workflow for studying the repetitive DNA of ten conifer species is presented in Figure 1. Shortly, adapters were trimmed, and low-quality reads were excluded. Then, the remaining reads were aligned to RepBase and PIER databases of known repetitive elements. The abundance matrix of RepBase and PIER repeats was used in downstream analyses as the abundance of ‘known RE’. Next, using 10% of reads unaligned to RepBase and PIER, we assembled highly repetitive kChain sequences. Alignment of all reads to the assembled kChains gave an abundance matrix of kChains that was used in downstream analyses.

2.3. Read Cleaning and Quality Assurance

Prior to the analysis of RE, we performed extensive quality assurance of the raw genomic reads. The reads were trimmed from adaptors using Trimmomatic algorithm [31] with default parameters. As we collected the sequencing datasets from NCBI database, we did not have information on the adapters used for each sequencing run. Thus, we did not add any adapters to the default list used by Trimmomatic. The low-quality reads were filtered out. One of the Pinus sibirica samples has not been preprocessed to provide a negative control for the quality control procedure.

2.4. Alignment of Genomics Reads onto Repeat Sequences: RE Abundance Calculation

Alignment of the genomics reads on RepBase [7,32], the Pinus taeda specific repetitive element database PIER [8], and on the newly detected REs (Kchains) was performed with relatively relaxed thresholds. We used Bowtie2 mapper in local mode, looking only for one alignment [33]. The relaxed mapping procedure was required for two reasons: firstly, the raw sequencing reads from different plant species were aligned to the same known REs that might be slightly varied especially in different taxonomic groups. Secondly, the reads not aligned to known RE were assembled into consensus putative repeats (kChains). Again, alignment on kChain sequences must be flexible to ensure successful alignment of slightly different reads from taxonomically different plants on consensus sequences. The abundances of RE and kChains in each sample were estimated as the median of per-position coverage across all positions of the repeat sequence.
The raw abundance table was transformed to a natural logarithmic scale, quantile normalized, and filtered so that only RE with high abundance (in each section, the exact abundance is stated) at least in one sample remain before all downstream analyses.

2.5. Putative Repetitive Elements—kChains

Putative repetitive elements were extracted from the raw whole genome sequencing reads by utilizing the tBiClustering algorithm [34]. Shortly, the tBiClustering approach for finding repeats in raw reads is based on the unsupervised detection of dense associations between k-mers (k-tuples in sequences, k = 12, 15) and short sequence fragments of the genome (NGS reads).
The task can be defined as a search for densely connected subsets of vertices of two disjoint types in a bi-partite graph G {V1, V2, E}. Here, two types of vertices (V1 and V2) are k-mers and the raw genomics reads. A k-mer and a read are linked by an edge if the k-mer is a sub-sequence of the read. The tBiClustering approach exploits the co-clustering idea: find two subsets, VsV1 and VtV2, simultaneously, which are densely connected. The density of a bipartite sub-graph Gst is defined as: dGst = |Est|/(|Vs| · |Vt|). According to this definition, dGst ∈ [0, 1], and a subgraph has the density one if and only if it is a biclique. The assembled k-mers inside every tBiCluster are repetitive sub-sequences of the genomic reads (kChains).
We used 10% of randomly selected PE reads from 30 whole-genome sequencing samples of conifers and Gnetum gnemon to assemble reference kChains (putative repetitive elements) with the tBiClustering algorithm. Since 10% of raw data is a large enough sample to represent general distribution of pair-kmers in the total dataset, we expect that the assembly of the repetitive pair-kmers that were generated from 10% of raw data will produce majority of the highly repetitive fragments that are contained in the total dataset.
The relatively short kChain sequences were extended by Trinity software [35]. We used Trinity, a transcriptome assembler, because we expect to encounter individual disconnected graphs, rather than few large connected sequences, each representing the repetitive element.

2.6. Principal Component Analysis (PCA)

The PCA method [36] performs compression of multidimensional distribution of points in space of smaller dimension (typically two-dimensional space) with minimal distortion of inter-point distances. Thus, the PCA analysis was performed for 30 dimensional points (10 species in 3 replicates)—these are log-abundance profiles of known (RepBase and PIER) or newly detected RE elements (kChains).
REs or kChains can also be assigned a position in the PCA space. This position is determined after linear orthogonal transformation of the original space into space with PCs as coordinates, and then compressing the initial space to a space based on first two PCs as new coordinates of the space. The selected PCs cover highest fraction of the total data variability.
PCA analysis allows associating columns and rows of the analyzed abundance matrix through their positions on the PCA space: coordinates of columns are their loadings on the selected PC-components, and coordinates of rows are their coordinates as points in the linearly transformed and compressed space [36]. PCA analysis gave positions of species (columns of the analyzed table) and positions of repetitive elements (rows of the table). The species and repetitive elements that have the maximal abundances in these species are associated as they occupy the same region on the PCA plane.

2.7. Phylogenetic Analysis Based on Repeat Abundance

Phylogenetic analyses based on the abundance of known RepBase and PIER repeats and novel putative repeats (kChains) were created using the neighbor-joining method from R package APE [37].

3. Results

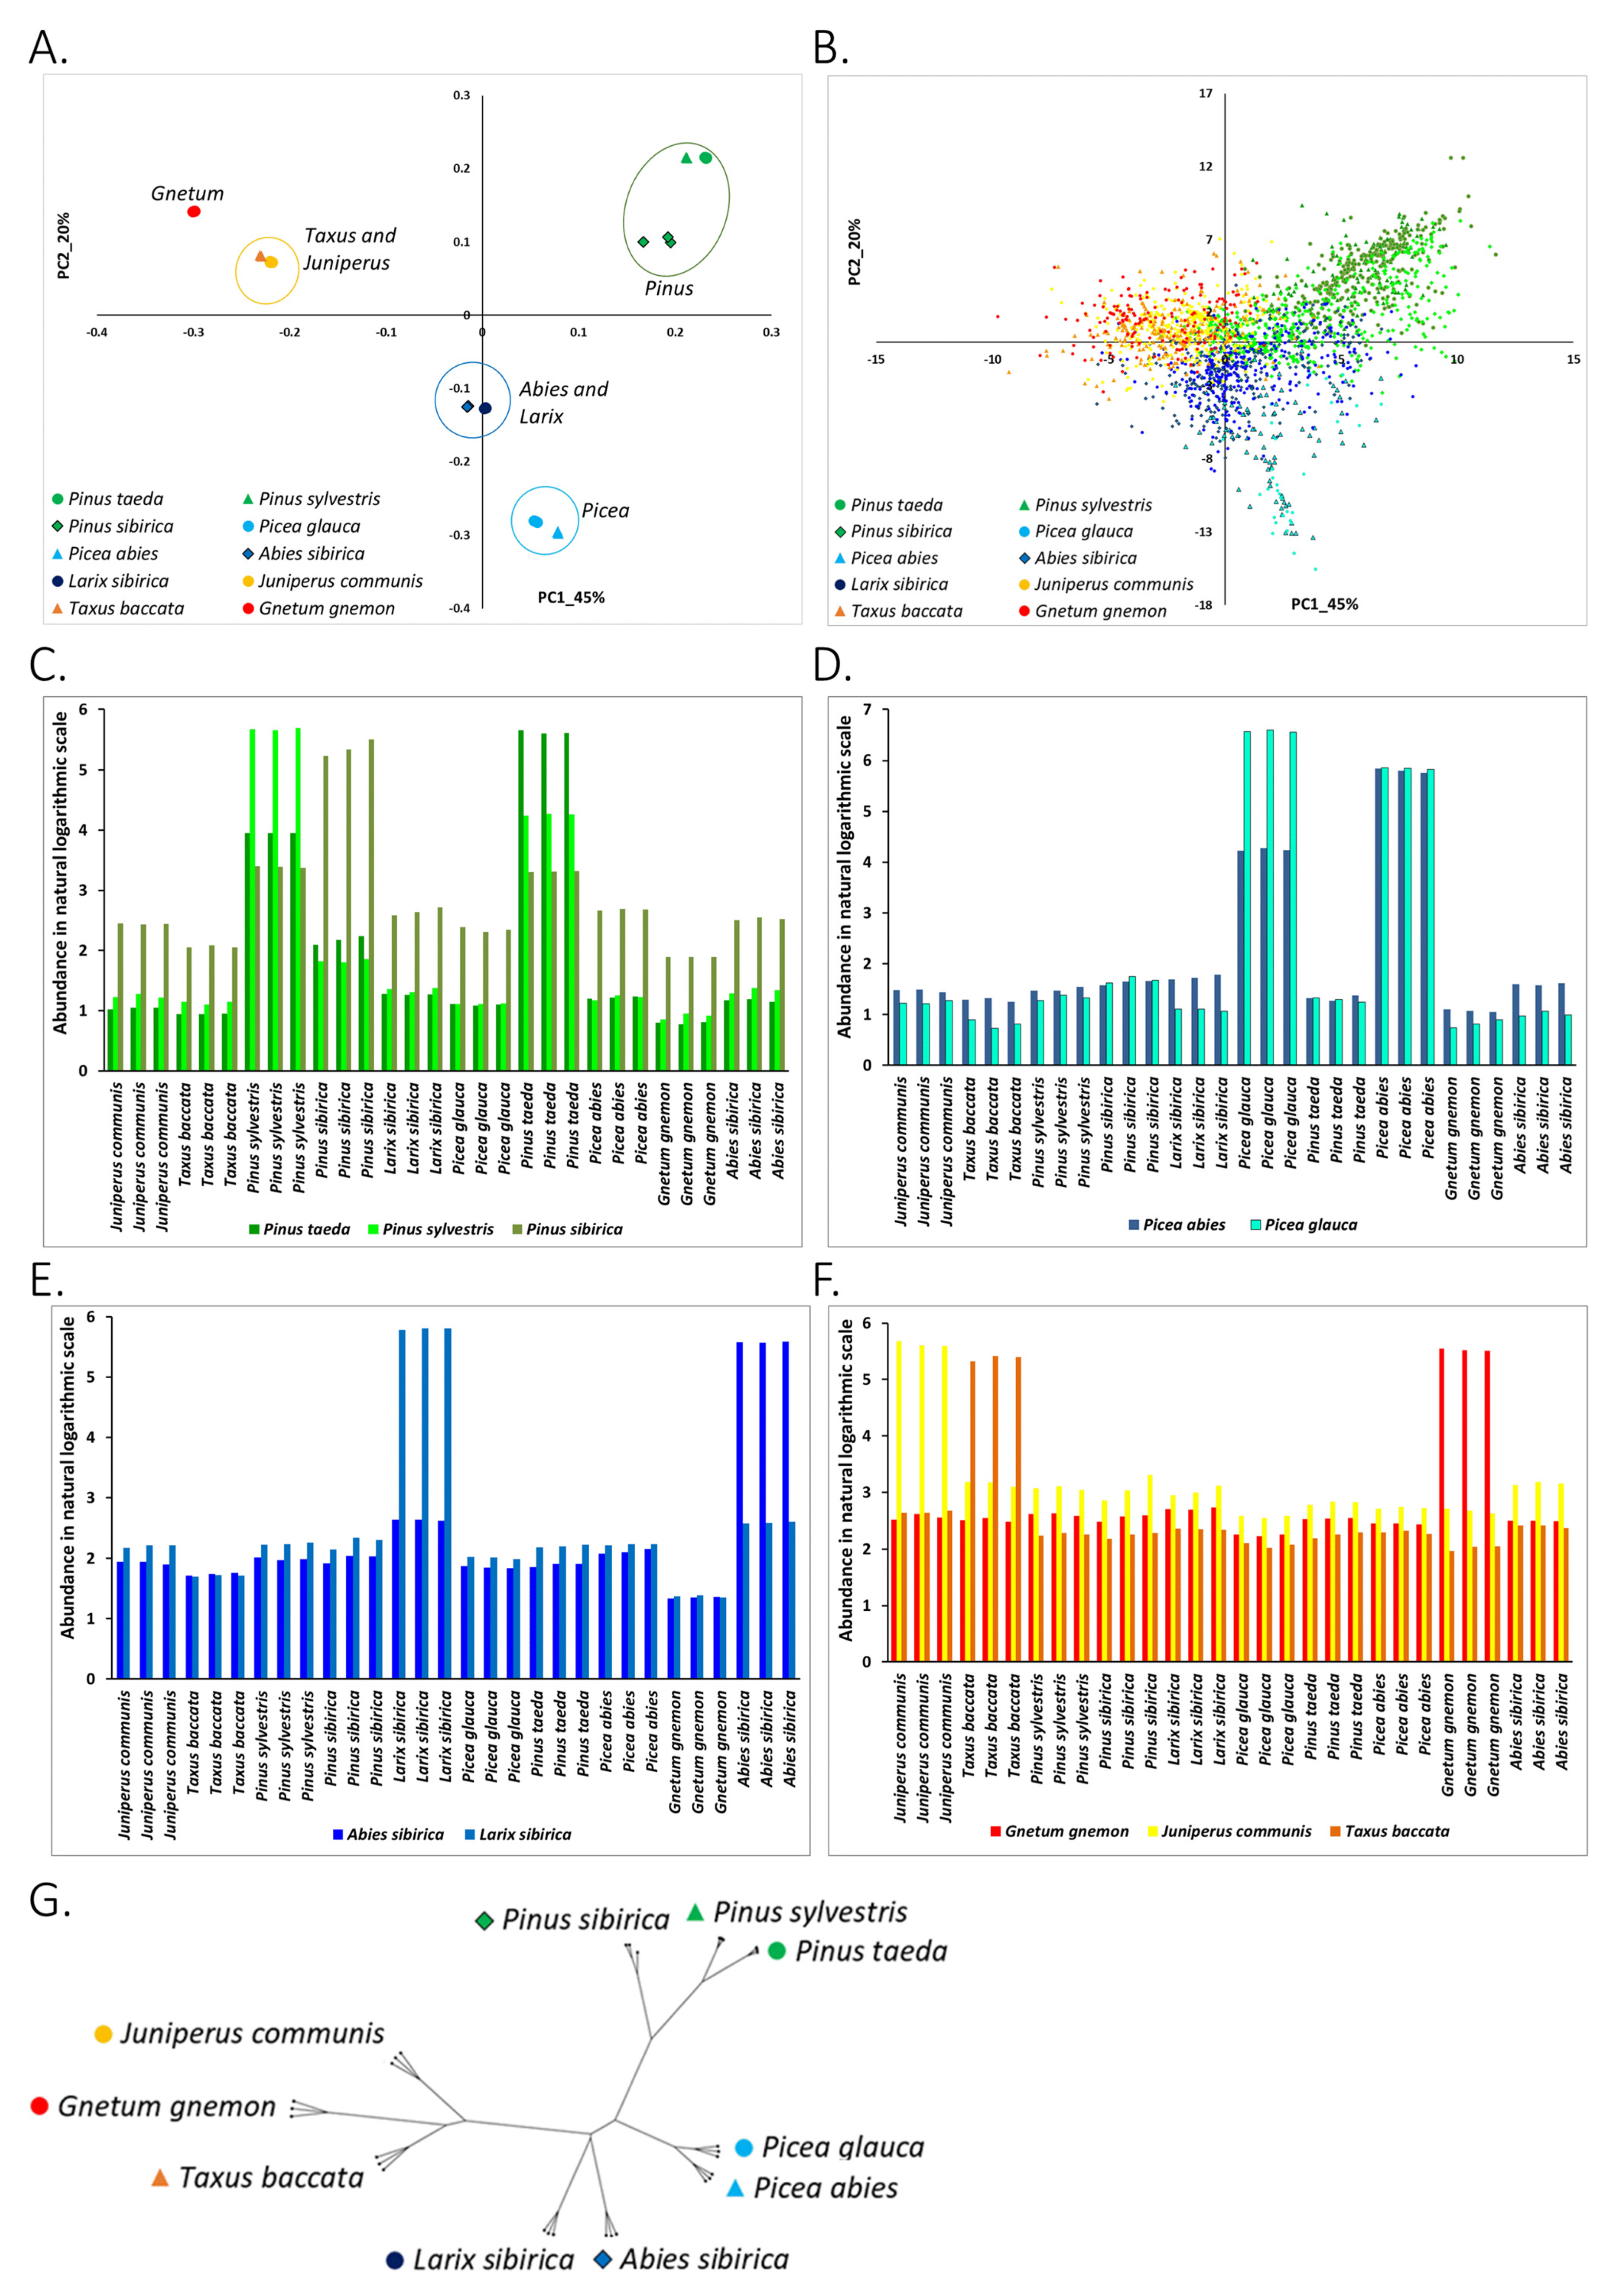
3.1. Abundance of Known RE in Conifers and Gnetum Species

3.1.1. Clustering of Species on the PC1-PC2 Plane Agrees with the Taxonomy

Aligning the genomic reads on the two databases of known repetitive elements, RepBase and PIER (see Section 2), we identified more than 7000 highly abundant (more than 150 reads per base pair at least in one sample) known RE (Table S2). Principle component analysis (PCA) revealed that the abundance of known RE is well associated with the species’ taxonomy (Figure 2A). The replicates of all species were tightly clustered into four groups on the PC1-PC2 plane that covered 65% of total data variability (Figure 2A). The first group contained all three Pinus species. The second group included the two Picea species. Based on the abundance of known repetitive elements, this Picea group is farther from Pinus than the combined Larix-Abies group. This finding does not match the known phylogeny based on chloroplast genomics, where Pinus and Picea species are closer to each other than Pinus is to Larix and Abies species [38]. The third group included the Larix sibirica and the Abies sibirica samples. Phylogenetically, Larix sibirica and Abies sibirica belong to closely related groups: Laricoideae and Abitoideae, respectively. Finally, the fourth group included the Taxus and Juniperus samples with Gnetum gnemon close by (Figure 2A). This group was separated from the three others, mirroring their taxonomic distance from other species (Figure S2 adapted from [39]).

3.1.2. Association of Types of Known RE with the Studied Plants

PC analysis can be used to link the repetitive elements with the groups of plants based on the position of repeats and plant samples on the PC plane (Section 2). Projection of known RE on the PC1-PC2 plane yielded a link of known RE with plant species (Figure 2B). Abundance profiles of repeats across all samples are presented in Figure 2C–F. Bar graphs denote the average abundance of repeats most represented (most abundant) in some particular species (depending on the color of the bars) across all samples. For example, in Figure 2C, green bars represent the average abundance of repeats that have maximum abundance in Pinus taeda across all samples. In fact, these repeats, when projected on the PC1-PC2 plane, occupy the same position as samples of Pinus taeda on the PC1-PC2 plane.
We found that repeats from RepBase and PIER databases were present in all studied gymnosperm and Gnetum species. However, they were much more abundant in the species associated with their location on the PCA plane. Based on the abundance of RepBase and PIER repeats, the most linked groups of species were Pinus, mostly Pinus taeda and Pinus sylvestris (Figure 2C). Repeats with maximum abundance in Pinus taeda were highly abundant also in Pinus sylvestris and vice versa. Pinus sibirica appears to be an outlier in the Pinus group. RepBase and PIER repetitive elements associated with Pinus sibirica were highly abundant in two other Pinus species but not vice versa (Figure 2C). This may be anticipated as Pinus sibirica belongs to the Strobus subgenus and the other two Pinus species belong to the Pinus subgenus.
Similarly, the Picea species (Picea glauca and Picea abies) were linked by the abundant RepBase and PIER repeats. Namely, highly abundant repeats in Picea glauca were also very abundant in Picea abies, and vice versa (Figure 2D).
Other biological groups of species were not internally linked by the most organism-specific RepBase and PIER repeats (Figure 2E,F). Larix sibirica, Abies sibirica, Taxus, Juniperus, and Gnetum gnemon all had species-specific abundant known repeats.
Repeats from RepBase and PIER databases can be assigned to repeat families and super-families. This annotation of known repeats may further clarify whether different conifer species accumulate repetitive elements from different super-families. Indeed, we were able to identify highly abundant repeats from different super-families including terminal inverted repeats (TIRs), mutator-like transposable elements (MULEs), long interspersed nuclear elements (LINEs), Helitrons, LTR/Gypsi, LTR/Copia, LTR/ERV1, hAT transposons, CACTA transposons, and others. However, we did not find an association of specific repeat families with plant species. Almost all families of repeats were distributed across the PC1-PC2 plane (Figure S1). Thus, our analysis revealed that repeats from most families were present in all species of studied plants with comparable abundance (Figure S1). Indeed, while specific repeats were species-specific, whole families of repeats were not.

3.1.3. Phylogenetic Analysis of Conifer and Gnetum Species Based on the Genomic Abundance of Known RE

Next, we constructed a phylogenetic tree based on the abundances of known RE in genomes of the studied plants. Phylogeny based on the abundance of repetitive sequences in genomes of plants and other organisms has been suggested to be useful as an additional signal of organism evolution together with more classical sequence-based phylogenetic inferences [40]. We found that the phylogenetic tree inferred from the abundance of known RE in the genomes of conifer and Gnetum species (Figure 2G) matches fairly well with the known phylogeny based on sequences of all chloroplast coding genes [38], and on sequences of chloroplast rbcL and matK genes [41], summarized in a simplified tree in Figure S2. However, our phylogenetic analysis based on abundance of known RE indicated that Taxus and Gnetum gnemon had the most recent common ancestor (MRCA). This is not supported by previous studies based on sequence similarities of single-copy genes [42] and on chloroplast genome sequences [38,41] which show that Taxus and Junniperus species are the most closely related. Additionally, the speciation of Abies and Larix did not match the known phylogeny. The Abies-Larix group in our analysis formed a clade. However, according to previous studies, the speciation of Abies from Pinus-Picea had happened before the speciation of Larix from Pinus-Picea [38,41]. Speciation of Pinus-Picea group was in good match with the known phylogeny. One Pinus sibirica sample that was not preprocessed to provide an internal control (see Section 2), separated from other Pinus sibirica samples earlier on, suggesting the importance of preprocessing raw genome sequencing reads from adapters and other technical artifacts before alignment on reference sequences.
The taxonomic and the phylogenetic relations between conifer and Gnetum species based on the analysis of the abundance of known RE in the genomes of these plants can suffer from several biases, especially biases related to the loss of information about the true diversity of repetitive elements in the genome. Thus, as the next step of our investigation, we studied the “dark repeatome” in the genomes of the ten chosen conifer and Gnetum species more closely.

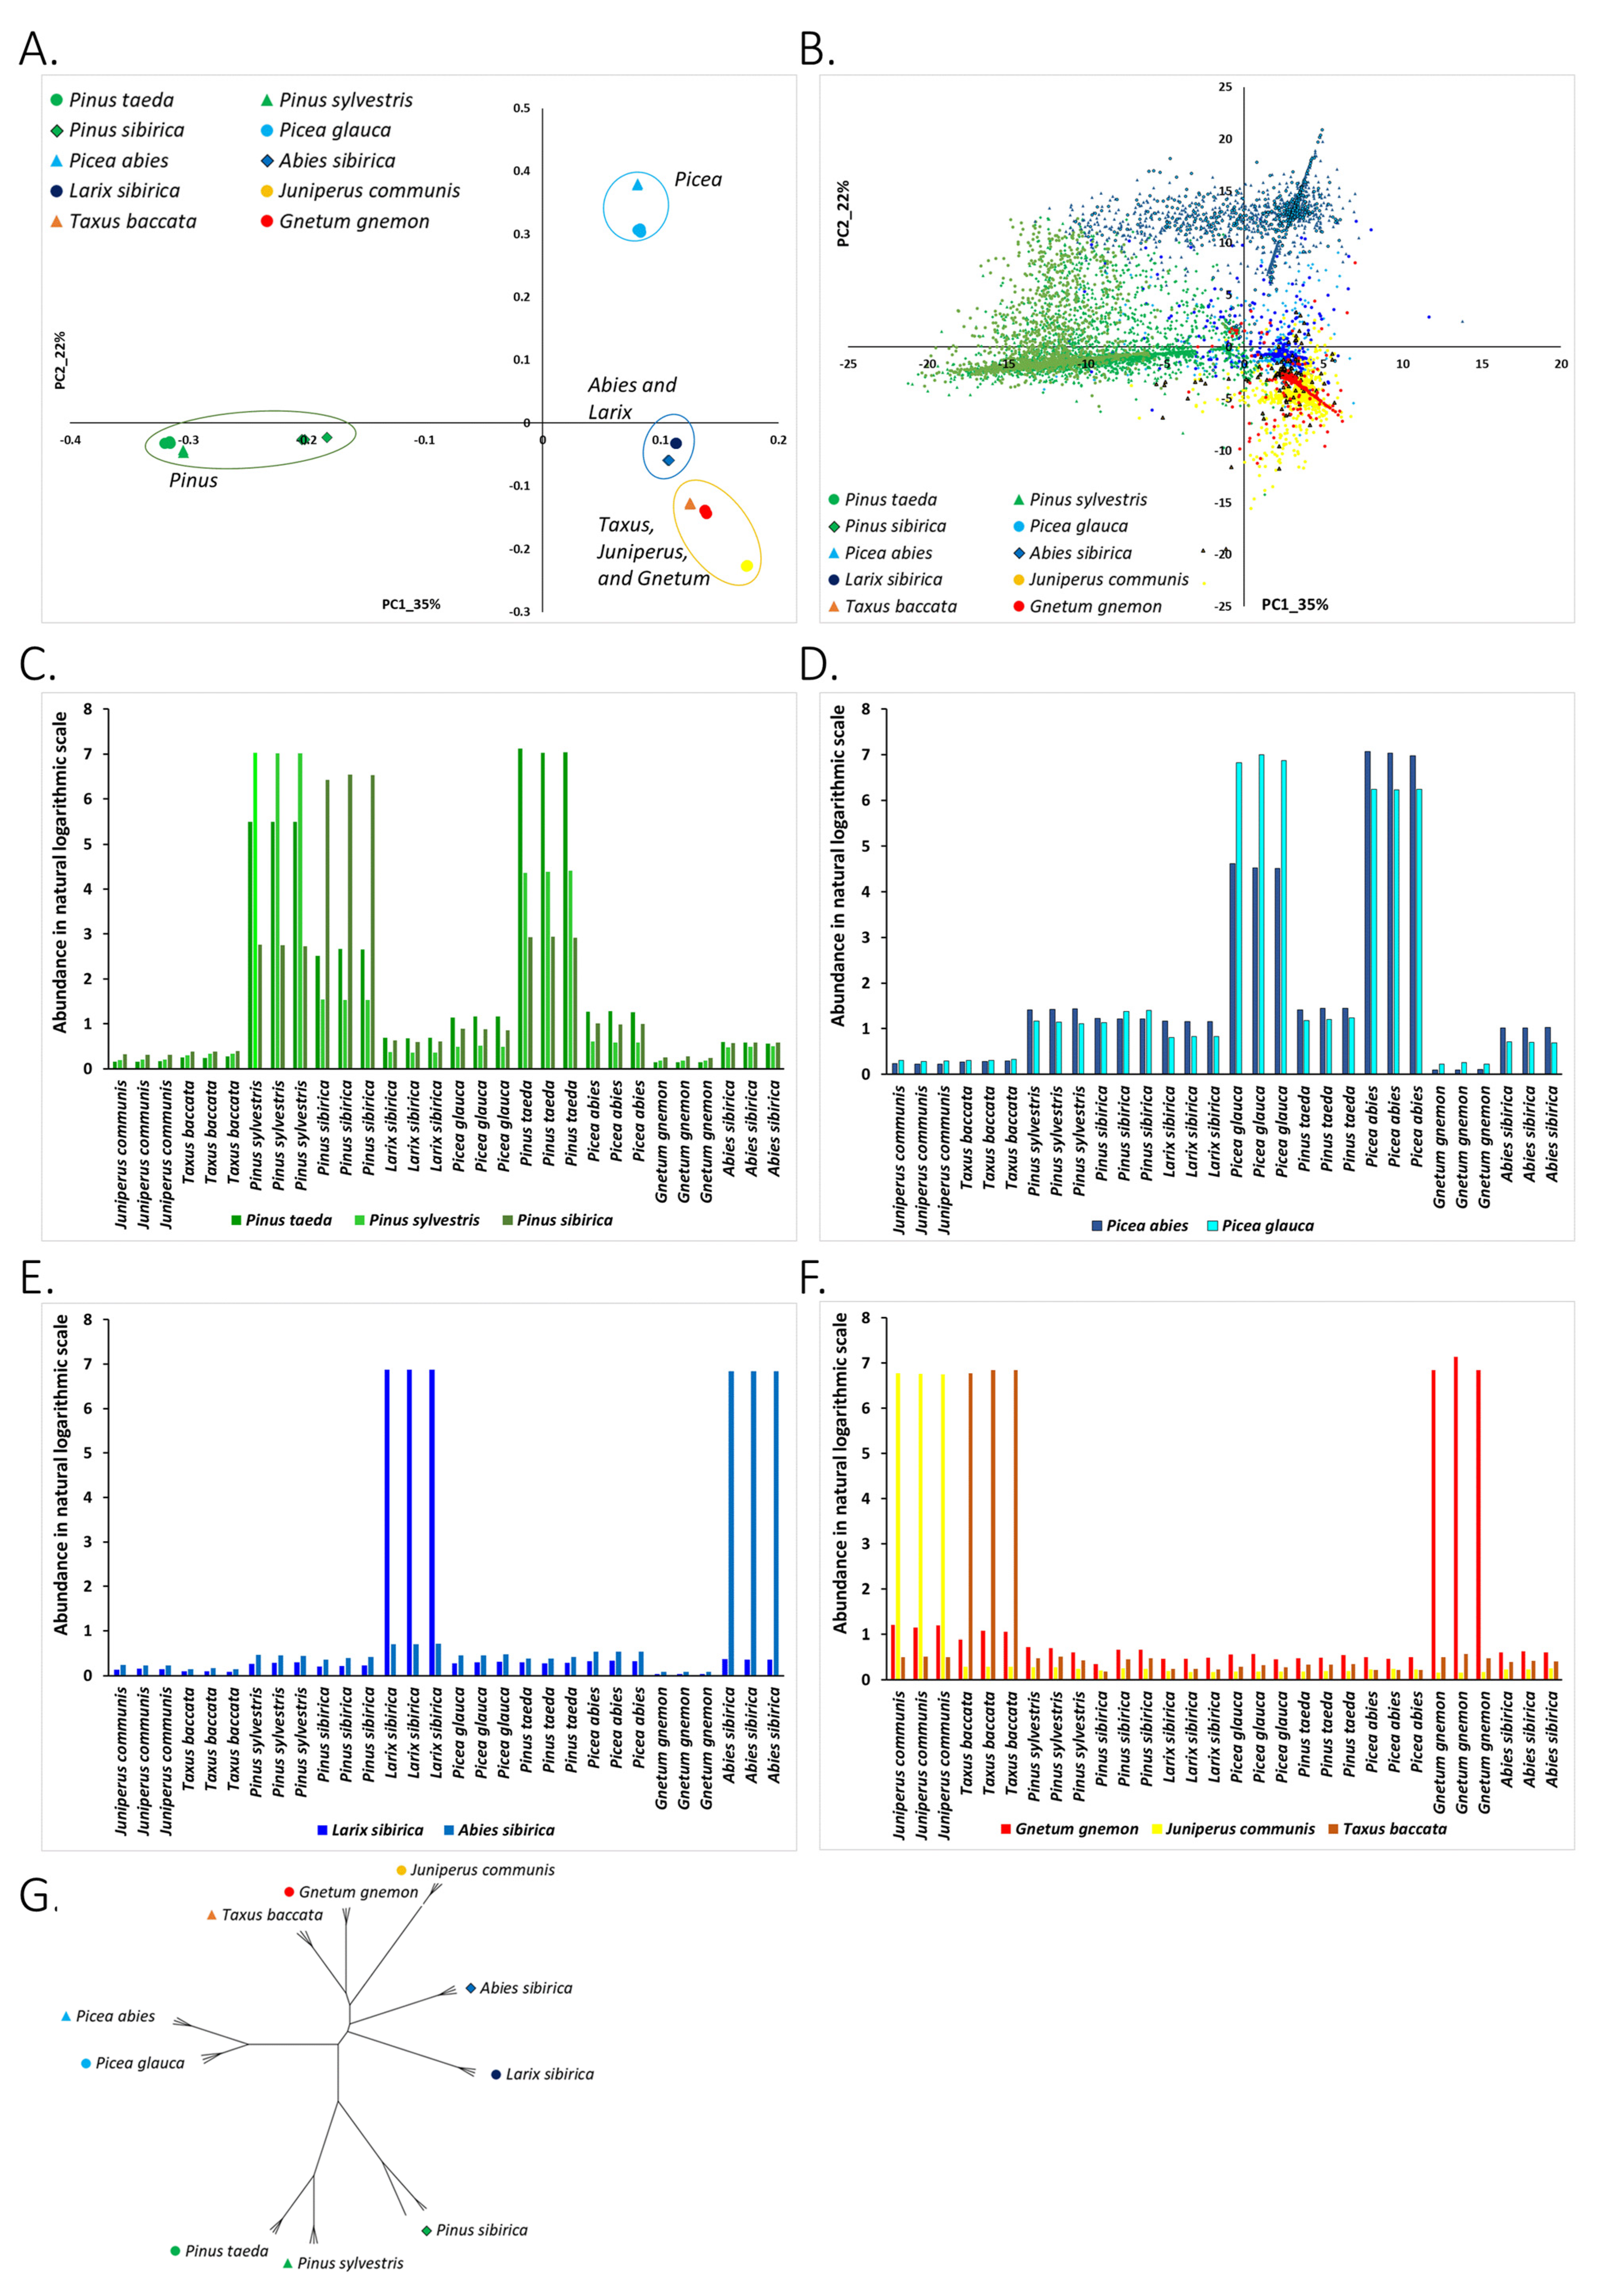
3.2. “Dark Repeatome”: Its Abundance in Genomes of Studied Plants

To investigate the full spectrum of “dark repeatome” of the ten studied plants, we utilized the tBiClustering algorithm [34] for the detection of highly repetitive sequences in the genomic reads (kChains) of the studied plants (see Section 2). After identifying the highly repetitive sequences, we aligned all reads previously unmapped on the RepBase and PIER databases onto these constructed kChains and generated an abundance matrix of these putative repetitive elements. We next transformed the matrix to natural logarithmic scale, quantile normalized it, and chose only highly abundant (>665 at least in one sample) kChains for further analyses (see Section 2).
Highly repetitive whole-genome sequencing reads can be a result of several biological and technical mechanisms. Namely, these repetitive sequences may be short pieces of repeats present in the plant genome (true repetitive elements). In addition, highly repetitive reads can originate from chloroplast or mitochondrial genomes. These sequences can also result from technical artifacts such as primers or adapters used for the sequencing but which were not included in the Trimmomatic adapter list and thus were not detected and removed by Trimmomatic.
To identify the possible confounding sequences assembled as kChains, we annotated all kChains by aligning them to publicly available cpDNA assemblies (Table S3). kChains that were not aligned to cpDNA assemblies were further annotated by aligning them to the ‘nr/nt’ database [43] with BLAST [44]. Most of the successfully annotated kChains unexpectedly aligned to the Cyprinus carpio genome and were most abundant in the Juniperus communis samples (Figures S2 and S3, Table S4). To reduce the confounding factor of the contaminations of putative repetitive elements, we removed kChains that aligned onto cpDNA, mtDNA, and other confounding sequences from ‘nr/nt’ database from further analysis. In this way, the final kChain abundance matrix used for downstream analyses included only nuclear highly abundant DNA repetitive elements (Table S5).
We identified 9928 highly abundant (see Section 2) kChains, 24% of which (2413) were unique to one species. Another 127 kChains were present in all species. The other kChains were present in at least two different species (Table S5).

3.2.1. Clustering of Species on the PC1-PC2 Plane and Association of Species with Nuclear DNA kChains

PC analysis based on the abundance of nuclear DNA kChains gave taxonomically meaningful separation of species on the PC1-PC2 plane (Figure 3A). Pinus species were grouped together. Additionally, the two Picea species formed a tight group on the PC1-PC2 plane. Abies and Larix species were also grouped. Similar to our previous analysis of known RE, we found an association between putative new nuclear DNA repeats (Kchains) and the conifer species on the PCA plane (Figure 3B). Namely, on the PC1-PC2 plane, kChains with maximum abundance in a species were closely positioned to the samples of this species (Figure 3A,B). Interestingly, one can note that clusters of Kchains were much more tightly linked to groups of conifer species than the RepBase and PIER repeats. For example, Picea-specific kChains, kChains with maximum abundance in Picea abies and Picea glauca species, were highly abundant only in Picea with low abundance in other species (Figure 3D). This specificity of kChains to the species of plants may be a result of high specificity of short repetitive sequences. kChains were short (30–200 bp) repeats which may include truncated RE, short satellite DNA, and other short and highly repetitive sequences.

3.2.2. Phylogenetic Analysis of Conifer and Gnetum Species Based on The Genomic Abundance of Putative Repetitive Elements (kChains)

The phylogenetic tree inferred from the abundance of putative repetitive elements (kChains) resembled the tree constructed from the known RE (Figure 2G) with greater specificity of species that reflect the known conifer phylogenetics. Early separation of Abies from Larix samples, in contrast to Larix-Abies clade formation when the abundance of known (RepBase and PIER) repeats were used, matches the phylogeny described before [38,41]. Abies and Larix speciation, based on kChain abundance, was followed by the two Picea species, and later by Pinus species. Pinus sibirica differentiated first, which matches the known Pinus phylogeny. This greater sensitivity of phylogenetic analysis based on the abundance of kChains aligns with the greater specificity of kChains to plant species reflected by PCA separation in Figure 3B. Our phylogenetic analysis based on the abundance of putative repetitive elements (kChains) in genomes of conifer and Gnetum species revealed that the Pinus-Picea clade is monophyletic. In addition, we found that the Pinus-Picea-Larix clade is also monophyletic. The Pinus sibirica speciation from species is evident and has occurred earlier according to kChain abundance (Figure 3G) compared to RepBase and PIER repeat abundances (Figure 2G).
Our phylogenetic analysis based on the abundance of short kChains may help clarify the interspecies relationship. It is more sensitive to genomic variations than analysis based on already well identified and classified known repeats from RepBase and PIER databases.

3.2.3. Analysis of kChains Associated with Chloroplast Genomes

As mentioned above, we removed the kChains aligned to cpDNA from our previously described analyses. However, cpDNA contains many repetitive elements; thus, the abundance of cpDNA annotated kChains may be used similarly to nuclear repeats [45]. We hypothesized that the kChains aligning to cpDNA might reflect the taxonomy of the studied plants.
The separation of plant species on the PCA plane based on the abundance of chloroplast-associated kChains revealed that Juniperus-Taxus-Gnetum species, which were grouped based on the abundance of known and putative nuclear DNA REs, were distant based on the abundance of cpDNA kChains (Figure 4A). Picea species were somewhat similar to Abies and Larix species based on cpDNA kChains abundances; however, based on genomic kChain abundances, Picea species were very distant. Abies and Larix were grouped together regardless of repeat abundance source (kChains, cpDNA kChains, or known REs). Pinus sibirica was also distant from two other Pinus species and a representative of another subgenus. This was more pronounced in the cpDNA analysis (Figure 4A,G).
Association of chloroplast kChains with the plant species by their location on the PCA plane revealed that chloroplast-associated kChains are taxa-specific (Figure 4B–F). It may be that the abundance of found kChains reflects the similarities between chloroplast genomes of the same taxa and the differences between chloroplast genomes of different taxa [45].
The phylogenetic relationship of Taxus-Juniperus-Gnetum species based on the abundance of cpDNA kChains (Figure 4G) was similar to previously known [41]. However, the phylogenetic tree based on the abundance of cpDNA kChains pointed to peculiar speciation of Picea-Abies-Larix group.

4. Discussion

Repetitive elements (REs) are highly abundant in plant genomes and are the primary sources of intra- and inter-species genetic variations [21]. Here, we investigated the inter-species relationships based on the abundance of repetitive genomic elements in conifers and Gnetum gnemon genera. We showed that the abundance of genomic RE reflects the evolution of plant genomes and carries phylogenetic signals which may be used in addition to more classical approach of sequence similarities.
The approach we utilized in this study may be used for detecting the abundance of known and newly assembled RE from whole genome sequencing reads. Raw genomic reads were first cleaned from adaptors and other technical sequences. Next, cleaned reads were aligned to known repeats from RepBase [32] and PIER [7] databases. The reads that were not successfully aligned were analyzed using a sensitive unsupervised bi-clustering (tBiClustering) procedure and assembled into putative short repetitive elements (kChains).
It should be noted that we counted NGS reads aligned to repeats (repeat-reads). These counts were normalized by taking 10 Gb of raw reads in each samples. By this way, actually, we normalized numbers of estimated repeat-integrations by genome lengths assuming their uniform coverage across genome and that the number of repeat-reads is proportional to a number of repeat-integrations in the genome. In a larger genome the level of coverage per 10 Gb of raw reads is lower than in a smaller one. The same number of integrations in a larger genome will produce lower number of repeat-reads. If in a larger genome, the number of repeat-reads is the same or higher than in a smaller one, it means that a larger genome has more integration sites. Therefore, by finding repeat-reads in the same amount of raw reads in each genome we indirectly normalized numbers of repeat-integrations by genome lengths via estimating numbers of integration sites in the same length-units of all genomes.
The distribution and patterns of abundance profiles of the putative repetitive elements (kChains) across species (Figure 3) were compared to the distribution and abundance patterns of annotated elements from RepBase and PIER databases (Figure 2). The PCA grouping of species according to kChains and known repetitive elements abundance profiles was biologically meaningful and in consensus with the conifer taxonomy. Pinus and Picea species matched the known confer taxonomy, the grouping of Larix sibirica and Abies sibirica species was in good agreement with their known phylogeny, and clustering of Cypress (Juniperus communis and Taxus baccata speacies) and Gnetum species was also in a reasonable correspondence with their phylogeny [38,41].
The highly abundant known and putative REs that were shared between species suggest that similar genome evolutionary forces shaped those species (Figure 2C–F and Figure 3C–F). The group of pines was tightly linked by the Pinus taxon-specific known repeats (Figure 2C) and putative repetitive elements (kChains) (Figure 3C). However, Pinus sibirica separated from the other two Pinus species, and highly abundant known and putative repetitive elements in Pinus sibirica were not as plentiful in the other two Pinus species (Figure 2C and Figure 3C). Indeed, Pinus sibirica belongs to the subgenus Strobus, while the other two pine species belong to a subgenus Pinus.
Picea glauca and Picea abies were strongly linked by RE, but not symmetrically: both known and putative repeats of Picea glauca were of high abundance in Picea abies; however, Picea abies abundant repeats were not very abundant in Picea glauca (Figure 2D and Figure 3D).
Larix sibirica and Abies sibirica had very individual species-specific repertoires of highly abundant known and putative REs (Figure 2E and Figure 3E).
Cypress and Gnetum species were also enriched by highly abundant species-specific REs (Figure 2F and Figure 3F), matching their known phylogenetic separation. These results again indicate that the abundance of repetitive elements in the genomes of plants reflects the specific evolutionary forces acting on them.
Several species (mainly Pinus sibirica and Gnetum gnemon) were highly enriched with newly determined repeats (kChains) associated with chloroplast. This may be expected as cpDNA is highly abundant in plant cells and is represented by several hundred or sometimes even thousand copies (organelles) per cell, unlike a single nuclear genome copy per cell [46]. Interestingly, the clustering of plant species on the PC1-PC2 plane based on the abundance of cpDNA kChains was similar to the clusters formed based on the abundance of known and putative nuclear genome repeats (Figure 4A). The association of cpDNA kChains with plant species (Figure 4C–F) was also in a good match with the similar association of repeats with plant species (Figure 2C–F and Figure 3C–F).
As a by-product of the analysis of repetitive elements in conifer plants, we revealed that many of the kChains aligned well to Cyprinus carpio genomic sequences. These kChains were enriched mostly in the Juniperus communis samples (Figure S3). The Cyprinus carpio assembled genome is known to be contaminated by the Illumina adaptors [47], and we hypothesize that the identified kChains are these adaptors which were not cleaned by the Trimmomatic tool [31] because they were not part of the default adapter list. Indeed, often, the exact adaptor sequences that were used are not known to the researcher, especially if the re-analysis of data is performed. Therefore, we propose that the tBiClustering algorithm may be used as an additional tool for detecting and cleaning highly repetitive artifact sequences from NGS reads.

5. Conclusions

Raw genomic sequencing data contain rich information about the “repeatome”. This information is frequently unavailable in already assembled genomes because genomic areas of repeats are often masked in genome assembly and annotation. Many of the plant genomes are extremely abundant in repetitive DNA. This vast “repeatome” may play an essential role in regulating plant evolution and adaptation. In a comparative genomics study of repetitive elements of different plant genera, the application of the tBiClustering algorithm to the massive pool of raw sequence data allowed us to efficiently detect repetitive elements and their abundance profiles across different species.

Supplementary Materials

The following are available online at https://www.mdpi.com/article/10.3390/life11111234/s1: Figure S1: Abundance of families of known repeats across plant species, Figure S2: A simplified phylogeny of studied genera adapted from Uddenberg et al. 2015 [39], Figure S3: PC1-PC2 distribution of kChains annotated as Cyprinus carpio genomic sequences, Table S1: Species taxonomy and links to the sequencing data used in the study, Table S2: Abundance matrix of RepBase and PIER repeats across 30 samples of conifers, Table S3: Abundance matrix of cpDNA-kChains across 30 samples of conifers, Table S4: Abundance matrix of kChains aligned to Cyprino carpio genomic sequences across samples of all plants, Table S5: Abundance matrix of nuclear genomic kChains across 30 samples of conifers.

Author Contributions

Conceptualization, L.B., D.A.K. and K.V.K.; data curation, A.T., D.A.K., Y.A.P. and N.V.O.; formal analysis, A.T., E.A.T., S.B., V.V.S., E.B., A.V.S. and J.P.; investigation, S.B., E.A.T. and J.P.; methodology, A.T., L.B. and K.V.K.; project administration, J.P.; software, A.T. and V.V.S.; supervision, J.P., L.B. and K.V.K.; validation Y.A.P., N.V.O. and K.V.K.; visualization, E.B. and E.A.T.; writing—original draft, S.B., E.A.T., A.V.S., J.P., L.B. and K.V.K.; writing—review and editing, S.B., E.A.T., J.P., L.B. and K.V.K. All authors have read and agreed to the published version of the manuscript.

Funding

This study was supported by a grant to Tauber Bioinformatics Research Center from the Laszlo N. Tauber Family Foundation and by Research Grant No. 14.Y26.31.0004 from the Government of the Russian Federation to the Genome Research and Education Center, Siberian Federal University.

Institutional Review Board Statement

Not applicable.

Informed Consent Statement

Not applicable.

Data Availability Statement

All analyzed raw genomic data are available from NCBI database. Accession numbers are presented in Table S1.

Acknowledgments

We acknowledge support by the Open Access Publication Funds of the University of Göttingen.

Conflicts of Interest

The authors declare no conflict of interest.

References

  1. Birol, I.; Raymond, A.; Jackman, S.; Pleasance, S.; Coope, R.; Taylor, G.A.; Yuen, M.M.S.; Keeling, C.; Brand, D.; Vandervalk, B.; et al. Assembling the 20 Gb white spruce (Picea glauca) genome from whole-genome shotgun sequencing data. Bioinformatics 2013, 29, 1492–1497. [Google Scholar] [CrossRef] [PubMed]
  2. Nystedt, B.; Street, N.; Wetterbom, A.; Zuccolo, A.; Lin, Y.-C.; Scofield, D.; Vezzi, F.; Delhomme, N.; Giacomello, S.; Alexeyenko, A.; et al. The Norway spruce genome sequence and conifer genome evolution. Nature 2013, 497, 579–584. [Google Scholar] [CrossRef] [PubMed] [Green Version]
  3. Pellicer, J.; Hidalgo, O.; Dodsworth, S.; Leitch, I.J. Genome Size Diversity and Its Impact on the Evolution of Land Plants. Genes 2018, 9, 88. [Google Scholar] [CrossRef] [PubMed] [Green Version]
  4. Pellicer, J.; Leitch, I.J. The Plant DNA C-values database (release 7.1): An updated online repository of plant genome size data for comparative studies. New Phytol. 2020, 226, 301–305. [Google Scholar] [CrossRef] [Green Version]
  5. Kuzmin, D.; Feranchuk, S.I.; Sharov, V.; Cybin, A.N.; Makolov, S.V.; Putintseva, Y.A.; Oreshkova, N.V.; Krutovsky, K.V. Stepwise large genome assembly approach: A case of Siberian larch (Larix sibirica Ledeb). BMC Bioinform. 2019, 20, 35–46. [Google Scholar] [CrossRef] [PubMed] [Green Version]
  6. Mosca, E.; Cruz, F.; Gómez-Garrido, J.; Bianco, L.; Rellstab, C.; Brodbeck, S.; Csilléry, K.; Fady, B.; Fladung, M.; Fussi, B.; et al. A Reference Genome Sequence for the European Silver Fir (Abies alba Mill.): A Community-Generated Genomic Resource. G3: Genes Genomes Genet. 2019, 9, 2039–2049. [Google Scholar] [CrossRef] [Green Version]
  7. Neale, D.B.; Wegrzyn, J.L.; Stevens, K.A.; Zimin, A.V.; Puiu, D.; Crepeau, M.W.; Cardeno, C.; Koriabine, M.; Holtz-Morris, A.E.; Liechty, J.D.; et al. Decoding the massive genome of loblolly pine using haploid DNA and novel assembly strategies. Genome Biol. 2014, 15, R59. [Google Scholar] [CrossRef] [Green Version]
  8. Wegrzyn, J.L.; Lin, B.Y.; Zieve, J.J.; Dougherty, W.M.; Martínez-García, P.J.; Koriabine, M.; Holtz-Morris, A.; DeJong, P.; Crepeau, M.; Langley, C.H.; et al. Insights into the Loblolly Pine Genome: Characterization of BAC and Fosmid Sequences. PLoS ONE 2013, 8, e72439. [Google Scholar] [CrossRef] [Green Version]
  9. Zimin, A.; Stevens, K.A.; Crepeau, M.; Holtz-Morris, A.; Koriabine, M.; Marçais, G.; Puiu, D.; Roberts, M.; Wegrzyn, J.; de Jong, P.J.; et al. Sequencing and Assembly of the 22-Gb Loblolly Pine Genome. Genetics 2014, 196, 875–890. [Google Scholar] [CrossRef] [Green Version]
  10. Li, Z.; Baniaga, A.E.; Sessa, E.B.; Scascitelli, M.; Graham, S.W.; Rieseberg, L.H.; Barker, M.S. Early genome duplications in conifers and other seed plants. Sci. Adv. 2015, 1, e1501084. [Google Scholar] [CrossRef] [Green Version]
  11. Krutovsky, K.V.; Oreshkova, N.V.; Putintseva, Y.A.; Ibe, A.A.; Deich, K.O.; Shilkina, E.A. Preliminary results of de novo whole genome sequencing of Siberian larch (Larix sibirica Ledeb.) and Siberian stone pine (Pinus sibirica Du Tour.). Siberian J. For. Sci. 2014, 1, 79–83, (In Russian with English abstract). [Google Scholar]
  12. Warren, R.; Keeling, C.; Yuen, M.M.S.; Raymond, A.; Taylor, G.A.; Vandervalk, B.; Mohamadi, H.; Paulino, D.; Chiu, R.; Jackman, S.; et al. Improved white spruce (Picea glauca) genome assemblies and annotation of large gene families of conifer terpenoid and phenolic defense metabolism. Plant J. 2015, 83, 189–212. [Google Scholar] [CrossRef]
  13. Mukherjee, S.; Stamatis, D.; Bertsch, J.; Ovchinnikova, G.; Sundaramurthi, J.C.; Lee, J.; Kandimalla, M.A.; Chen, I.-M.; Kyrpides, N.C.; Reddy, T.B.K. Genomes OnLine Database (GOLD) v.8: Overview and updates. Nucleic Acids Res. 2020, 49, D723–D733. [Google Scholar] [CrossRef]
  14. Williams, C.G.; Savolainen, O. Inbreeding depression in conifers: Implications for breeding strategy. For. Sci. 1996, 42, 102–117. [Google Scholar] [CrossRef]
  15. González-Martínez, S.C.; Dillon, S.; Garnier-Géré, P.H.; Krutovsky, K.V.; Alía, R.; Burgarella, C.; Eckert, A.J.; García-Gil, M.R.; Grivet, D.; Heuetz, M.; et al. Patterns of nucleotide diversity and association mapping. In Genetics, Genomics and Breeding of Conifers; Plomion, C., Bousquet, J., Kole, C., Eds.; CRC Press, Science Publishers, Inc.: Enfield, NH, USA, 2011; pp. 239–275. [Google Scholar]
  16. Ritland, K.; Krutovsky, K.V.; Tsumura, Y.; Pelgas, B.; Isabel, N.; Bousquet, J. Genetic mapping in conifers. In Genetics, Genomics and Breeding of Conifers; Plomion, C., Bousquet, J., Kole, C., Eds.; CRC Press, Science Publishers, Inc.: Enfield, NH, USA, 2011; pp. 196–238. [Google Scholar]
  17. Krutovsky, K.; Neale, D.B. Nucleotide Diversity and Linkage Disequilibrium in Cold-Hardiness- and Wood Quality-Related Candidate Genes in Douglas Fir. Genetics 2005, 171, 2029–2041. [Google Scholar] [CrossRef] [Green Version]
  18. Kinlaw, C.S.; Neale, D.B. Complex gene families in pine genomes. Trends Plant Sci. 1997, 2, 356–359. [Google Scholar] [CrossRef]
  19. Rigault, P.; Boyle, B.; Lepage, P.; Cooke, J.; Bousquet, J.; MacKay, J. A White Spruce Gene Catalog for Conifer Genome Analyses. Plant Physiol. 2011, 157, 14–28. [Google Scholar] [CrossRef] [PubMed] [Green Version]
  20. Wegrzyn, J.L.; Liechty, J.D.; Stevens, K.A.; Wu, L.-S.; Loopstra, C.A.; Vasquez-Gross, H.A.; Dougherty, W.M.; Lin, B.Y.; Zieve, J.J.; Martínez-García, P.J.; et al. Unique Features of the Loblolly Pine (Pinus taeda L.) Megagenome Revealed Through Sequence Annotation. Genetics 2014, 196, 891–909. [Google Scholar] [CrossRef] [PubMed] [Green Version]
  21. Belyayev, A.; Kalendar, R.; Brodsky, L.; Nevo, E.; Schulman, A.H.; Raskina, O. Transposable elements in a marginal plant population: Temporal fluctuations provide new insights into genome evolution of wild diploid wheat. Mob. DNA 2010, 1, 6. [Google Scholar] [CrossRef] [Green Version]
  22. Grandbastien, M.-A.; Audeon, C.; Bonnivard, E.; Casacuberta, J.; Chalhoub, B.; Costa, A.-P.; Le, Q.; Melayah, D.; Petit, M.; Poncet, C.; et al. Stress activation and genomic impact of Tnt1 retrotransposons in Solanaceae. Cytogenet. Genome Res. 2005, 110, 229–241. [Google Scholar] [CrossRef]
  23. Kidwell, M.G.; Lisch, D. Transposons unbound. Nature 1998, 393, 22–23. [Google Scholar] [CrossRef] [PubMed]
  24. Kidwell, M.G.; Lisch, D.R. Transposable elements and host genome evolution. Trends Ecol. Evol. 2000, 15, 95–99. [Google Scholar] [CrossRef]
  25. Kumar, A.; Bennetzen, J.L. Plant Retrotransposons. Annu. Rev. Genet. 1999, 33, 479–532. [Google Scholar] [CrossRef] [PubMed] [Green Version]
  26. Kunze, R.; Saedler, H.; Lonnig, W. Plant Transposable Elements. Adv. Bot. Res. 1997, 27, 331–470. [Google Scholar] [CrossRef]
  27. Schwilk, D.W.; Ackerly, D.D. Flammability and serotiny as strategies: Correlated evolution in pines. Oikos 2001, 94, 326–336. [Google Scholar] [CrossRef] [Green Version]
  28. Kellogg, E.A.; Bennetzen, J.L. The evolution of nuclear genome structure in seed plants. Am. J. Bot. 2004, 91, 1709–1725. [Google Scholar] [CrossRef] [Green Version]
  29. Ugarković, Ð.; Plohl, M. Variation in satellite DNA profiles—Causes and effects. EMBO J. 2002, 21, 5955–5959. [Google Scholar] [CrossRef] [Green Version]
  30. Ugarković, D. Satellite DNA Libraries and Centromere Evolution. Open Evol. J. 2008, 2, 1–6. [Google Scholar] [CrossRef] [Green Version]
  31. Bolger, A.M.; Lohse, M.; Usadel, B. Trimmomatic: A flexible trimmer for Illumina sequence data. Bioinformatics 2014, 30, 2114–2120. [Google Scholar] [CrossRef] [Green Version]
  32. Bao, W.; Kojima, K.K.; Kohany, O. Repbase Update, a database of repetitive elements in eukaryotic genomes. Mob. DNA 2015, 6, 1–6. [Google Scholar] [CrossRef] [Green Version]
  33. Langmead, B.; Salzberg, S. Fast gapped-read alignment with Bowtie 2. Nat. Methods 2012, 9, 357–359. [Google Scholar] [CrossRef] [PubMed] [Green Version]
  34. Li, K.; Zhang, S.; Song, X.; Weyrich, A.; Wang, Y.; Liu, X.; Wan, N.; Liu, J.; Lövy, M.; Cui, H.; et al. Genome evolution of blind subterranean mole rats: Adaptive peripatric versus sympatric speciation. Proc. Natl. Acad. Sci. USA 2020, 117, 32499–32508. [Google Scholar] [CrossRef] [PubMed]
  35. Grabherr, M.G.; Haas, B.J.; Yassour, M.; Levin, J.Z.; Thompson, D.A.; Amit, I.; Adiconis, X.; Fan, L.; Raychowdhury, R.; Zeng, Q.; et al. Full-length transcriptome assembly from RNA-Seq data without a reference genome. Nat. Biotechnol. 2011, 29, 644–652. [Google Scholar] [CrossRef] [PubMed] [Green Version]
  36. Jolliffe, I.T.; Cadima, J. Principal component analysis: A review and recent developments. Philos. Trans. R. Soc. A Math. Phys. Eng. Sci. 2016, 374, 20150202. [Google Scholar] [CrossRef]
  37. Paradis, E.; Claude, J.; Strimmer, K. APE: Analyses of Phylogenetics and Evolution in R language. Bioinformatics 2004, 20, 289–290. [Google Scholar] [CrossRef] [Green Version]
  38. Lin, C.-P.; Huang, J.-P.; Wu, C.-S.; Hsu, C.-Y.; Chaw, S.-M. Comparative Chloroplast Genomics Reveals the Evolution of Pinaceae Genera and Subfamilies. Genome Biol. Evol. 2010, 2, 504–517. [Google Scholar] [CrossRef]
  39. Uddenberg, D.; Akhter, S.; Ramachandran, P.; Sundstrom, J.F.; Carlsbecker, A. Sequenced genomes and rapidly emerging technologies pave the way for conifer evolutionary developmental biology. Front. Plant Sci. 2015, 6, 1602. [Google Scholar] [CrossRef] [Green Version]
  40. Dodsworth, S.; Chase, M.W.; Kelly, L.J.; Leitch, I.J.; Macas, J.; Novak, P.; Piednoël, M.; Schneeweiss, H.; Leitch, A.R. Genomic Repeat Abundances Contain Phylogenetic Signal. Syst. Biol. 2015, 64, 112–126. [Google Scholar] [CrossRef] [Green Version]
  41. Won, H.; Renner, S.S. Dating Dispersal and Radiation in the Gymnosperm Gnetum (Gnetales)—Clock Calibration When Outgroup Relationships Are Uncertain. Syst. Biol. 2006, 55, 610–622. [Google Scholar] [CrossRef] [Green Version]
  42. De La Torre, A.R.; Li, Z.; Van De Peer, Y.; Ingvarsson, P. Contrasting Rates of Molecular Evolution and Patterns of Selection among Gymnosperms and Flowering Plants. Mol. Biol. Evol. 2017, 34, 1363–1377. [Google Scholar] [CrossRef] [Green Version]
  43. BLAST® Command Line Applications User Manual; National Center for Biotechnology Information: Bethesda, MD, USA, 2021. Available online: https://www.ncbi.nlm.nih.gov/books/NBK569850/ (accessed on 14 September 2021).
  44. Boratyn, G.M.; Camacho, C.; Cooper, P.; Coulouris, G.; Fong, A.; Ma, N.; Madden, T.L.; Matten, W.T.; McGinnis, S.D.; Merezhuk, Y.; et al. BLAST: A more efficient report with usability improvements. Nucleic Acids Res. 2013, 41, W29–W33. [Google Scholar] [CrossRef] [PubMed] [Green Version]
  45. Asaf, S.; Khan, A.L.; Khan, M.A.; Shahzad, R.; Lubna; Kang, S.M.; Al-Harrasi, A.; Al-Rawahi, A.; Lee, I.-J. Complete chloroplast genome sequence and comparative analysis of loblolly pine (Pinus taeda L.) with related species. PLoS ONE 2018, 13, e0192966. [Google Scholar] [CrossRef] [PubMed] [Green Version]
  46. Pyke, K.A. Plastid Division and Development. Plant Cell 1999, 11, 549–556. [Google Scholar] [CrossRef] [PubMed] [Green Version]
  47. Bioinformatics Bits and Bobs: Why You Should QC Your Reads and Your Assembly. Available online: http://grahametherington.blogspot.com/2014/09/why-you-should-qc-your-reads-and-your.html (accessed on 20 September 2021).
Figure 1. Schematic presentation of analysis of repetitive elements in conifer and Gnetum genomes.
Life 11 01234 g001
Figure 2. Known repetitive elements (RepBase and PIER) in conifers and Gnetum gnemon species. (A) PCA projection of samples based on log-abundances of known repeats from RepBase and PIER databases. Abundance for all repeats was calculated as per position average of counts of mapped reads. A repeat was filtered out from the table if its maximum abundance across samples was less than a threshold (150 reads). Points are samples, and colors indicate the plant species that the sample belongs to. (B) Projection of known RE on the PC1-PC2 plane. Dots on the graph represent repeats, and they are colored according to the species that this repeat is most represented in. For example, repeats colored in red have maximum abundance in samples of Gnetum gnemon. Positions of the repetitive elements on the PC plane show their association with plant species. (C) Abundance profiles of repeats that are most represented in Pinus species. Bars represent the average abundance of repeats most represented in Pinus species across all samples. Repeats with maximum abundance in Pinus taeda are colored in green, repeats with maximum abundance in Pinus sylvestris are colored in light green, and repeats with maximum abundance in Pinus sibirica are colored in olive green. Repeats that have maximum abundance in Pinus species are present in all other conifers. Pinus taeda and Pinus sibirica are interconnected by repeats: repeats with maximum abundance in Pinus taeda are also highly abundant in Pinus sylvestris samples. Additionally, repeats with maximum abundance in Pinus sylvestris are abundant in Pinus taeda samples. Pinus sibirica species is an outlier in genus Pinus and represents subgenus Strobus, unlike Pinus taeda and Pinus sylvestris, which belong to subgenus Pinus. (D) Abundance profiles of repeats most represented in Picea species. Bars represent the average abundance of repeats most represented in Picea species across all samples. Repeats with maximum abundance in Picea abies are colored in bright blue, repeats with maximum abundance in Picea glauca are colored in light blue. Association of Picea species by abundance of repeats: repeats with maximum abundance in Picea glauca are also highly abundant in Picea abies; however, repeats highly abundant in Picea abies species have much lower abundance in Picea glauca. (E) Abundance profiles of repeats that are most represented in Abies and Larix species. Bars represent the average abundance of repeats most represented in Abies and Larix across all samples. Repeats with maximum abundance in Abies sibirica are colored in dark blue, repeats with maximum abundance in Larix sibirica are colored in blue. Abies and Larix have species-specific repeats. (F) Abundance profiles of repeats most represented in Gnetum gnemon, Juniperus communis, and Taxus baccata species. Bars represent the average abundance of these repeats across all samples. Repeats with maximum abundance in Gnetum gnemon are colored in red, repeats with maximum abundance in Larix sibirica are colored in yellow, and repeats with maximum abundance in Taxus baccata are colored in orange. Gnetum, Juniperus, and Taxus have species-specific repeats. (G) Phylogenetic tree of studied species based on the abundance of known RE.
Life 11 01234 g002
Figure 3. Putative repetitive elements (kChains) in conifers and Gnetum species. (A) PCA projection of samples based on log-abundances of newly detected putative RE (kChains). Abundance for kChains was calculated as per position average of counts of mapped reads. A kChain was filtered out from the table, if its maximum abundance across samples was less than a threshold (665 reads). Points are samples, and colors indicate the plant species that the sample belongs to. (B) Projection of kChains on the PC1-PC2 plane. Dots on the graph represent kChains, and they are colored according to the species that this repeat is most represented in. For example, kChains colored in red have maximum abundance in samples of Gnetum gnemon. Positions of the kChains on the PC plane show their association with plant species. (C) Abundance profiles of kChains that are most represented in Pinus species. Bars represent the average abundance of kChains most represented in Pinus species across all samples. kChains with maximum abundance in Pinus taeda are colored in green, kChains with maximum abundance in Pinus sylvestris are colored in light green, kChains with maximum abundance in Pinus sibirica are colored in olive green. kChains that have maximum abundance in Pinus species are present in all other conifers. Pinus taeda and Pinus sibirica are interconnected by kChains. kChains with maximum abundance in Pinus taeda are also highly abundant in Pinus sylvestris samples. Additionally, kChains with maximum abundance in Pinus sylvestris are abundant in Pinus taeda samples. Pinus sibirica species is an outlier in genus Pinus according to the abundance of kChains. Indeed, Pinus sibirica belongs to subgenus Strobus, unlike Pinus taeda and Pinus sylvestris, which belong to subgenus Pinus. (D) Abundance profiles of kChains most represented in Picea species. Bars represent the average abundance of kChains most represented in Picea across all samples. kChains with maximum abundance in Picea abies are colored in bright blue, kChains with maximum abundance in Picea glauca are colored in light blue. Picea glauca and Picea abies were strongly linked by kChains, but not symmetrically; kChains of Picea glauca were of higher abundance in Picea abies than the other way around. (E) Abundance profiles of repeats that are most represented in Abies and Larix species. Bars represent the average abundance of repeats most represented in Abies and Larix species across all samples. Repeats with maximum abundance in Abies sibirica are colored in dark blue, repeats with maximum abundance in Larix sibirica are colored in blue. Larix sibirica and Abies sibirica species were found to have high-specificity kChains, kChains most abundant in Abies sibirica samples were not abundant in Larix sibirica, and vice versa. (F) Abundance profiles of kChains most represented in Gnetum gnemon, Juniperus communis, and Taxus baccata species. Bars represent the average abundance of these kChains across all samples. kChains with maximum abundance in Gnetum gnemon are colored in red, kChains with maximum abundance in Larix sibirica are colored in yellow, and kChains with maximum abundance in Taxus baccata are colored in orange. Gnetum, Juniperus, and Taxus have species-specific kChains. (G) Phylogenetic tree of studied species based on the abundance of kChains.
Life 11 01234 g003
Figure 4. Putative repetitive elements (kChains) aligning to cpDNA assemblies. (A) PCA projection of samples based on log-abundances of cpDNA-kChains. Points are samples, and colors indicate the plant species that the sample belongs to. (B) Projection of cpDNA-kChains on the PC1-PC2 plane. Dots on the graph represent cpDNA-kChains, and they are colored according to their maximum abundance. For example, kChains colored in red have maximum abundance in samples of Gnetum gnemon. Positions of the kChains on the PC plane show their association with plant species. (C) Abundance profiles of cpDNA-kChains that have maximum abundance in Pinus species. cpDNA-kChains with maximum abundance in Pinus taeda are colored in green, cpDNA-kChains with maximum abundance in Pinus sylvestris are colored in light green, and cpDNA-kChains with maximum abundance in Pinus sibirica are colored in olive green. cpDNA-kChains that have maximum abundance in Pinus species are present in all other conifers. Pinus taeda and Pinus sibirica are linked by high abundance cpDNA-kChains: cpDNA-kChains with maximum abundance in Pinus taeda also very abundant in Pinus sylvestris samples. Additionally, cpDNA-kChains with maximum abundance in Pinus sylvestris are highly abundant in Pinus taeda samples. Pinus sibirica species is an outlier in Pinus genera. (D) Abundance profiles of cpDNA-kChains that have maximum abundance in Picea species. cpDNA-kChains with maximum abundance in Picea abies are colored in bright blue, cpDNA-kChains with maximum abundance in Picea glauca are colored in light blue. Association of Picea species by abundance of cpDNA-kChains: cpDNA-kChains with maximum abundance in Picea glauca are also highly abundant in Picea abies, however cpDNA-kChains with maximum abundance in Picea abies have much lower abundance in Picea glauca. (E) Abundance profiles of cpDNA-kChains that have maximum abundance in Abies and Larix species. cpDNA-kChains with maximum abundance in Abies sibirica are colored in dark blue, cpDNA-kChains with maximum abundance in Larix sibirica are colored in blue. Abies and Larix have species-specific kChains. (F) Abundance profiles of cpDNA-kChains that have maximum abundance in Gnetum gnemon, Juniperus communis, and Taxus baccata species. cpDNA-kChains with maximum abundance in Gnetum gnemon are colored in red, cpDNA-kChains with maximum abundance in Larix sibirica are colored in yellow. cpDNA-kChains with maximum abundance in Taxus baccata are colored in orange. Gnetum, Juniperus, and Taxus have species-specific kChains. (G) Phylogenetic tree of studied species based on the abundance of chloroplast putative RE (cpDNA-kChains).
Life 11 01234 g004
Publisher’s Note: MDPI stays neutral with regard to jurisdictional claims in published maps and institutional affiliations.

