Article

Microbial Surface Biofilm Responds to the Growth-Reproduction-Senescence Cycle of the Dominant Coral Reef Macroalgae Sargassum spp.

1
Centre for Microbiology and Environmental Systems Science, Division of Microbial Ecology, University of Vienna, 1030 Vienna, Austria
2
CCMAR-Centre of Marine Sciences, CIMAR, University of Algarve, 8005-139 Faro, Portugal
3
Australian Institute of Marine Science, Townsville 4810, Australia
4
College of Science and Engineering, James Cook University, Townsville 4811, Australia
5
Australian Centre for Ecogenomics, University of Queensland, Brisbane 4072, Australia
6
Australian Antarctic Division, Hobart 7050, Australia
7
Zoological Department III, Natural History Museum Vienna, 1010 Vienna, Austria
*
Author to whom correspondence should be addressed.
These authors contributed equally to this work.
Life 2021, 11(11), 1199; https://doi.org/10.3390/life11111199
Submission received: 24 September 2021 / Revised: 1 November 2021 / Accepted: 2 November 2021 / Published: 6 November 2021
(This article belongs to the Special Issue The Environmental Microbiome and Its Interactions)

Abstract

:
Macroalgae play an intricate role in microbial-mediated coral reef degradation processes due to the release of dissolved nutrients. However, temporal variabilities of macroalgal surface biofilms and their implication on the wider reef system remain poorly characterized. Here, we study the microbial biofilm of the dominant reef macroalgae Sargassum over a period of one year at an inshore Great Barrier Reef site (Magnetic Island, Australia). Monthly sampling of the Sargassum biofilm links the temporal taxonomic and putative functional metabolic microbiome changes, examined using 16S rRNA gene amplicon and metagenomic sequencing, to the pronounced growth-reproduction-senescence cycle of the host. Overall, the macroalgal biofilm was dominated by the heterotrophic phyla Firmicutes (35% ± 5.9% SD) and Bacteroidetes (12% ± 0.6% SD); their relative abundance ratio shifted significantly along the annual growth-reproduction-senescence cycle of Sargassum. For example, Firmicutes were 1.7 to 3.9 times more abundant during host growth and reproduction cycles than Bacteroidetes. Both phyla varied in their carbohydrate degradation capabilities; hence, temporal fluctuations in the carbohydrate availability are potentially linked to the observed shift. Dominant heterotrophic macroalgal biofilm members, such as Firmicutes and Bacteroidetes, are implicated in exacerbating or ameliorating the release of dissolved nutrients into the ambient environment, though their contribution to microbial-mediated reef degradation processes remains to be determined.

1. Introduction

A consistent feature of many degraded coral reefs is the shift from a coral- to an algal-dominated benthos [1,2,3], which is also associated with a dramatic reduction in coral biodiversity and loss of reef ecosystem resilience [4,5]. Corals and algae, as primary producers in coral reefs, exudate dissolved organic carbon (DOC) into the ambient seawater, which goes on to support microbial life [6,7,8]. Microbes play a fundamental role in the underlying mechanism of spatial competition between algae and corals on the reef benthos [6,7,9,10]. However, the quantity of DOC released by turf and macroalgae is significantly higher and compositionally different than that released by corals, consequently generating an excess amount of algal-derived DOC [6,9]. Algal-derived DOC stimulates an increase in the planktonic microbial biomass and energy usage through the growth of copiotrophic microbes [8,9,11], which in return can lead to an increase in coral mortality [6,7,12,13]. This microbe-mediated coral mortality frees space on the reef benthos, facilitating further algal growth [9]. This positive feedback loop of DOC, disease, algae and microbes is referred to as the DDAM loop [9,10]. While the interplay between macroalgae proliferation and the microbialization of coral reef seawater is well understood, less is known about the compositional and functional dynamics of the macroalgal-associated microbial biofilm and its interrelations to changes in the reef ecosystem.
Macroalgal health, nutrition, and development are strongly linked to its associated microbiome [14,15], with the host and its microbial partners forming a tightly coupled holobiont [16,17]. A variety of bacteria, archaea, viruses, and eukaryotic microorganisms such as microalgae, protozoa and fungi comprise the algal holobiont [18]. Host-associated microbial biofilms act as an interface between the host and the ambient environment and thus are responsible for the exchange of energy, nutrients and metabolites [15]. Bacteria associated with macroalgal biofilms modulate key functions such as protection against pathogens, nutrient provisioning, morphogenesis, reproduction, and zoospore settlement [18,19,20,21,22]. In return, the algal hosts provide their bacteria with an oxic environment, a habitable substrate, and nutrition [23,24]. Due to the unique position of macroalgal biofilms on the interface of the host with its surrounding environment, they can provide valuable information regarding the health of benthic macroalgae and external environmental conditions [18,25]. Hence, it is important to understand how the macroalgal-associated microbiome varies throughout the life stages of the host and in response to environmental fluctuations.
Algal-associated microbial communities vary over time, space, and among macroalgal host species [14,26,27,28,29]. Abiotic factors such as light availability, wave energy, nutrient concentrations, and temperature can alter macroalgal bacterial biofilm community composition in temperate and subtropical regions [29,30,31,32]. For example, external nitrogen deficiency stress in Sargassum horneri was correlated with a dominance of microbes performing nitrogen transporting functions compared to unaffected S. horneri [24]. However, the effects of increased environmental stressors related to a warming climate on the macroalgae’s relationship with its associated microbiome remain uncertain [18].
Sargassum, a canopy-forming brown algae, is a vital primary producer and ecosystem engineer [14]. Similar to other macroalgae, Sargassum provides structure to the benthos and food for organisms across multiple trophic levels [33]. However, high-density blooms of macroalgae can negatively impact coral larval recruitment and metamorphosis, juvenile coral growth and survival, and coral health [2,34,35,36] through direct factors such as shading, abrasion, and space occupation [37,38]. Macroalgae have also been implicated as potential vectors for the increase in disease-associated microbes in corals [13,39,40]. On Australia’s Great Barrier Reef (GBR), some highly seasonal Sargassum species dominate inshore reef habitats [41,42,43], with their growth, reproduction and senescence tightly linked to changes in seawater temperature [44]. For example, at macroalgae-dominated inshore GBR locations, Sargassum grows rapidly from October to February and reaches its peak biomass at around April [43,45,46]. At Magnetic Island (our study site), in the Central GBR, the highest densities of reproductive Sargassum thalli have previously been observed between January and April; hence, the reproductive phase coincides with the peak in biomass [47]. In late May to June, Sargassum undergoes senescence and annual tissues start to degenerate, while the remaining thalli can be heavily epiphytized [44,47,48]. In August, the peak of austral winter, the Sargassum biomass is reduced to its minimum [43,45,49].
In this study, we investigate the taxonomic and functional dynamics of the surface biofilm microbiome of the macroalgae Sargassum spp. (including ‘stem’, blades, and vesicles) over a period of one year to cover the entire annual growth-reproduction-senescence cycle. Furthermore, potential links between shifts in the bacterial community composition (using 16S rRNA gene amplicon sequencing) and fluctuations in abiotic environmental parameters (measured in situ) are analyzed using an array of multivariate statistical approaches. The underlying functions of keystone bacterial taxa are further assessed using comparative metagenomics.

2. Materials and Methods

2.1. Sample Collection and Processing

The samples were collected as part of the Australian Microbiome Initiative and the sample procedure and preparation has previously been outlined in Glasl et al. [50,51]. In brief, macroalgae samples along with environmental metadata (including sediment and seawater data) were collected at 10 time points distributed over one year (in 2016, samples were collected in February, March, April, June, August, October, November, and December; in 2017, samples were collected in February and March) at Geoffrey Bay, Magnetic Island (Great Barrier Reef, Queensland, Australia).
At least four highly similar Sargassum species with identical life-cycle patterns have been described to occur on the reefs surrounding Magnetic Island [47]. Macroalgae samples have been identified to genus level; thus, we are referring to the samples as Sargassum spp. ‘Stem’, blades, and vesicles of Sargassum spp. were sampled at 3 m depth using sterile scalpel blades, rinsed with 0.2 µm filter-sterilized seawater to remove loosely attached microbes, snap frozen in liquid nitrogen, and stored at −80 °C. The Sargassum spp. biofilm was subsequently removed from the macroalgal tissue by overnight incubation at 200 rpm in 10 mL 1× PBS at 37 °C and the suspended biofilm was pelleted by a 10 min centrifugation at 16,000 rcf at 4 °C. The biofilm pellet was used for DNA extractions following the manufacturer’s instructions using the DNeasy PowerSoil kit (QIAGEN).
Seawater samples for environmental metadata were collected with a diver-operated Niskin bottle at 2 m depth. The abiotic seawater metadata included: dissolved inorganic nutrients (ammonium, nitrate, phosphate), total suspended solids (TSS), chlorophyll a concentration (Chla), salinity, particulate nitrogen (PN), total nitrogen (TN), non-purgeable organic carbon (NPOC), non-purgeable inorganic carbon (NPIC), and silica. A 100 mL glass jar was used for sediment collection at 2 m depth. Total organic carbon (TOC) and grain size distribution was determined for the sediment samples. Environmental metadata were analyzed following the standardized procedures by the Australian Institute of Marine Science (AIMS) [52]. Seawater temperatures were extracted from AIMS long-term monitoring temperature records (https://data.aims.gov.au/). All samples were collected under the permit G16/38348.1 issued by the Great Barrier Reef Marine Park Authority.

2.2. 16S rRNA Gene Sequencing Data

All Sargassum spp. biofilm DNA extracts (n = 3 samples per sampling event, total of 30 samples) were used for 16S rRNA gene amplicon sequencing. The sequencing data were previously included as part of a large-scale reef ecosystem analysis and a detailed description of the read processing has been outlined in Glasl et al. [50]. In brief, bacterial 16S rRNA gene amplicon sequencing of an approximately 500 bp segment of the hypervariable region V1-V3 was conducted at the Ramaciotti Centre for Genomics (Sydney, Australia). Following the standard operational procedures of the Australian Microbiome Initiative (https://www.australianmicrobiome.com), the bacterial 16S rRNA gene was sequenced using the 27F [53] and 519R [54] primers on the Illumina MiSeq platform following a dual index 2 × 300 bp paired-end approach. The 16S rRNA gene sequencing data were analyzed as zero-radius operational taxonomic units (zOTU) following the standardized analysis platform of the Australian Microbiome Initiative [50,55]. In brief, paired-end reads were merged using FLASH software [56] and FASTA formatted sequences were extracted from FASTQ files. Sequences < 400 bp in length, and/or containing one or more Ns, or homopolymer runs of >8 bp were removed with MOTHUR v1.34.1 [57]. Using USEARCH 64 bit v10.0.240 [58], sequences were de-replicated, ordered by abundance and sequences with less than four representatives and Chimeras were removed. The quality-controlled sequences were mapped to zOTUs. A zOTU table containing samples and read abundances was created. The taxonomy of zOTUs was classified with the SILVA v132 database [59] using MOTHUR’s implementation of the Wang classifier [60] and a 60% Bayesian probability cut-off. Chloroplast- and mitochondria-derived reads were removed from the final dataset.
Raw amplicon sequencing data, zOTU tables, and metadata are freely available at the Bioplatforms Australia data portal under the Australia Microbiome Initiative (https://data.bioplatforms.com/organization/about/australian-microbiome). Full usage requires free registration. To search for the 16S rRNA sequencing data, navigate to ‘Processed data’, select ‘Amplicon is 27f519r_bacteria’ and ‘Environment is Marine’. To search for Sargassum spp. samples, add an additional contextual filter, select ‘Sample Site Location Description’ from the dropdown menu and search for ‘Geoffrey Bay’ and ‘Sample Type is Seaweed’.

2.3. Metagenome-Assembled Genomes (MAGs)

A subset of the DNA extracts (n = 6, collected in August 2016 and February 2017, the peaks of winter and summer, respectively) were sent for metagenome sequencing to the Australian Genome Research Facility (AGRF, Melbourne, Australia). Metagenome sequencing, assembly, and binning has been described in detail in Glasl et al. [51]. Briefly, libraries for metagenome sequencing were prepared with the Nextera Library Preparation Kit (Illumina) and sequenced on a HiSeq 2500 in rapid run mode with 250 bp paired-end reads. Quality controlled metagenome reads were used to generate MAGs with uniteM v0.0.15 (https://github.com/dparks1134/UniteM). The taxonomy of the retrieved MAGs was assigned using GTDBtk v0.2.1 (https://github.com/Ecogenomics/GTDBTk) and functional annotation was performed with enrichM v0.4.7 (https://github.com/geronimp/enrichM) using the Kyoto Encyclopedia of Genes and Genomes Orthology (KEGG; KOs) as well as the Carbohydrate Active enzyme (CAZy) database (Figures S1 and S2). The presence of KOs in each MAG was assessed for carbohydrate metabolism (i.e., central carbohydrate metabolism) and energy metabolism (i.e., carbon fixation, nitrogen metabolism, and sulfur metabolism). Furthermore, using the CAZy database, each MAG was screened for the presence of Glycoside Hydrolases (GH), Glycosyl Transferases (GT), Polysaccharide Lyases (PL), and Carbohydrate Esterases (CE). The 20 high-quality MAGs can be retrieved from the NCBI BioProject PRJNA594068.

2.4. Statistical Analyses of Microbial Community Composition

The 16S rRNA gene sequence data were rarefied to the minimum number of reads per sample (6800). The rarefied dataset was used for the statistical analyses with the exception of the DESeq2 analysis [61], where non-rarefied count data were used. Relative abundance data were used to generate the bubble plot and correlograms. Statistical analyses were performed in R [62] using phyloseq [63], vegan [64], DESeq2 [61], ggbiplot available online: http://github.com/vqv/ggbiplot, GGally available online: https://github.com/ggobi/ggally, microbiomeSeq available online: https://github.com/umerijaz/microbiomeSeq, and graphical package ggplot2 [65] unless otherwise stated.
To analyze variations in microbial community composition along the annual growth-reproduction-senescence cycle of Sargassum spp., samples were grouped based on their sampling date into the following three life stages: (i) ‘growth’ (October-December), (ii) ‘reproduction’ (February-April), and (iii) ‘senescence’ (June-August). Grouping was based on previously published studies on the life cycle stages of Sargassum spp. in close proximity to the study site [43,45,46,47] and was further confirmed by personal observations.
Three alpha diversity indices were calculated for this study: Shannon index, Chao1 and Observed zOTUs. zOTUs with one count (singletons) were kept for alpha diversity analysis but were removed for subsequent analyses. A Venn diagram, using singleton-depleted count data, was generated and represents the unique, shared, and ubiquitous zOTUs among the three life stages (‘growth’, ‘reproduction’, and ‘senescence’). The beta diversity was assessed using non-metric multidimensional scaling (nMDS) based on binary Bray–Curtis dissimilarity matrices. Differences in the microbial community composition among life stages (i.e., ‘growth’, ‘reproduction’, and ‘senescence’) were further assessed using a permutational multivariate analysis of variance (PERMANOVA). Heterogeneity in sample dispersions among the three life stages was tested using a permutational analysis of multivariate dispersion (PERMDISP). Significance values (p-values) of PERMANOVA and PERMDISP were computed with 1000 permutations and adjusted with the Bonferroni method. Normality and homogeneity of variances for alpha diversity measures and the environmental parameters were tested using quantile and density distribution plots in conjunction with the Shapiro–Wilks test. Alpha diversity measures required inverse and square root transformations. Environmental metadata only required an inverse transformation. Parametric or non-parametric methods were implemented accordingly. The relationship of sampling time points and environmental parameters was assessed with principal component analysis (PCA) based on Euclidean distances. A correlogram generated with GGally was plotted to identify and remove collinear variables. Variables with a Pearson correlation lower than −0.7 or higher than 0.7 were removed from subsequent analysis and environmental parameters were scaled to account for their varying units.
A distance-based redundancy analysis (db-RDA) followed by a variation partitioning analysis was conducted to investigate the link between the biofilm community and the environmental parameters. The ordiR2step function of the vegan package was used to generate models based on the db-RDA. The fit of the models and the included environmental parameters was assessed with a one-way analysis of variance (ANOVA). Abiotic factors deemed relevant by the db-RDA were categorized into ‘high’ and ‘low’ based on their median values (cut-off values for temperature = 27 °C, NPOC = 1.33 mg/L, NH4+ = 0.22 µmol/L, and for TSS = 0.65 mg/L).
DESeq2 was used to identify zOTUs significantly (adjusted p-value ≤ 0.01) contributing to the observed shifts in the bacterial community of the Sargassum spp. biofilm between the ‘high’ vs. ‘low’ abiotic factor groupings. Spearman correlation coefficients were calculated using the microbiomeSeq package to link the most dominant taxa in Sargassum spp. biofilms to the relevant abiotic factors. Correlations were illustrated as heatmaps, and p-values were corrected for multiple comparisons using the Benjamini-Hochberg method.

3. Results

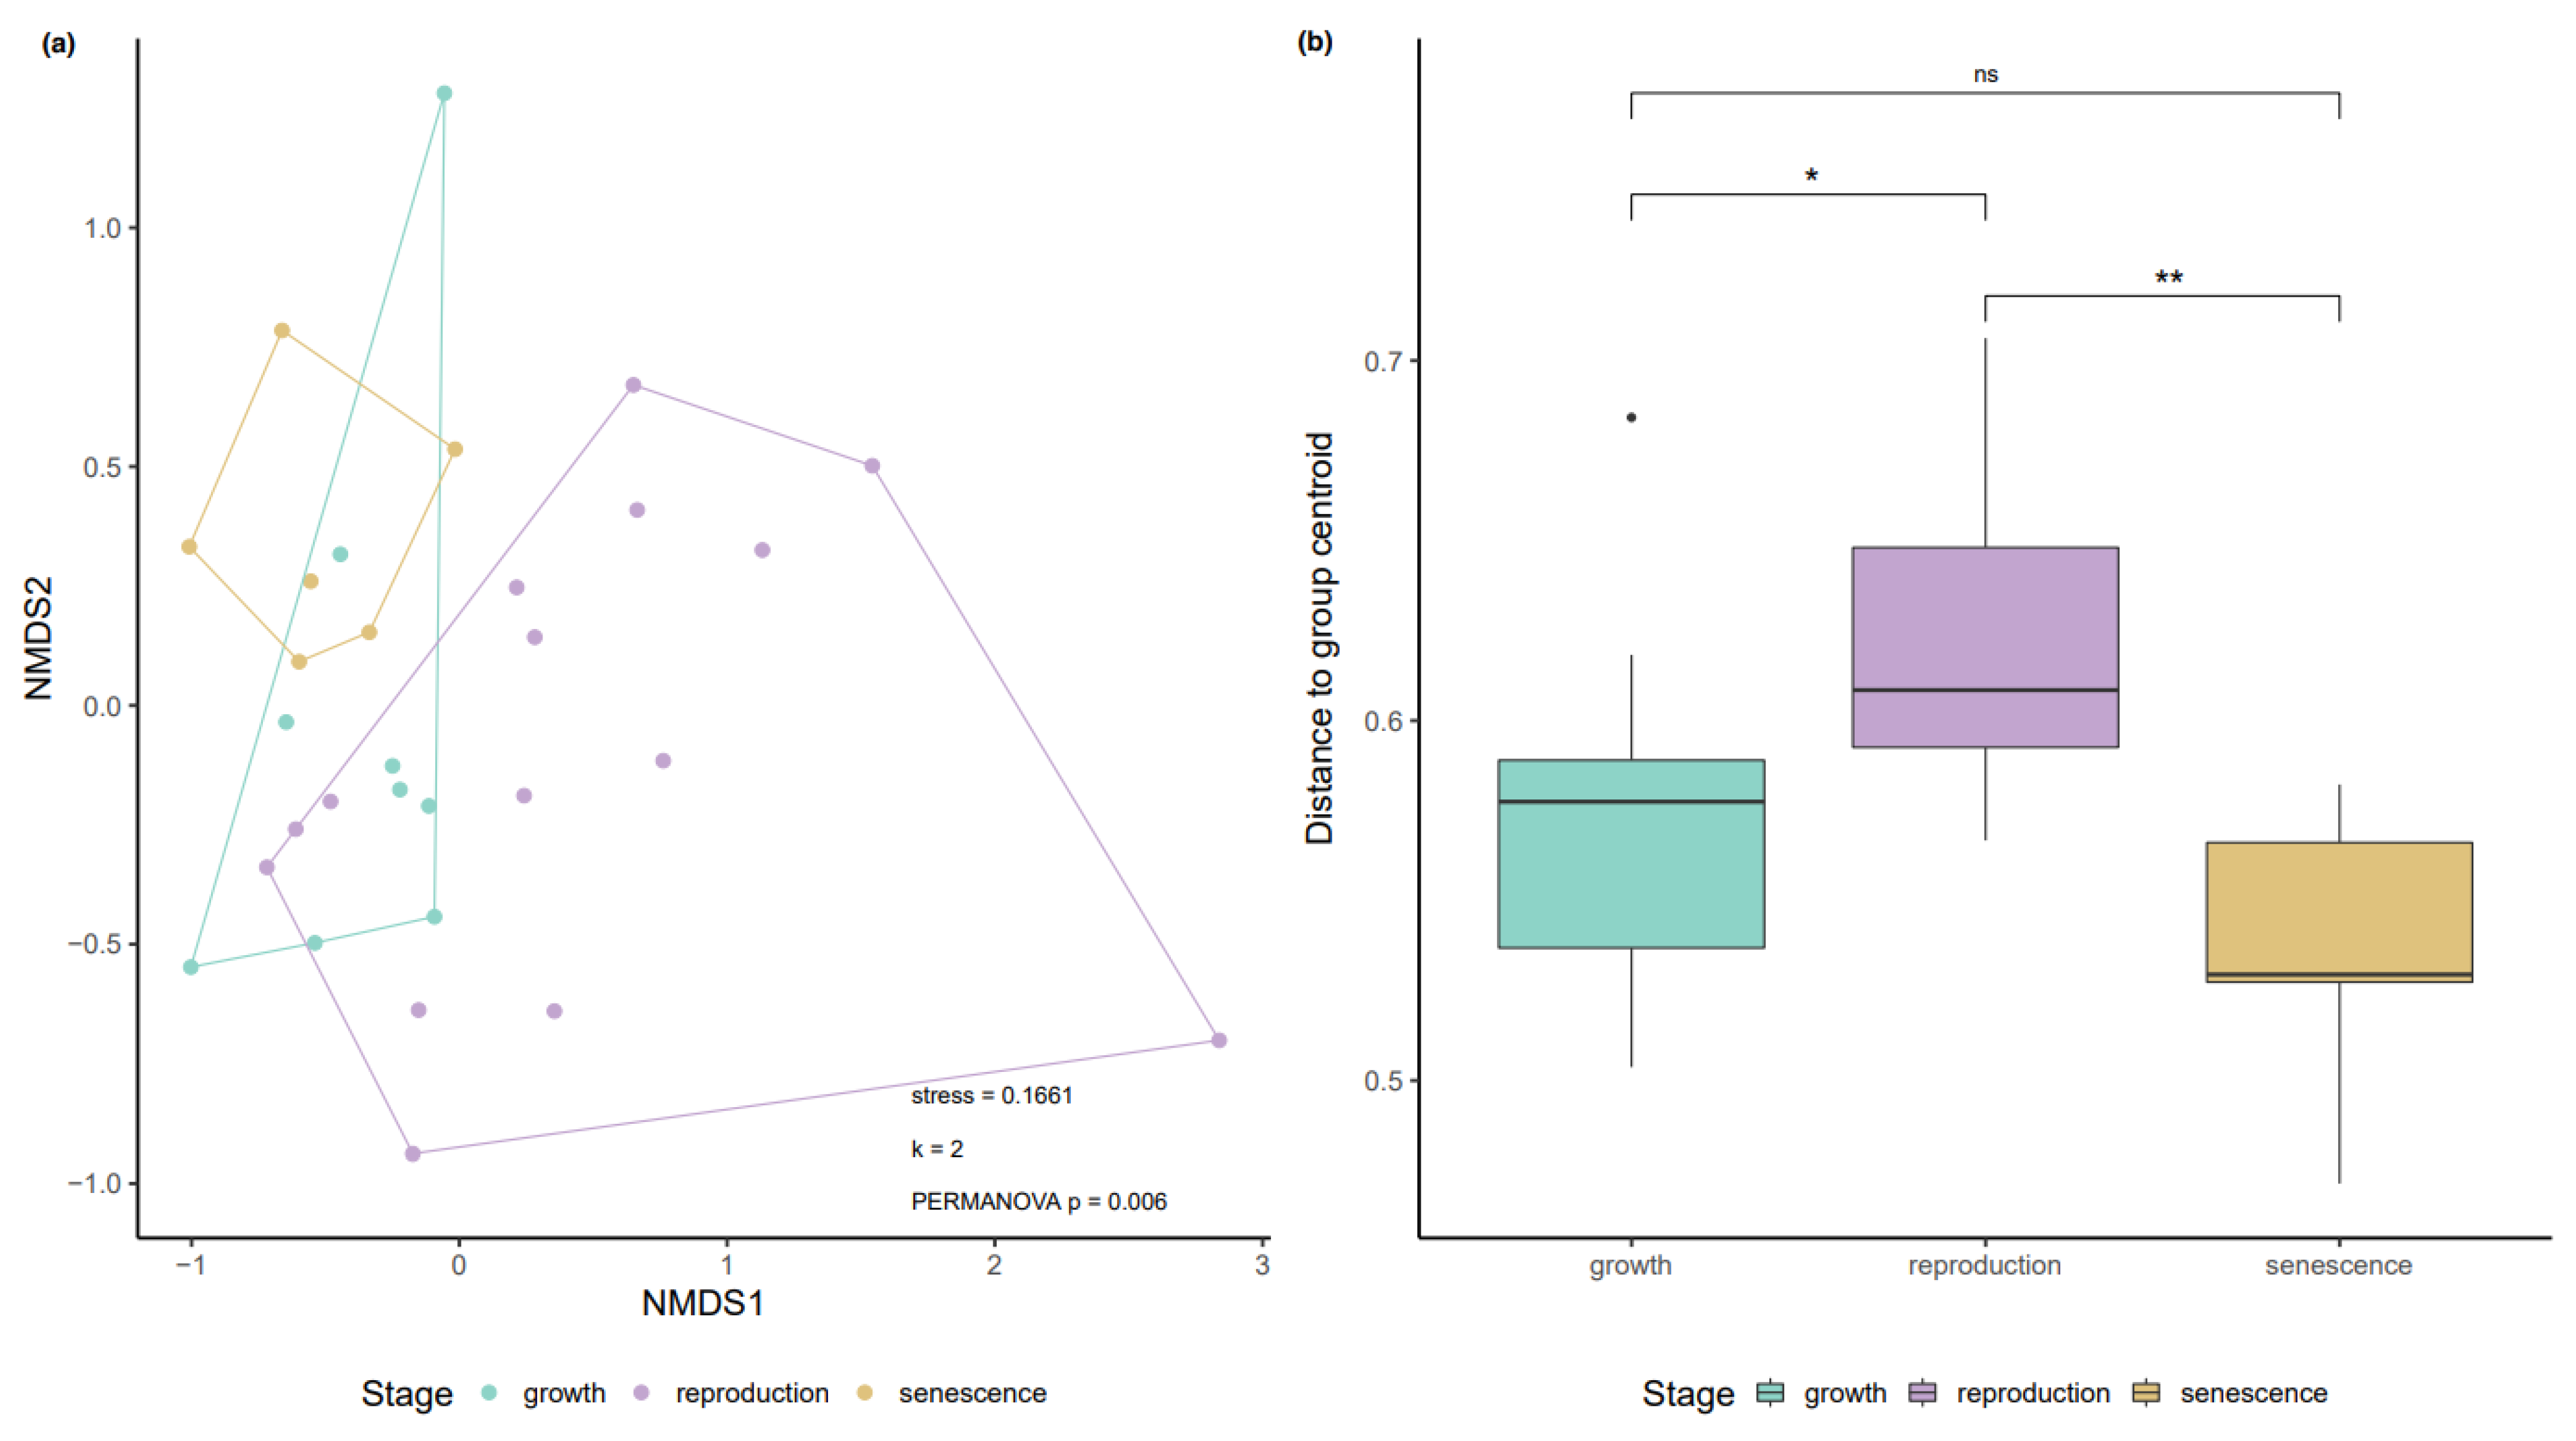
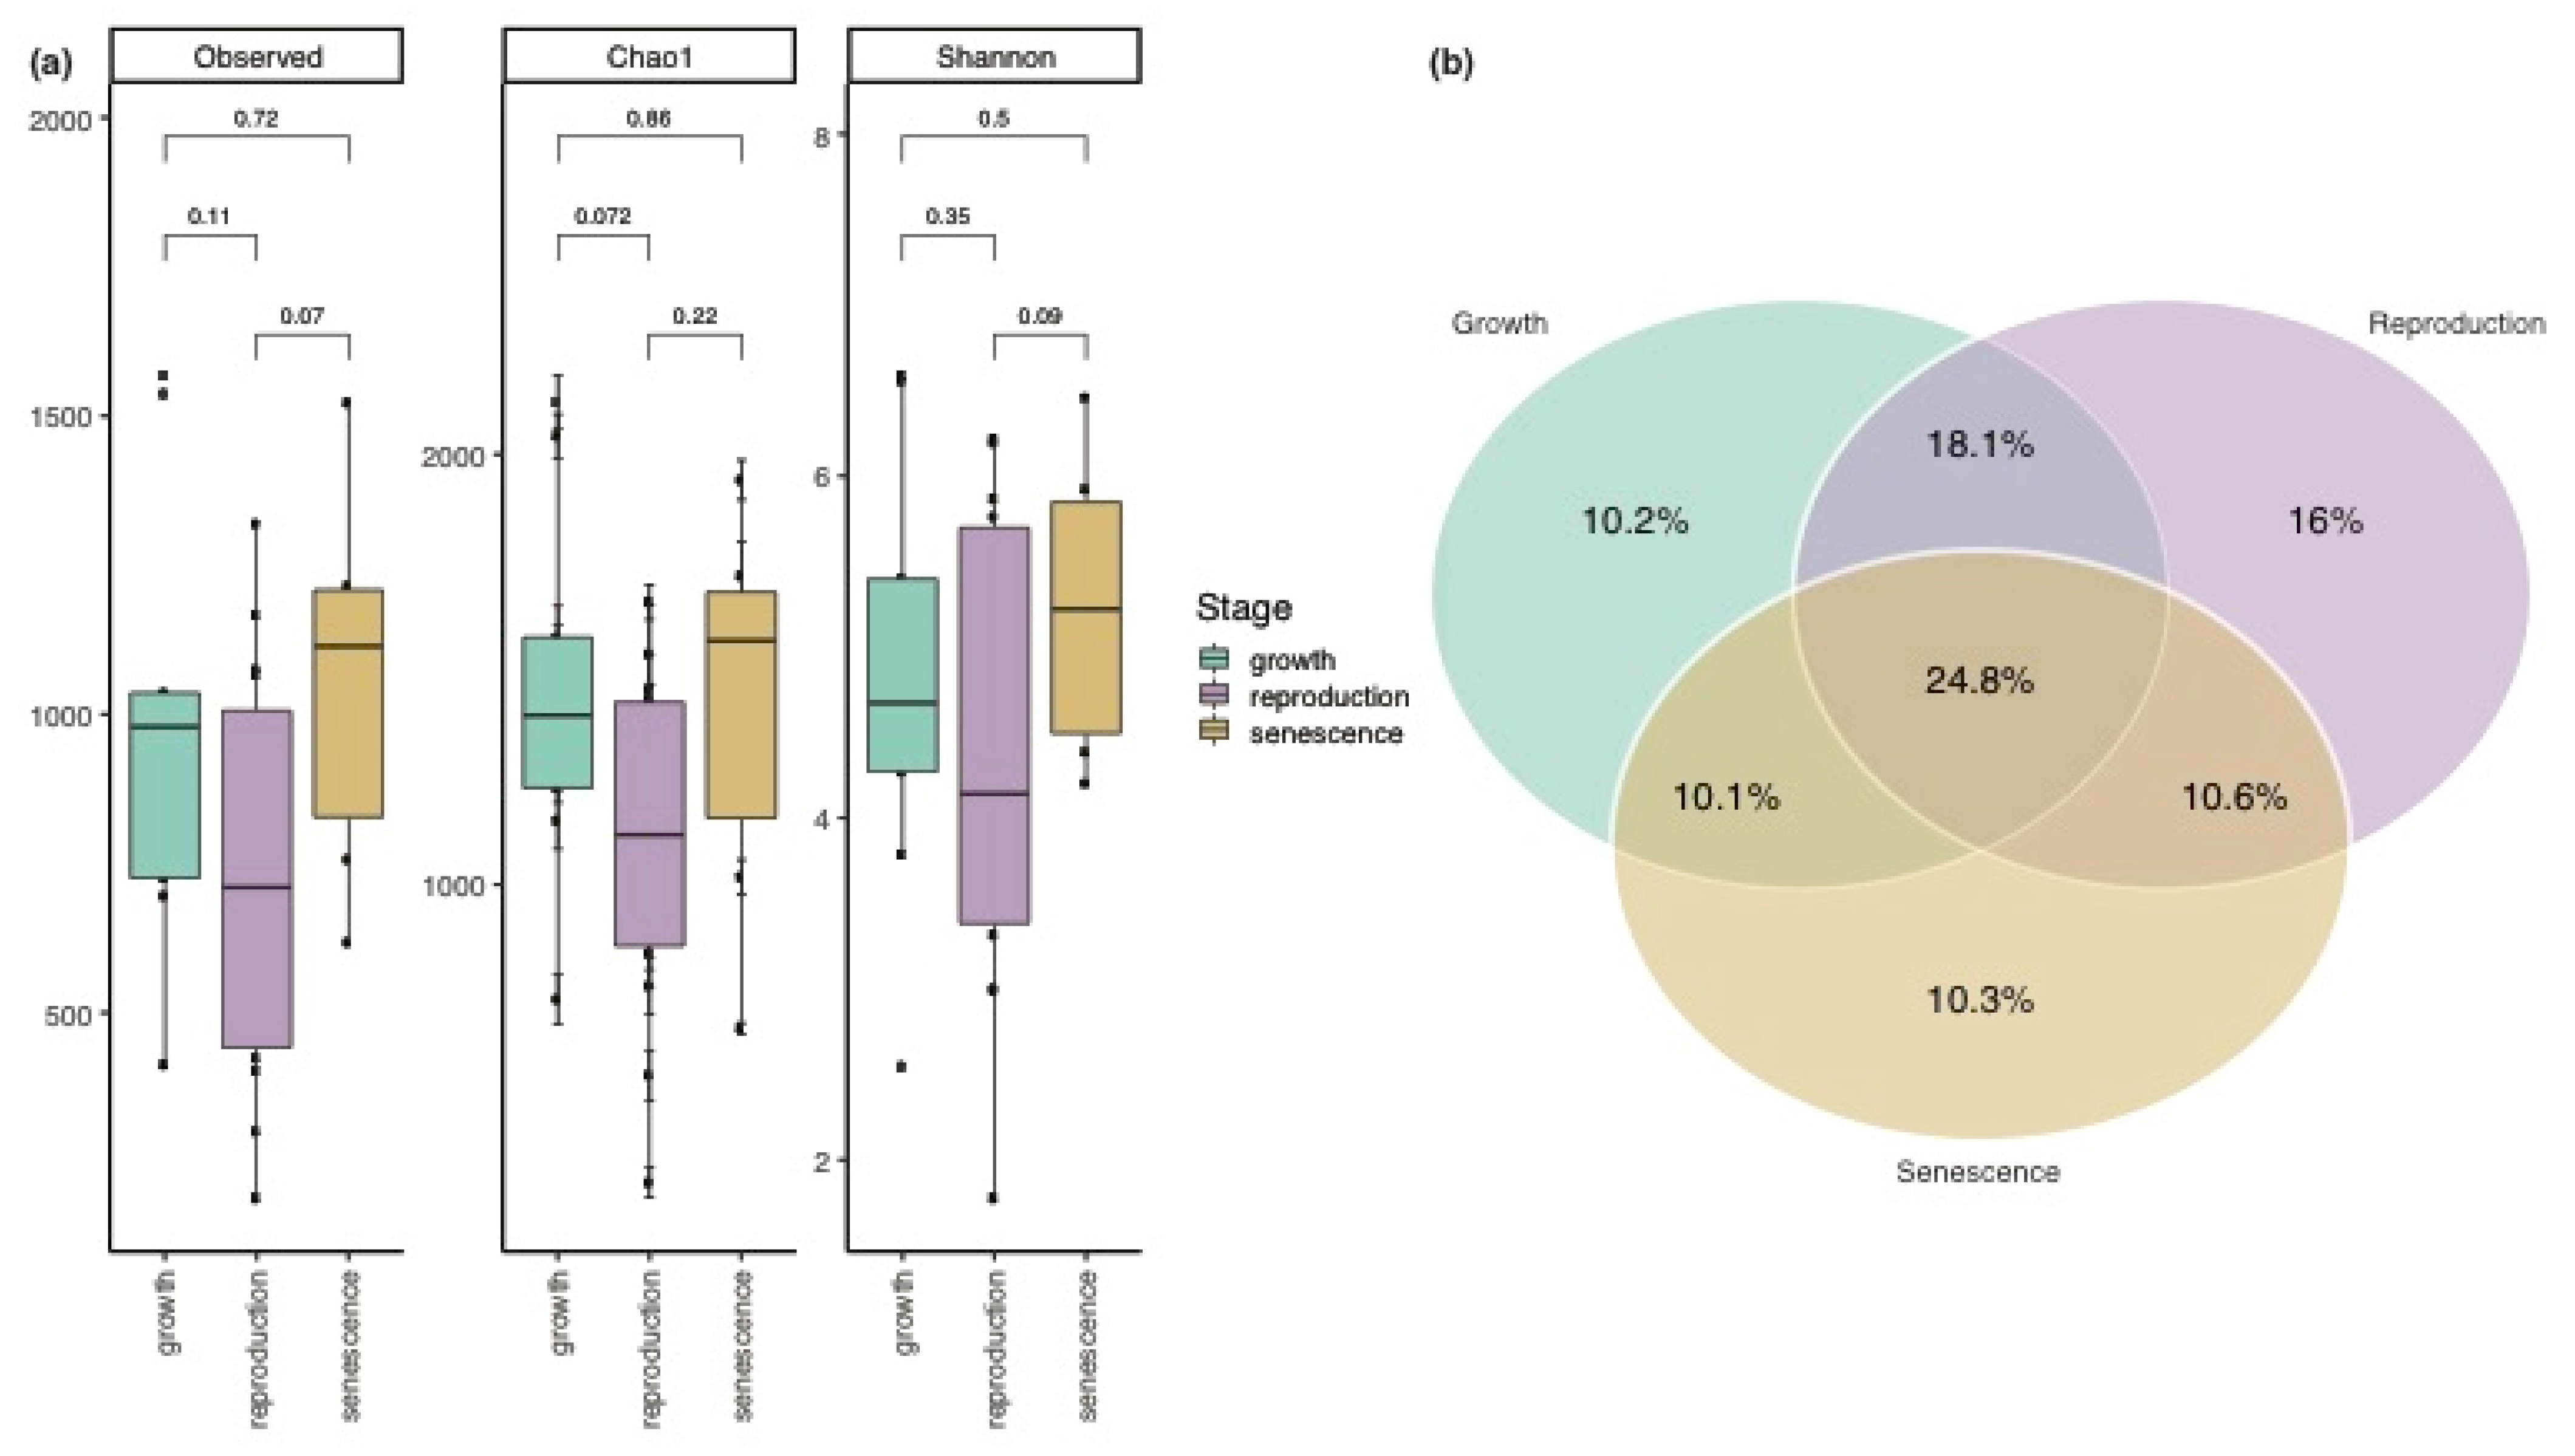
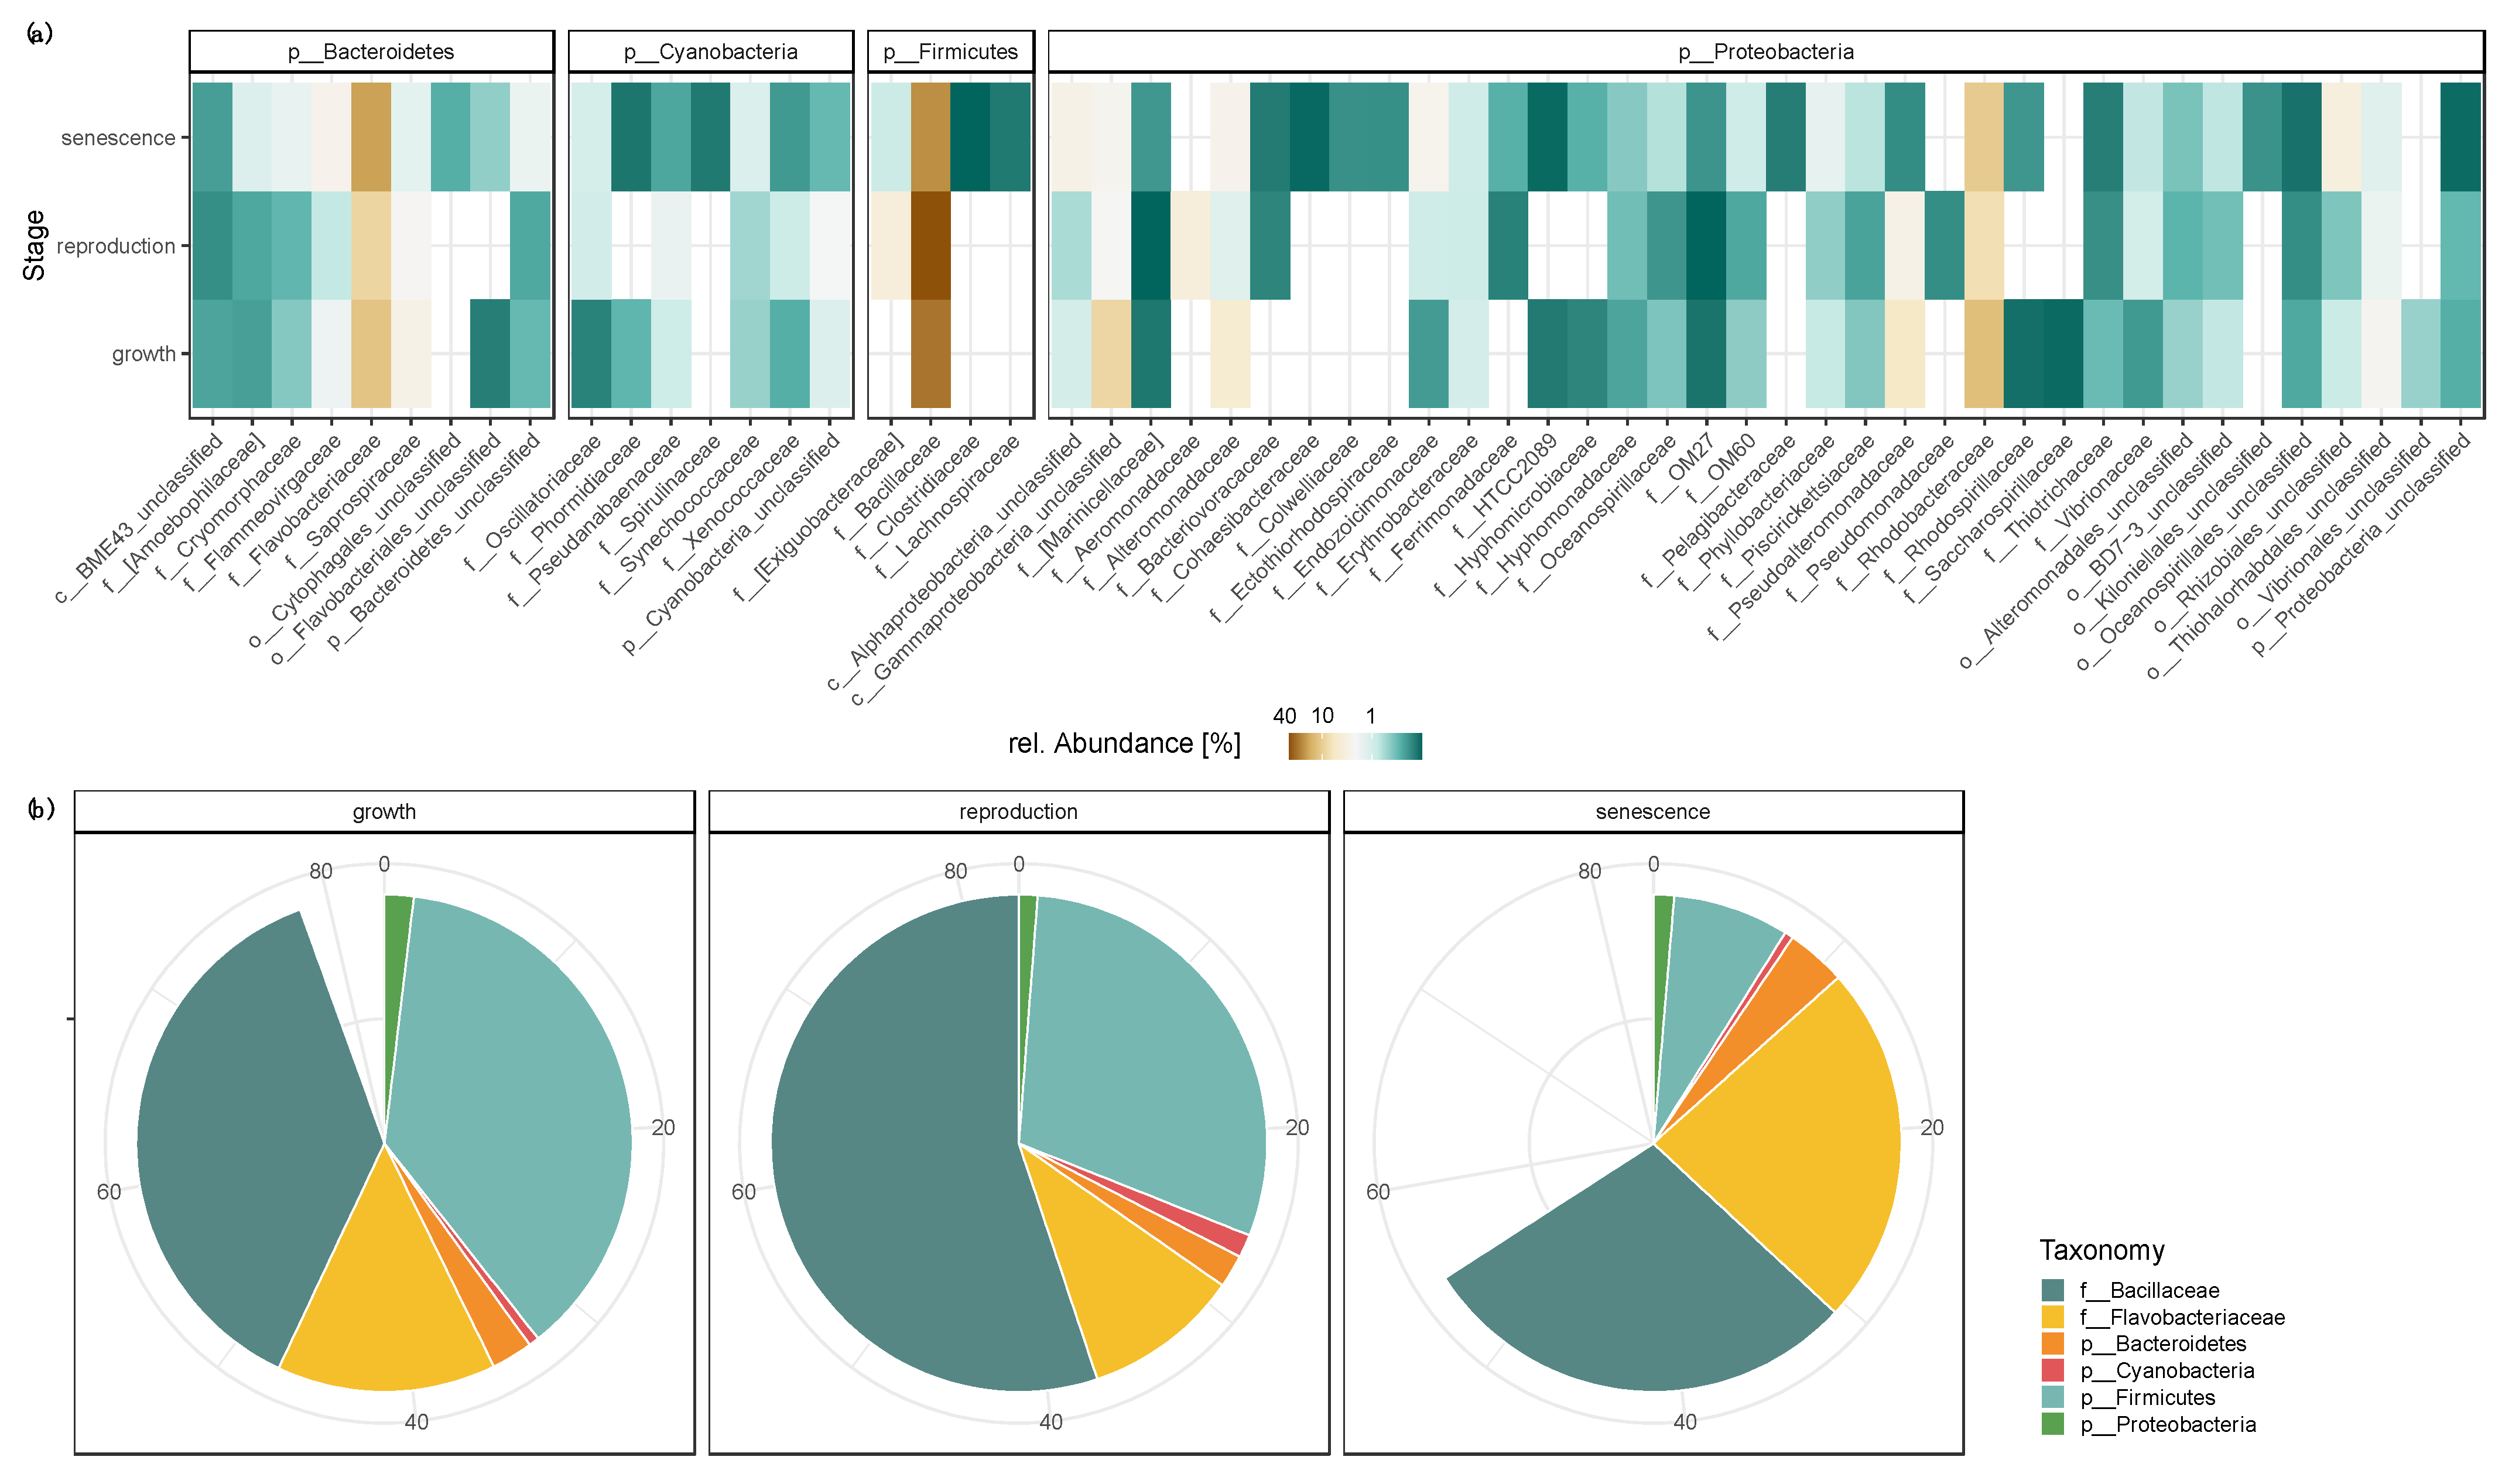
3.1. Variation in the Biofilm Community along the Growth-Reproduction-Senescence Cycle

A total of 201,818 reads were obtained for the 16S rRNA amplicon sequencing dataset of the 30 Sargassum spp. biofilm samples corresponding to 8483 zero-radius operational taxonomic units (zOTUs). Following the removal of singletons, a total of 6301 unique zOTUs remained. Alpha diversity estimates of the bacterial community associated with the Sargassum spp. biofilm remained stable throughout the three different life stages of Sargassum spp. (Figure 1a). However, the high number of unique zOTUs (total of 75.2%) associated with the three life stages suggests that the community composition changes along the annual growth-reproduction-senescence cycle. Only 24.8% of the zOTUs were present in at least one of the samples from all three life stages (Figure 1b). The ‘reproduction’ stage had the highest percentage (16%) of unique zOTUs, followed by almost identical abundances of unique zOTUs in the ‘growth’ (10.2%) and ‘senescence’ (10.3%) stage. non-metric multidimensional scaling (NMDS) indicates a shift in the microbial community structure along the annual growth-reproduction-senescence cycle, which was further supported by a permutational multivariate analysis of variance (PERMANOVA: F(2,27) = 1.554, p-value = 0.006, R2 = 0.103; Figure 2a). However, this result might have been affected by a significant variation in the sample dispersion (PERMDISP: F(2,27) = 8.309, p-value = 0.001). Biofilm samples from the ‘reproduction’ stage showed a significantly higher dispersion around their group centroid when compared to samples from the ‘growth’ and ‘senescence’ stage (Figure 2b).
The most abundant bacterial families found on Sargassum spp. (Figure 3a) were Bacillaceae (annual average 35% ± 5.9% SD), Flavobacteriaceae (annual average 12% ± 0.6% SD) and Rhodobacteraceae (annual average 10% ± 1.0% SD). Throughout the sampling regime, Bacillaceae was the most dominant bacterial family associated with Sargassum spp. biofilm samples with an up to two-fold decrease in abundance during the ‘senescence’ stage (24.1% ± 0.8% SD in the ‘senescence’ stage versus 31.1% ± 10.4% SD and 45.8% ± 30.1% SD in the ‘growth’ and ‘reproduction’ stage, respectively; Figure 3b). Flavobacteriaceae displayed the opposite trend, with an up to two-fold increase in the relative abundance during the ‘senescence’ stage (19.5% ± 8.3% SD) compared to the ‘growth’ (11.9% ± 5.3% SD) and ‘reproduction’ (8.5% ± 6.4% SD) stages (Figure 3b).

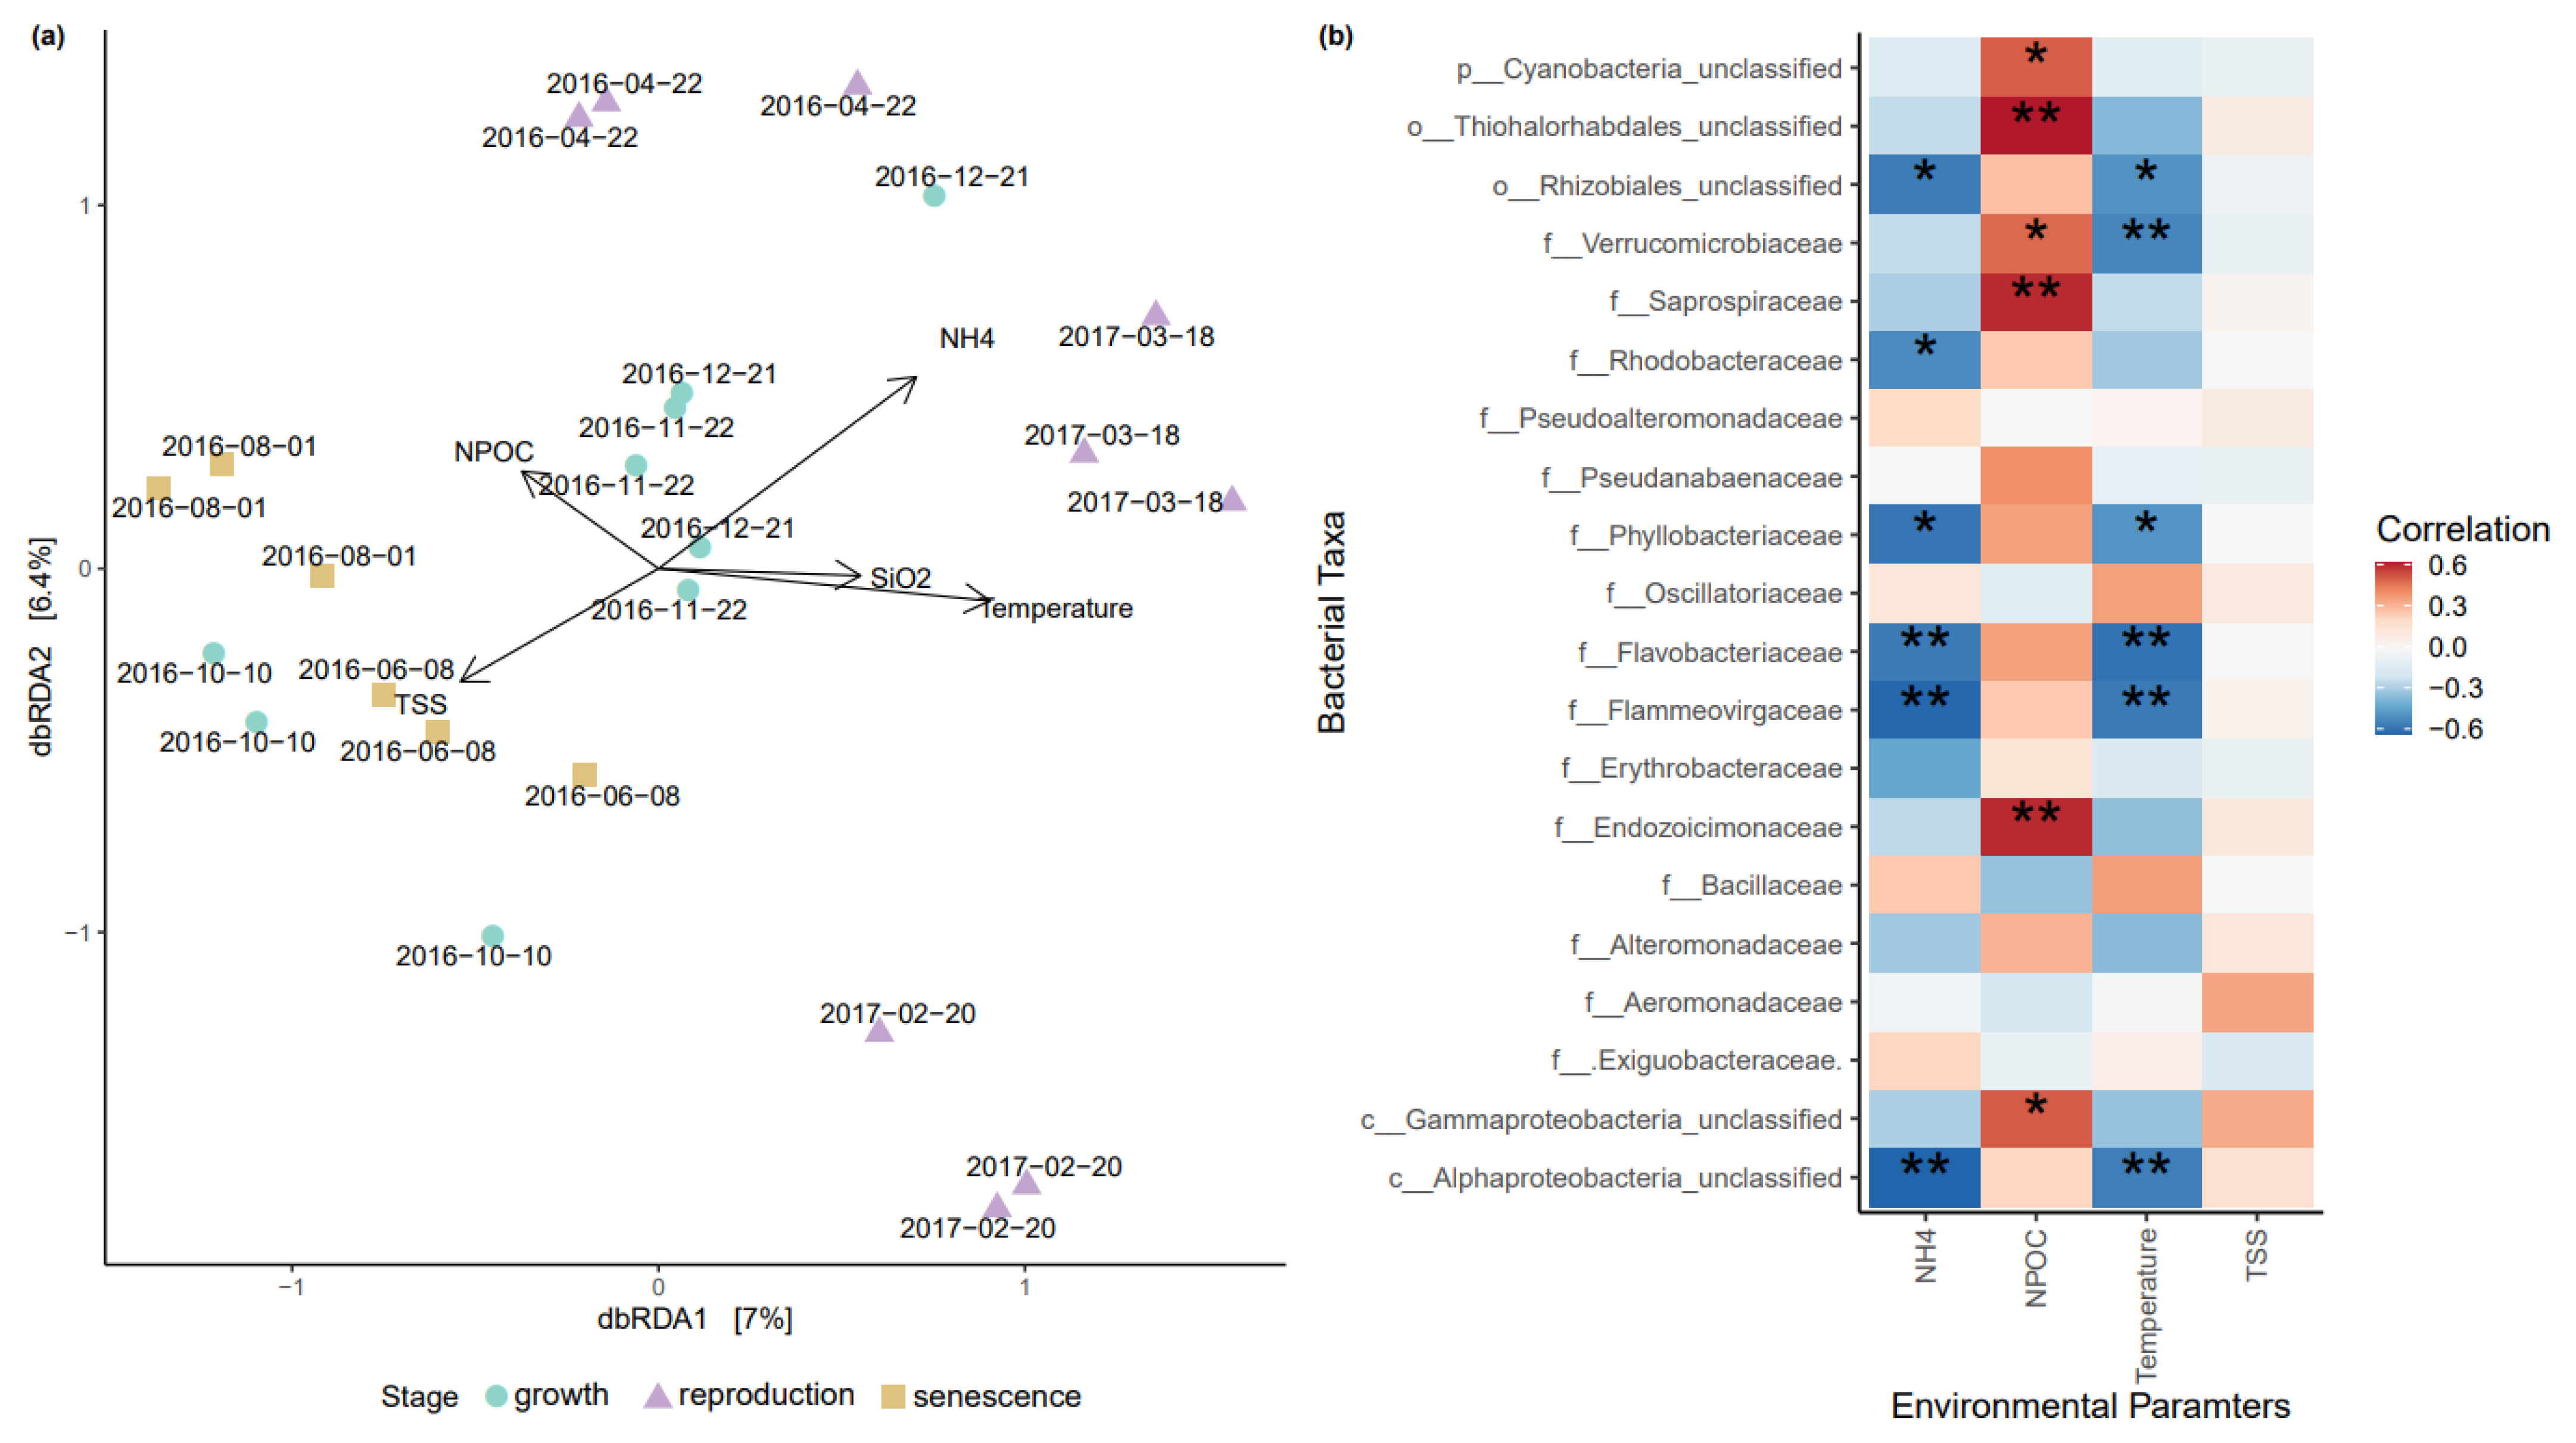
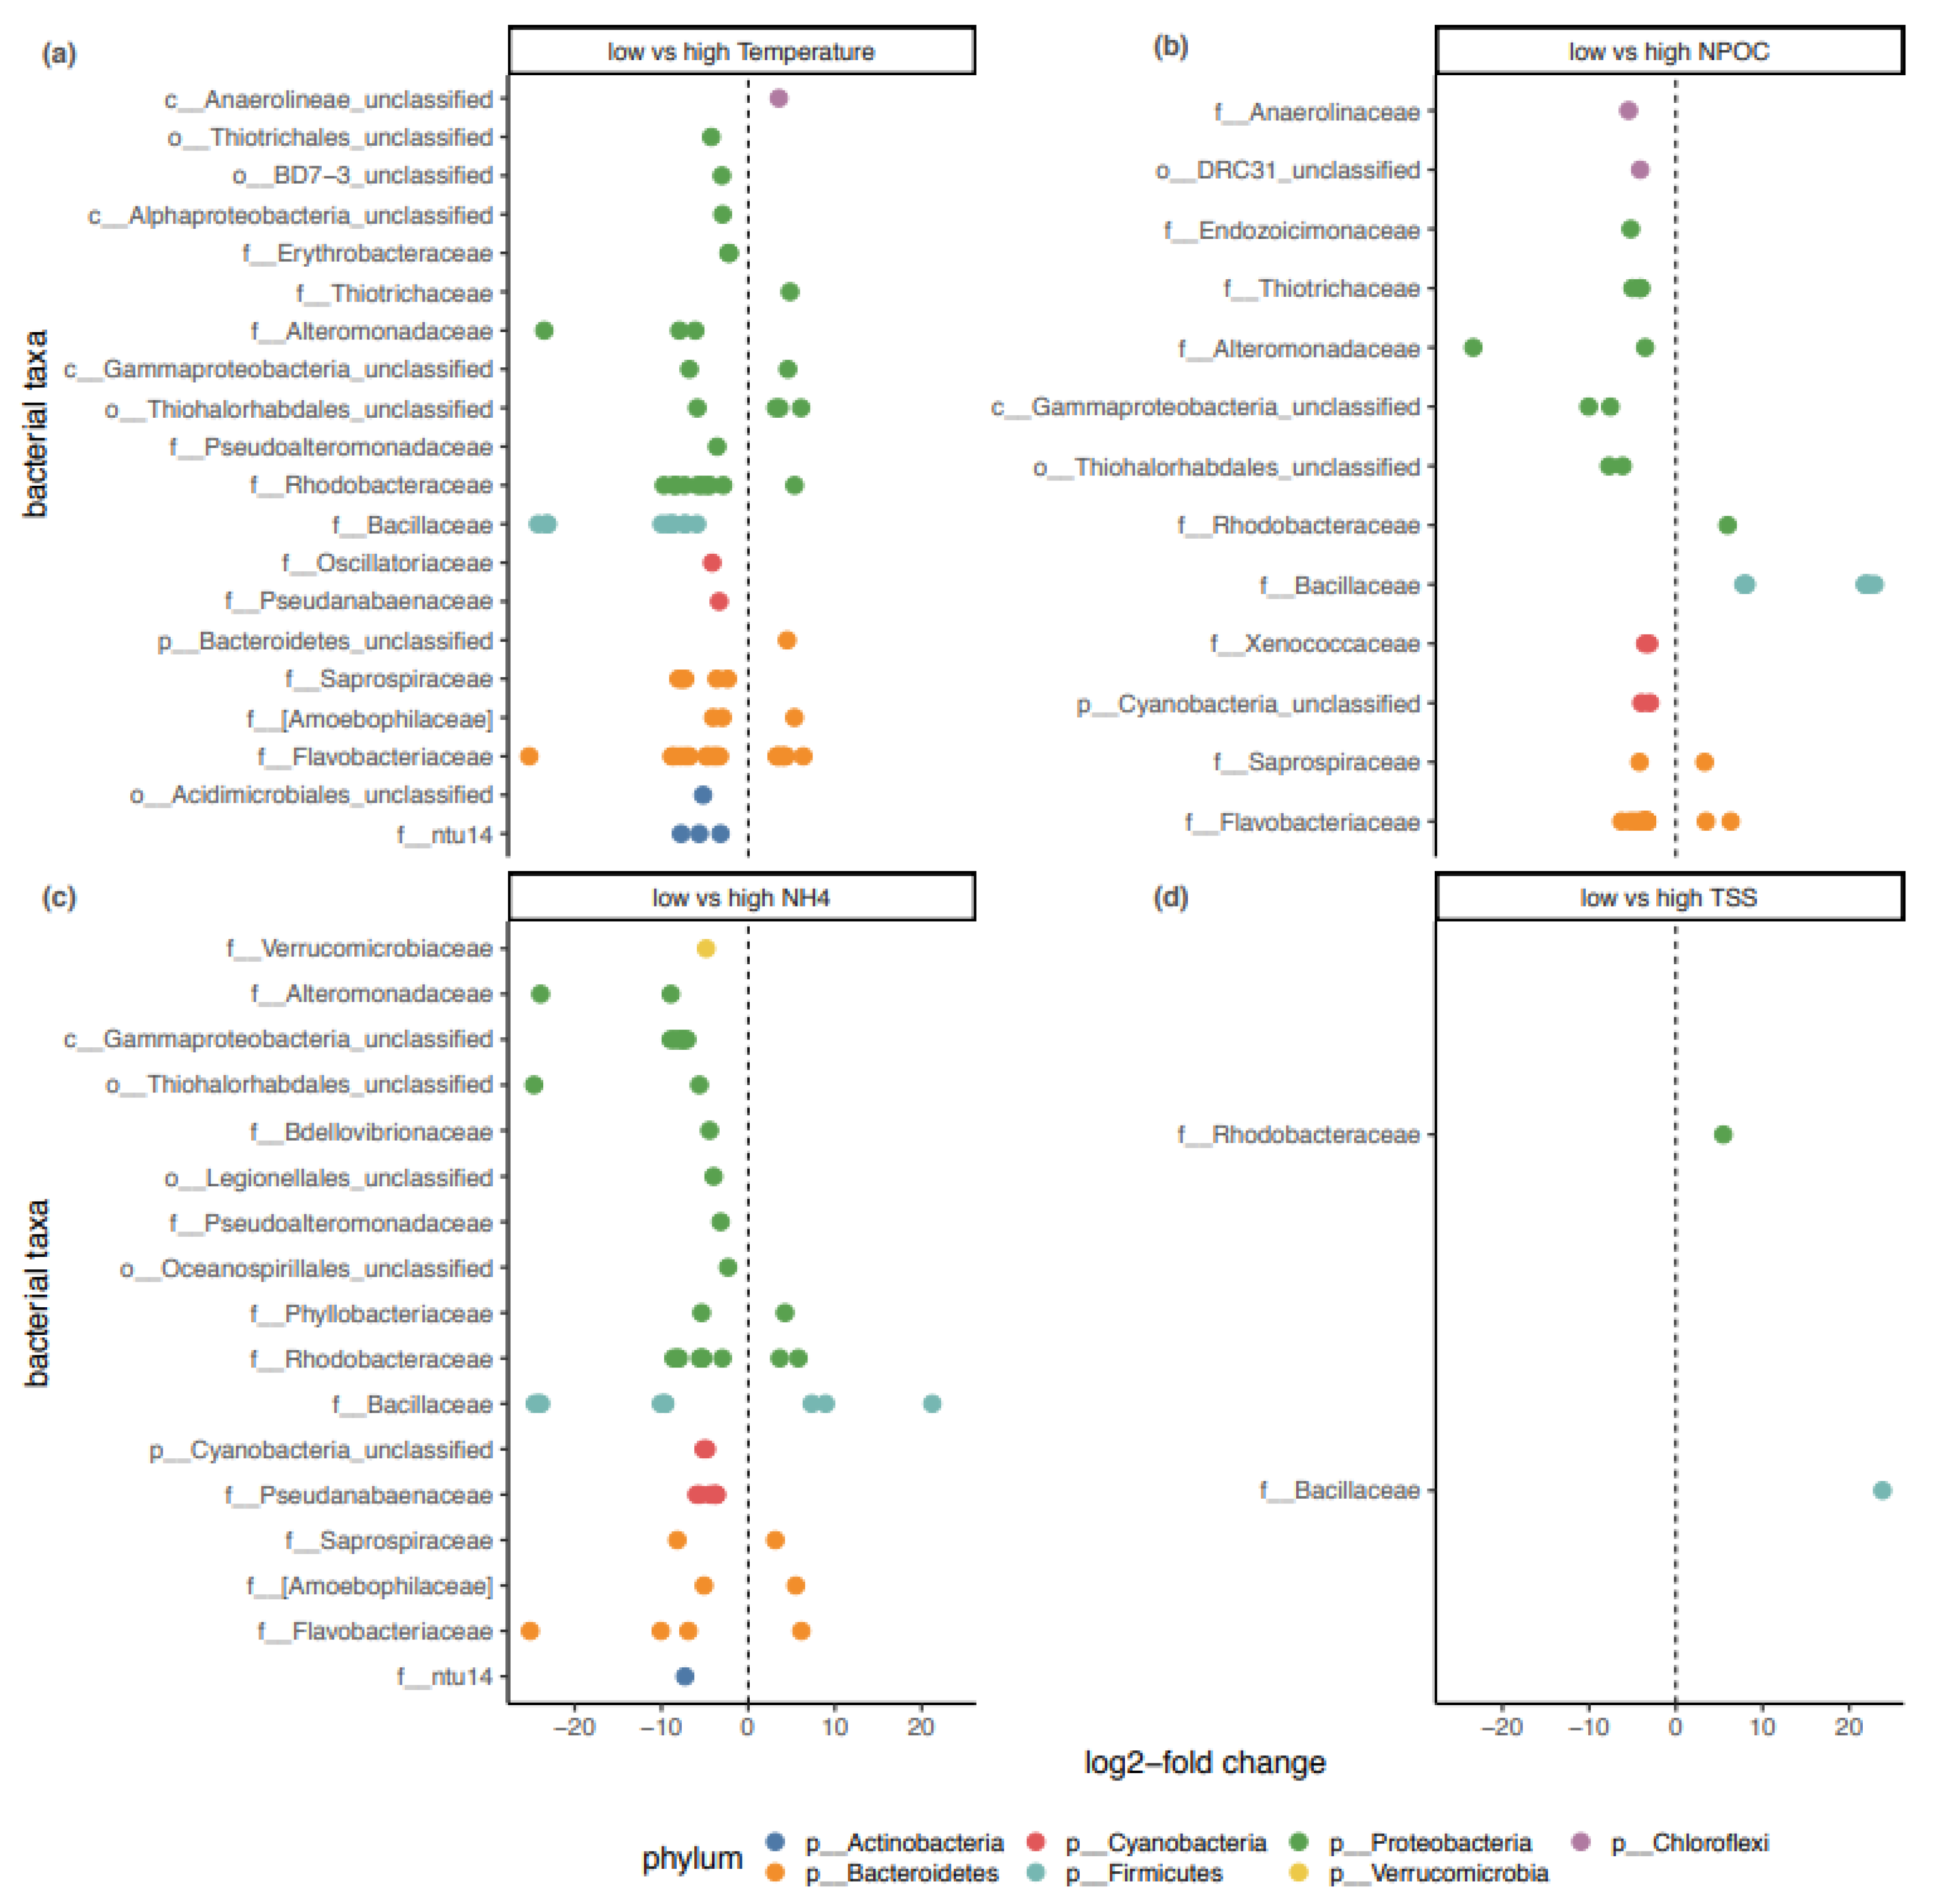
3.2. Influence of Abiotic Factors

Analysis of collinearity between the abiotic factors led to the exclusion of the following variables: particulate organic carbon (POC), chlorophyll a (Chl a), phosphate (PO43−), the sum of nitrite and nitrate (NO2-NO3), and nitrite (NO2; Figure S3). A principal component analysis (PCA), including non-purgeable organic carbon (NPOC), ammonium (NH4+), temperature, silica (SiO2), total suspended solids (TSS), non-purgeable inorganic carbon (NPIC), and particulate nitrogen (PN), revealed that the most relevant abiotic factors responsible for overall variation amongst sampling dates were NPIC, temperature, TSS, PN, SiO2, and NPOC (Figure S4) with the first two principal components explaining 67.9% of the variation between samples.
A distance-based Redundancy Analysis (db-RDA) was conducted testing the abiotic influence on Sargassum spp. associated zOTUs. The Sargassum spp. biofilm samples showed a clear clustering among the different sampling time points with TSS, NH4+, SiO2, and NPOC as significant abiotic factors (Figure 4a and Table S1). A variance partitioning analysis suggested that the abiotic factors explained 29% of microbial community variation for Sargassum spp. zOTUs.
Based on the db-RDA model, a community correlation heatmap was generated, highlighting the significant correlation (p-value < 0.05) between bacterial taxa and the abiotic factors of NH4+, temperature, SiO2, TSS and NPOC (Figure 4b). For example, the NH4+ concentration and seawater temperature were significantly correlated with a reduction in bacterial taxa belonging to Rhizobiales, Phyllobacteriaceae, Flavobacteriaceae, Flammeovirgaceae, and Alphaproteobacteria (Figure 4b). Bacterial families such as Rhodobacteraceae (NH4+) and Verrucomicrobiaceae (temperature), however, were only significantly correlated with one of these two abiotic factors (Figure 4b). Cyanobacteria, Thiohalorhabdales, Verrucomicrobiaceae, Saprospiraceae, Endozoicimonaceae, and Gammaproteobacteria were positively correlated with an increase in NPOC concentrations (Figure 4b). TSS was not significantly correlated to any of the bacterial families (Figure 4b).
The differential expression analysis (DESeq2) and community correlation heatmap shared several bacterial families, and in some instances, the DESeq2 results corroborated patterns observed in the correlation heatmap (Figure 5, FDR-adjusted p values ≤ 0.01). In total, 42% of the zOTUs contributing to the observed differences between low and high temperature groups belonged to the Rhodobacteraceae and Flavobacteriaceae families. Furthermore, 27% of the zOTUs causing statistical differences between low NH4+ and high NH4+ groups also belonged to Rhodobacteraceae and Flavobacteriaceae. Between 14% and 17% of the zOTUs with statistical differences between treatment groups of the abiotic factors belonged to Bacillaceae (Figure 5).

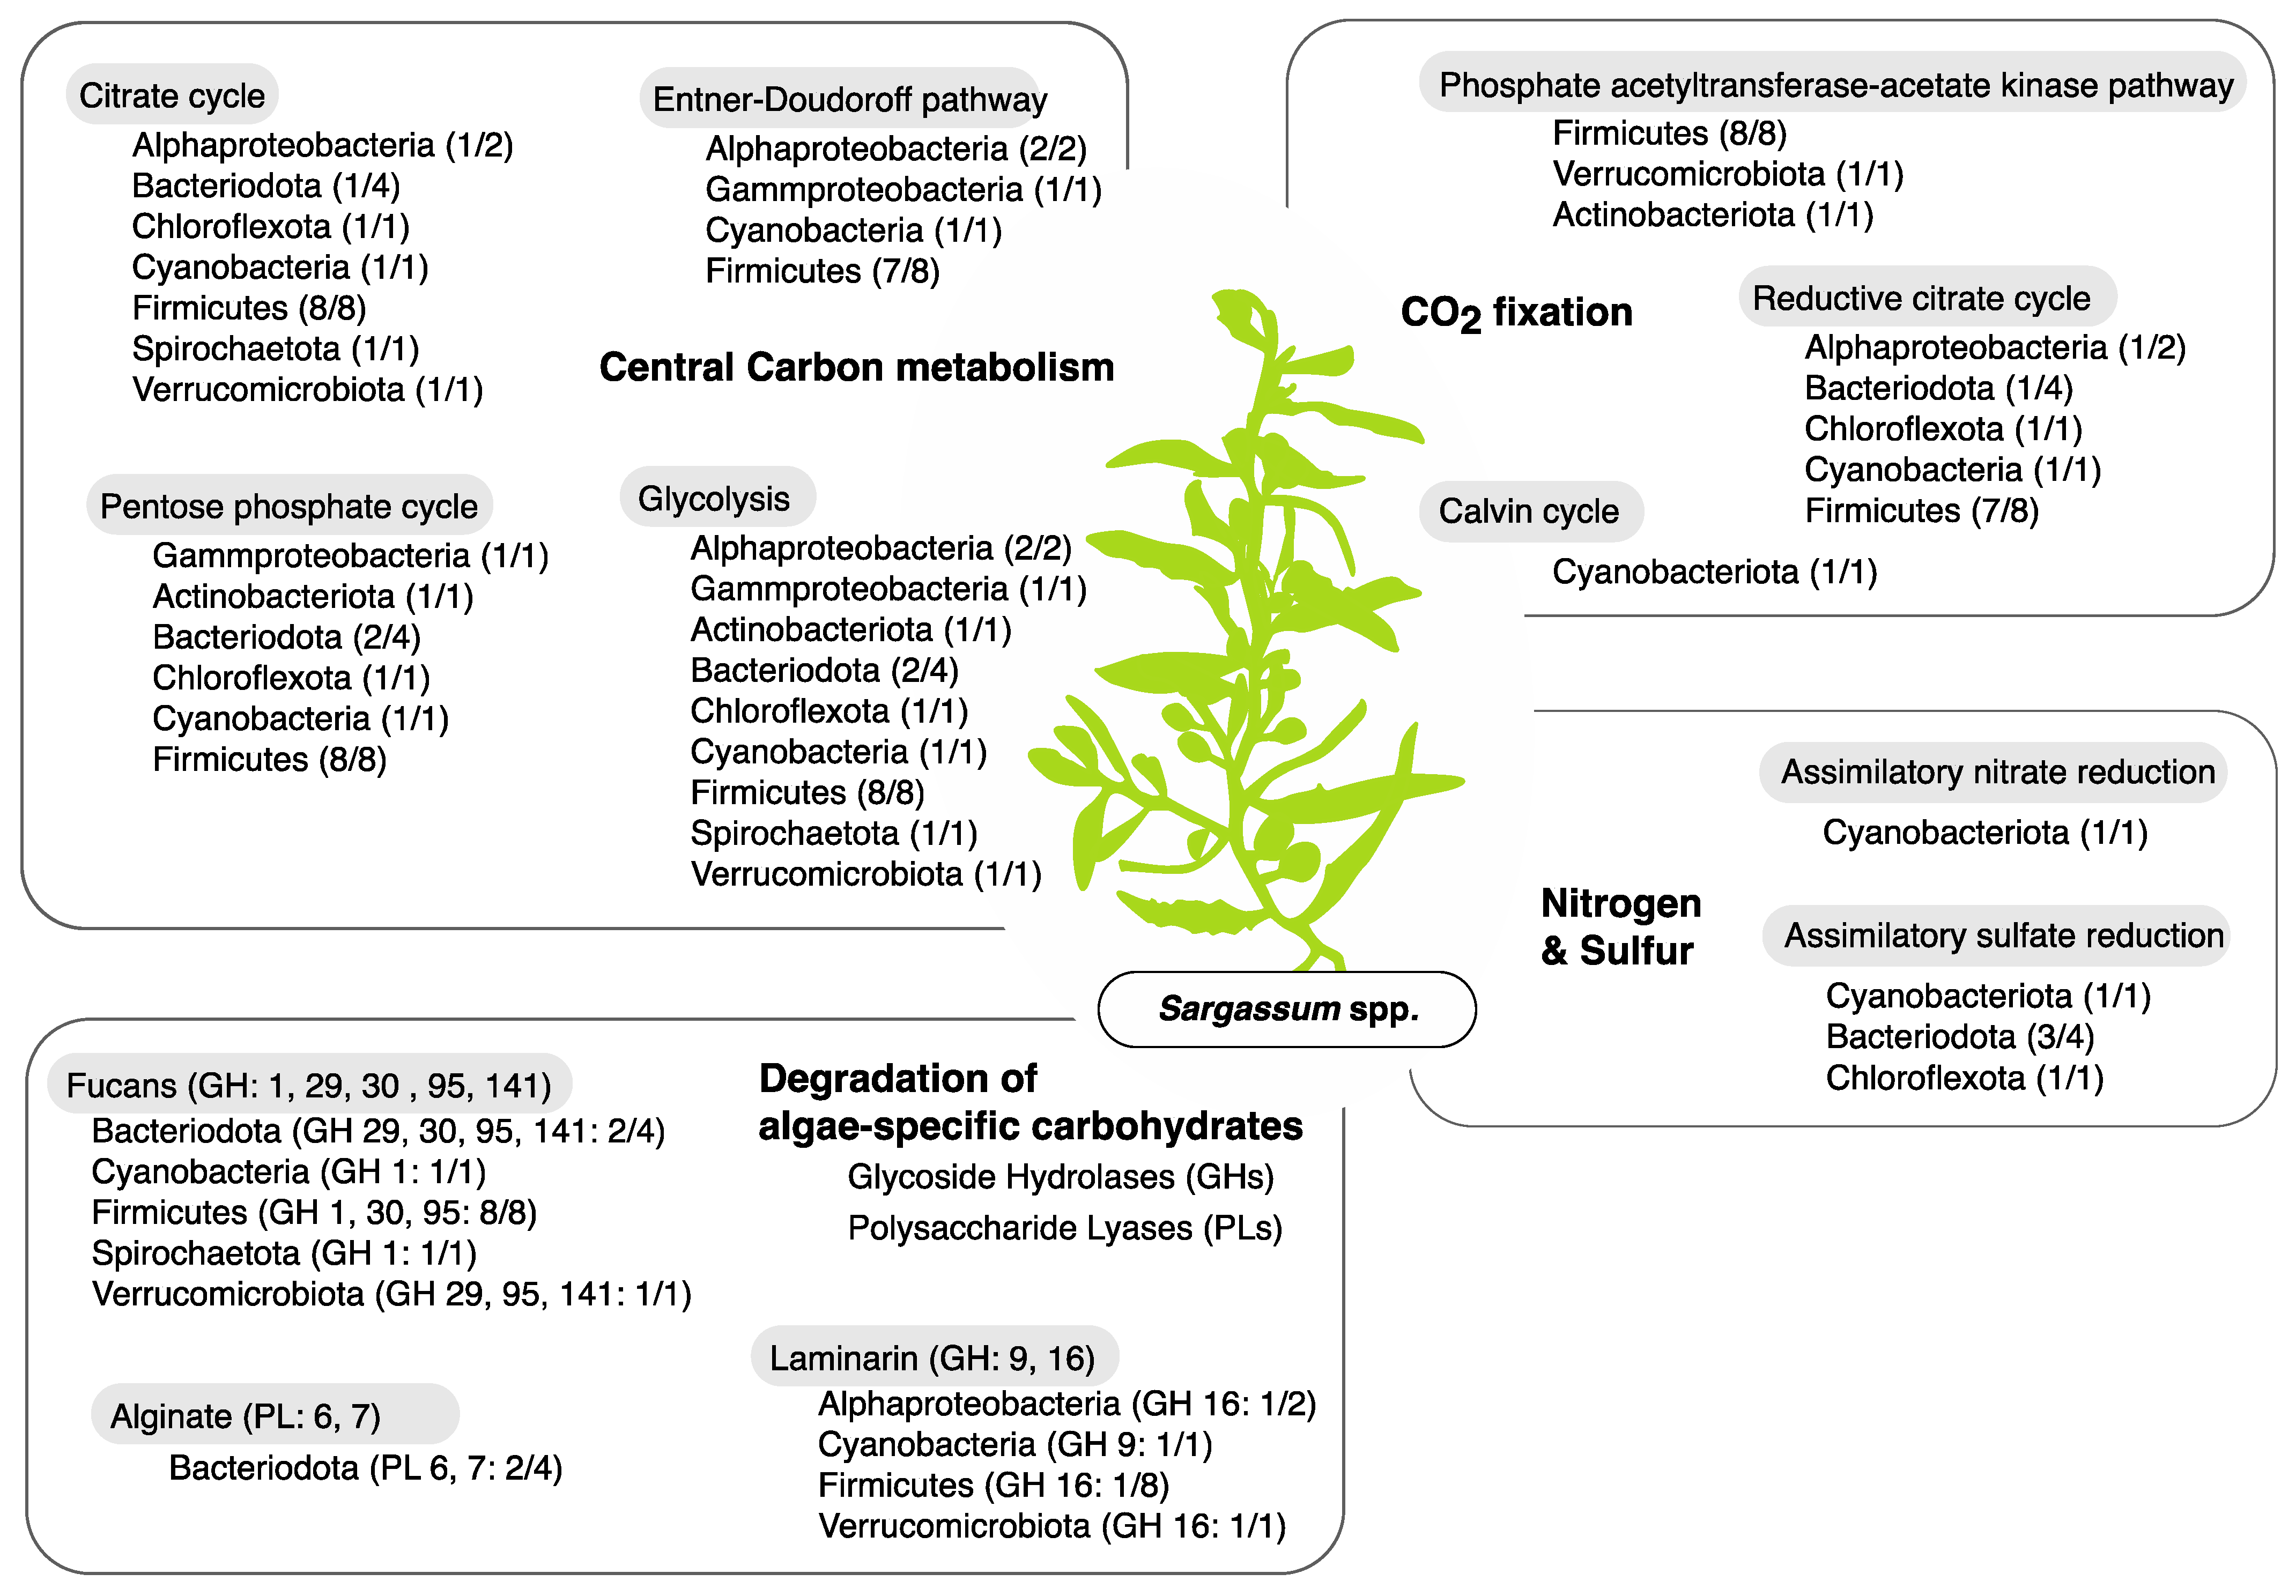
3.3. Metabolic Functions of Metagenome Assembled Genomes

A total of 20 metagenome-assembled genomes (MAGs) were included in the analysis belonging to the bacterial phyla Firmicutes (six MAGs), Chloroflexota (one MAG), Actinobacteriota (one MAG), Cyanobacteria (one MAG), Bacteroidota (four MAGs), Verrucomicrobiota (one MAG), Spirochaetota (one MAG), and Proteobacteria (two alphaproteobacterial MAGs and one gammaproteobacterial MAG). The taxonomic affiliation of MAGs is based on the Genome Taxonomy Database (GTDB); hence, taxonomic names vary slightly between zOTUs and MAGs. A detailed overview of the taxonomic affiliation, the completeness and contamination, as well as the relative abundance and representativeness of each individual MAG is provided in Table S2 and Figures S1 and S2.
In total, three different carbon fixation pathways (Calvin cycle, reductive citrate cycle, and the phosphate acetyltransferase-acetate kinase pathway) were detected in 17 out of the 20 MAGs (Figure 6 and Figure S5). All genes, including the key genes rbcL (K01601) and rbcS (K01602), involved in the carbon fixation via the Calvin cycle were present in the Cyanobacteria MAG (Figure S6). Few genes involved in the nitrogen and sulfur metabolism were detected in the Sargassum spp. biofilm MAGs. However, the cyanobacterial MAG possessed 100% of the genes involved in the assimilatory nitrate reduction (Figure 6 and Figure S7). All genes for assimilatory sulfate reduction were detected in three Bacteroidota MAGs, one Chloroflexota MAG and the cyanobacterial MAG (Figure 6 and Figure S8).
In total, four distinct pathways involved in the central carbohydrate metabolism were found in 19 out of 20 MAGs (Figure 6 and Figure S9). Glycolysis was the most common and complete carbohydrate metabolism, followed by the citrate cycle, the Pentose phosphate cycle and the Entner–Doudoroff pathway. All genes for the glycolosis pathway were found in the Firmicutes MAGs, the Chloroflexota MAG, the Spirochaetota MAG and the Verrucomicrobiota MAG. The gammaproteobacterial MAG contained all genes involved in the Entner-Doudoroff pathway, whereas one of the Bacteroidota MAGs and the Cyanobacteria MAGs possessed all genes involved in the pentose phosphate cycle.

4. Discussion

Macroalgae proliferation in coral reefs is often considered a sign of ecosystem degradation [1,2,3]. The increase in macroalgae on the reef benthos fuels the algae-derived DOC pool in the water column, which triggers the growth of copiotrophic and potentially pathogenic microbes in the seawater [8,9,11]. Although the effect of macroalgae proliferation and concomitant microbialization of reef systems has been documented for some coral reefs, comparatively little is known regarding the microbial dynamics on the surface of reef-dominating macroalgae [18]. This study provides a detailed overview of the compositional and functional dynamics of the bacterial community associated with the surface biofilm of Sargassum spp., a dominant macroalgae at many inshore reef locations on the Great Barrier Reef (GBR) in Australia. Here, we identify shifts in the bacterial community in correlation with key abiotic factors from the ambient seawater, such as temperature, ammonium and dissolved organic carbon concentration, and shifts in the relative abundance ratios of two dominant bacterial phyla (Firmicutes and Bacteroidetes) along the annual growth-reproduction-senescence cycle of the Sargassum macroalgal host.
Macroalgae surfaces offer a nutrient-rich niche in contrast to the more oligotrophic water column [15,66] and hence appear to support the proliferation of a distinct microbial community [50]. The macroalgal biofilm community was dominated by Firmicutes (37%), Proteobacteria (35%) and Bacteroidetes (18%). These bacterial phyla are highly abundant members of the microbiome associated with various Sargassum species as well as with other brown algae [24,32,67,68,69,70]. In contrast, Planctomycetes, which were previously reported as a dominant phylum of Sargassum biofilms [32,68,71], represented less than one percent of the bacterial component of the biofilm in this study. Differences to previously described dominant microbial taxa might indicate an effect of geographical variation and/or host species specificity of epiphytic bacterial communities associated with brown algae.
Over the course of one year, the Sargassum spp. biofilm undergoes compositional shifts (Figure S8). Similar to the Mediterranean algae Cystoseira compressa [31], these compositional changes are successional and do not demonstrate a drastic reorganization of the biofilm-associated bacterial community. Shifts in the relative abundances of individual bacterial families belonging to the phyla Firmicutes and Bacteroidetes (i.e., Bacillaceae and Flavobacteraceae, respectively) were observed throughout the 13-month sampling period (Figure 3). Changes in the bacterial community composition of the Sargassum spp. biofilm significantly correlated with fluctuations in temperature, NPOC and NH4+ concentrations of the surrounding water column (Figure 4 and Figure 5). The observed effect of environmental factors on the macroalgal biofilm composition is congruent with previous studies [24,26,29]. The abiotic seawater factors included in this study (i.e., temperature, NPOC, NH4+, TSS, and SiO2) resolved 29% of the observed variation in the microbial community at Sargassum spp. surface biofilm (Figure 4 and Figure 5). Hence, as the majority of the observed microbial community shifts remain unexplained by the abiotic factors from the surrounding environment included in this study, other drivers such as host intrinsic factors (e.g., photosynthetic rate) and/or interspecific interactions of microbes must be at play and remain to be determined.
A shift in the Firmicutes-to-Bacteroidetes ratio was especially pronounced along the annual growth-reproduction-senescence cycle of Sargassum. For example, the phylum Bacteroidetes (dominated by Flavobacteriaceae) reached its peak relative abundance (Firmicutes-to-Bacteroidetes ratio = 0.9:1) during the senescent stage (June-August, Figure 3b) when Sargassum spp. sheds its fronds, decay occurs, and biomass is depleted to its minimum [41,42,43]. The macroalgae-associated Bacteroidota MAGs (family Flavobacteriaceae) recovered from the Sargassum biofilm samples were equipped with polysaccharide lyases (PLs) and glycoside hydrolases (GHs), putatively involved in degrading algae-derived compounds such as fucans and alginate (Figure 6). Members of the phylum Bacteroidota have recently been shown to be enriched in coral microbiomes and bacterioplankton communities of macroalgae-dominated reefs [51,72,73]. Furthermore, free-living members of the bacterial phylum Bacteriodota are known to be major responders to phytoplankton blooms due to their ability to degrade high molecular grade organic matter [74]. Hence, the increase in Flavobacteriaceae during the ‘senescence’ stage and their genomic potential to degrade algae-derived compounds suggests that Flavobacteriaceae might play a key role in the tissue degradation of the Sargassum spp. fronds. In contrast, during the active ‘growth’ stage (October-December) and the ‘reproduction’ stage (February-April), the Firmicutes (dominated by Bacillaceae) were 1.7 to 3.9 times more abundant, respectively, than Bacteroidota (Figure 3b). Although the overall relative abundance of Bacillaceae did not correlate with environmental fluctuations (Figure 4b), individual zOTUs affiliated with this family responded to changes in the environment (i.e., temperature, NPOC, NH4+ and TSS concentrations), suggesting a specific response of individual Bacillaceae members (Figure 5).
A role of the Firmicutes-to-Bacteroidetes ratio in the growth-reproduction-senescence cycle of Sargassum spp. has previously been suggested [51]; however, only two time points were compared. Here, we confirm the previously suggested relative abundance changes using a monthly sampling regime throughout the annual growth-reproduction-senescence cycle of Sargassum. Interestingly, carbohydrate composition has been reported to vary throughout the annual growth cycle of brown algae, with increased abundances of laminarin during the rapid growth phase [75,76]. Members of the phylum Firmicutes with the putative ability to degrade laminarin were highly enriched from October to April (Figure 3, Figure 4 and Figure 5), when Sargassum undergoes its active growth (October-December) and reproduction (February-April) and reaches its maximum biomass [45,46]. This suggests that variations in algae-specific carbohydrate availability might play a vital role in the observed relative abundance shifts between Firmicutes and Bacteroidetes. Hence, investigating the microbial interactions in relation to algae-derived carbohydrates throughout the growth-reproduction-senescence cycle of Sargassum spp. will provide valuable insights in the successional processes of the biofilm microbiome associated with a dominant macroalgae in coral reef ecosystems. It remains to be determined how changes in successional processes on the Sargassum microbial biofilm may affect the surrounding water column and the DDAM feedback loop. One hypothesis of future interest is that heterotrophic bacteria (such as Firmicutes and Bacteroidetes) inhabiting the surface of macroalgal primary producers may play a relevant role in regulating the DDAM feedback loop, either by consuming leaking carbohydrates or by actually facilitating their release into the water column.

Supplementary Materials

The following are available online at https://www.mdpi.com/article/10.3390/life11111199/s1, Figure S1: Relative abundances of MAGs, Figure S2: Microbial community profile based on marker genes, Figure S3: Correlation matrix for environmental parameters, Figure S4: Principal component analysis based on environmental parameters, Figure S5: Heatmap displaying the completeness of carbon fixation pathways in recovered MAGs, Figure S6: Copy number of genes associated with the Calvin Cycle, Figure S7: Heatmap displaying the completeness of the nitrogen metabolism in MAGs, Figure S8: Heatmap displaying the completeness of the sulfur metabolism in MAGs, Figure S9: Heatmap displaying the completeness of the central carbohydrate metabolism in MAGs, Table S1: Statistical output of the permutational analysis of variance for abiotic factors of the distance-based redundancy analysis, Table S2: Taxonomic affiliation, completeness, contamination and genome size of MAGs.

Author Contributions

Conceptualization, B.G., J.B.H., D.G.B., N.S.W. and P.R.F.; Data curation, B.G. and J.B.H.; Formal analysis, B.G., J.B.H., T.A. and P.R.F.; Funding acquisition, B.G., D.G.B. and N.S.W.; Investigation, B.G., D.G.B., N.S.W. and P.R.F.; Methodology, B.G. and P.R.F.; Project administration, B.G.; Resources, E.A.S., D.G.B. and N.S.W.; Supervision, B.G., T.A., E.A.S. and P.R.F.; Validation, T.A., E.A.S., D.G.B., N.S.W. and P.R.F.; Visualization, B.G.; Writing—original draft, B.G. and J.B.H.; Writing—review and editing, B.G., J.B.H., T.A., E.A.S., D.G.B., N.S.W. and P.R.F. All authors have read and agreed to the published version of the manuscript.

Funding

The Australian Microbiome Initiative supported the generation of data used in this publication. The Australian Microbiome Initiative is supported by funding from Bioplatforms Australia through the Australian Government National Collaborative Research Infrastructure Strategy (NCRIS). The study was further funded by the Advance Queensland PhD Scholarship and by the Austrian Science Fund (FWF) [T 1218] awarded to B.G. For the purpose of open access, B.G. has applied a CC BY public copyright license to any Author Accepted Manuscript version arising from this submission. P.R.F., T.A. and E.A.S. were supported by the Portuguese Science and Technology Foundation (FCT) through fellowships SFRH/BDP/110285/2015, SFRH/BSAB/150485/2019, SFRH/BPD/116774/2016 and UID/Multi/04326/2020 to Centre of Marine Sciences.

Institutional Review Board Statement

Not applicable.

Informed Consent Statement

Not applicable.

Data Availability Statement

16S rRNA and metagenome sequences, metadata and protocols are available at the Bioplatforms Australia data portal under the Australian Microbiome project (https://www.bioplatforms.com/australian-microbiome/). Full usage requires free registration. To search for the 16S rRNA sequencing data, navigate to ‘Processed data’, select ‘Amplicon is 27f519r_bacteria’ and ‘Environment is Marine’. To search for the Sargassum spp. samples, add an additional contextual filter, select ‘Sample Site Location Description from the dropdown menu and search for ‘Geoffrey Bay’ and ‘Sample Type is Seaweed’. Metagenome assembled genomes (MAGs) used in this study have been deposited under NCBI BioProject PRJNA594068. Water temperature data of the sampling site (Geoffrey Bay 2 m depth) during the collection period (2016–2017) was extracted from the data repository of the Australian Institute of Marine Science (AIMS; https://data.aims.gov.au).

Acknowledgments

We thank Michele Skuza, Neale Johnston, and the AIMS water quality team for their help with analyzing the water quality samples. We thank Heidi Luter, Katarina Damjanovic and Joe Gioffre for their assistance in the field. We also thank Sara Bell for expertise in the laboratory and Aschwin Engelen for scientific input. We thank the Austrian Science Fund (FWF) for the open-access funding.

Conflicts of Interest

The authors declare no conflict of interest. The funders had no role in the design of the study; in the collection, analyses, or interpretation of data; in the writing of the manuscript, or in the decision to publish the results.

References

  1. Bruno, J.F.; Sweatman, H.; Precht, W.F.; Selig, E.R.; Schutte, V.G. Assessing evidence of phase shifts from coral to macroalgal dominance on coral reefs. Ecology 2009, 90, 1478–1484. [Google Scholar] [CrossRef] [PubMed] [Green Version]
  2. Hughes, T.P.; Rodrigues, M.J.; Bellwood, D.R.; Ceccarelli, D.; Hoegh-Guldberg, O.; McCook, L.; Moltschaniwskyj, N.; Pratchett, M.S.; Steneck, R.S.; Willis, B. Phase shifts, herbivory, and the resilience of coral reefs to climate change. Curr. Biol. 2007, 17, 360–365. [Google Scholar] [CrossRef] [Green Version]
  3. Sandin, S.A.; Smith, J.E.; DeMartini, E.E.; Dinsdale, E.A.; Donner, S.D.; Friedlander, A.M.; Konotchick, T.; Malay, M.; Maragos, J.E.; Obura, D.; et al. Baselines and degradation of coral reefs in the Northern Line Islands. PLoS ONE 2008, 3, e1548. [Google Scholar] [CrossRef] [Green Version]
  4. Hughes, T.P.; Baird, A.H.; Bellwood, D.R.; Card, M.; Connolly, S.R.; Folke, C.; Grosberg, R.; Hoegh-Guldberg, O.; Jackson, J.B.C.; Kleypas, J.; et al. Climate change, human impacts, and the resilience of coral reefs. Science 2003, 301, 929–933. [Google Scholar] [CrossRef] [PubMed] [Green Version]
  5. Hughes, T.P.; Kerry, J.T.; Baird, A.H.; Connolly, S.R.; Dietzel, A.; Eakin, C.M.; Heron, S.F.; Hoey, A.S.; Hoogenboom, M.O.; Liu, G.; et al. Global warming transforms coral reef assemblages. Nature 2018, 556, 492–496. [Google Scholar] [CrossRef]
  6. Haas, A.F.; Nelson, C.E.; Kelly, L.W.; Carlson, C.A.; Rohwer, F.; Leichter, J.J.; Wyatt, A.; Smith, J.E. Effects of coral reef benthic primary producers on dissolved organic carbon and microbial activity. PLoS ONE 2011, 6, e27973. [Google Scholar] [CrossRef] [PubMed] [Green Version]
  7. Nelson, C.E.; Goldberg, S.J.; Kelly, L.W.; Haas, A.F.; Smith, J.E.; Rohwer, F.; Carlson, C.A. Coral and macroalgal exudates vary in neutral sugar composition and differentially enrich reef bacterioplankton lineages. ISME J. 2013, 7, 962–979. [Google Scholar] [CrossRef]
  8. Silveira, C.B.; Cavalcanti, G.S.; Walter, J.M.; Silva-Lima, A.W.; Dinsdale, E.A.; Bourne, D.G.; Thompson, C.C.; Thompson, F.L. Microbial processes driving coral reef organic carbon flow. FEMS Microbiol. Rev. 2017, 41, 575–595. [Google Scholar] [CrossRef] [PubMed] [Green Version]
  9. Haas, A.F.; Fairoz, M.F.M.; Kelly, L.W.; Nelson, C.E.; Dinsdale, E.A.; Edwards, R.A.; Giles, S.; Hatay, M.; Hisakawa, N.; Knowles, B.; et al. Global microbialization of coral reefs. Nat. Microbiol. 2016, 1, 16042. [Google Scholar] [CrossRef] [PubMed]
  10. Barott, K.L.; Rohwer, F.L. Unseen players shape benthic competition on coral reefs. Trends Microbiol. 2012, 20, 621–628. [Google Scholar] [CrossRef] [PubMed]
  11. McDole, T.; Nulton, J.; Barott, K.L.; Felts, B.; Hand, C.; Hatay, M.; Lee, H.; Nadon, M.O.; Nosrat, B.; Salamon, P.; et al. Assessing coral reefs on a pacific-wide scale using the microbialization score. PLoS ONE 2012, 7, e43233. [Google Scholar] [CrossRef]
  12. Morrow, K.M.; Paul, V.J.; Liles, M.R.; Chadwick, N.E. Allelochemicals produced by Caribbean macroalgae and cyanobacteria have species-specific effects on reef coral microorganisms. Coral Reefs 2011, 30, 309–320. [Google Scholar] [CrossRef]
  13. Sweet, M.J.; Bythell, J.C.; Nugues, M.M. Algae as reservoirs for coral pathogens. PLoS ONE 2013, 8, e69717. [Google Scholar] [CrossRef] [PubMed] [Green Version]
  14. Egan, S.; Harder, T.; Burke, C.; Steinberg, P.; Kjelleberg, S.; Thomas, T. The seaweed holobiont: Understanding seaweed–bacteria interactions. FEMS Microbiol. Rev. 2013, 37, 462–476. [Google Scholar] [CrossRef] [PubMed] [Green Version]
  15. Wahl, M.; Goecke, F.; Labes, A.; Dobretsov, S.; Weinberger, F. The second skin: Ecological role of epibiotic biofilms on marine organisms. Front. Microbiol 2012, 3, 292. [Google Scholar] [CrossRef] [PubMed] [Green Version]
  16. Rohwer, F.; Seguritan, V.; Azam, F.; Knowlton, N. Diversity and distribution of coral-associated bacteria. Mar. Ecol. Prog. Ser. 2002, 243, 1–10. [Google Scholar] [CrossRef] [Green Version]
  17. McFall-Ngai, M.; Hadfield, M.G.; Bosch, T.C.G.; Carey, H.V.; Domazet-Lošo, T.; Douglas, A.E.; Dubilier, N.; Eberl, G.; Fukami, T.; Gilbert, S.F.; et al. Animals in a bacterial world, a new imperative for the life sciences. Proc. Natl. Acad. Sci. USA 2013, 110, 3229–3236. [Google Scholar] [CrossRef] [Green Version]
  18. Van Der Loos, L.M.; Eriksson, B.K.; Falcao Salles, J. The Macroalgal Holobiont in a Changing Sea. Trends Microbiol. 2019, 27, 635–650. [Google Scholar] [CrossRef] [PubMed]
  19. Brock, T.D.; Clyne, J. Significance of algal excretory products for growth of epilimnetic bacteria. Appl. Environ. Microbiol. 1984, 47, 731–734. [Google Scholar] [CrossRef] [Green Version]
  20. Goecke, F.; Labes, A.; Wiese, J.; Imhoff, J.F. Chemical interactions between marine macroalgae and bacteria. Mar. Ecol. Prog. Ser. 2010, 409, 267–299. [Google Scholar] [CrossRef]
  21. Bengtsson, M.M.; Sjotun, K.; Storesund, J.E.; Ovreas, L. Utilization of kelp-derived carbon sources by kelp surface-associated bacteria. Aquat. Microb. Ecol. 2011, 62, 191–199. [Google Scholar] [CrossRef]
  22. Singh, R.P.; Mantri, V.A.; Reddy, C.R.K.; Jha, B. Isolation of seaweed-associated bacteria and their morphogenesis-inducing capability in axenic cultures of the green alga Ulva fasciata. Aquat Biol 2011, 12, 13–21. [Google Scholar] [CrossRef] [Green Version]
  23. Singh, R.P.; Reddy, C.R.K. Seaweed-microbial interactions: Key functions of seaweed-associated bacteria. FEMS Microbiol. Ecol. 2014, 88, 213–230. [Google Scholar] [CrossRef]
  24. Mei, X.Y.; Wu, C.H.; Zhao, J.; Yan, T.; Jiang, P. Community structure of bacteria associated with drifting Sargassum horneri, the causative species of golden tide in the Yellow Sea. Front. Microbiol. 2019, 10, 1192. [Google Scholar] [CrossRef] [Green Version]
  25. Egan, S.; Gardiner, M. Microbial Dysbiosis: Rethinking disease in marine ecosystems. Front. Microbiol 2016, 7, 991. [Google Scholar] [CrossRef] [PubMed]
  26. Lachnit, T.; Meske, D.; Wahl, M.; Harder, T.; Schmitz, R. Epibacterial community patterns on marine macroalgae are host-specific but temporally variable. Environ. Microbiol. 2011, 13, 655–665. [Google Scholar] [CrossRef] [PubMed]
  27. Nylund, G.M.; Persson, F.; Lindegarth, M.; Cervin, G.; Hermansson, M.; Pavia, H. The red alga Bonnemaisonia asparagoides regulates epiphytic bacterial abundance and community composition by chemical defence. FEMS Microbiol. Ecol. 2010, 71, 84–93. [Google Scholar] [CrossRef] [PubMed] [Green Version]
  28. Bengtsson, M.M.; Sjotun, K.; Ovreas, L. Seasonal dynamics of bacterial biofilms on the kelp Laminaria hyperborea. Aquat. Microb. Ecol. 2010, 60, 71–83. [Google Scholar] [CrossRef] [Green Version]
  29. Aires, T.; Serrao, E.A.; Engelen, A.H. Host and environmental specificity in bacterial communities associated to two highly invasive marine species (genus Asparagopsis). Front. Microbiol. 2016, 7, 559. [Google Scholar] [CrossRef]
  30. Bengtsson, M.M.; Sjotun, K.; Lanzen, A.; Ovreas, L. Bacterial diversity in relation to secondary production and succession on surfaces of the kelp Laminaria hyperborea. ISME J. 2012, 6, 2188–2198. [Google Scholar] [CrossRef] [PubMed]
  31. Mancuso, F.P.; D’Hondt, S.; Willems, A.; Airoldi, L.; De Clerck, O. Diversity and temporal dynamics of the epiphytic bacterial communities associated with the canopy-forming seaweed Cystoseira cornpressa (Esper) Gerloff and Nizamuddin. Front. Microbiol. 2016, 7, 476. [Google Scholar] [CrossRef] [PubMed] [Green Version]
  32. Serebryakova, A.; Aires, T.; Viard, F.; Serrao, E.A.; Engelen, A.H. Summer shifts of bacterial communities associated with the invasive brown seaweed Sargassum muticum are location and tissue dependent. PLoS ONE 2018, 13, e0206734. [Google Scholar] [CrossRef] [PubMed]
  33. Tuya, F.; Wernberg, T.; Thomsen, M.S. The spatial arrangement of reefs alters the ecological patterns of fauna between interspersed algal habitats. Estuar. Coast. Shelf Sci. 2008, 78, 774–782. [Google Scholar] [CrossRef] [Green Version]
  34. Webster, F.J.; Babcock, R.C.; Van Keulen, M.; Loneragan, N.R. Macroalgae inhibits larval settlement and increases recruit mortality at Ningaloo Reef, Western Australia. PLoS ONE 2015, 10, e0124162. [Google Scholar] [CrossRef] [PubMed]
  35. Tanner, J.E. Competition between scleractinian corals and macroalgae—an experimental investigation of coral growth, survival and reproduction. J. Exp. Mar. Biol. Ecol. 1995, 190, 151–168. [Google Scholar] [CrossRef]
  36. van Woesik, R.; Ripple, K.; Miller, S.L. Macroalgae reduces survival of nursery-reared Acropora corals in the Florida reef tract. Restor. Ecol. 2018, 26, 563–569. [Google Scholar] [CrossRef]
  37. Smith, J.E.; Shaw, M.; Edwards, R.A.; Obura, D.; Pantos, O.; Sala, E.; Sandin, S.A.; Smriga, S.; Hatay, M.; Rohwer, F.L. Indirect effects of algae on coral: Algae-mediated, microbe-induced coral mortality. Ecol. Lett. 2006, 9, 835–845. [Google Scholar] [CrossRef]
  38. Birrell, C.L.; McCook, L.J.; Willis, B.L.; Harrington, L. Chemical effects of macroalgae on larval settlement of the broadcast spawning coral Acropora millepora. Mar. Ecol. Prog. Ser. 2008, 362, 129–137. [Google Scholar] [CrossRef] [Green Version]
  39. Vega Thurber, R.; Burkepile, D.E.; Correa, A.M.; Thurber, A.R.; Shantz, A.A.; Welsh, R.; Pritchard, C.; Rosales, S. Macroalgae decrease growth and alter microbial community structure of the reef-building coral, Porites astreoides. PLoS ONE 2012, 7, e44246. [Google Scholar] [CrossRef] [Green Version]
  40. Nugues, M.M.; Smith, G.W.; Hooidonk, R.J.; Seabra, M.I.; Bak, R.P.M. Algal contact as a trigger for coral disease. Ecol. Lett. 2004, 7, 919–923. [Google Scholar] [CrossRef]
  41. De’ath, G.; Fabricius, K. Water quality as a regional driver of coral biodiversity and macroalgae on the Great Barrier Reef. Ecol. Appl. 2010, 20, 840–850. [Google Scholar] [CrossRef]
  42. Wismer, S.; Hoey, A.S.; Bellwood, D.R. Cross-shelf benthic community structure on the Great Barrier Reef: Relationships between macroalgal cover and herbivore biomass. Mar. Ecol. Prog. Ser. 2009, 376, 45–54. [Google Scholar] [CrossRef] [Green Version]
  43. Ceccarelli, D.M.; Evans, R.D.; Logan, M.; Mantel, P.; Puotinen, M.; Petus, C.; Russ, G.R.; Williamson, D.H. Long-term dynamics and drivers of coral and macroalgal cover on inshore reefs of the Great Barrier Reef Marine Park. Ecol. Appl. 2020, 30, e02008. [Google Scholar] [CrossRef] [Green Version]
  44. Lefèvre, C.D.; Bellwood, D.R. Seasonality and dynamics in coral reef macroalgae: Variation in condition and susceptibility to herbivory. Mar. Biol. 2010, 157, 955–965. [Google Scholar] [CrossRef]
  45. Schaffelke, B.; Klumpp, D.W. Biomass and productivity of tropical macroalgae on three nearshore fringing reefs in the central Great Barrier Reef, Australia. Bot. Mar. 1997, 40, 373–383. [Google Scholar] [CrossRef]
  46. Ceccarelli, D.M.; Loffler, Z.; Bourne, D.G.; Al Moajil-Cole, G.S.; Boström-Einarsson, L.; Evans-Illidge, E.; Fabricius, K.; Glasl, B.; Marshall, P.; McLeod, I.; et al. Rehabilitation of coral reefs through removal of macroalgae: State of knowledge and considerations for management and implementation. Restor. Ecol. 2018, 26, 827–838. [Google Scholar] [CrossRef]
  47. Martin-Smith, K.M. The phenology of four species of Sargassum at Magnetic Island, Australia. Bot. Mar. 1993, 327–334. [Google Scholar] [CrossRef]
  48. Loffler, Z.; Hoey, A.S.; Hughes, A.R. Canopy-forming macroalgal beds (Sargassum) on coral reefs are resilient to physical disturbance. J. Ecol. 2018, 106, 1164. [Google Scholar] [CrossRef]
  49. Walther, B.D.; Kingsford, M.J.; McCulloch, M.T. Environmental records from Great Barrier Reef corals: Inshore versus offshore drivers. PLoS ONE 2013, 8, e77091. [Google Scholar] [CrossRef]
  50. Glasl, B.; Bourne, D.G.; Frade, P.R.; Thomas, T.; Schaffelke, B.; Webster, N.S. Microbial indicators of environmental perturbations in coral reef ecosystems. Microbiome 2019, 7, 94. [Google Scholar] [CrossRef] [PubMed] [Green Version]
  51. Glasl, B.; Robbins, S.; Frade, P.R.; Marangon, E.; Laffy, P.W.; Bourne, D.G.; Webster, N.S. Comparative genome-centric analysis reveals seasonal variation in the function of coral reef microbiomes. ISME J. 2020, 14, 1435–1450. [Google Scholar] [CrossRef] [PubMed] [Green Version]
  52. Devlin, M.J.; Lourey, M.J. Water Quality—Field and Analytical Procedures; Australian Institute of Marine Science: Townsville, Australia, 2000. [Google Scholar]
  53. Lane, D.J. 16S/23S rRNA sequencing. In Nucleic Acid Techniques in Bacterial Systematics; Stackebrandt, E., Goodfellow, M., Eds.; John Wiley and Sons: New York, NY, USA, 1991; pp. 115–175. [Google Scholar]
  54. Turner, S.; Pryer, K.M.; Miao, V.P.; Palmer, J.D. Investigating deep phylogenetic relationships among cyanobacteria and plastids by small subunit rRNA sequence analysis. J. Eukaryot. Microbiol. 1999, 46, 327–338. [Google Scholar] [CrossRef] [PubMed]
  55. Brown, M.V.; Kamp, J.v.d.; Ostrowski, M.; Seymour, J.R.; Ingleton, T.; Messer, L.F.; Jeffries, T.; Siboni, N.; Laverock, B.; Bibiloni-Isaksson, J.; et al. Systematic, continental scale temporal monitoring of marine pelagic microbiota by the Australian Marine Microbial Biodiversity Initiative. Sci. Data 2018, 5, 180130. [Google Scholar] [CrossRef] [PubMed]
  56. Magoc, T.; Salzberg, S.L. FLASH: Fast length adjustment of short reads to improve genome assemblies. Bioinformatics 2011, 27, 2957–2963. [Google Scholar] [CrossRef]
  57. Schloss, P.D.; Westcott, S.L.; Ryabin, T.; Hall, J.R.; Hartmann, M.; Hollister, E.B.; Lesniewski, R.A.; Oakley, B.B.; Parks, D.H.; Robinson, C.J.; et al. Introducing mothur: Open-source, platform-independent, community-supported software for describing and comparing microbial communities. Appl. Environ. Microbiol. 2009, 75, 7537–7541. [Google Scholar] [CrossRef] [PubMed] [Green Version]
  58. Edgar, R.C. Search and clustering orders of magnitude faster than BLAST. Bioinformatics 2010, 26, 2460–2461. [Google Scholar] [CrossRef] [PubMed] [Green Version]
  59. Yilmaz, P.; Parfrey, L.W.; Yarza, P.; Gerken, J.; Pruesse, E.; Quast, C.; Schweer, T.; Peplies, J.; Ludwig, W.; Glockner, F.O. The SILVA and “All-species Living Tree Project (LTP)” taxonomic frameworks. Nucleic Acids Res. 2014, 42, 643–648. [Google Scholar] [CrossRef] [PubMed] [Green Version]
  60. Wang, Q.; Garrity, G.M.; Tiedje, J.M.; Cole, J.R. Naïve bayesian classifier for rapid assignment of rRNA sequences into the new bacterial taxonomy. Appl. Environ. Microbiol. 2007, 73, 5261–5267. [Google Scholar] [CrossRef] [Green Version]
  61. Anders, S.; Huber, W. Differential expression analysis for sequence count data. Genome Biol. 2010, 11, 106. [Google Scholar] [CrossRef] [Green Version]
  62. R Development Core Team. R: A Language and Environment for Statistical Computing; R Foundation for Statistical Computing: Vienna, Austria, 2021; Available online: https://www.R-project.org/ (accessed on 1 November 2021).
  63. McMurdie, P.J.; Holmes, S. phyloseq: An R package for reproducible interactive analysis and graphics of microbiome census data. PLoS ONE 2013, 8, e61217. [Google Scholar] [CrossRef] [Green Version]
  64. Oksanen, J.; Blanchet, F.G.; Friendly, M.; Kindt, R.; Legendre, P.; McGlinn, D.; Minchin, P.R.; O’Hara, R.B.; Simpson, G.L.; Solymos, P.; et al. Vegan: Community Ecology Package, R Package Version 2.5-9; 2020. Available online: https://github.com/vegandevs/vegan (accessed on 1 November 2021).
  65. Wickham, H. Ggplot2: Elegant Graphics for Data Analysis; Springer: New York, NY, USA, 2009. [Google Scholar]
  66. Barott, K.L.; Rodriguez-Brito, B.; Janouskovec, J.; Marhaver, K.L.; Smith, J.E.; Keeling, P.; Rohwer, F.L. Microbial diversity associated with four functional groups of benthic reef algae and the reef-building coral Montastraea annularis. Environ. Microbiol. 2011, 13, 1192–1204. [Google Scholar] [CrossRef]
  67. De Mesquita, M.M.F.; Crapez, M.A.C.; Teixeira, V.L.; Cavalcanti, D.N. Potential interactions bacteria-brown algae. J. Appl. Phycol. 2019, 31, 867–883. [Google Scholar] [CrossRef]
  68. Li, J.L.; Wang, T.; Yu, S.X.; Bai, J.; Qin, S. Community characteristics and ecological roles of bacterial biofilms associated with various algal settlements on coastal reefs. J. Environ. Manag. 2019, 250, 109459. [Google Scholar] [CrossRef] [PubMed]
  69. Susilowati, R.; Sabdono, A.; Widowati, I. Isolation and characterization of bacteria associated with brown algae Sargassum sp. from Panjang Island and their antibacterial activities. Procedia Environ. Sci 2015, 23, 240–246. [Google Scholar] [CrossRef] [Green Version]
  70. Chakraborty, K.; Thilakan, B.; Chakraborty, R.D.; Raola, V.K.; Joy, M. O-heterocyclic derivatives with antibacterial properties from marine bacterium Bacillus subtilis associated with seaweed, Sargassum myriocystum. Appl. Microbiol. Biotechnol. 2017, 101, 569–583. [Google Scholar] [CrossRef] [PubMed]
  71. Bondoso, J.; Balague, V.; Gasol, J.M.; Lage, O.M. Community composition of the Planctomycetes associated with different macroalgae. FEMS Microbiol. Ecol. 2014, 88, 445–456. [Google Scholar] [CrossRef] [PubMed] [Green Version]
  72. Zaneveld, J.R.; Burkepile, D.E.; Shantz, A.A.; Pritchard, C.E.; McMinds, R.; Payet, J.P.; Welsh, R.; Correa, A.M.S.; Lemoine, N.P.; Rosales, S.; et al. Overfishing and nutrient pollution interact with temperature to disrupt coral reefs down to microbial scales. Nat. Commun. 2016, 7, 11833. [Google Scholar] [CrossRef] [PubMed]
  73. Frade, P.R.; Glasl, B.; Matthews, S.A.; Mellin, C.; Serrao, E.A.; Wolfe, K.; Mumby, P.J.; Webster, N.S.; Bourne, D.G. Spatial patterns of microbial communities across surface waters of the Great Barrier Reef. Commun. Biol. 2020, 3, 442. [Google Scholar] [CrossRef] [PubMed]
  74. Krüger, K.; Chafee, M.; Ben Francis, T.; Glavina del Rio, T.; Becher, D.; Schweder, T.; Amann, R.I.; Teeling, H. In marine Bacteroidetes the bulk of glycan degradation during algae blooms is mediated by few clades using a restricted set of genes. ISME J. 2019, 13, 2800–2816. [Google Scholar] [CrossRef] [Green Version]
  75. Dethier, M.N.; Williams, S.L. Seasonal stresses shift optimal intertidal algal habitats. Mar. Biol. 2009, 156, 555–567. [Google Scholar] [CrossRef]
  76. Gorham, J.; Lewey, S.A. Seasonal-changes in the chemical-composition of Sargassum muticum. Mar. Biol. 1984, 80, 103–107. [Google Scholar] [CrossRef]
Figure 1. Alpha diversity of Sargassum spp. biofilm samples. (a) Observed richness, estimated richness (Chao1) and Shannon index of microbial communities associated with Sargassum spp. biofilm samples collected along the annual growth-reproduction-senescence cycle. A Student’s t-test was applied to compare means of life stages (‘growth’ vs. ‘reproduction’, ‘reproduction’ vs. ‘senescence’, and ‘growth’ vs. ‘senescence’), however, no significant differences in the alpha diversity measures were observed (p-values given above brackets). (b) Percentages of shared and unique zOTUs associated with the macroalgal biofilm samples from ‘growth’, ‘reproduction’, and ‘senescence’ stages are represented as Venn diagram.
Life 11 01199 g001
Figure 2. Microbial community structure and dispersion of the Sargassum spp. biofilm. (a) Non-metric multidimensional scaling (NMDS) based on Bray–Curtis dissimilarities showing a shift in the microbial community composition along the annual growth-reproduction-senescence cycle of Sargassum spp. (b) Microbial community dispersion, measured as distance to the group centroid, indicates a higher heterogeneity in the biofilm-associated microbial community during the ‘reproduction’ stage of Sargassum spp. A Student’s t-test was performed for pairwise comparison (ns = not significant, * = p-value < 0.05, ** = p-value < 0.01; p-values given above square brackets).
Life 11 01199 g002
Figure 3. Dominant taxonomic groups associated with the biofilm of Sargassum spp. (a) Mean relative abundances of top bacterial families (mean relative abundance > 0.1%) belonging to the most dominant bacterial phyla (i.e., Bacteroidetes, Cyanobacteria, Firmicutes, and Proteobacteria) associated with the macroalgal biofilm throughout the annual growth-reproduction-senescence cycle of Sargassum spp. When bacterial family (f) is unclassified/unknown, the lowest possible taxonomic rank is given: p-phylum, c-class, o-order. (b) Total mean relative abundance of the top four bacterial phyla (i.e., Bacteroidetes, Cyanobacteria, Firmicutes, and Proteobacteria) and the two most abundant bacterial families, Bacillaceae and Flavobacteriaceae, belonging to the phyla Firmicutes and Bacteroidetes, respectively.
Life 11 01199 g003
Figure 4. Environmental factors structuring the Sargassum spp. biofilm community. (a) Distance-based redundancy analysis (db-RDA) based on Bray–Curtis dissimilarities displaying the effect of ammonium (NH4+), temperature, silica (SiO2), total suspended solids (TSS), and non-purgeable organic carbon (NPOC) on the microbial community composition of the Sargassum biofilm. (b) Spearman rank correlation of top bacterial families with fluctuations in key abiotic factors (NH4+, NPOC, temperature, TSS). Strength of correlation indicated by color gradient, with significant correlations highlighted using asterisks (* for p-value < 0.05, ** for p-value < 0.01). When bacterial family (f) is unclassified/unknown, the lowest possible taxonomic rank is given: p-phylum, c-class, o-order.
Life 11 01199 g004
Figure 5. Bacterial taxa significantly enriched with fluctuations in (a) temperature, (b) non-purgeable organic carbon (NPOC) concentrations, (c) ammonia (NH4) concentrations, and (d) total suspended solid (TSS) concentrations (from top left to bottom right). Positive values of log2-fold change indicate a significant increase in the zOTU relative abundance. FDR-adjusted p-value was set to a threshold of p-value ≤ 0.01. When bacterial family (f) is unclassified/unknown, the lowest possible taxonomic rank is given: p-phylum, c-class, o-order.
Life 11 01199 g005
Figure 6. Functional overview of metagenome-assembled genomes (MAGs) associated with the Sargassum spp. biofilm. MAGs were recovered from a subset of samples collected during the August 2016 (n = 3; senescence stage) and February 2017 (n = 3; reproduction stage) sampling occasions. Ratios indicate the number of MAGs from each bacterial phylum where at least 60% of all KEGG Orthologous (KOs) of a KEGG module were present (e.g., 1/2 = one out of two MAGs). The genomic potential to degrade algae-specific carbohydrates was assessed using the CAZy database. Glycoside Hydrolase (GH) and Polysaccharide Lyase (PL) families specialized on the degradation of fucans, alginate, and laminarin were detected. Numbers indicate GH and PL families (e.g., GH: 1); ratios indicate the number of MAGs from each bacterial phylum genomically equipped with the putative algae-degradation capability (e.g., 1/2 = one out of two). The taxonomic affiliation of MAGs is based on the Genome Taxonomy Database (GTDB).
Life 11 01199 g006
Publisher’s Note: MDPI stays neutral with regard to jurisdictional claims in published maps and institutional affiliations.

