The Relationship between the Expression of Fatty Acyl Desaturase 2 (fads2) Gene in Peripheral Blood Cells (PBCs) and Liver in Gilthead Seabream, Sparus aurata Broodstock Fed a Low n-3 LC-PUFA Diet

 ,
,  ,
,  and
and 
Abstract
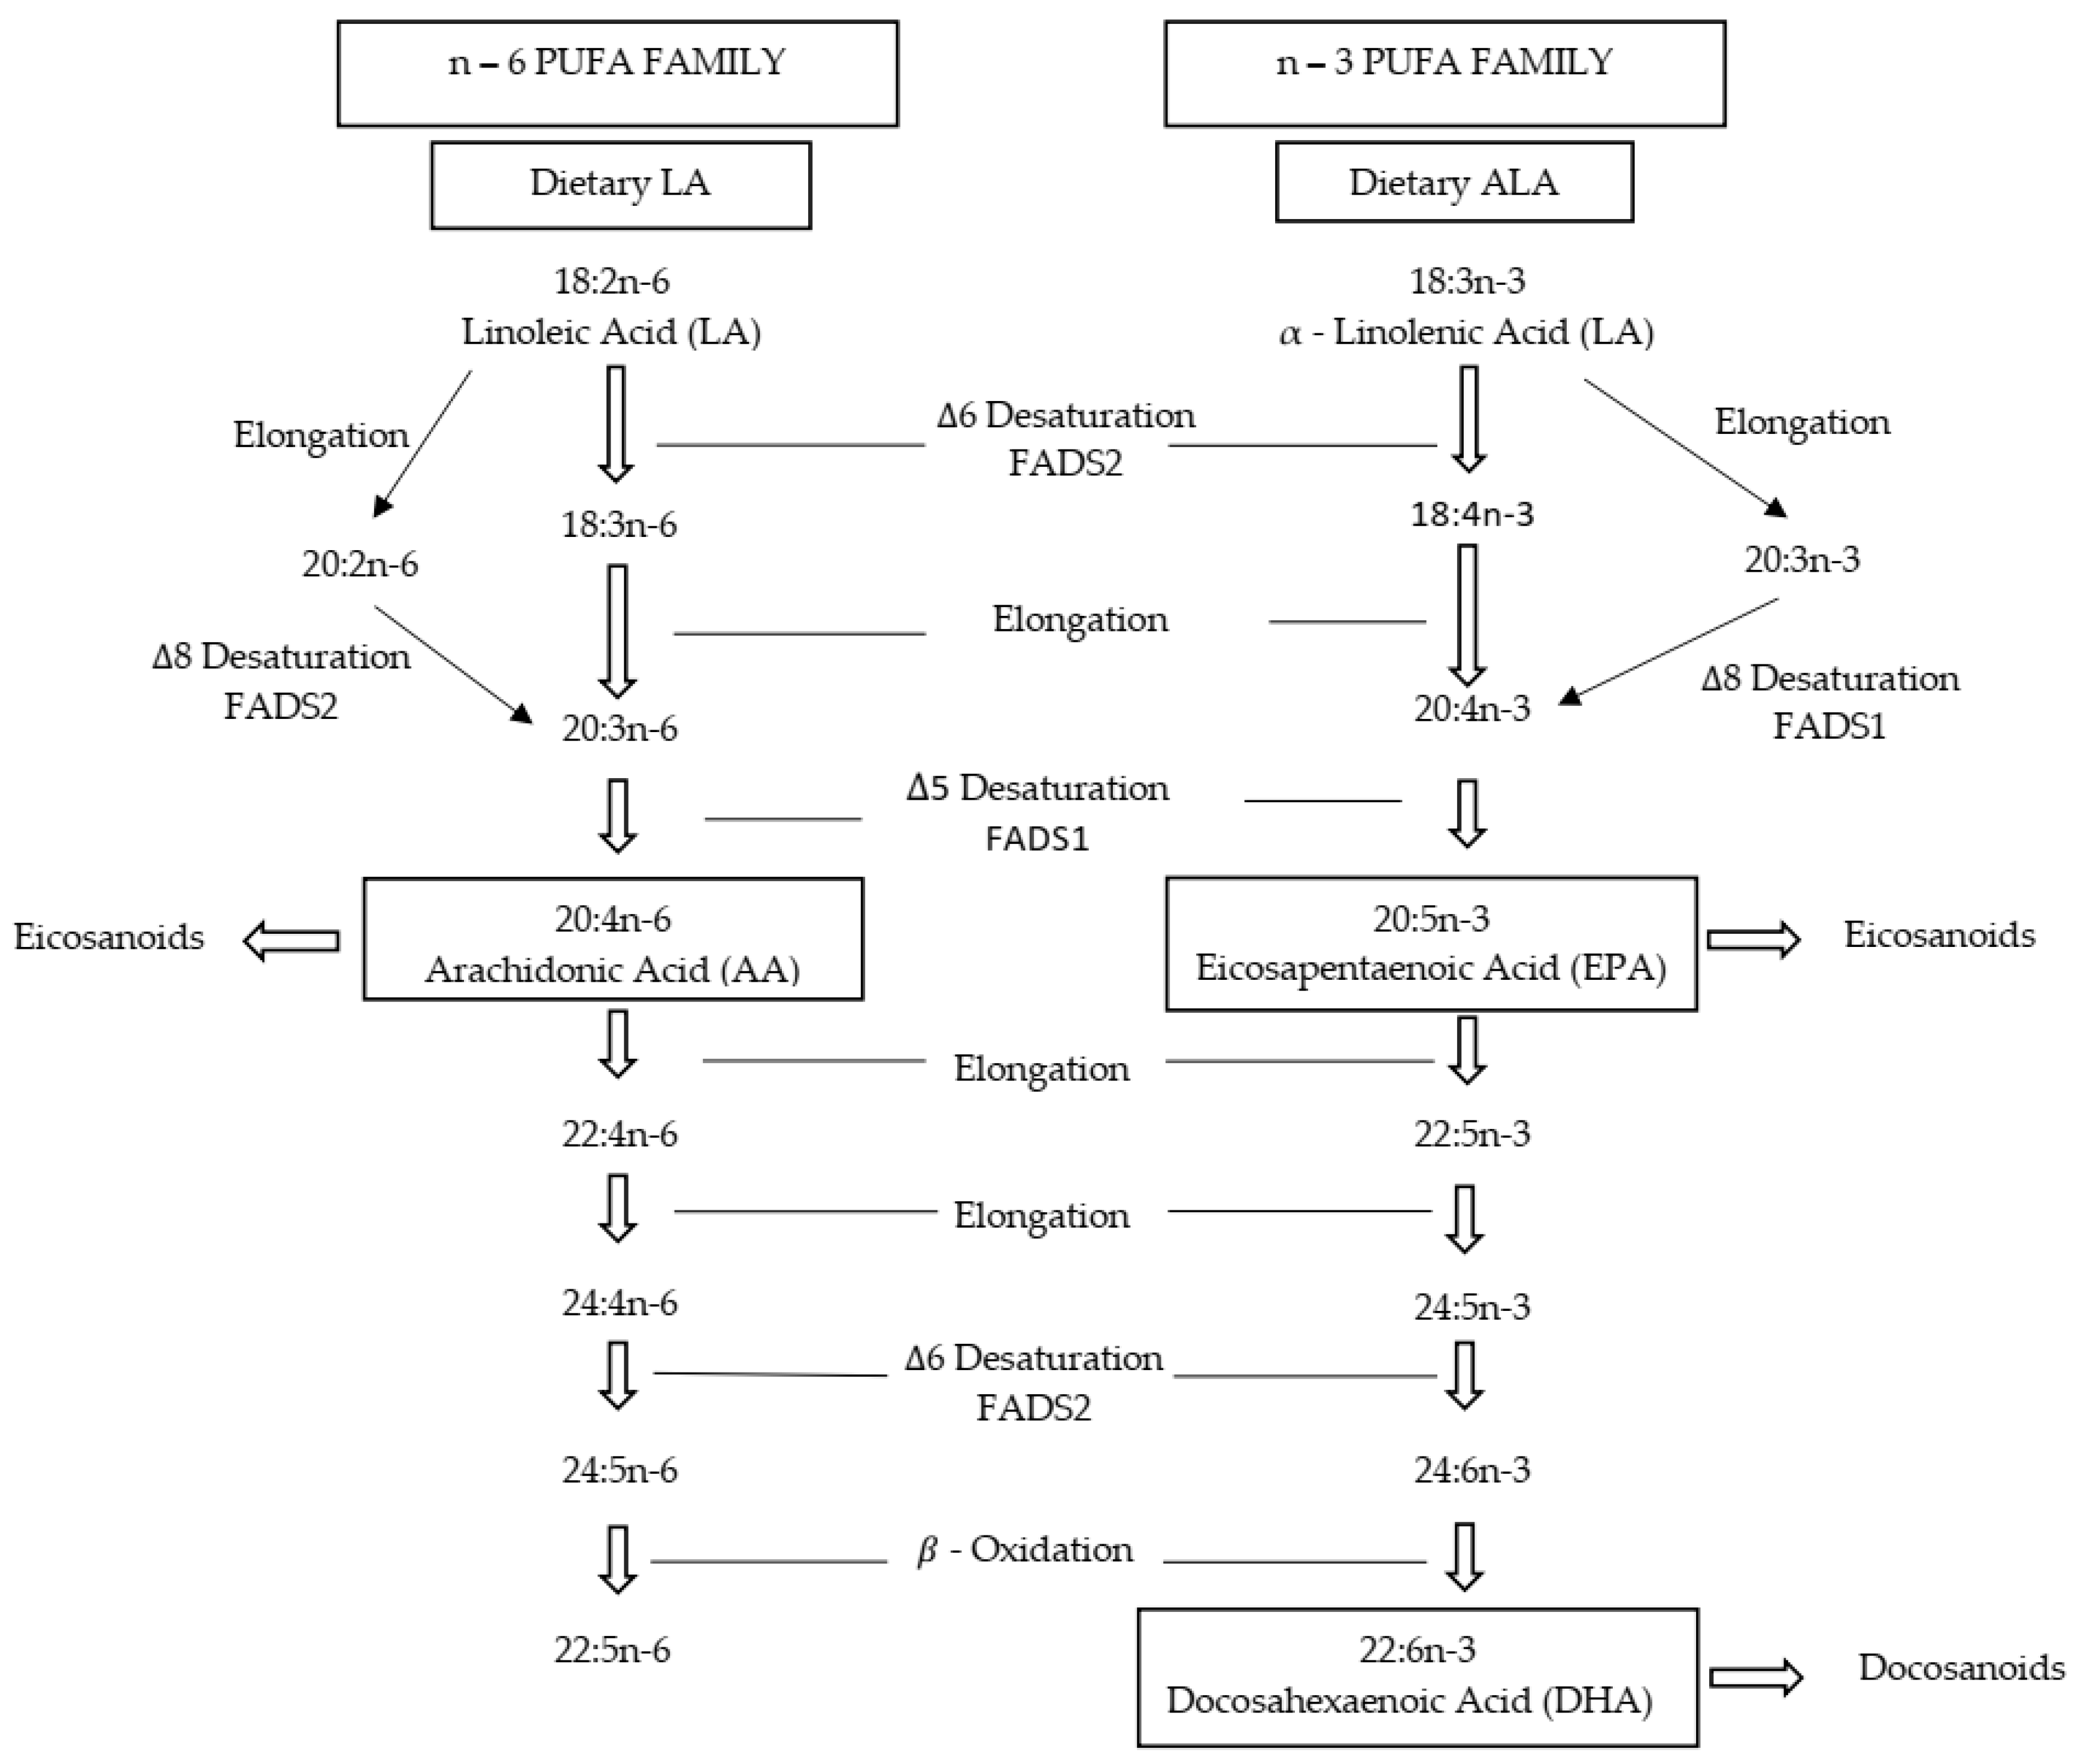
1. Introduction
2. Materials and Methods
2.1. Broodstock Management and Feeding
2.2. Blood and Liver Sample Collection and Storage
2.3. Molecular Study—RNA Extraction and cDNA Synthesis
- Gene—fads2 (Δ6 desaturase; GenBank: GQ162822.1)
- Forward primer sequence (5′ → 3′) GCAGAGCCACAGCAGCAGGGA
- Reverse sequence (3′ → 5′) CGGCCTGCGCCTGAGCAGTT
2.4. Digital Droplet PCR (ddPCR) Analysis for Absolute Gene Expression
2.5. Liver Fatty Acid Analysis
2.6. Ethical Statement
2.7. Statistical Analysis
3. Results
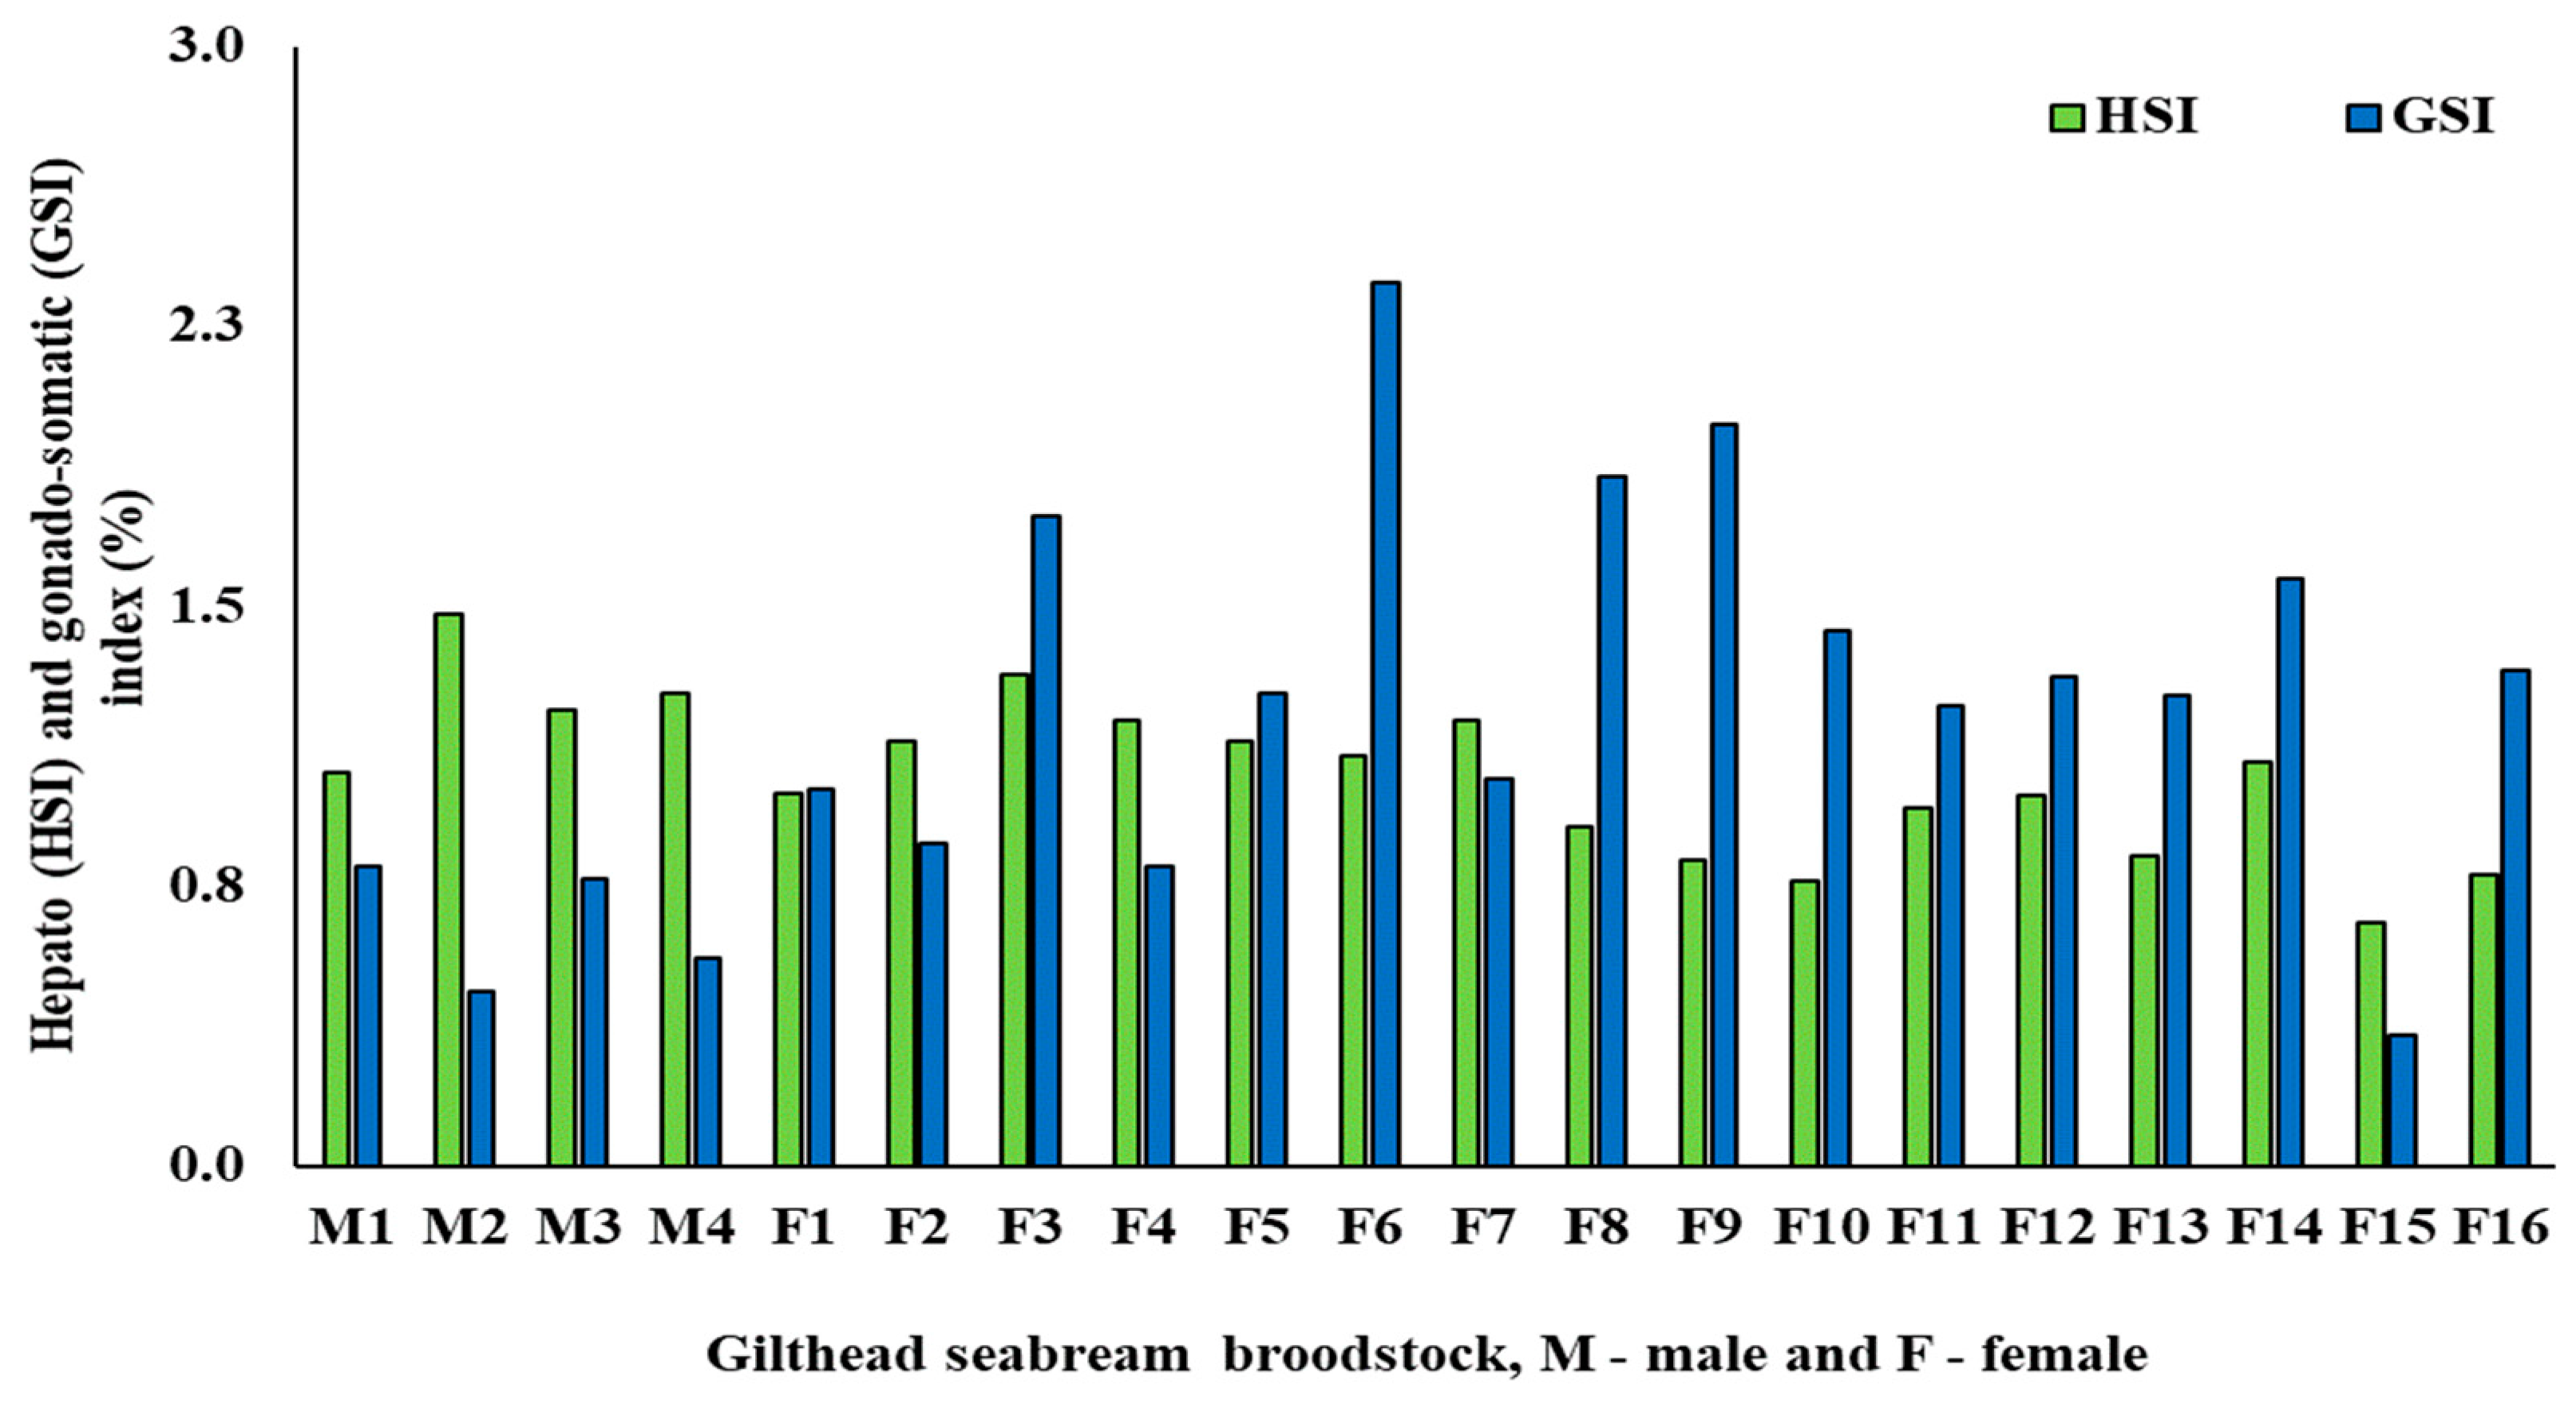
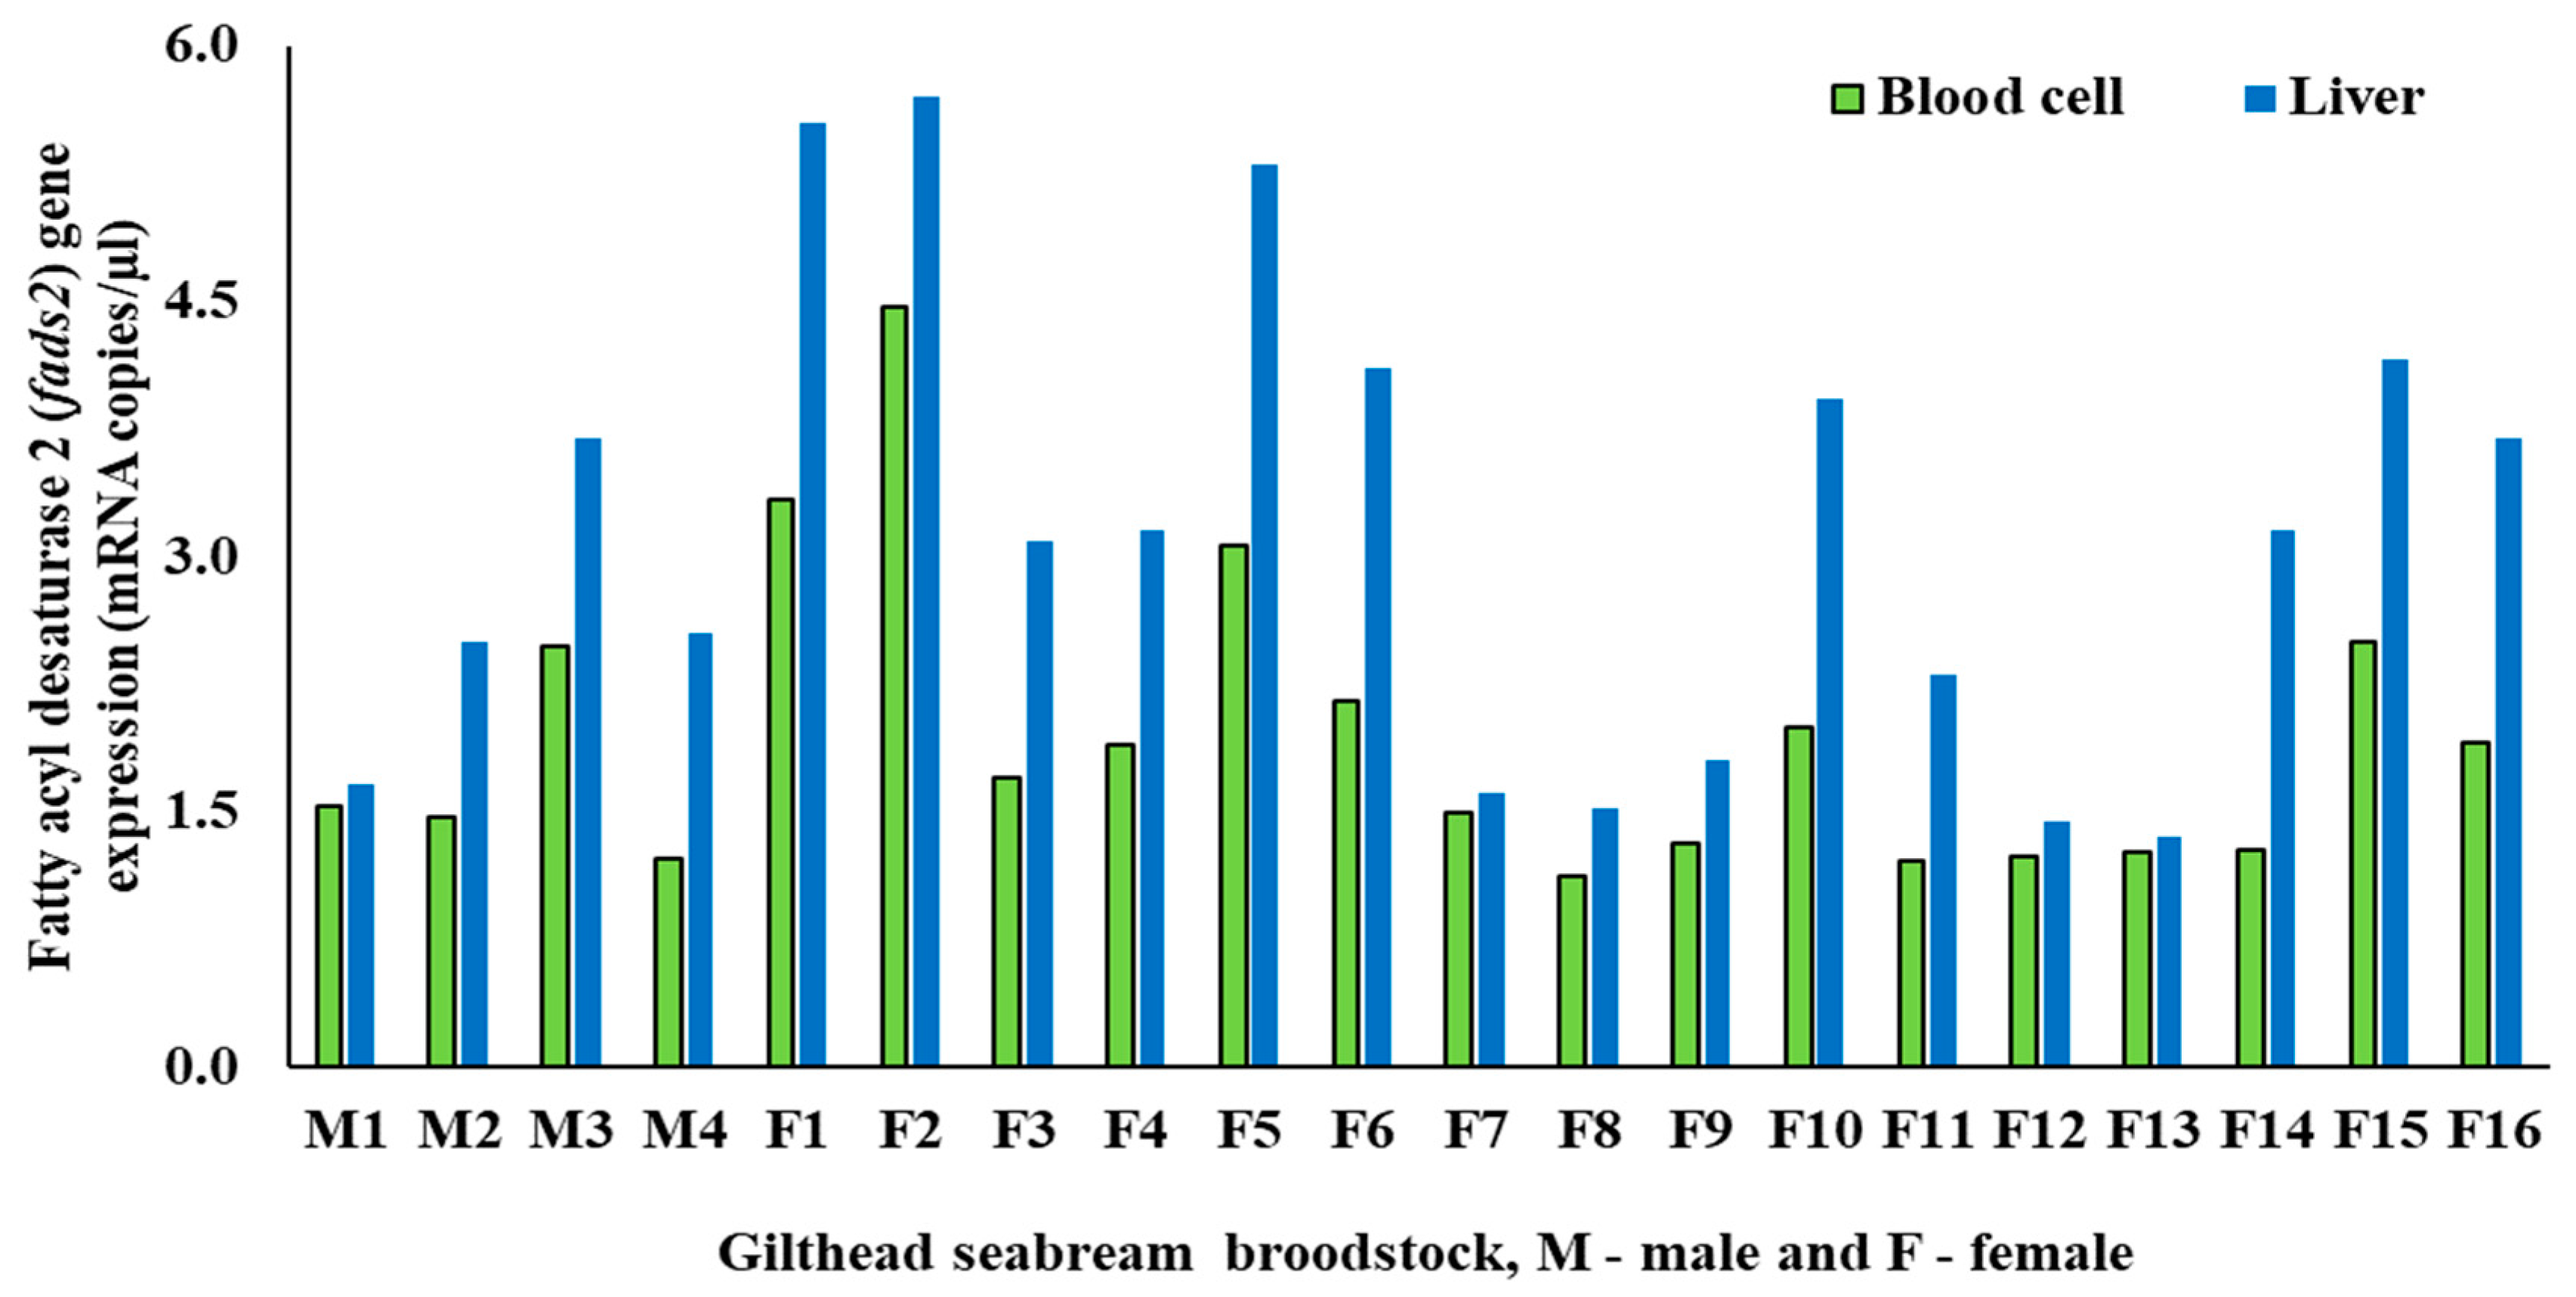
3.1. Biometric and fads2 Expression Values for Males and Females
3.2. Comparison of fads2 Expression in PBC or in Liver and Broodstock Body Weight
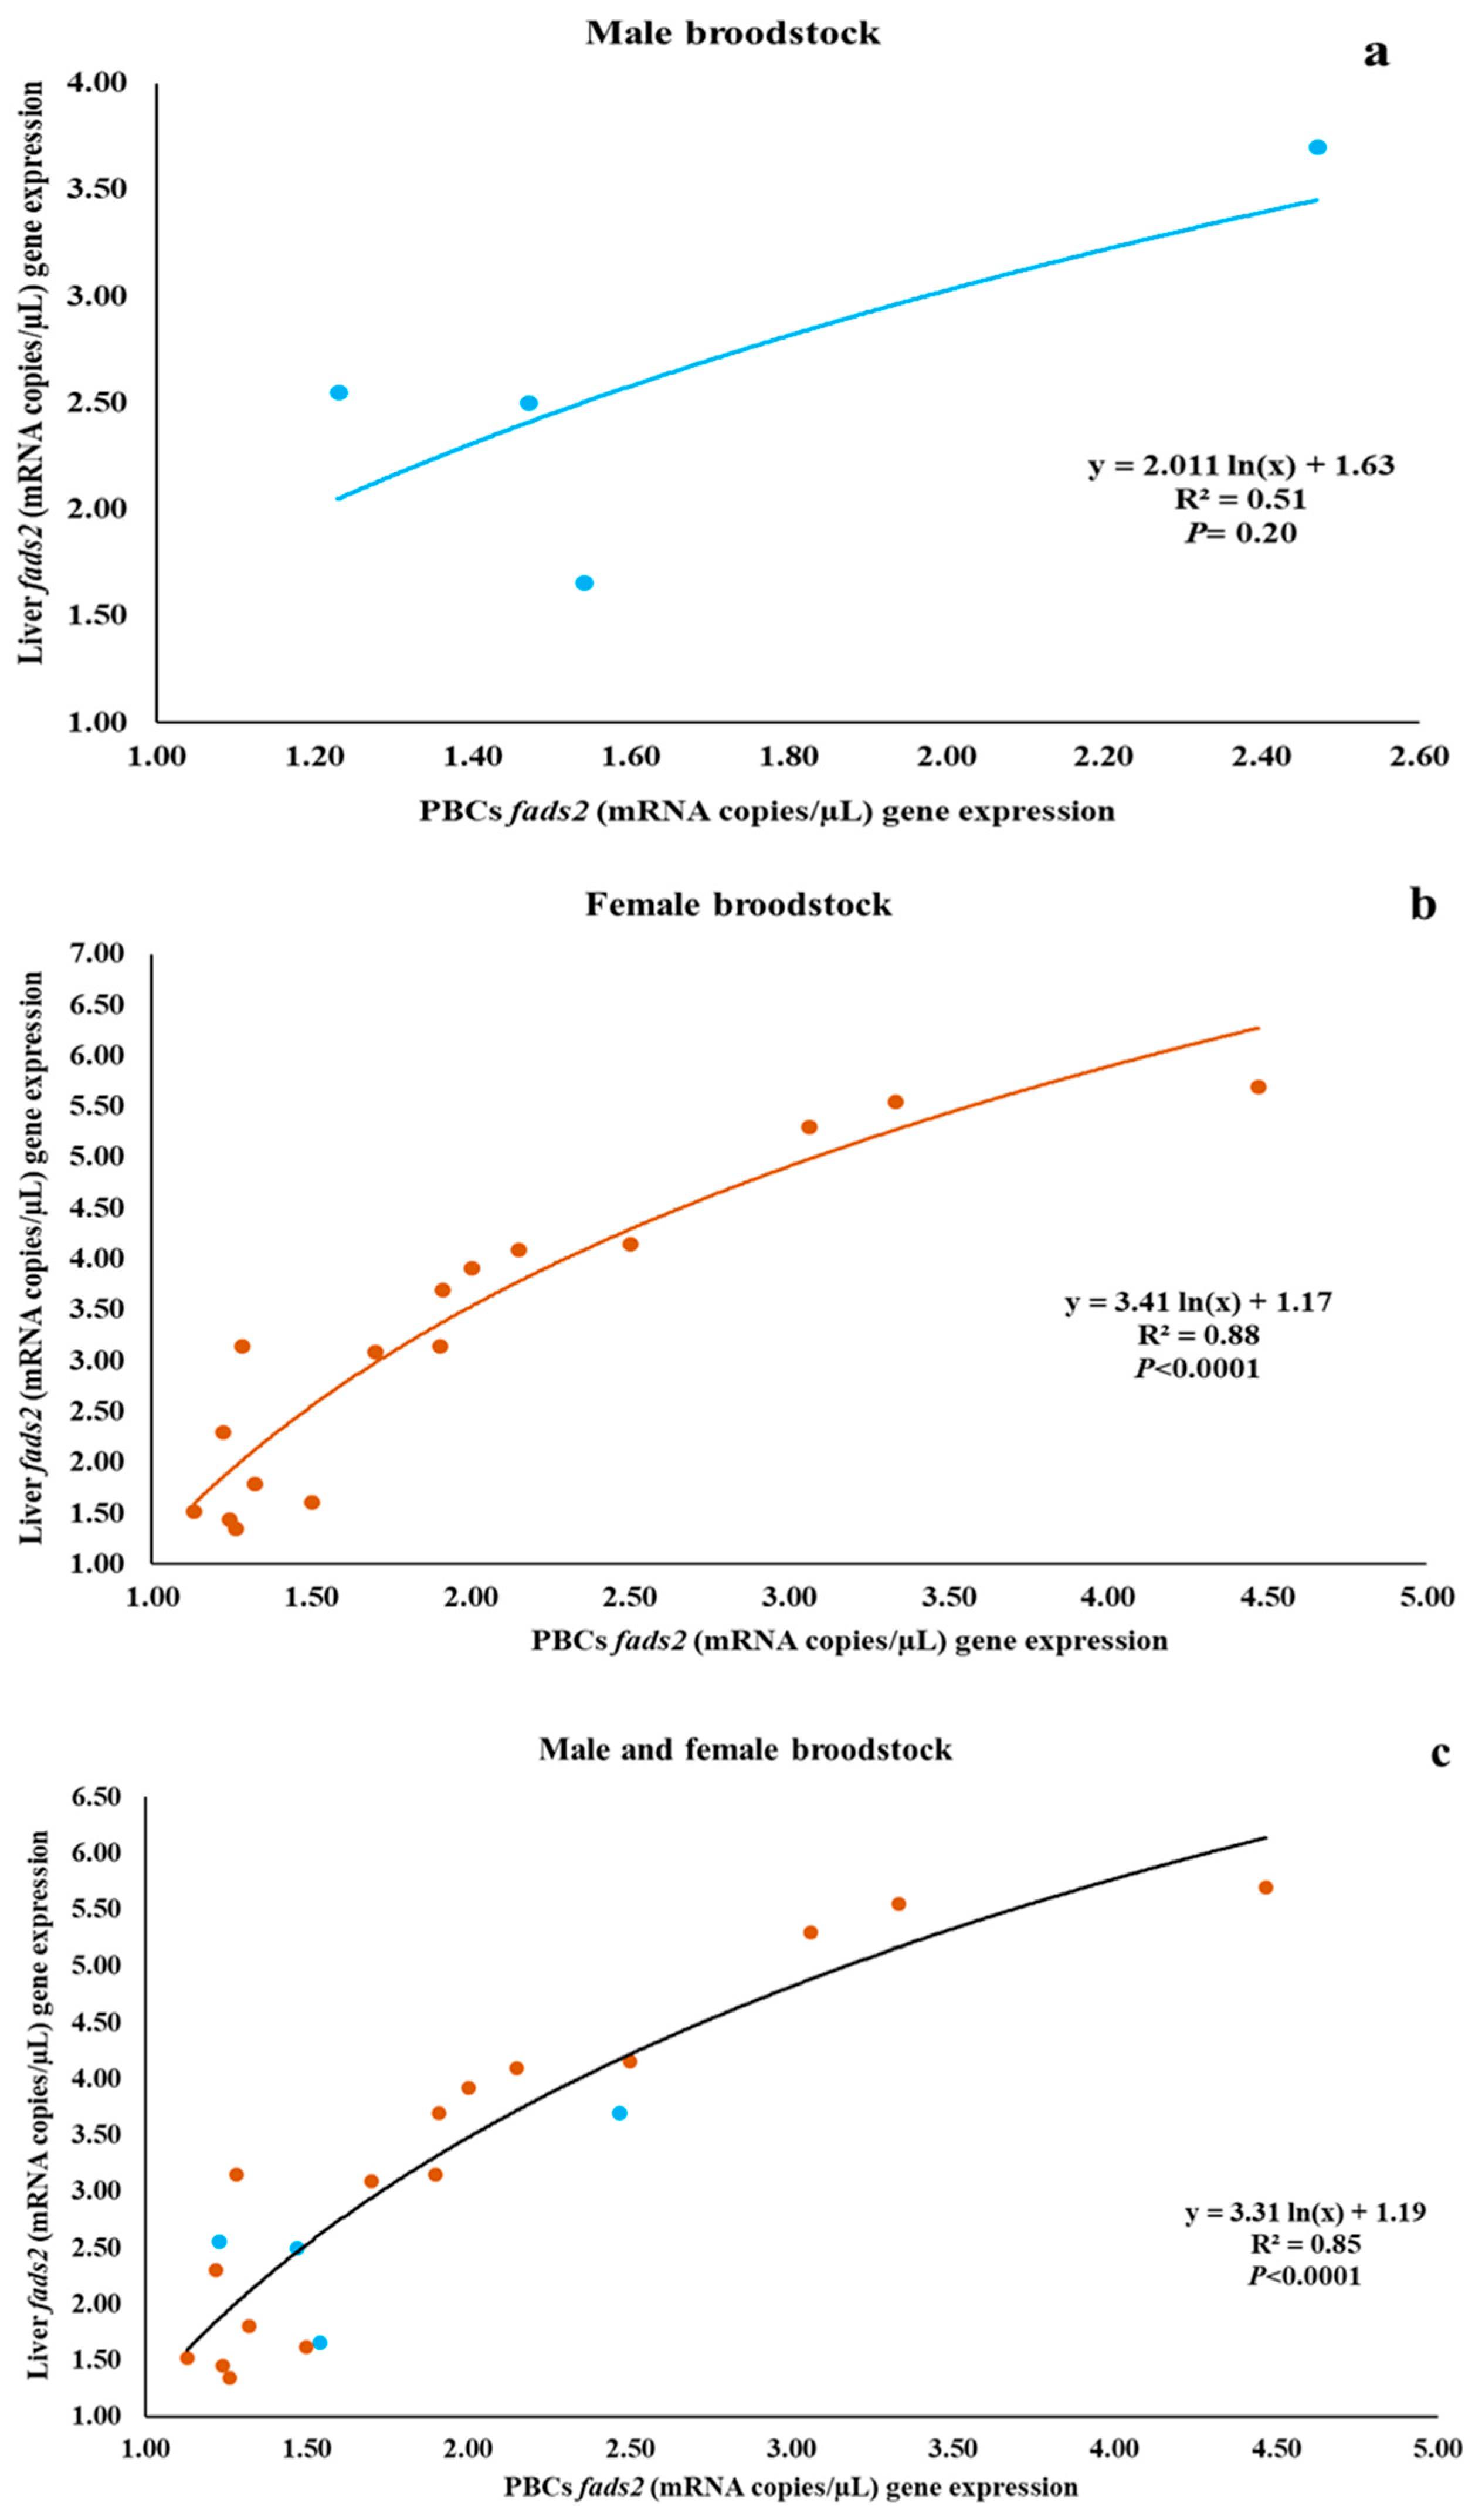
3.3. Relationship between fads2 Expression in PBCs and in Liver of Male and Female Broodstock
3.4. Fatty Acid Composition of the Liver
4. Discussion
5. Conclusions
Supplementary Materials
Author Contributions
Funding
Acknowledgments
Conflicts of Interest
Abbreviations
| ALA | linolenic acid (18:3n-3) |
| ARA | arachidonic acid (20:4n-6) |
| ddPCR | droplet digital polymerase chain reaction |
| DHA | docosahexaenoic acid (22:6n-3) |
| EPA | eicosapentaenoic acid (20:5n-3) |
| fads2 | fatty acyl desaturase 2 (gene in fish) |
| FADS | fatty acyl desaturase (enzyme in mammals) |
| Fads | fatty acyl desaturase (enzyme in fish) |
| FM | fish meal |
| FO | fish oil |
| GSB | gilthead seabream |
| HD | high fads2 expression |
| LA | linoleic acid (18:2n-6) |
| LC-PUFA | long chain polyunsaturated fatty acid |
| LD | low fads2 expression |
| PBCs | peripheral blood cells |
| TFA | total fatty acids |
References
- Monroig, O.; Li, Y.; Tocher, D.R. Delta-8 desaturation activity varies among fatty acyl desaturases of teleost fish: High activity in delta-6 desaturases of marine species. Comp. Biochem. Physiol. B 2011, 159, 206–213. [Google Scholar] [CrossRef] [PubMed]
- Monroig, Ó.; Zheng, X.; Morais, S.; Leaver, M.J.; Taggart, J.B.; Tocher, D.R. Multiple genes for functional ∆6 fatty acyl desaturases (Fad) in Atlantic salmon (Salmo salar L.): Gene and cDNA characterization, functional expression, tissue distribution and nutritional regulation. Biochim. Et Biophys. Acta (BBA)—Mol. Cell Biol. Lipids 2010, 1801, 1072–1081. [Google Scholar] [CrossRef] [PubMed]
- Oboh, A.; Kabeya, N.; Carmona-Antoñanzas, G.; Castro, L.F.C.; Dick, J.R.; Tocher, D.R.; Monroig, O. Two alternative pathways for docosahexaenoic acid (DHA, 22:6n-3) biosynthesis are widespread among teleost fish. Sci. Rep. 2017, 7, 1–10. [Google Scholar] [CrossRef] [PubMed]
- Tocher, D.R. Omega-3 long-chain polyunsaturated fatty acids and aquaculture in perspective. Aquaculture 2015, 449, 94–107. [Google Scholar] [CrossRef]
- Tocher, D.R.; Betancor, M.B.; Sprague, M.; Olsen, R.E.; Napier, J.A. Omega-3 long-chain polyunsaturated fatty acids, EPA and DHA: Bridging the gap between supply and demand. Nutrients 2019, 11, 89. [Google Scholar] [CrossRef]
- Castro, L.F.C.; Tocher, D.R.; Monroig, O. Long-chain polyunsaturated fatty acid biosynthesis in chordates: Insights into the evolution of Fads and Elovl gene repertoire. Prog. Lipid Res. 2016, 62, 25–40. [Google Scholar] [CrossRef]
- Rivers, J.P.W.; Hassam, A.G.; Crawford, M.A.; Brambell, M.R. The inability of the lion, Panthera leo L. To desaturate linoleic acid. FEBS Lett. 1976, 67, 269–270. [Google Scholar] [CrossRef]
- Li, Y.; Monroig, O.; Zhang, L.; Wang, S.; Zheng, X.; Dick, J.R.; You, C.; Tocher, D.R. Vertebrate fatty acyl desaturase with Δ4 activity. Proc. Natl. Acad. Sci. USA 2010, 107, 16840–16845. [Google Scholar] [CrossRef]
- Sprecher, H. Metabolism of highly unsaturated n-3 and n-6 fatty acids. Biochim. Et Biophys. Acta 2000, 1486, 219–231. [Google Scholar] [CrossRef]
- Kanazawa, A.; Teshima, S.-I.; Ono, K. Relationship between essential fatty acid requirements of aquatic animals and the capacity for bioconversion of linolenic acid to highly unsaturated fatty acids. Comp. Biochem. Physiol. Part B Comp. Biochem. 1979, 63, 295–298. [Google Scholar] [CrossRef]
- Castro, L.F.C.; Monroig, Ó.; Leaver, M.J.; Wilson, J.; Cunha, I.; Tocher, D.R. Functional Desaturase Fads1 (Δ5) and Fads2 (Δ6) Orthologues Evolved before the Origin of Jawed Vertebrates. PLoS ONE 2012, 7, e31950. [Google Scholar] [CrossRef]
- Geay, F.; Zambonino-Infante, J.; Reinhardt, R.; Kuhl, H.; Santigosa, E.; Cahu, C.; Mazurais, D. Characteristics of fads2 gene expression and putative promoter in European sea bass (Dicentrarchus labrax): Comparison with salmonid species and analysis of CpG methylation. Mar. Genom. 2012, 5, 7–13. [Google Scholar] [CrossRef] [PubMed][Green Version]
- Zheng, X.; Leaver, M.J.; Tocher, D.R. Long-chain polyunsaturated fatty acid synthesis in fish: Comparative analysis of Atlantic salmon (Salmo salar L.) and Atlantic cod (Gadus morhua L.) Δ6 fatty acyl desaturase gene promoters. Comp. Biochem. Physiol.—B Biochem. Mol. Biol. 2009, 154, 255–263. [Google Scholar] [CrossRef] [PubMed]
- Kabeya, N.; Fonseca, M.M.; Ferrier, D.E.K.; Navarro, J.C.; Bay, L.K.; Francis, D.S.; Tocher, D.R.; Castro, L.F.C.; Monroig, Ó. Genes for de novo biosynthesis of omega-3 polyunsaturated fatty acids are widespread in animals. Sci. Adv. 2018, 4, 1–8. [Google Scholar] [CrossRef] [PubMed]
- Park, H.G.; Park, W.J.; Kothapalli, K.S.D.; Brenna, J.T. The fatty acid desaturase 2 (FADS2) gene product catalyzes Δ4 desaturation to yield n-3 docosahexaenoic acid and n-6 docosapentaenoic acid in human cells. FASEB J. 2015, 29, 3911–3919. [Google Scholar] [CrossRef]
- Hastings, N.; Agaba, M.; Tocher, D.R.; Leaver, M.J.; Dick, J.R.; Sargent, J.R.; Teale, A.J. A vertebrate fatty acid desaturase with Δ5 and Δ6 activities. Proc. Natl. Acad. Sci. USA 2001, 98, 14304–14309. [Google Scholar] [CrossRef]
- Izquierdo, M.; Robaina, L.; Juárez-Carrillo, E.; Oliva, V.; Hernández-Cruz, C.M.; Afonso, J.M. Regulation of growth, fatty acid composition and delta 6 desaturase expression by dietary lipids in gilthead seabream larvae (Sparus aurata). Fish Physiol. Biochem. 2008, 34, 117–127. [Google Scholar] [CrossRef]
- Seiliez, I.; Panserat, S.; Corraze, G.; Kaushik, S.; Bergot, P. Cloning and nutritional regulation of a Δ6-desaturase-like enzyme in the marine teleost gilthead seabream (Sparus aurata). Comp. Biochem. Physiol. Part B: Biochem. Mol. Biol. 2003, 135, 449–460. [Google Scholar] [CrossRef]
- Zheng, X.; Seiliez, I.; Hastings, N.; Tocher, D.R.; Panserat, S.; Dickson, C.A.; Bergot, P.; Teale, A.J. Characterization and comparison of fatty acyl Δ6 desaturase cDNAs from freshwater and marine teleost fish species. Comp. Biochem. Physiol. B 2004, 139, 269–279. [Google Scholar] [CrossRef]
- Vagner, M.; Santigosa, E. Characterization and modulation of gene expression and enzymatic activity of delta-6 desaturase in teleosts: A review. Aquaculture 2011, 315, 131–143. [Google Scholar] [CrossRef]
- González-Rovira, A.; Mourente, G.; Zheng, X.; Tocher, D.R.; Pendón, C. Molecular and functional characterization and expression analysis of a Δ6 fatty acyl desaturase cDNA of European Sea Bass (Dicentrarchus labrax L.). Aquaculture 2009, 298, 90–100. [Google Scholar] [CrossRef]
- Santigosa, E.; Geay, F.; Tonon, T.; Delliou, H.L.; Kuhl, H.; Reinhardt, R.; Corcos, L.; Cahu, C.; Zambonino-Infante, J.L.; Mazurais, D. Cloning, Tissue Expression Analysis, and Functional Characterization of Two Δ6-Desaturase Variants of Sea Bass (Dicentrarchus labrax L.). Mar. Biotechnol. 2011, 13, 22–31. [Google Scholar] [CrossRef] [PubMed][Green Version]
- Kim, S.H.; Kim, J.B.; Kim, S.Y.; Roh, K.H.; Kim, H.U.; Lee, K.R.; Jang, Y.S.; Kwon, M.; Park, J.S. Functional characterization of a delta 6-desaturase gene from the black seabream (Acanthopagrus schlegeli). Biotechnol. Lett. 2011, 33, 1185–1193. [Google Scholar] [CrossRef] [PubMed]
- Monroig, Ó.; Tocher, D.R.; Hontoria, F.; Navarro, J.C. Functional characterisation of a Fads2 fatty acyl desaturase with Δ6/Δ8 activity and an Elovl5 with C16, C18 and C20 elongase activity in the anadromous teleost meagre (Argyrosomus regius). Aquaculture 2013, 412–413, 14–22. [Google Scholar] [CrossRef]
- Li, S.; Mai, K.; Xu, W.; Yuan, Y.; Zhang, Y.; Ai, Q. Characterization, mRNA expression and regulation of Δ6 fatty acyl desaturase (FADS2) by dietary n—3 long chain polyunsaturated fatty acid (LC-PUFA) levels in grouper larvae (Epinephelus coioides). Aquaculture 2014, 434, 212–219. [Google Scholar] [CrossRef]
- Kabeya, N.; Yamamoto, Y.; Cummins, S.F.; Elizur, A.; Yazawa, R.; Takeuchi, Y.; Haga, Y.; Satoh, S.; Yoshizaki, G. Polyunsaturated fatty acid metabolism in a marine teleost, Nibe croaker Nibea mitsukurii: Functional characterization of Fads2 desaturase and Elovl5 and Elovl4 elongases. Comp. Biochem. Physiol. Part—B Biochem. Mol. Biol. 2015, 188, 37–45. [Google Scholar] [CrossRef]
- Lim, Z.L.; Senger, T.; Vrinten, P. Four amino acid residues influence the substrate chain-length and regioselectivity of siganus canaliculatus δ4 and δ5/6 desaturases. Lipids 2014, 49, 357–367. [Google Scholar] [CrossRef]
- Zheng, X.; Tocher, D.R.; Dickson, C.A.; Bell, J.G.; Teale, A.J. Highly unsaturated fatty acid synthesis in vertebrates: New insights with the cloning and characterization of a Δ6 desaturase of atlantic salmon. Lipids 2005, 40, 13–24. [Google Scholar] [CrossRef]
- Tocher, D.R.; Zheng, X.; Schlechtriem, C.; Hastings, N.; Dick, J.R.; Teale, A.J. Highly unsaturated fatty acid synthesis in marine fish: Cloning, functional characterization, and nutritional regulation of fatty acyl Δ6 desaturase of Atlantic cod (Gadus morhua L.). Lipids 2006, 41, 1003–1016. [Google Scholar] [CrossRef]
- Izquierdo, M.S.; Turkmen, S.; Montero, D.; Zamorano, M.J.; Afonso, J.M.; Karalazos, V.; Fernández-Palacios, H. Nutritional programming through broodstock diets to improve utilization of very low fishmeal and fish oil diets in gilthead sea bream. Aquaculture 2015, 449, 18–26. [Google Scholar] [CrossRef]
- Turkmen, S.; Perera, E.; Zamorano, M.J.; Simó-Mirabet, P.; Xu, H.; Pérez-Sánchez, J.; Izquierdo, M. Effects of Dietary Lipid Composition and Fatty Acid Desaturase 2 Expression in Broodstock Gilthead Sea Bream on Lipid Metabolism-Related Genes and Methylation of the fads2 Gene Promoter in Their Offspring. Int. J. Mol. Sci. 2019, 20, 6250. [Google Scholar] [CrossRef] [PubMed]
- Turkmen, S.; Zamorano, M.J.; Fernández-Palacios, H.; Hernández-Cruz, C.M.; Montero, D.; Robaina, L.; Izquierdo, M. Parental nutritional programming and a reminder during juvenile stage affect growth, lipid metabolism and utilisation in later developmental stages of a marine teleost, the gilthead sea bream (Sparus aurata). Br. J. Nutr. 2017, 118, 500–512. [Google Scholar] [CrossRef]
- Xu, H.; Turkmen, S.; Rimoldi, S.; Terova, G.; Zamorano, M.J.; Afonso, J.M.; Sarih, S.; Fernández-Palacios, H.; Izquierdo, M. Nutritional intervention through dietary vegetable proteins and lipids to gilthead sea bream (Sparus aurata) broodstock affects the offspring utilization of a low fishmeal/fish oil diet. Aquaculture 2019, 513, 734402. [Google Scholar] [CrossRef]
- Tocher, D.R. Metabolism and functions of lipids and fatty acids in teleost fish. Rev. Fish. Sci. 2003, 11, 107–184. [Google Scholar] [CrossRef]
- Halloran, J.W.; Zhu, D.; Qian, D.C.; Byun, J.; Gorlova, O.Y.; Amos, C.I.; Gorlov, I.P. Prediction of the gene expression in normal lung tissue by the gene expression in blood. BMC Med Genom. 2015, 8, 1–6. [Google Scholar] [CrossRef] [PubMed]
- Hasan, F.; Yadav, V.; Katiyar, T.; Yadav, S.; Pandey, R.; Mehrotra, D.; Hadi, R.; Singh, S.; Bhatt, M.L.B.; Parmar, D. Validation of gene expression profiles of candidate genes using low density array in peripheral blood of tobacco consuming head and neck cancer patients and auto/taxi drivers with preneoplastic lesions. Genomics 2020, 112, 513–519. [Google Scholar] [CrossRef] [PubMed]
- Liew, C.C.; Ma, J.; Tang, H.C.; Zheng, R.; Dempsey, A.A. The peripheral blood transcriptome dynamically reflects system wide biology: A potential diagnostic tool. J. Lab. Clin. Med. 2006, 147, 126–132. [Google Scholar] [CrossRef]
- Palmer, N.P.; Silvester, J.A.; Lee, J.J.; Beam, A.L.; Fried, I.; Valtchinov, V.I.; Rahimov, F.; Kong, S.W.; Ghodoussipour, S.; Hood, H.C.; et al. Concordance between gene expression in peripheral whole blood and colonic tissue in children with inflammatory bowel disease. PLoS ONE 2019, 14, 1–14. [Google Scholar] [CrossRef]
- Martos-Sitcha, J.A.; Simó-Mirabet, P.; de las Heras, V.; Calduch-Giner, J.À.; Pérez-Sánchez, J. Tissue-Specific Orchestration of Gilthead Sea Bream Resilience to Hypoxia and High Stocking Density. Front. Physiol. 2019, 10, 1–18. [Google Scholar] [CrossRef]
- Reynolds, L.M.; Howard, T.D.; Ruczinski, I.; Kanchan, K.; Seeds, M.C.; Mathias, R.A.; Chilton, F.H. Tissue-specific impact of FADS cluster variants on FADS1 and FADS2 gene expression. PLoS ONE 2018, 13, e0194610. [Google Scholar] [CrossRef]
- Xu, H.; Dong, X.; Ai, Q.; Mai, K.; Xu, W.; Zhang, Y.; Zuo, R. Regulation of Tissue LC-PUFA Contents, Δ6 Fatty Acyl Desaturase (FADS2) Gene Expression and the Methylation of the Putative FADS2 Gene Promoter by Different Dietary Fatty Acid Profiles in Japanese Seabass (Lateolabrax japonicus). PLoS ONE 2014, 9, e87726. [Google Scholar] [CrossRef] [PubMed]
- Zhu, K.C.; Song, L.; Guo, H.Y.; Guo, L.; Zhang, N.; Liu, B.S.; Jiang, S.G.; Zhang, D.C. Identification of fatty acid desaturase 6 in golden pompano Trachinotus ovatus (Linnaeus 1758) and its regulation by the PPARαb transcription factor. Int. J. Mol. Sci. 2019, 20, 23. [Google Scholar] [CrossRef] [PubMed]
- Turkmen, S.; Hernández-Cruz, C.M.; Zamorano, M.J.; Fernández-Palacios, H.; Montero, D.; Afonso, J.M.; Izquierdo, M. Long-chain PUFA profiles in parental diets induce long-term effects on growth, fatty acid profiles, expression of fatty acid desaturase 2 and selected immune system-related genes in the offspring of gilthead seabream. Br. J. Nutr. 2019, 122, 25–38. [Google Scholar] [CrossRef] [PubMed]
- Bakewell, L.; Burdge, G.C.; Calder, P.C. Polyunsaturated fatty acid concentrations in young men and women consuming their habitual diets. Br. J. Nutr. 2006, 96, 93. [Google Scholar] [CrossRef]
- Childs, C.E.; Hoile, S.P.; Burdge, G.C.; Calder, P.C. Changes in rat n-3 and n-6 fatty acid composition during pregnancy are associated with progesterone concentrations and hepatic FADS2 expression. Prostaglandins Leukot. Essent. Fat. Acids 2012, 86, 141–147. [Google Scholar] [CrossRef] [PubMed]
- Childs, C.E.; Romeu-Nadal, M.; Burdge, G.C.; Calder, P.C. The Polyunsaturated Fatty Acid Composition of Hepatic and Plasma Lipids Differ by Both Sex and Dietary Fat Intake in Rats. J. Nutr. 2010, 140, 245–250. [Google Scholar] [CrossRef]
- Childs, C.E.; Romijn, T.; Enke, U.; Hoile, S.; Calder, P.C. Maternal diet during pregnancy has tissue-specific effects upon fetal fatty acid composition and alters fetal immune parameters. Prostaglandins Leukot. Essent. Fat. Acids 2010, 83, 179–184. [Google Scholar] [CrossRef]
- Torrecillas, S.; Robaina, L.; Caballero, M.J.; Montero, D.; Calandra, G.; Mompel, D.; Karalazos, V.; Kaushik, S.; Izquierdo, M.S. Combined replacement of fishmeal and fish oil in European sea bass (Dicentrarchus labrax): Production performance, tissue composition and liver morphology. Aquaculture 2017, 474, 101–112. [Google Scholar] [CrossRef]
- Folch, J.; Lees, M.; Stanley, G.S. A simple method for the isolation and purification of total lipides from animal tissues. J. Biol. Chem. 1957, 226, 497–509. [Google Scholar]
- Christie, W.W. A simple procedure for rapid transmethylation of glycerolipids and cholesteryl esters. J. Lipid Res. 1982, 23, 1072–1075. [Google Scholar]
- Izquierdo, M.S.; Watanabe, T.; Takeuchi, T.; Arakawa, T.; Kitajima, C. Optimum EFA levels in Artemia to meet the EFA requirements of red sea bream (Pagrus major). In Proceedings of the Third International Symposium on Feeding and Nutrition in Fish, Toba, Japan, 28 August–1 September 1990; pp. 221–232. [Google Scholar]
- Hoile, S.P.; Irvine, N.A.; Kelsall, C.J.; Sibbons, C.; Feunteun, A.; Collister, A.; Torrens, C.; Calder, P.C.; Hanson, M.A.; Lillycrop, K.A.; et al. Maternal fat intake in rats alters 20:4n-6 and 22:6n-3 status and the epigenetic regulation of Fads2 in offspring liver. J. Nutr. Biochem. 2013, 24, 1213–1220. [Google Scholar] [CrossRef] [PubMed]
- Niculescu, M.D.; Lupu, D.S.; Craciunescu, C.N. Perinatal manipulation of α-linolenic acid intake induces epigenetic changes in maternal and offspring livers. FASEB J. 2013, 27, 350–358. [Google Scholar] [CrossRef] [PubMed]
- Burdge, G.C.; Calder, P.C. Conversion of α-linolenic acid to longer-chain polyunsaturated fatty acids in human adults. Reprod. Nutr. Dev. 2005, 45, 581–597. [Google Scholar] [CrossRef]
- Chalil, A.; Kitson, A.P.; Henao, J.J.A.; Marks, K.A.; Elzinga, J.L.; Lamontagne-Kam, D.M.; Chalil, D.; Badoud, F.; Mutch, D.M.; Stark, K.D. PEMT, Δ6 desaturase, and palmitoyldocosahexaenoyl phosphatidylcholine are increased in rats during pregnancy. J. Lipid Res. 2018, 59, 123–136. [Google Scholar] [CrossRef] [PubMed]
- Kitson, A.P.; Marks, K.A.; Shaw, B.; Mutch, D.M.; Stark, K.D. Treatment of ovariectomized rats with 17β-estradiol increases hepatic delta-6 desaturase enzyme expression and docosahexaenoic acid levels in hepatic and plasma phospholipids. ProstaglandinsLeukot. Essent. Fat. Acids 2013, 89, 81–88. [Google Scholar] [CrossRef] [PubMed]
- Arukwe, A.; Goksøyr, A. Eggshell and egg yolk proteins in fish: Hepatic proteins for the next generation: Oogenetic, population, and evolutionary implications of endocrine disruption. Comp. Hepatol. 2003, 2, 4. [Google Scholar] [CrossRef] [PubMed]
- Chaoui, L.; Kara, M.H.; Faure, E.; Quignard, J.P. Growth and reproduction of the gilthead seabream Sparus aurata in Mellah lagoon (north-eastern Algeria). Sci. Mar. 2006, 70, 545–552. [Google Scholar] [CrossRef]
- Kissil, G.W.; Lupatsch, I.; Elizur, A.; Zohar, Y. Long photoperiod delayed spawning and increased somatic growth in gilthead seabream (Sparus aurata). Aquaculture 2001, 200, 363–379. [Google Scholar] [CrossRef]
- Zohar, Y.; Abraham, M.; Gordin, H. The gonadal cycle of the captivity-reared hermaphroditic teleost Sparus aurata (L.) during the first two years of life. Ann. De Biol. Anim. Biochim. Biophys. 1978, 18, 877–882. [Google Scholar] [CrossRef]
- Houston, S.J.; Karalazos, V.; Tinsley, J.; Betancor, M.B.; Martin, S.A.; Tocher, D.R.; Monroig, O. The compositional and metabolic responses of gilthead seabream (Sparus aurata) to a gradient of dietary fish oil and associated n-3 long-chain PUFA content. Br. J. Nutr. 2017, 118, 1010–1022. [Google Scholar] [CrossRef]
- Fernández-Palacios, H.; Izquierdo, M.S.; Robaina, L.; Valencia, A.; Salhi, M.; Vergara, J.M. Effect of n-3 HUFA level in broodstock diets on egg quality of gilthead sea bream (Sparus aurata L.). Aquaculture 1995, 132, 325–338. [Google Scholar]
- Harel, M.; Tandler, A.; Kissil, G.W.; Applebaum, S.W. The kinetics of nutrient incorporation into body tissues of gilthead seabream (Sparus aurata) females and the subsequent effects on egg composition and egg quality. Br. J. Nutr. 1994, 72, 45–58. [Google Scholar] [CrossRef] [PubMed]
- Izquierdo, M.S. Essential fatty acid requirements of cultured marine fish larvae. Aquac. Nutr. 1996, 2, 183–191. [Google Scholar] [CrossRef]
- Izquierdo, M.S.; Fernández-Palacios, H.; Tacon, A.G.J. Effect of broodstock nutrition on reproductive performance of fish. Aquaculture 2001, 197, 25–42. [Google Scholar] [CrossRef]
- Mazorra, C.; Bruce, M.; Bell, J.G.; Davie, A.; Alorend, E.; Jordan, N.; Rees, J.; Papanikos, N.; Porter, M.; Bromage, N. Dietary lipid enhancement of broodstock reproductive performance and egg and larval quality in Atlantic halibut (Hippoglossus hippoglossus). Aquaculture 2003, 227, 21–33. [Google Scholar] [CrossRef]
- Stacey, N.; Goetz, F.W. Role of prostaglandins in fish reproduction. Can. J. Fish. Aquat. Sci. 1982, 39, 92–98. [Google Scholar] [CrossRef]
- Chaves-Pozo, E.; Arjona, F.; García-López, A.; García-Alcázar, A.; Meseguer, J.; García-Ayala, A. Sex steroids and metabolic parameter levels in a seasonal breeding fish (Sparus aurata L.). Gen. Comp. Endocrinol. 2008, 156, 531–536. [Google Scholar] [CrossRef]
- Firat, K.; Saka, Ş.; Süzer, C. Gonadal oocyte development in LHRHa hormone treated European sea bass (Dicentrarchus labrax L., 1758) Broodstock. Turk. J. Vet. Anim. Sci. 2005, 29, 83–87. [Google Scholar]
- Migaud, H.; Bell, G.; Cabrita, E.; McAndrew, B.; Davie, A.; Bobe, J.; Herraez, M.P.; Carrillo, M. Gamete quality and broodstock management in temperate fish. Rev. Aquac. 2013, 5, S194–S223. [Google Scholar] [CrossRef]
- Chapman, C.; Morgan, L.M.; Murphy, M.C. Maternal and early dietary fatty acid intake: Changes in lipid metabolism and liver enzymes in adult rats. J. Nutr. 2000, 130, 146–151. [Google Scholar] [CrossRef]
- Dupont, J.; Mathias, M.M.; Cabacungan, N.B. Dietary lipid, fatty acid synthesis and cholesterol metabolism in aging rats. Lipids 1972, 7, 576–589. [Google Scholar] [CrossRef] [PubMed]
- Hood, R. Changes in fatty acid synthesis associated with growth and fattening. Proc. Nutr. Soc. 1983, 42, 303–313. [Google Scholar] [CrossRef] [PubMed]
- Nogalska, A.; Swierczynski, J. The age-related differences in obese and fatty acid synthase gene expression in white adipose tissue of rat. Biochim. Et Biophys. Acta (BBA)-Mol. Cell Biol. Lipids 2001, 1533, 73–80. [Google Scholar] [CrossRef]
- Izquierdo, M.; Montero, D.; Robaina, L.; Caballero, M.; Rosenlund, G.; Ginés, R. Alterations in fillet fatty acid profile and flesh quality in gilthead seabream (Sparus aurata) fed vegetable oils for a long term period. Recovery of fatty acid profiles by fish oil feeding. Aquaculture 2005, 250, 431–444. [Google Scholar] [CrossRef]
- Hofacer, R.; Jandacek, R.; Rider, T.; Tso, P.; Magrisso, I.J.; Benoit, S.C.; McNamara, R.K. Omega-3 fatty acid deficiency selectively up-regulates delta6-desaturase expression and activity indices in rat liver: Prevention by normalization of omega-3 fatty acid status. Nutr. Res. 2011, 31, 715–722. [Google Scholar] [CrossRef] [PubMed]
- Abayasekara, D.; Wathes, D. Effects of altering dietary fatty acid composition on prostaglandin synthesis and fertility. ProstaglandinsLeukot. Essent. Fat. Acids (PLEFA) 1999, 61, 275–287. [Google Scholar] [CrossRef] [PubMed]
- Cheng, Z.; Elmes, M.; Kirkup, S.; Abayasekara, D.; Wathes, D. Effects of n-6 polyunsaturated fatty acids on prostaglandin production in ovine fetal chorion cells in vitro in late gestation ewes. Placenta 2011, 32, 752–756. [Google Scholar] [CrossRef] [PubMed]
- Ganga, R.; Tort, L.; Acerete, L.; Montero, D.; Izquierdo, M. Modulation of ACTH-induced cortisol release by polyunsaturated fatty acids in interrenal cells from gilthead seabream, Sparus aurata. J. Endocrinol. 2006, 190, 39–45. [Google Scholar] [CrossRef] [PubMed]
- Chisaguano, A.M.; Montes, R.; Pérez-Berezo, T.; Castellote, A.I.; Guerendiain, M.; Bustamante, M.; Morales, E.; García-Esteban, R.; Sunyer, J.; Franch, À. Gene expression of desaturase (FADS1 and FADS2) and Elongase (ELOVL5) enzymes in peripheral blood: Association with polyunsaturated fatty acid levels and atopic eczema in 4-year-old children. PLoS ONE 2013, 8, e78245. [Google Scholar] [CrossRef]
- Asturiano, J.; Sorbera, L.; Carrillo, M.; Zanuy, S.; Ramos, J.; Navarro, J.; Bromage, N. Reproductive performance in male European sea bass (Dicentrarchus labrax, L.) fed two PUFA-enriched experimental diets: A comparison with males fed a wet diet. Aquaculture 2001, 194, 173–190. [Google Scholar] [CrossRef]
- Asturiano, J.; Sorbera, L.; Zanuy, S.; Carrillo, M. Effects of polyunsaturated fatty acids and gonadotropin on prostaglandin series E production in a primary testis cell culture system for the European sea bass. J. Fish Biol. 2000, 57, 1563–1574. [Google Scholar] [CrossRef]
- Wade, M.G.; Van Der Kraak, G. Arachidonic acid and prostaglandin E2 stimulate testosterone production by goldfish testis in vitro. Gen. Comp. Endocrinol. 1993, 90, 109–118. [Google Scholar] [CrossRef] [PubMed]
- Bouwens, M.; Afman, L.A.; Müller, M. Fasting induces changes in peripheral blood mononuclear cell gene expression profiles related to increases in fatty acid β-oxidation: Functional role of peroxisome proliferator-activated receptor α in human peripheral blood mononuclear cells. Am. J. Clin. Nutr. 2007, 86, 1515–1523. [Google Scholar] [CrossRef] [PubMed]
- Caimari, A.; Oliver, P.; Keijer, J.; Palou, A. Peripheral Blood Mononuclear Cells as a Model to Study the Response of Energy Homeostasis-Related Genes to Acute Changes in Feeding Conditions. Omics A J. Integr. Biol. 2010, 14, 129–141. [Google Scholar] [CrossRef]
- Caimari, A.; Oliver, P.; Rodenburg, W.; Keijer, J.; Palou, A. Slc27a2 expression in peripheral blood mononuclear cells as a molecular marker for overweight development. Int. J. Obes. 2010, 34, 831–839. [Google Scholar] [CrossRef]
- de Mello, V.D.F.; Kolehmanien, M.; Schwab, U.; Pulkkinen, L.; Uusitupa, M. Gene expression of peripheral blood mononuclear cells as a tool in dietary intervention studies: What do we know so far? Mol. Nutr. Food Res. 2012, 56, 1160–1172. [Google Scholar] [CrossRef]


| Ingredients (%) | Experimental Diet |
|---|---|
| Fish meal (South American) | 5.00 |
| Blood meal (spray-dried) | 7.00 |
| Soya protein concentrate | 20.00 |
| Corn gluten meal | 22.00 |
| Wheat gluten | 5.50 |
| Rapeseed meal | 11.30 |
| Wheat | 6.89 |
| Fish oil (South American) | 3.00 |
| Linseed oil | 2.60 |
| Palm oil | 5.20 |
| Rapeseed oil | 5.20 |
| Supplemented ingredients 1 | 5.49 |
| Vitamin and mineral premix 2 | 0.75 |
| Antioxidant-Ethoxyquin | 0.05 |
| Yttrium oxide | 0.03 |
| Proximate Composition | |
| Crude protein (% dry matter, DM) | 45.1 |
| Crude lipid (% DM) | 21.7 |
| Ash (% DM) | 5.4 |
| Moisture (%) | 9.0 |
| Fatty Acid (%TFA) | Experimental Diet |
|---|---|
| 14:0 | 6.6 |
| 14:1n-5 | 0.1 |
| 15:0 | 0.1 |
| 16:0 | 12.3 |
| 16:1n-7 | 2.1 |
| 16:1n-5 | 0.1 |
| 16:2n-4 | 0.2 |
| 17:0 | 0.3 |
| 16:3n-4 | 0.1 |
| 16:4n-3 | 0.4 |
| 18:0 | 3.2 |
| 18:1n-9 | 32.3 |
| 18:1n-7 | 2.3 |
| 18:2n-6 (LA) | 20.3 |
| 18:2n-4 | 0.1 |
| 18:3n-6 | 0.1 |
| 18:3n-3 (ALA) | 11.8 |
| 18:4n-3 | 0.4 |
| 20:0 | 0.4 |
| 20:1n-9 | 1.0 |
| 20:1n-7 | 0.1 |
| 20:2n-6 | 0.1 |
| 20:4n-6 (ARA) | 0.2 |
| 20:4n-3 | 0.1 |
| 20:5n-3 (EPA) | 2.5 |
| 22:1n-11 | 0.1 |
| 22:1n-9 | 0.3 |
| 22:5n-6 | 0.1 |
| 22:5n-3 (DPA) | 0.3 |
| 22:6n-3 (DHA) | 1.7 |
| Total saturates | 22.9 |
| Total monoenes | 38.4 |
| Total n-3 | 17.2 |
| Total n-6 | 20.8 |
| Total n-9 | 32.6 |
| Total n-3 LC-PUFA | 4.6 |
| Broodstock | Males (n = 4) | Female (n = 16) | t-Test (p-Value) |
|---|---|---|---|
| Body length (cm) | 47 ± 3 b | 56 ± 4 a | <0.001 |
| Body weight (kg) | 1.27 ± 0.19 b | 2.40 ± 0.63 a | 0.003 |
| HSI (%) | 1.26 ± 0.17 a | 1.08 ± 0.13 b | 0.04 |
| GSI (%) | 0.65 ± 0.16 b | 1.47 ± 0.36 a | <0.001 |
| PBCs fads2 (mRNA copies/µL) | 1.68 ± 0.55 | 2.00 ± 0.93 | 0.52 |
| Liver fads2 (mRNA copies/µL) | 2.60 ± 0.84 | 3.24 ± 1.49 | 0.43 |
| Broodstock | Male Broodstock | Female Broodstock | ||
|---|---|---|---|---|
| HSI (%) | GSI (%) | HSI (%) | GSI (%) | |
| Body weight (kg) | −0.35 (0.65) | 0.14 (0.86) | 0.14 (0.61) | 0.25 (0.36) |
| Broodstock | Male Broodstock | Female Broodstock | Male and Female Broodstock | |||
|---|---|---|---|---|---|---|
| PBCs fads2 | Liver fads2 | PBCs fads2 | Liver fads2 | PBCs fads2 | Liver fads2 | |
| Body weight (kg) | −0.56 (0.45) | −0.96 (0.04) | 0.15 (0.58) | 0.13 (0.64) | 0.19 (0.42) | 0.19 (0.43) |
| Broodstock | PBCs fads2 | Liver fads2 | t-Test (p-Value) |
|---|---|---|---|
| Male | 1.68 ± 0.55 | 2.60 ± 0.84 | 0.114 |
| Female | 2.00 ± 0.93 b | 3.24 ± 1.49 a | 0.008 |
| Male and female | 1.93 ± 0.87 b | 3.11 ± 1.39 a | 0.003 |
| Male Broodstock | Female Broodstock | Male and Female Broodstock | |
|---|---|---|---|
| Liver fads2 | |||
| PBCs fads2 | 0.76 (0.24) | 0.90 (<0.001) | 0.89 (<0.001) |
| Fatty Acid (%TFA) | Male | Female | t-Test (p-Value) | ||
|---|---|---|---|---|---|
| Mean | SD | Mean | SD | ||
| 14:0 | 1.42 | 0.57 | 1.30 | 0.38 | 0.59 |
| 14:1n-5 | 0.04 | 0.02 | 0.03 | 0.01 | 0.33 |
| 14:1n-7 | 0.02 | 0.01 | 0.03 | 0.01 | 0.70 |
| 15:0 | 0.17 | 0.03 | 0.14 | 0.04 | 0.19 |
| 15:1n-5 | 0.02 | 0.01 | 0.02 | 0.01 | 0.82 |
| 16:0 | 11.56 | 0.29 | 11.41 | 1.42 | 0.72 |
| 16:1n-7 | 2.48 | 1.12 | 2.18 | 0.46 | 0.64 |
| 16:1n-5 | 0.06 | 0.02 | 0.05 | 0.01 | 0.43 |
| 16:2n-4 | 0.14 | 0.11 | 0.10 | 0.04 | 0.48 |
| 17:0 | 0.14 | 0.08 | 0.11 | 0.04 | 0.35 |
| 16:3n-4 | 0.16 | 0.03 | 0.14 | 0.02 | 0.30 |
| 16:3n-3 | 0.06 | 0.02 | 0.05 | 0.01 | 0.40 |
| 16:3n-1 | 0.04 | 0.04 | 0.03 | 0.01 | 0.76 |
| 16:4n-3 | 0.17 a | 0.06 | 0.09 b | 0.04 | 0.01 |
| 18:1n-9 | 3.86 | 0.95 | 3.80 | 0.45 | 0.66 |
| 18:1n-7 | 28.81 | 3.98 | 29.80 | 1.61 | 0.67 |
| 18.1n-5 | 2.69 | 0.35 | 2.61 | 0.15 | 0.76 |
| 18:2n-9 | 0.11 | 0.03 | 0.10 | 0.03 | 0.30 |
| 18:2n-6 (LA) | 0.09 | 0.05 | 0.11 | 0.04 | 0.71 |
| 18:2n-4 | 14.51 | 2.52 | 14.86 | 1.41 | 0.77 |
| 18:3n-6 | 0.09 | 0.04 | 0.09 | 0.02 | 0.61 |
| 18:3n-4 | 0.24 | 0.07 | 0.25 | 0.06 | 0.56 |
| 18:3n-3 (ALA) | 0.13 | 0.03 | 0.12 | 0.03 | 0.43 |
| 18.3n-1 | 9.01 | 3.24 | 9.92 | 1.68 | 0.45 |
| 18:4n-3 | 0.01 | 0.01 | 0.00 | 0.01 | 0.72 |
| 18:4n-1 | 0.55 | 0.29 | 0.49 | 0.13 | 0.82 |
| 20:0 | 0.09 | 0.04 | 0.08 | 0.03 | 0.45 |
| 20:1n-9 | 0.29 | 0.02 | 0.26 | 0.06 | 0.71 |
| 20:1n-7 | 0.36 | 0.18 | 0.33 | 0.11 | 0.66 |
| 20.1n-5 | 2.34 | 0.72 | 2.22 | 0.42 | 0.86 |
| 20:2n-9 | 0.15 | 0.05 | 0.15 | 0.06 | 0.24 |
| 20:2n-6 | 0.18 | 0.05 | 0.23 | 0.08 | 0.34 |
| 20:3n-9 | 0.86 | 0.18 | 0.94 | 0.15 | 0.88 |
| 20:3n-6 | 0.03 | 0.01 | 0.03 | 0.01 | 0.60 |
| 20:4n-6 (ARA) | 0.26 | 0.16 | 0.29 | 0.10 | 0.74 |
| 20:3n-3 | 0.77 | 0.64 | 0.66 | 0.18 | 0.17 |
| 20:4n-3 | 0.78 | 0.28 | 0.95 | 0.19 | 0.76 |
| 20:5n-3 (EPA) | 0.66 | 0.17 | 0.68 | 0.13 | 0.75 |
| 22:1n-11 | 2.80 | 1.26 | 2.61 | 1.00 | 0.50 |
| 22:1n-9 | 1.48 | 0.92 | 1.22 | 0.62 | 0.97 |
| 22:4n-6 | 0.65 | 0.18 | 0.65 | 0.18 | 0.35 |
| 22:5n-6 | 0.23 | 0.13 | 0.18 | 0.06 | 0.56 |
| 22:5n-3 (DPA) | 0.19 | 0.08 | 0.18 | 0.05 | 0.66 |
| 22:6n-3 (DHA) | 2.04 | 0.78 | 1.88 | 0.57 | 0.61 |
| Total Saturates | 9.32 | 3.73 | 8.57 | 2.30 | 0.66 |
| Total Monoenes | 17.43 | 0.73 | 17.02 | 1.77 | 0.90 |
| Total n-3 | 39.20 | 5.71 | 39.40 | 1.90 | 0.94 |
| Total n-6 | 25.37 | 3.44 | 25.24 | 2.76 | 0.86 |
| Total n-9 | 17.05 | 3.08 | 17.36 | 1.39 | 0.64 |
| Total n-3 LC-PUFA | 30.11 | 4.01 | 31.15 | 1.38 | 0.69 |
| EPA+DHA | 15.59 | 5.04 | 14.69 | 3.68 | 0.62 |
| ARA/EPA | 12.12 | 4.44 | 11.18 | 3.11 | 0.82 |
| EPA/ARA | 0.31 | 0.27 | 0.28 | 0.12 | 0.64 |
| DHA/ARA | 5.01 | 3.05 | 4.19 | 1.69 | 0.66 |
| DHA/EPA | 14.72 | 5.44 | 13.36 | 2.97 | 0.83 |
| DHA/DPA | 3.57 | 1.48 | 3.46 | 0.80 | 0.88 |
| n-3/n-6 | 4.82 | 2.20 | 4.64 | 0.84 | 0.74 |
| n-6/n-3 | 1.52 | 0.32 | 1.47 | 0.26 | 0.78 |
| 18:2n-9/18:1n-9 | 0.68 | 0.13 | 0.70 | 0.10 | 0.79 |
| 18:3n-6/18:2n-6 | 0.66 | 0.54 | 0.75 | 0.34 | 0.86 |
| 20:3n-6/20:2n-6 | 0.02 | 0.01 | 0.02 | 0.01 | 0.71 |
| 18:4n-3/18:3n3 | 0.29 | 0.12 | 0.31 | 0.09 | 0.52 |
| 20:4n-3/20:3n-3 | 0.08 | 0.06 | 0.05 | 0.03 | 0.48 |
| Fatty Acids (%TFA) | Male Broodstock | Female Broodstock | ||
|---|---|---|---|---|
| Pearson’s Correlation | p-Value | Pearson’ Correlation | p-Value | |
| 14:0 | −0.57 | 0.43 | −0.07 | 0.79 |
| 14:1n-5 | −0.58 | 0.42 | −0.22 | 0.42 |
| 14:1n-7 | −0.89 | 0.11 | −0.12 | 0.66 |
| 15:0 | −0.57 | 0.43 | −0.20 | 0.45 |
| 15:1n-5 | −0.43 | 0.57 | −0.33 | 0.21 |
| 16:0 | 0.95 | 0.04 | 0.25 | 0.35 |
| 16:1n-7 | −0.40 | 0.60 | −0.13 | 0.62 |
| 16:1n-5 | −0.11 | 0.89 | −0.04 | 0.88 |
| 16:2n-4 | −0.37 | 0.63 | −0.17 | 0.52 |
| 17:0 | −0.15 | 0.85 | −0.31 | 0.24 |
| 16:3n-4 | −0.70 | 0.30 | 0.04 | 0.87 |
| 16:3n-3 | −0.11 | 0.89 | −0.33 | 0.22 |
| 16:3n-1 | 0.85 | 0.15 | −0.48 | 0.06 |
| 16:4n-3 | 0.32 | 0.68 | −0.19 | 0.48 |
| 18:0 | 0.83 | 0.17 | 0.45 | 0.08 |
| 18:1n-9 | −0.75 | 0.25 | 0.28 | 0.29 |
| 18:1n-7 | −0.42 | 0.58 | 0.03 | 0.90 |
| 18.1n-5 | −0.10 | 0.90 | −0.19 | 0.48 |
| 18:2n-9 | 0.86 | 0.14 | 0.05 | 0.85 |
| 18:2n-6 (LA) | −0.10 | 0.90 | 0.11 | 0.69 |
| 18:2n-4 | −0.11 | 0.89 | −0.39 | 0.14 |
| 18:3n-6 | 0.93 | 0.07 | −0.04 | 0.89 |
| 18:3n-4 | −0.11 | 0.89 | −0.14 | 0.61 |
| 18:3n-3 (ALA) | −0.37 | 0.63 | 0.10 | 0.72 |
| 18.3n-1 | −0.11 | 0.89 | 0.20 | 0.46 |
| 18:4n-3 | −0.16 | 0.84 | −0.22 | 0.41 |
| 18:4n-1 | −0.39 | 0.61 | −0.34 | 0.20 |
| 20:0 | 0.14 | 0.86 | −0.35 | 0.18 |
| 20:1n-9 | −0.40 | 0.60 | −0.24 | 0.38 |
| 20:1n-7 | −0.44 | 0.56 | −0.29 | 0.29 |
| 20.1n-5 | −0.27 | 0.73 | −0.17 | 0.52 |
| 20:2n-9 | 0.86 | 0.14 | 0.28 | 0.29 |
| 20:2n-6 | 0.49 | 0.51 | 0.19 | 0.49 |
| 20:3n-9 | 0.94 | 0.07 | −0.14 | 0.60 |
| 20:3n-6 | 0.91 | 0.09 | 0.23 | 0.40 |
| 20:4n-6 (ARA) | 0.89 | 0.11 | −0.03 | 0.91 |
| 20:3n-3 | 0.31 | 0.69 | 0.30 | 0.26 |
| 20:4n-3 | 0.62 | 0.38 | −0.03 | 0.92 |
| 20:5n-3 (EPA) | 0.20 | 0.80 | −0.29 | 0.27 |
| 22:1n-11 | −0.25 | 0.75 | −0.29 | 0.27 |
| 22:1n-9 | −0.33 | 0.67 | −0.12 | 0.65 |
| 22:4n-6 | 0.91 | 0.09 | −0.06 | 0.83 |
| 22:5n-6 | 0.93 | 0.07 | −0.11 | 0.69 |
| 22:5n-3 (DPA) | 0.12 | 0.88 | −0.21 | 0.45 |
| 22:6n-3 (DHA) | 0.92 | 0.08 | −0.21 | 0.44 |
| Total Saturates | 0.97 | 0.03 | 0.28 | 0.30 |
| Total Monoenes | −0.76 | 0.24 | 0.01 | 0.96 |
| Total n-3 | 0.80 | 0.20 | −0.26 | 0.34 |
| Total n-6 | 0.26 | 0.74 | 0.14 | 0.62 |
| Total n-9 | −0.76 | 0.25 | 0.31 | 0.24 |
| Total n-3 LC-PUFA | 0.79 | 0.21 | −0.23 | 0.40 |
| EPA + DHA | 0.83 | 0.17 | −0.25 | 0.36 |
| ARA/EPA | 0.72 | 0.28 | 0.14 | 0.61 |
| EPA/ARA | −0.40 | 0.60 | −0.25 | 0.35 |
| DHA/ARA | −0.45 | 0.55 | −0.21 | 0.44 |
| DHA/EPA | 0.69 | 0.31 | 0.20 | 0.46 |
| DHA/DPA | 0.81 | 0.19 | −0.02 | 0.94 |
| n-3/n-6 | 0.24 | 0.76 | −0.27 | 0.31 |
| n-6/n-3 | −0.38 | 0.62 | 0.21 | 0.43 |
| 18:2n-9/18:1n-9 | 0.87 | 0.13 | −0.04 | 0.90 |
| 20:2n-9/20:1n-9 | 0.89 | 0.11 | 0.30 | 0.27 |
| 18:3n-6/18:2n-6 | 0.75 | 0.25 | −0.32 | 0.23 |
| 20:3n-6/20:2n-6 | 0.98 | 0.02 | 0.15 | 0.58 |
| 18:4n-3/18:3n3 | −0.04 | 0.96 | −0.15 | 0.58 |
| 20:4n-3/20:3n-3 | 0.05 | 0.95 | −0.26 | 0.32 |
© 2020 by the authors. Licensee MDPI, Basel, Switzerland. This article is an open access article distributed under the terms and conditions of the Creative Commons Attribution (CC BY) license (http://creativecommons.org/licenses/by/4.0/).
Share and Cite
Ferosekhan, S.; Turkmen, S.; Xu, H.; Afonso, J.M.; Zamorano, M.J.; Kaushik, S.; Izquierdo, M. The Relationship between the Expression of Fatty Acyl Desaturase 2 (fads2) Gene in Peripheral Blood Cells (PBCs) and Liver in Gilthead Seabream, Sparus aurata Broodstock Fed a Low n-3 LC-PUFA Diet. Life 2020, 10, 117. https://doi.org/10.3390/life10070117
Ferosekhan S, Turkmen S, Xu H, Afonso JM, Zamorano MJ, Kaushik S, Izquierdo M. The Relationship between the Expression of Fatty Acyl Desaturase 2 (fads2) Gene in Peripheral Blood Cells (PBCs) and Liver in Gilthead Seabream, Sparus aurata Broodstock Fed a Low n-3 LC-PUFA Diet. Life. 2020; 10(7):117. https://doi.org/10.3390/life10070117
Chicago/Turabian StyleFerosekhan, Shajahan, Serhat Turkmen, Hanlin Xu, Juan Manuel Afonso, Maria Jesus Zamorano, Sadasivam Kaushik, and Marisol Izquierdo. 2020. "The Relationship between the Expression of Fatty Acyl Desaturase 2 (fads2) Gene in Peripheral Blood Cells (PBCs) and Liver in Gilthead Seabream, Sparus aurata Broodstock Fed a Low n-3 LC-PUFA Diet" Life 10, no. 7: 117. https://doi.org/10.3390/life10070117
APA StyleFerosekhan, S., Turkmen, S., Xu, H., Afonso, J. M., Zamorano, M. J., Kaushik, S., & Izquierdo, M. (2020). The Relationship between the Expression of Fatty Acyl Desaturase 2 (fads2) Gene in Peripheral Blood Cells (PBCs) and Liver in Gilthead Seabream, Sparus aurata Broodstock Fed a Low n-3 LC-PUFA Diet. Life, 10(7), 117. https://doi.org/10.3390/life10070117