Article

Dependency of Machine Efficiency on the Thermal Behavior of Induction Machines

Institute of Automotive Technology, Technical University of Munich, 80333 Munich, Germany
*
Author to whom correspondence should be addressed.
Machines 2020, 8(1), 9; https://doi.org/10.3390/machines8010009
Submission received: 7 January 2020 / Revised: 19 February 2020 / Accepted: 21 February 2020 / Published: 24 February 2020

Abstract

:
The consideration of the thermal behavior of electric machines is becoming increasingly important in the machine design for electric vehicles due to the adaptation to more dynamic operating points compared to stationary applications. Whereas, the dependency of machine efficiency on thermal behavior is caused due to the impact of temperature on the resulting loss types. This leads to a shift of efficiency areas in the efficiency diagram of electric machines and has a significant impact on the maximum load capability and an impact on the cycle efficiency during operation, resulting in a reduction in the overall range of the electric vehicle. Therefore, this article aims at analyzing the thermal load limits of induction machines in regard to actual operation using measured driving data of battery electric vehicles. For this, a thermal model is implemented using MATLAB® and investigations to the sensitivity of model parameters as well as analysis of the continuous load capacity, thermal load and efficiency in driving cycles under changing boundary conditions are conducted.

1. Introduction

Today, electric mobility in the form of battery electric vehicles poses the highest potential for the demand of individual and freight transport in light commercial vehicles for the future [1]. The greatest challenges here are currently the high costs and high weight of the traction battery [1]. It is, therefore, of great importance that the powertrain operates as efficiently as possible so that increased driving ranges can be achieved at moderate costs and low weight. The traction machine poses an important component in the efficiency chain of the overall powertrain of an electric vehicle, e.g., if the overall vehicle efficiency is optimized by 1%, around 2% more range is possible [2]. For electric machines, the greatest cost-saving potential lies in the compactness of the traction machine, since costs are positively correlated with the weight of the machine [3].
In order to still be able to offer the end user high driving performance, electric machines are often operated using their overload potential. Here, the exact knowledge and monitoring of the thermal behavior early in the product development process are of great importance [4], since the thermal load or overload is the main driver for defects and aging of electric machines [5]. The goal must, therefore, be to operate the electric machine in the range of optimal efficiency. This is not only influenced by rotational speed and load, but also by the machine temperature [6]. An exact consideration of the thermal load is, therefore, becoming increasingly important. The more precisely the loads during real operation can be established, the better the operating strategy of the machine and the thermal management can be coordinated in regard to the optimal machine efficiency. A realistic load profile and the exact simulation of the thermal load enable the machine geometry to be designed according to requirements and suitable materials to be selected for an optimum between cost, aging and durability.
Therefore, the aim of this article is to implement a simulation tool with which the thermal load of an electric machine, in particular an induction machine (IM), can be investigated for different driving cycles and operating points. Here, especially, the effect of a varying machine efficiency at different machine temperatures will be considered. The basis of the analysis is measurement data from test drives of electric vehicles with an IM as the traction machine. Additionally, efficiency diagrams and geometric dimensions are provided by a machine calculation tool created by the first author [7], which will be used to further model the electrical machine behavior. This makes it possible to modify the parameters of the electric machine for further investigations with the simulation tool. Finally, a statement is to be made on the significance of the temperature-dependency of machine efficiency for the investigated electric machine. Furthermore, the change of the thermal machine load with varying boundary conditions and machine parameters is analyzed.

2. State-of-the-Art

In the context of this article, the thermal behavior of an IM is examined. Following an introduction to the functionality of this machine type, the losses occurring during the conversion of energy will be illustrated. Subsequently, approaches for the thermal modeling of IMs are presented and the thermal limits of the electric machine are discussed. Finally, aging effects and failure causes of the machines will be presented.

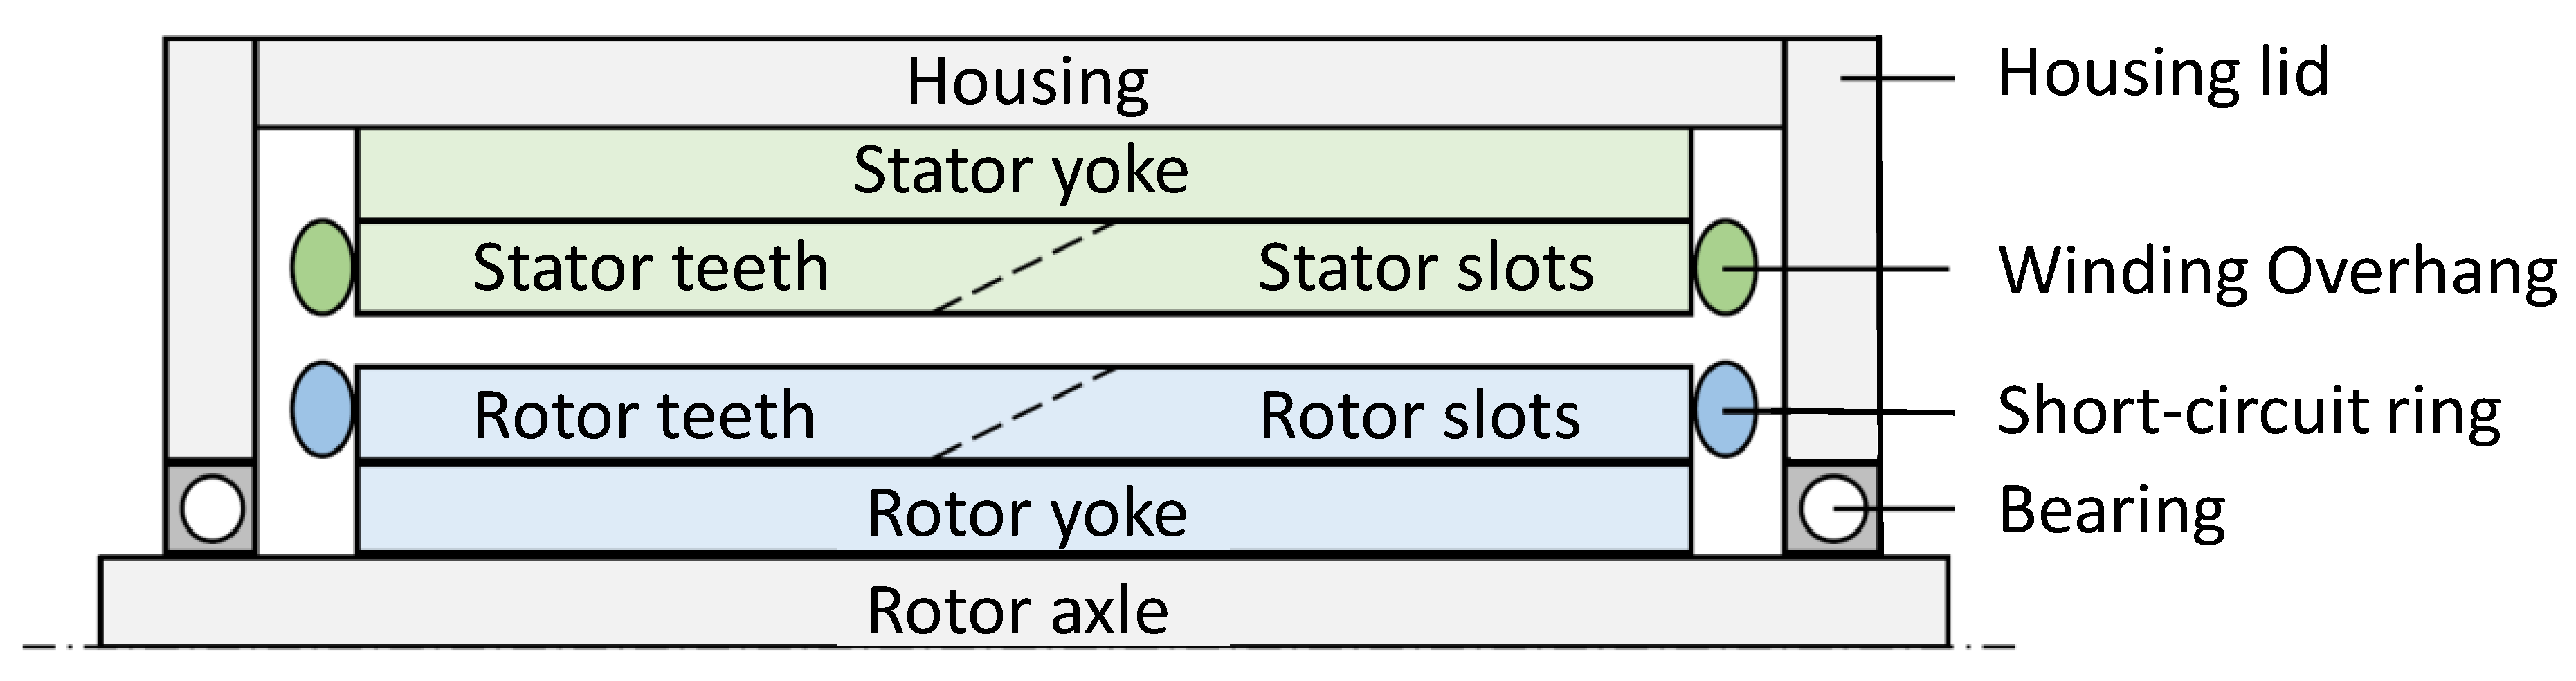
2.1. Fundamentals of IMs

The IM belongs to the group of rotating field machines that share a common stator design. Three spatially offset coils are arranged in the stator in such a way that a rotating magnetic field is formed when energized with alternating current. In practice, several of these coil triples are often installed in the stator to increase the number of pole pairs, whereas one coil triple represents one pole pair. A higher number of pole pairs increases the torque density of the machine [8]. For voltage induction, there must be a difference in speed between the stator field and the rotor rods, the so-called slip.
A casting or impregnation of the winding, on the one hand, serves to increase the mechanical load-bearing capacity of the winding, because it is fastened by the potting material and is thus better protected against vibrations. On the other hand, it improves the specific thermal conductivity within the slots toward the stator core, as air is replaced by the better conducting casting of the winding. The impregnation thus reduces the risk of short circuits and breakage of the winding and lowers the temperature load of the conductors. The winding overhang of the stator winding is located on both ends of the stator core. It is made up of copper wire, which is used to distribute the individual winding strands over the stator coil in the slots. The winding overhang is the most temperature critical component in the IM. This is due to the relatively high power dissipation and due to the fact that heat dissipation from the winding overhang is low via the surrounding air compared to the heat-conducting contact with the stator slot via the conductors themselves [4].
The stator is mounted in a cylindrical housing, which secures the mechanical strength and stiffness of the electric machine. Depending on the type of cooling, cooling fins (air cooling) or a cooling jacket (liquid cooling) are typically integrated into or on to the housing surface. For electric machines in electric vehicles, that are subject to particularly high thermal loads, additional forms of liquid cooling can be applied to various components. Examples are the cooling of the bearing points, internal rotor cooling and cooling close to the windings in the stator [9,10,11].

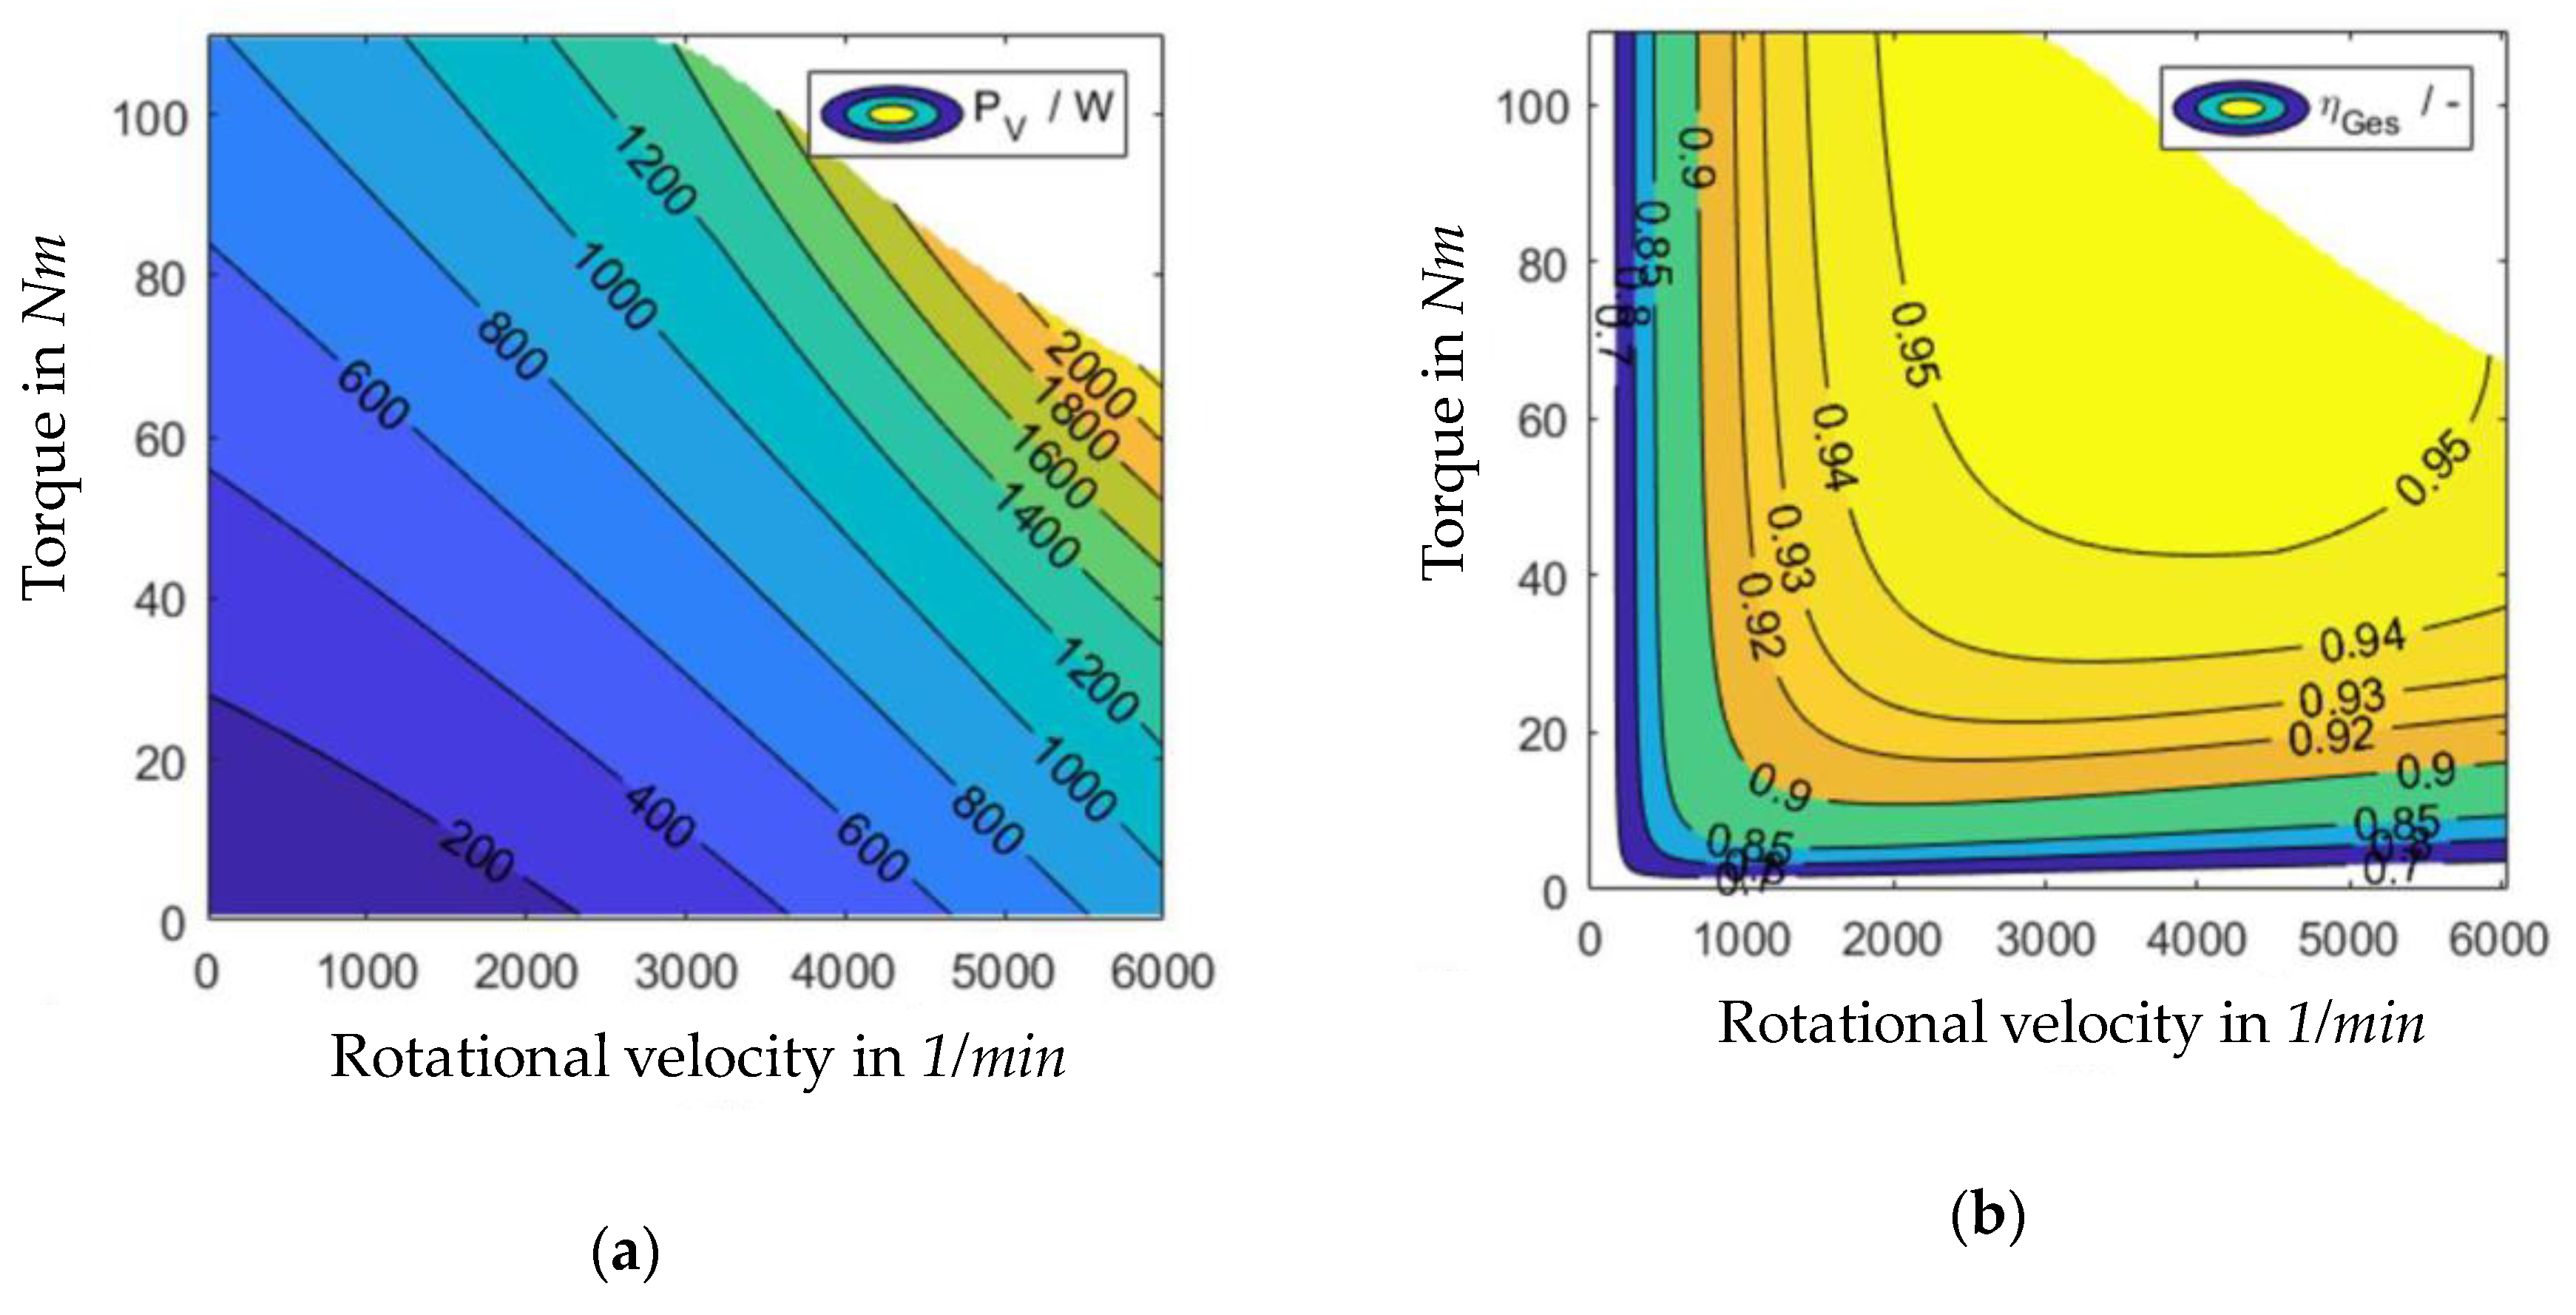
2.2. Thermal Losses and Efficiency

The energy conversion in an electric machine from electrical to mechanical energy (motor operation) and vice versa (generator operation) is associated with losses. All losses are released in the form of heat energy, which leads to the heating of the electric machine and makes cooling necessary. The ratio between the power dissipated to the power supplied is called the efficiency. The absolute power dissipation PV varies with the current operating point of the electric machine, consisting of the rotational velocity nEM and torque MEM. An exemplary power dissipation PV diagram for motor operation is shown in Figure 1a) in the form of a shell diagram. The resulting individual operating point efficiencies η of the electric machine are illustrated in Figure 1b).
The total losses of the IM during energy conversion can be divided into different types of loss. Under current flow, ohmic losses occur due to the electrical resistance of the conductors or windings in the rotor and stator PV,ohm. The ohmic winding losses, also known as current heat losses, are generally calculated using:
P V , o h m = R · I 2
where R is the DC resistance and I the current. Alternating current losses such as the Skin effects are included in the so-called additional losses [12]. Since the current flow in the electric machine increases proportionally with the machine torque, the term load-dependent losses is used for current heat losses [13].
Due to the constantly changing orientation of the magnetic field and the material properties, so-called remagnetization losses occur in the rotor and stator iron components. They are divided into two basic types of loss: hysteresis and eddy current losses [12]. The losses due to hysteresis occur when the magnetic state of the material changes. On the one hand, they are dependent on the material-specific magnetization characteristic, the so-called hysteresis loop. The area enclosed by this loop is proportional to the work to be performed for the one-time passage through the magnetization loop and thus also proportional to the hysteresis power loss. On the other hand, the hysteresis power loss increases the more frequently the magnetic field changes, i.e., the higher the frequency f is [14]. Furthermore, voltage induction occurs in the conductive iron material due to the temporally changing magnetic field. This results in eddy current losses in the iron [12]. They increase proportionally with the frequency f squared [14]. The total remagnetization losses Pv,iron are generally calculated according to:
P V , i r o n = m · ( B 1.5   T ) 2 · [ σ h y s t 1.5 · k h y s t · ( f 50   H z ) + σ w b 1.5 · k w b · ( f 50   H z ) 2 ]
where m is the mass of the iron, B the magnetic flux density, σ the specific losses at 1.5 T and k the factors for the share of both losses in the total remagnetization losses [14]. The loss division in the simulation model is based on the results of a machine calculation tool implemented by the author’s institute [7].
Mechanical friction losses mainly occur in the bearings of the rotor shaft via the friction torque of the bearings of the electric machine. The constant friction torque in the bearing Mbearing depends on the acting load, the design and the type of bearing. For the power dissipation PV,mech the following equation results, illustrating the proportionality to the rotational velocity [13]:
P V , m e c h = 2 · π · n E M · M b e a r i n g
The losses caused by air friction, the so-called ventilation loss PV,cooling occur both in the air-gap between stator and rotor, and in the internal air at both ends of the machine. In air-cooled electric machines, additional losses occur due to the fan at the rotor shaft. The air friction torque Mair increases proportionally to the squared rotational velocity [13]:
P V , c o o l i n g = 2 · π · n E M · M a i r
In PYRHONEN [12], the simplification of a rotating disk is assumed for the end faces of the rotor, whereby any existing fan contours on the short-circuit rings are neglected. The total mechanical losses, consisting of bearing and ventilation losses, represent load-independent and speed-dependent losses.
In addition to the losses described so far, other so-called additional losses occur in electric machines. In the literature, numerous effects are described as the cause of additional losses, which exhibit both load-dependent and load-independent loss characteristics, e.g., harmonics in the air-gap, which cause additional remagnetization and current heat losses; harmonics in the feeding current, which lead to current heat losses; remagnetization losses in adjacent metal parts, e.g., the housing. Figure 2 shows an exemplary distribution of the total power loss of an IM for the four established loss types. The characteristic diagrams show the relative proportions for the loss types of the total losses.

2.3. Temperature-Dependency of Losses

The losses in the electric machine change according to its operating temperature, since the effects of the losses are influenced by temperature. The current heat losses in the stator and rotor windings increase with increasing temperature because the resistance of the copper conductors increases. The increase in resistance occurs according to Equation (5) [15,16]. Here, R0 is the conductor resistance at reference temperature T0, T the current conductor temperature and αohm the material-specific temperature coefficient of the electrical resistance.
R = R 0 · ( 1 + α o h m · ( T T 0 ) )
For iron losses, the temperature effects are considered separately for hysteresis and eddy current losses. The former decrease with increasing temperature because the remanence BR and the coercive field strength Hc decrease in the characteristic hysteresis loop of the material due to increased atomic movement in the iron sheet. The area enclosed by the hysteresis loop, which is proportional to the hysteresis loss, thus decreases [16]. The eddy current losses also decrease with increasing temperature. Higher electrical resistance of the iron sheets with increased temperature reduces the flowing eddy currents for a given induced voltage.
A closed formula for the temperature dependence of the iron losses cannot be stated completely. Instead, experimental investigations are carried out to determine machine- and material-specific values. AUINGER [6] gives a range of 4%–8% loss reduction at 100 °C compared to room temperature (20 °C) for the iron losses based on a large number of experimental testing. SCHUTZHOLD [16] evaluates the mechanical losses to be negligibly low for the IM and PSM machines examined in the conducted analysis. Their temperature dependence is, therefore, not considered in this article. In qualitative terms, however, there is a correlation between the viscosity of the lubricant in the bearings and the bearing friction decreasing with increasing temperature. AUINGER [6] describes the decrease in ventilation loss in the electric machine with increasing temperature due to reduced air density and thus reduced air friction. A decrease of 4%–5% per 10 K temperature increase is indicated. The literature does not specify any possible temperature dependencies for additional losses.

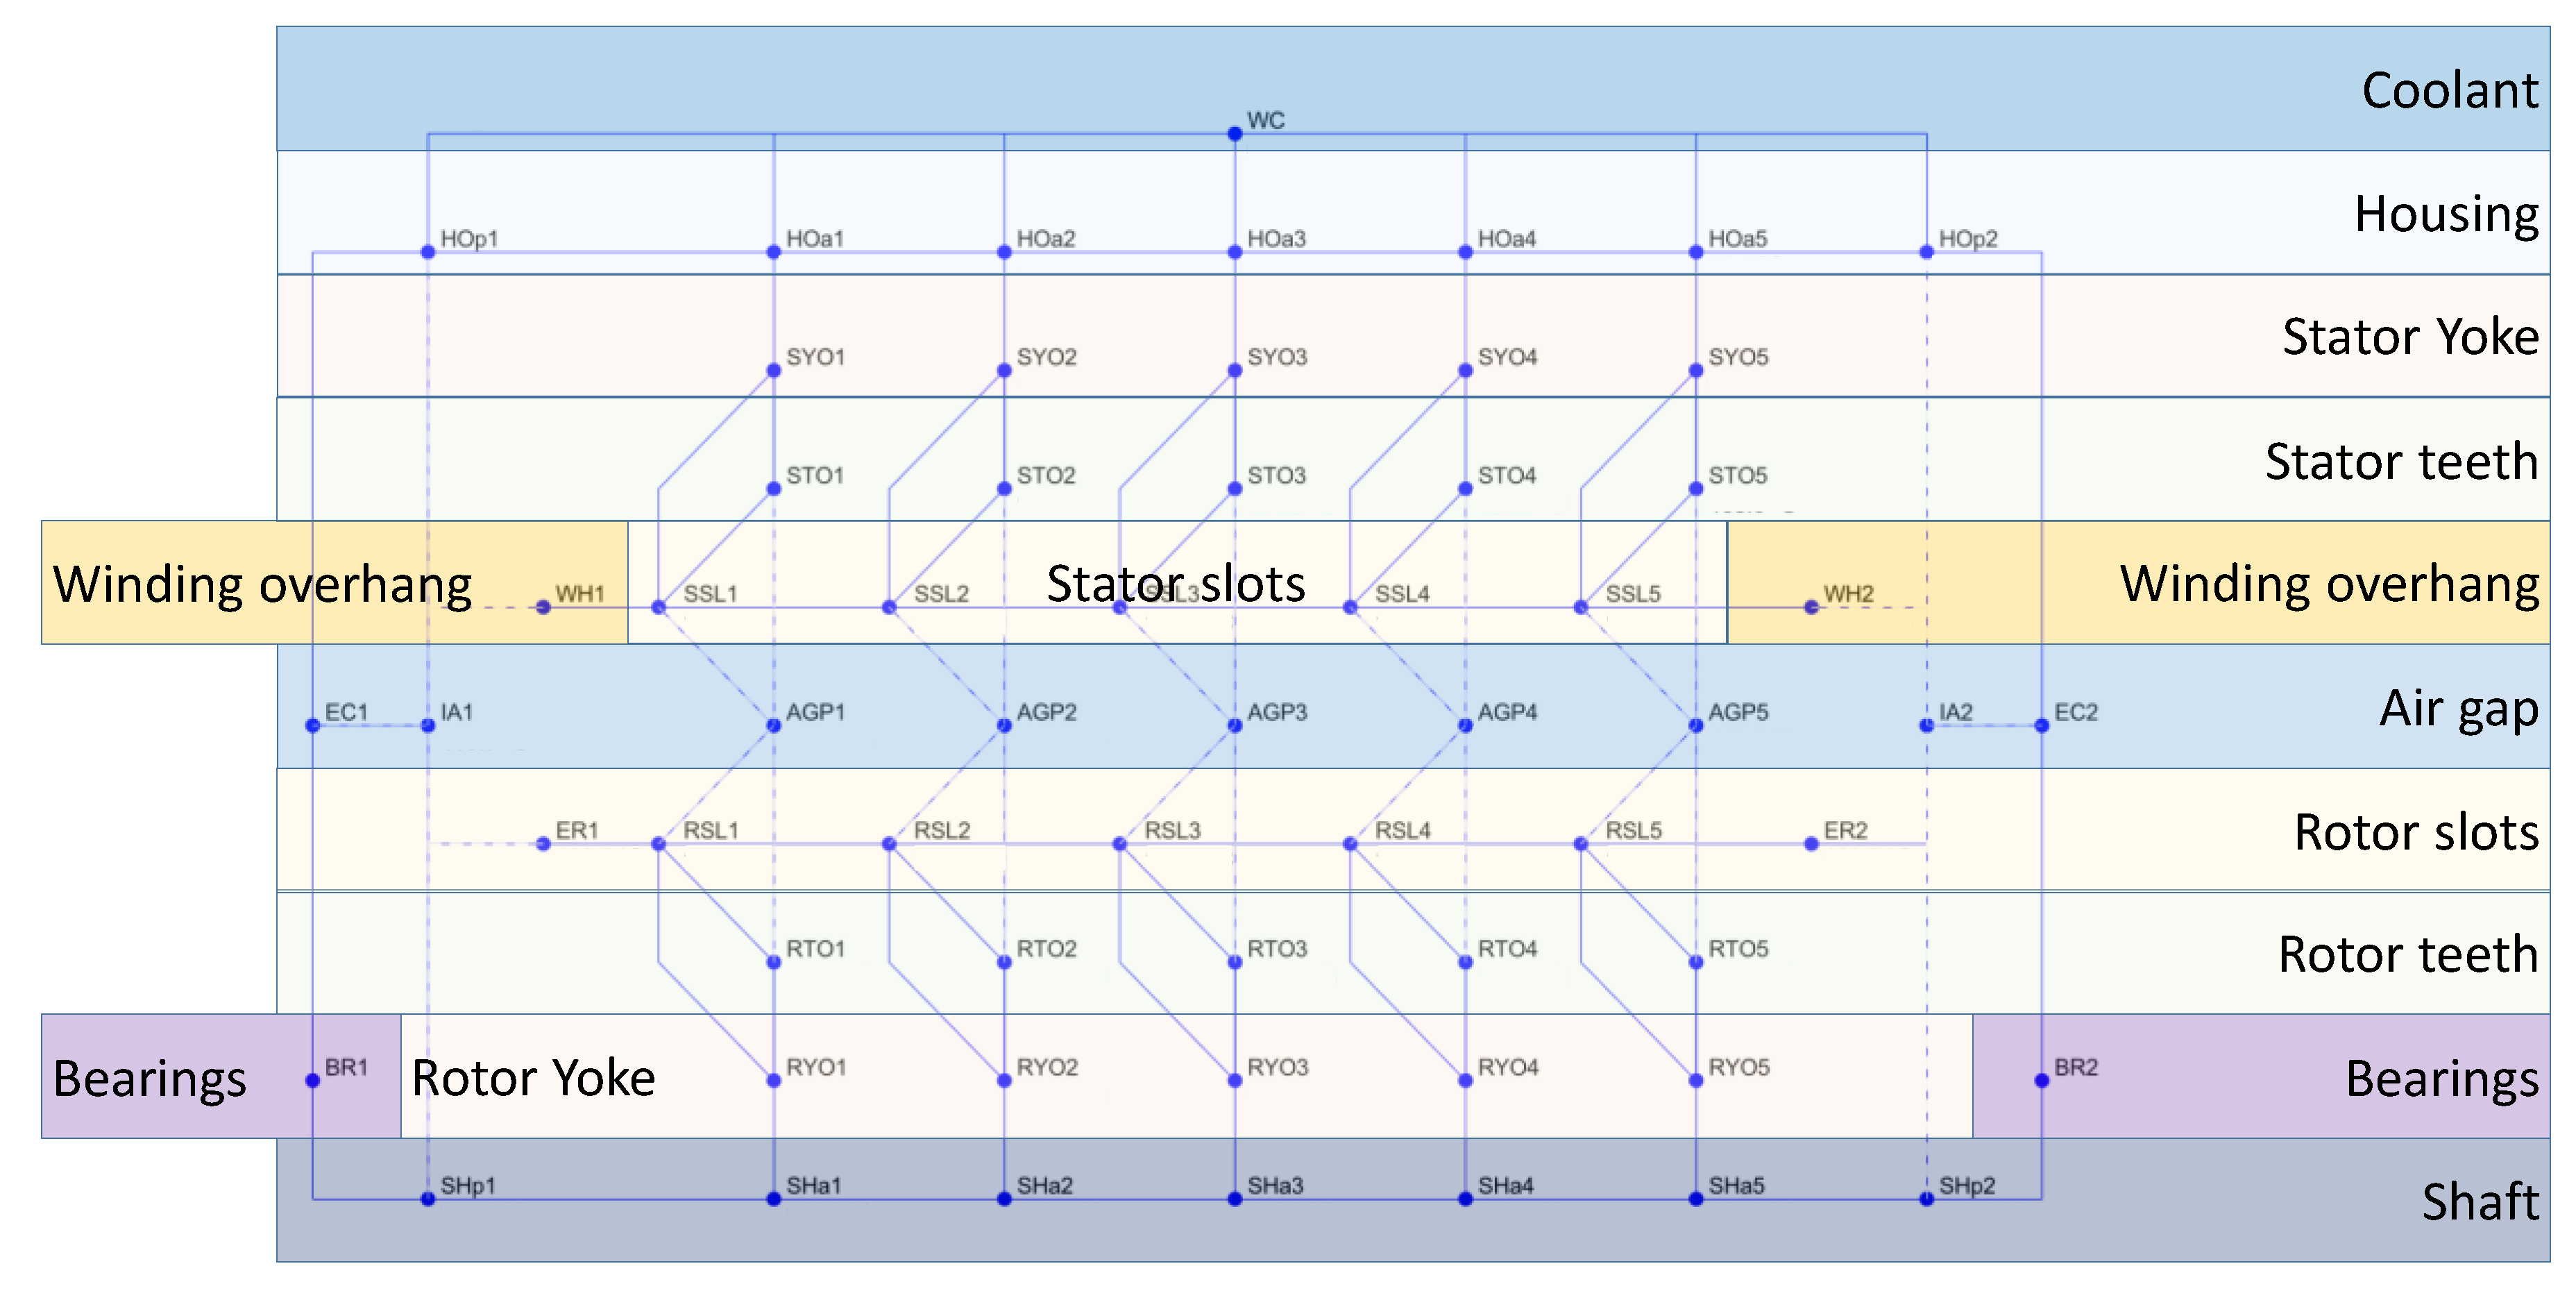
2.4. Thermal Modeling

Due to the established power losses, individual components of the electric machine heat up differently. Since this has a significant influence on the thermal behavior of the electric machine, it is implemented in a simulation model.
Using the finite element method and computational fluid dynamics (CFD) simulation of all components and fluid flows within the electric machine, it is possible to calculate precise and high-resolution temperature fields. However, the effort required to create such a model is high, since the electric machine must be completely designed with every component. In addition, there is a high calculation effort for transient machine loads [4]. This procedure is, therefore, not suitable for the calculation of different variants in a short time and at an early stage in the product development process.
Another approach consists of the construction of thermal equivalent circuits, also called lumped parameter thermal network (LPTN), in which the complex thermal behavior of a component is abstracted by using the analogy between heat transfer and electric current transfer. LPTNs are usually divided into three different classes according to their level of detail [17]. The given number of thermal nodes of the network represents its detailing/resolution and refers to the example of the electrical machine.
  • “Dark Gray Box LPTN”: Low-order thermal network with 2–5 nodes for the most important heat conduction paths. They have a low modeling effort because the system is strongly abstracted. The parameters of such networks have to be determined by abstraction from experimentally obtained training data.
  • “Light Gray Box LPTN”: Important components are modeled, but each has a low spatial resolution (usually one node per component). Thus, these LPTNs usually reach 5–12 nodes. The parameters of the network are calculated using material- and dimension-specific data of the components. They can also be further optimized with the help of measurement data.
  • “White-Box LPTN”: In comparison to the “Light Gray Box LPTN”, the critical and important components are modeled locally in high resolution. This results in a large number of nodes. The parameters of the network are based exclusively on material- and dimension-specific data.
Thermal “black box models” are also possible. The recurrent neural network [17] is an example of such a model, whereas they have to be trained with a variety of measurement data. If different electric machines are to be simulated, data from different machine types must be available in sufficient quantity.

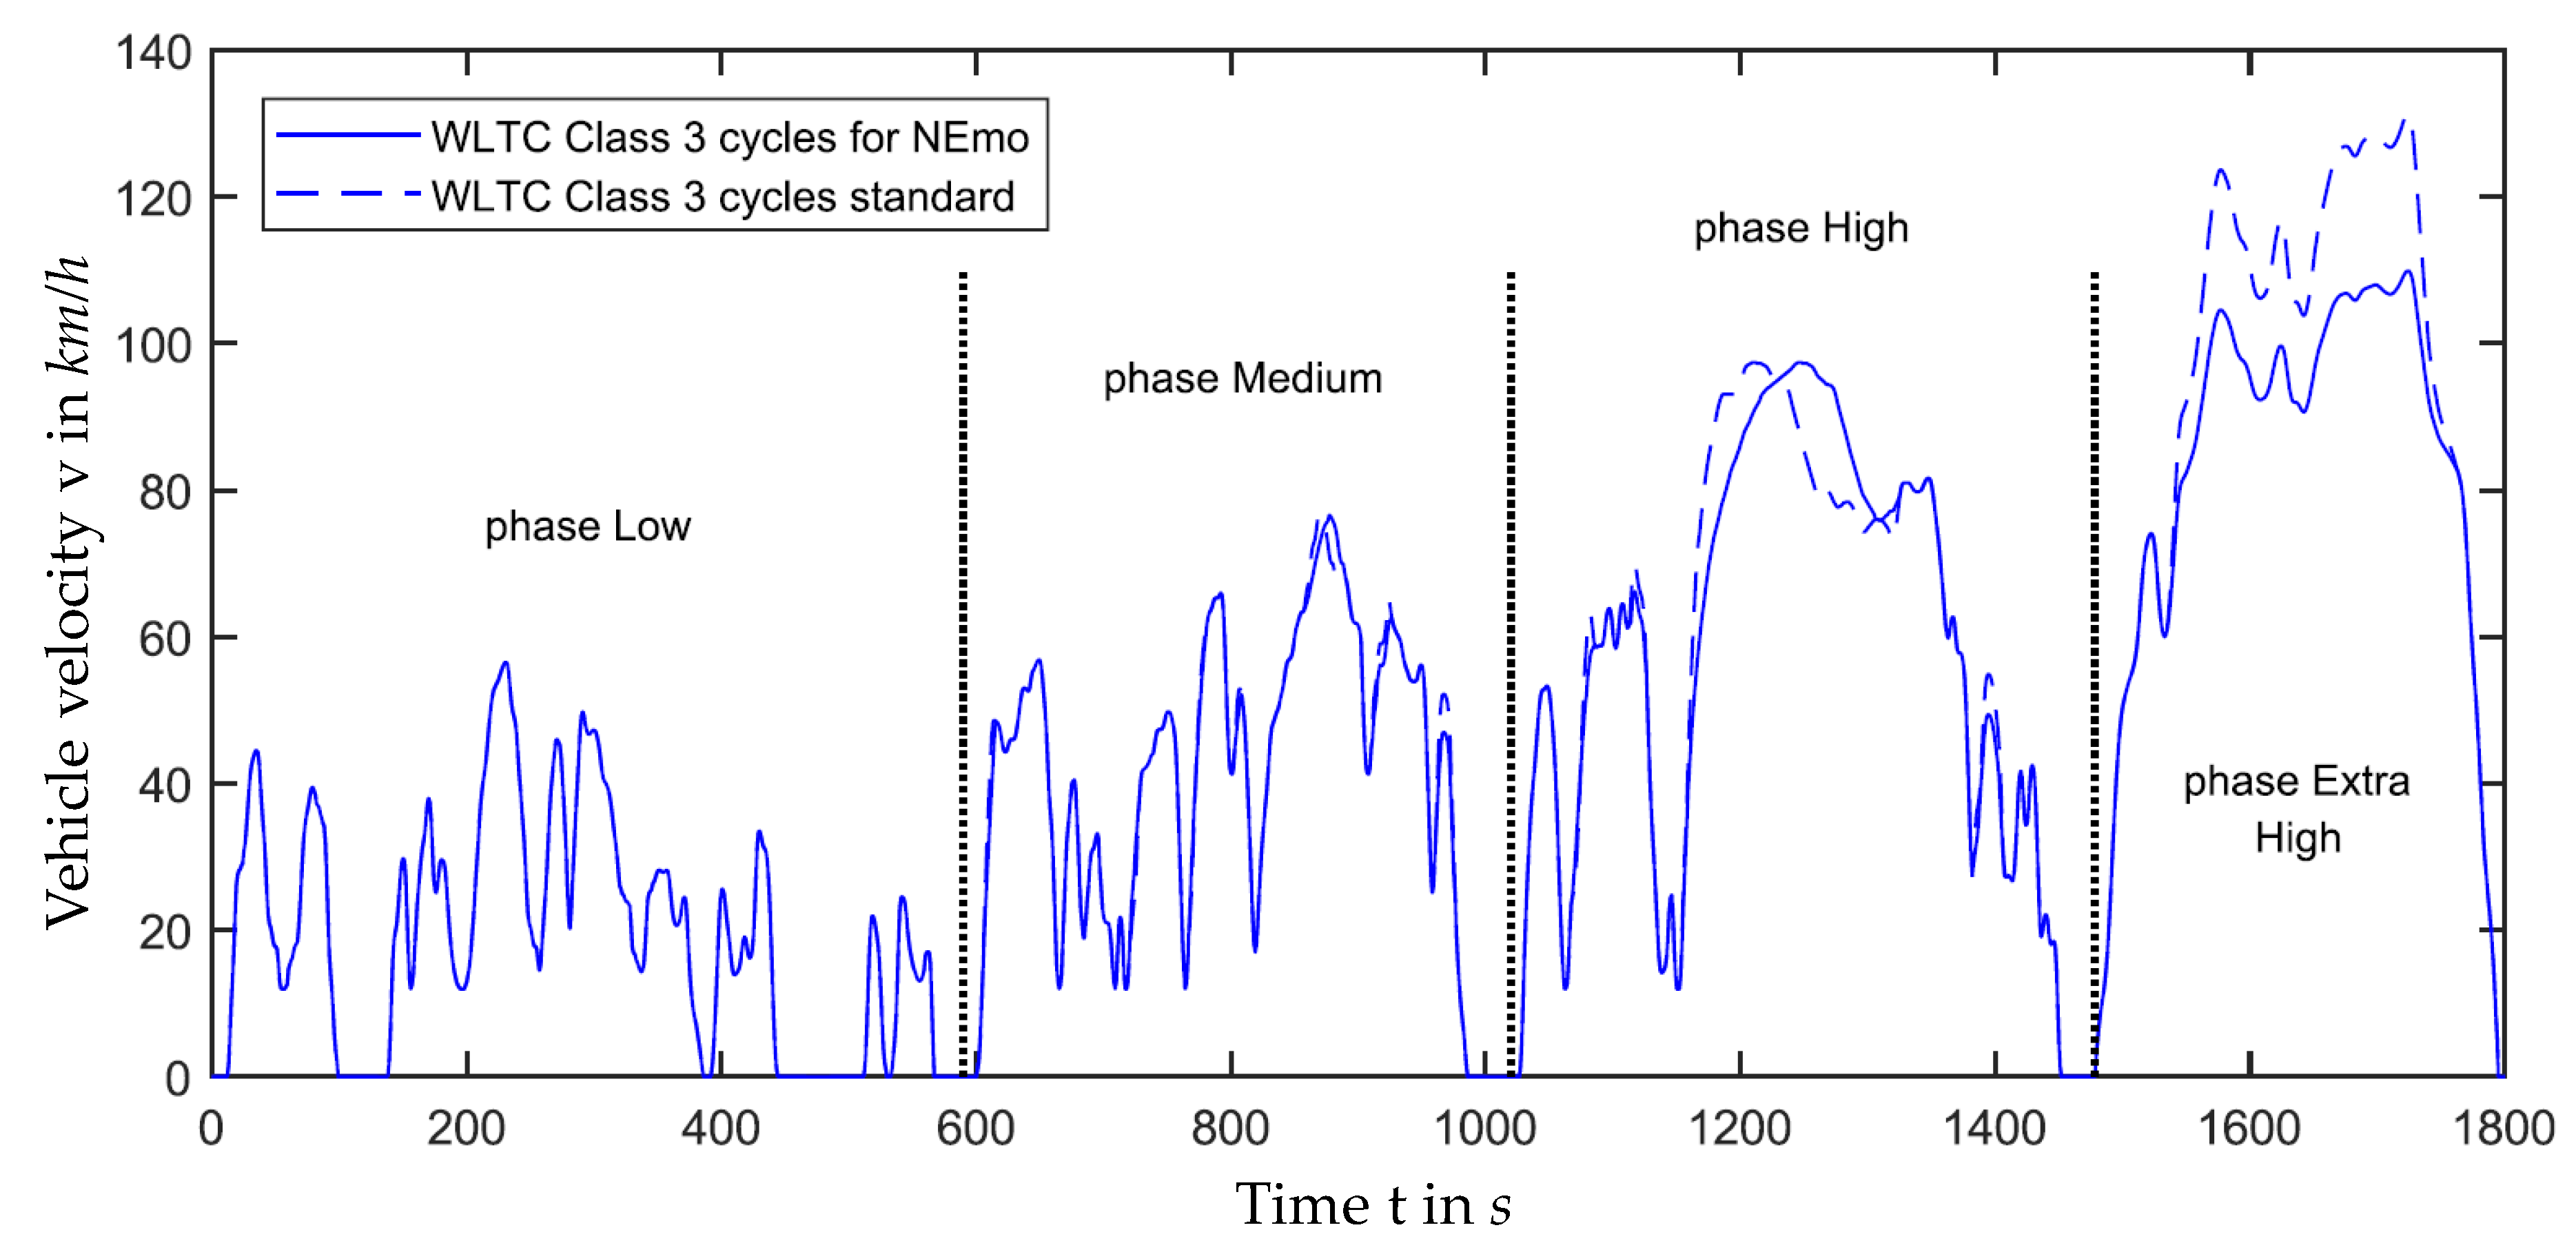
2.5. Vehicle Modeling

Since the load of the electric machine is to be simulated in the application case of an electric vehicle, the modeling of a vehicle environment must be taken into consideration. Here, the aim is to simulate the drive and recuperation torques of the electric machine required by the vehicle. In order to model the exact power flow in the powertrain, a longitudinal dynamics simulation is sufficient when considering normal road traffic [18], whereas only the vehicle speed and thus the acceleration in the direction of travel are taken into account. Only in the application case of motorsports do the lateral dynamics of the vehicle have a significant influence on driving behavior and powertrain [19].
Standardized driving cycles can be used to evaluate the thermal load and efficiency in the simulation. They offer the advantage of good traceability and comparability of the results with other investigations. Today, the most common driving cycle for passenger cars and light commercial vehicles is the WLTP (worldwide harmonized light vehicles test procedure) [20]. It consists of a sequence of different WLTC (worldwide harmonized light vehicles test cycle) driving cycles of different speed ranges depending on the power-to-weight ratio and maximum speed of the vehicle. The WLTC Class 3 driving cycle is used for the majority of today’s vehicles. It consists of the four phases “low”, “medium”, “high” and “extra high”, which correspond to the occurring speeds. With a total length of 30 min, the driving cycle covers both city and motorway travel. Section 3 shows the speed curve of a Class 3 WLTC driving cycle with its four phases. For electric vehicles, the WLTP also determines the specific energy consumption and thus the nominal range.

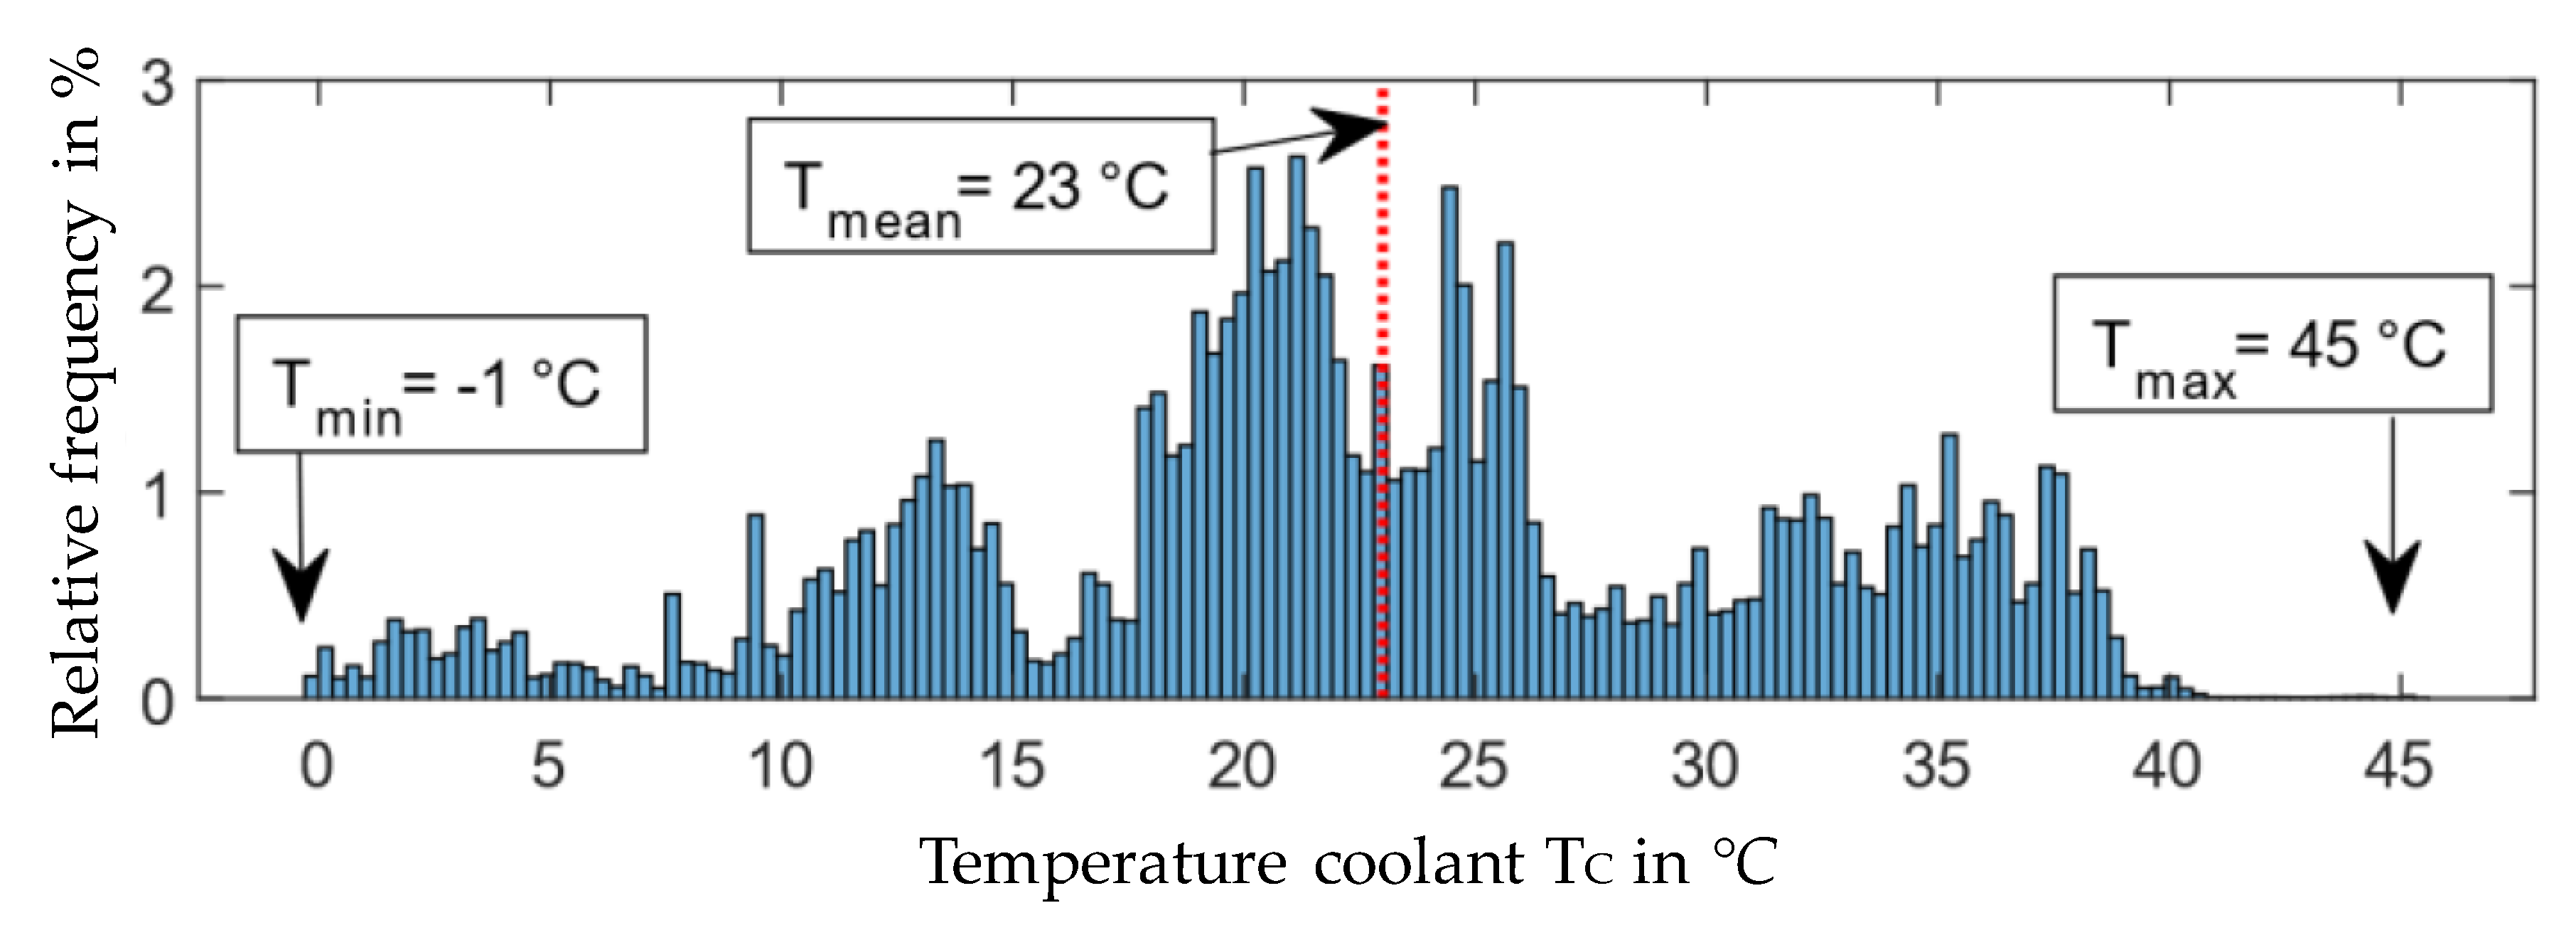
3. Measured Driving Data

Real driving data of battery electric vehicles with IM traction machines from the author’s Institute of Automotive Technology at the Technical University of Munich (TUM) are consolidated for the analysis in this article. The research project NEmo (which stands for user-oriented electromobility in German) was launched at the TUM in 2014. Within the framework of the research project, the problem of the low user acceptance of electric vehicles is addressed, which is mainly based on insufficient overall range and inaccurate range prediction [21].
As part of the project, test drives were carried out from July 2018 to February 2019 with a battery-powered Smart 451 fortwo basic equipped with extensive sensor technology for data acquisition. Table 1 lists the general vehicle parameters of the vehicle that are required for the simulation. For the rolling resistance coefficient fR, a general value from the literature is assumed.
The induction machine AKOW132.1.2.100009 from the company Schwarz Elektromotoren GmbH is installed as a traction machine in the Smart fortwo. It has a weight of 55 kg and an overall length of around 260 mm. The motor housing is made of steel, and on its outer surface, there are two connections for coolant hoses with 10 l/min coolant volume flow and coolant of the type water/glycol 50/50 vol.%. The IM has a nominal torque of 110 N·m and a characteristic speed of 2800 r/min. The maximum output is 35 kW [21].
A measured temperature value is available for the electric machine. The exact sensor type and its position are not known. It is assumed that the most critical temperature of the electric machine is measured and is, therefore, located at the winding head. Several additional temperature sensors are installed in the cooling circuit. All temperature values were recorded at 10 Hz. The winding head temperature is present in the data with a resolution of 1 K. The data acquisition was implemented using sensors and CAN-Data directly from the built-in network and read out using the software tool CANoe from Vector.
Table 2 shows the number and duration of measured test drives for the NEmo project. The duration varies from a few minutes up to 2 h, whereby the short runs offer a low information content regarding the thermal machine load, since the electric machine hardly warms up during short operation.
The frequency distribution of the driving speed is shown in Figure 3a in the form of a histogram. The speed range from 0 to 1 km/h has the highest frequency with 29.8%. The maximum vehicle speed is 111 km/h, which corresponds to the maximum machine rotational velocity of 6050 r/min and thus the maximum speed of the NEmo Smart. The even frequency distribution of the speeds speaks for a mixed driving profile of city, overland and motorway. In urban areas, acceleration and deceleration are frequent due to the usual maximum speeds of 30 and 50 km/h, respectively. Figure 3b shows the frequency distribution of the torque of the electric machine. The highest frequency is at 0 N·m with approx. 27.7%. The fact that this value is less than or equal to the frequency of vehicle standstill from the figure above shows that the drive was rarely sailing with the vehicle. In motor operation (positive torques), the electric motor is used to its maximum overload capacity.
With a peak power of around 35 kW and a low weight of 825 kg, the NEmo Smart achieves a power-to-weight ratio of >34 kW/t. According to the WLTP ordinance, it is, therefore, a Class 3 vehicle [20]. However, the Smart cannot complete with the "Extra High" WLTC at a maximum speed of 132 km/h, since it has a maximum vehicle speed of 110 km/h. Therefore, the cycle is adapted to this lower maximum vehicle speed in the high speed range [20]. The solid line in Figure 4 shows the speed curve of the modified WLTC cycle for the NEmo Smart. The unadapted curve is illustrated with a dashed line, whereas it can be seen, that the maximum vehicle speed was reduced. In addition, strong acceleration phases in the "medium" and "high" phases are slightly attenuated.
The measured winding overhang temperature of the electric machine ranges from a minimum of 0 to a maximum of 105 °C. As can be seen in Figure 5, there is a large accumulation between 20 and 25 °C because the NEmo was parked in a heated hall before many test drives and was, therefore, already preheated at lower outside temperatures. The average winding overhang temperature is 50 °C, and temperatures above 90 °C occur only sporadically.
The coolant of the electric machine reaches a maximum temperature of 45 °C and has an average temperature of 23 °C. The coolant is fed to the electric machine at a maximum temperature of 45 °C. The frequency distribution is shown in Figure 6. It should be noted that the temperature sensors are positioned in the cooling hoses and not directly at the outlet of the electric machine. If the coolant pump is switched off, they measure the ambient temperature at the start of the journey until the pump is switched on. This results in the shown frequency peaks. The comparison of the coolant pump status with the winding overhang temperature shows that the pump is switched on at a winding head temperature of 33 °C.

4. Thermal and Vehicle Model
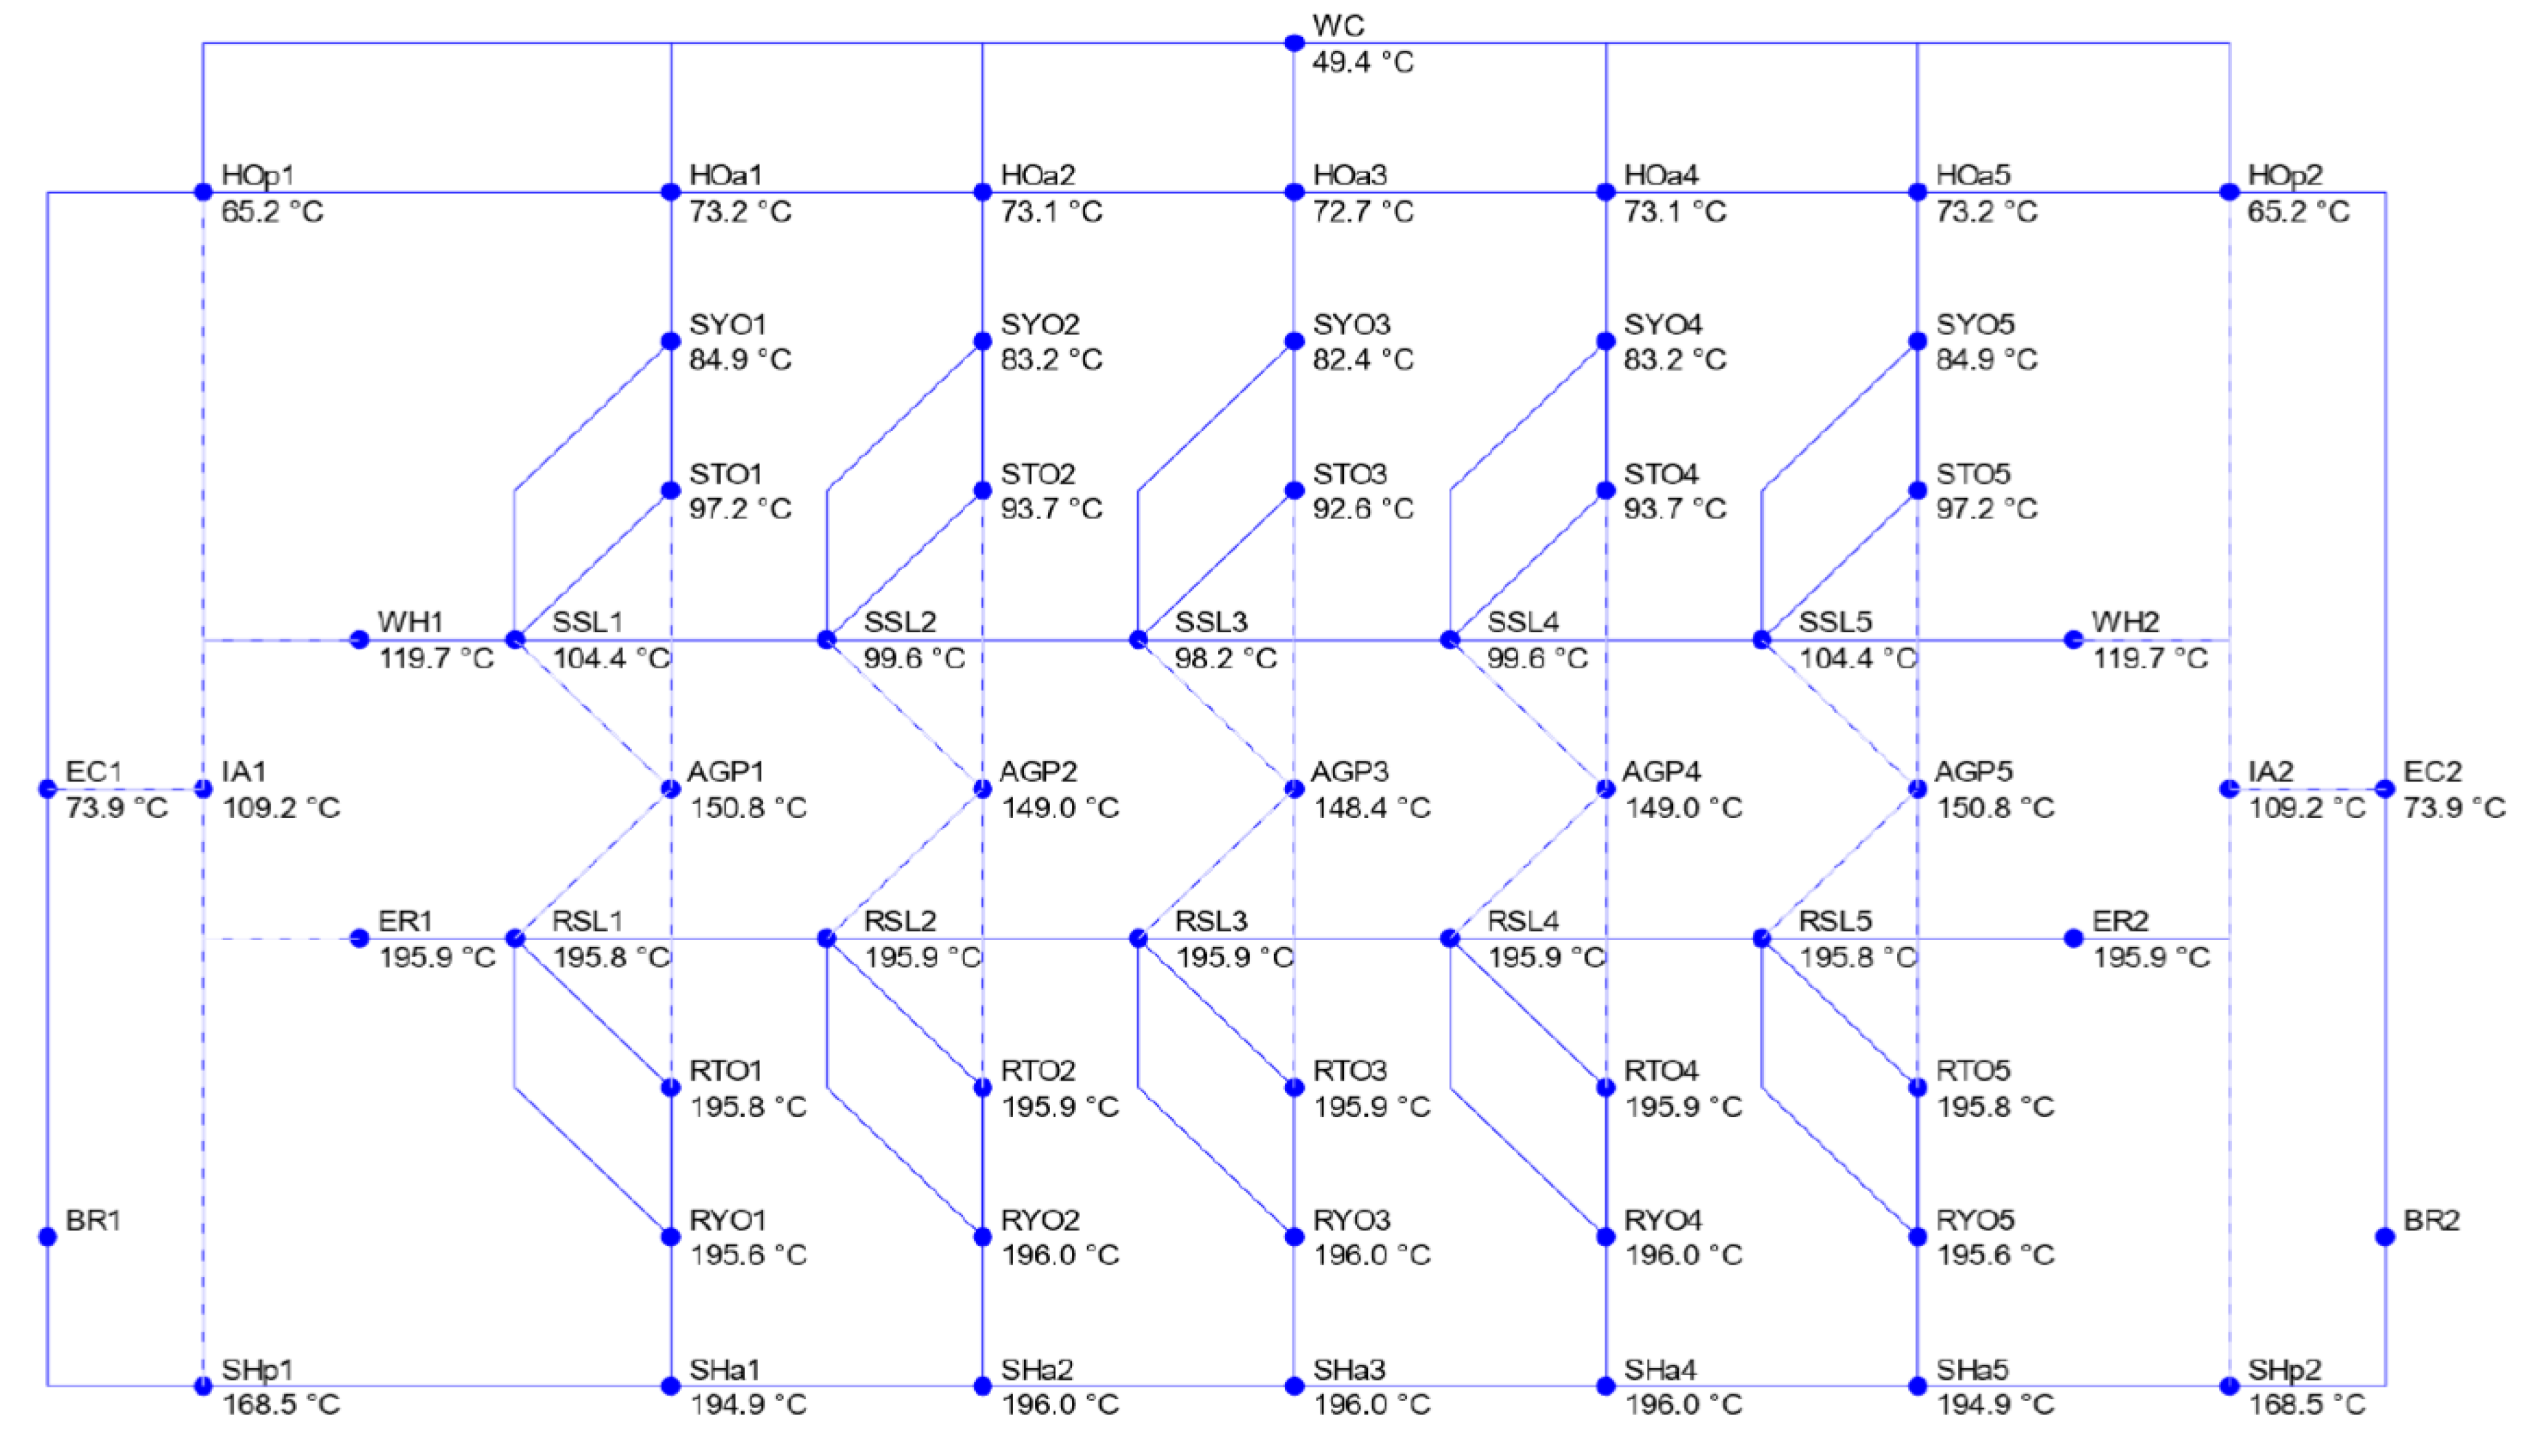
4.1. Thermal Model

The construction and validation of the simulation model, consisting of the vehicle and thermal machine model, is implemented using the MATLAB® extension Simulink®, a block diagram environment for model-based development, modeling and simulation [17].
For the thermal simulation of the electric machine, the approach of the “Light Gray Box” LPTN is selected in this article. The reason for this is the partly incomplete geometry information about the exact structure of the electric machine, e.g., in the area of the winding head or housing, which makes a “white-box” LPTN with higher local resolution impossible. The use of a “Dark Gray Box LPTN” is not feasible because all model parameters would need to be determined using measurement data.
The first step toward abstracting the electric machine into the individual thermal masses of the network is to assume a rotationally symmetrical machine structure and thus a rotationally symmetrical power dissipation during operation. With these prerequisites, the spatial heat conduction in the machine is broken down into a plane in the radial section. Accordingly, a two-dimensional thermal equivalent circuit must be modeled. Analogous to the structure of an IM, the electric machine in the radial section can be differentiated into the individual components shown in Figure 7. Here, the active components of the stator are highlighted in green, the rotor components in blue and all passive components are colored gray. The teeth and slots of the iron sheet each symbolically share one component, since they are alternately distributed on the circumference of the electric machine over the same radius.
The level of resolution (discretization) of the individual components into a number of thermal nodes determines, on the one hand, the computational effort required to calculate the network, which increases with the number of nodes. On the other hand, heat flows and thus temperature behavior are reproduced more realistically with higher resolution [25]. For the modeling of the IM in this article, the dimensions and material data from the machine calculation tool created by the authors’ institute are used [7]. For the realized thermal equivalent circuit, all active components with active length l are divided into five thermal masses, e.g., the stator yoke, stator teeth, stator slots, rotor yoke, rotor teeth and rotor slots. In addition, the passive components rotor shaft and housing directly connected to the active material are also resolved accordingly. This means that the longest or largest individual components are more finely resolved in radial cutting as proposed by KRAL [26].
The thermal behavior of the stator windings is of particular significance for the accuracy of the machine model, since a large part of the power dissipation occurs in the windings and thus large heat flows. At the same time, the description of the stator winding in the slots of the stator and the winding overhang represent the greatest challenge in the thermal modeling of the IM. This is due to the fact that the slots are not completely filled with an electrically conductive material, but implemented with a slot filling factor: the conductors are coated with insulating varnish and are embedded in a potting material. An insulating paper is also inserted between the iron core and the encapsulated conductors.
The abstraction of the rotor winding into the thermal network is simpler than the stator winding. Since the rotor slots each contain one rod instead of several conductors, there is no composite material with potting resin. The short-circuit rings at both ends of the rotor plate also consist of a solid component, this simplifies the calculation of the masses of both components. In addition, the rotor winding has isotropic thermal conductivity, which means that specific thermal conductivities in all directions correspond to those of the conductor material.
For the passive components, neither dimensional nor material information is available via the machine calculation. The housing and rotor shaft are similar due to their axial lengths and cylindrical shape. The simplified form of a hollow cylinder with constant wall thickness is assumed for both.
The air in the air-gap itself is not modeled as a thermal node because it has a small thermal mass which is insignificant for the dynamics of the temperatures. In terms of simulation, it would even have a negative influence, since it represents a particularly small time constant in the differential equation system and thus reduces the integration step necessary for stability [27].
In order to cool the electric machine, only the coolant cooling in the form of a cooling jacket on the housing surface is considered. It is implemented in almost all IMs implemented as a traction machine in electric vehicles because it allows the power and torque density of the electric machine to be increased [28]. The overall thermal network implemented in this article is illustrated in Figure 8.

4.2. Vehicle Model

As an approach of the longitudinal dynamics simulation, a backward modeling approach was implemented, since it significantly reduces the modeling effort, as only the path from the wheel to the electric machine has to be modeled. Since the focus of the investigations is on the thermal behavior of the machine, realistic information and energy flows of a forward-looking simulation do not provide any added value with regard to the desired statements of the simulation.
The wheel represents the first function block of the simulation. Input variables are the speed profile of the vehicle, e.g., from a driving cycle, and, if provided, a gradient profile of the distance traveled. Using the driving resistance equations, the required torque and the speed at the wheel are calculated.
Based on the speed and torque at the wheel, the transmission of the electric machine is carried out in the gear component. Gear ratios occur in the electric vehicle at the axle differential and at one or more spur gear stages connected to it. A constant total gear ratio iEM-R is given as an input variable of the simulation as the quotient of the rotational velocity of the machine and the wheel speed. A shiftable transmission is not implemented in the model. The torque transmission between the wheel and electric machine is loss afflicted. A total gear efficiency must, therefore, be specified for this path. However, since there is hardly any information on the transmission efficiency of electric vehicles, values of manual transmissions from conventionally driven vehicles are used. With such a transmission, the high gears are designed for maximum efficiency; their efficiency should be similar to that of a fixed transmission in an electric vehicle. The literature gives values of up to 96% efficiency from the gearbox input to output shaft [29]. This value is almost constant over the speed of the vehicle and is, therefore, referred to as the speed-independent total transmission efficiency in the model.

5. Results and Discussion

Two effects are expected to influence the efficiency of the powertrain in the driving cycle at varying ambient temperatures. On the one hand, the density of the air decreases with increasing temperature, which reduces air resistance and thus the necessary power. On the other hand, the temperature-dependent change in power dissipation influences machine efficiency. Since the current heat loss with its positive temperature coefficient αohm is the dominating factor, the effect of reduced cycle efficiency at high ambient temperatures is expected. For this, the overload potential of the regarded IM will be analyzed, followed by an investigation of the impact of the ambient temperature on the thermal behavior of the machine, as well as the impact of the length of the regarded driving cycle.

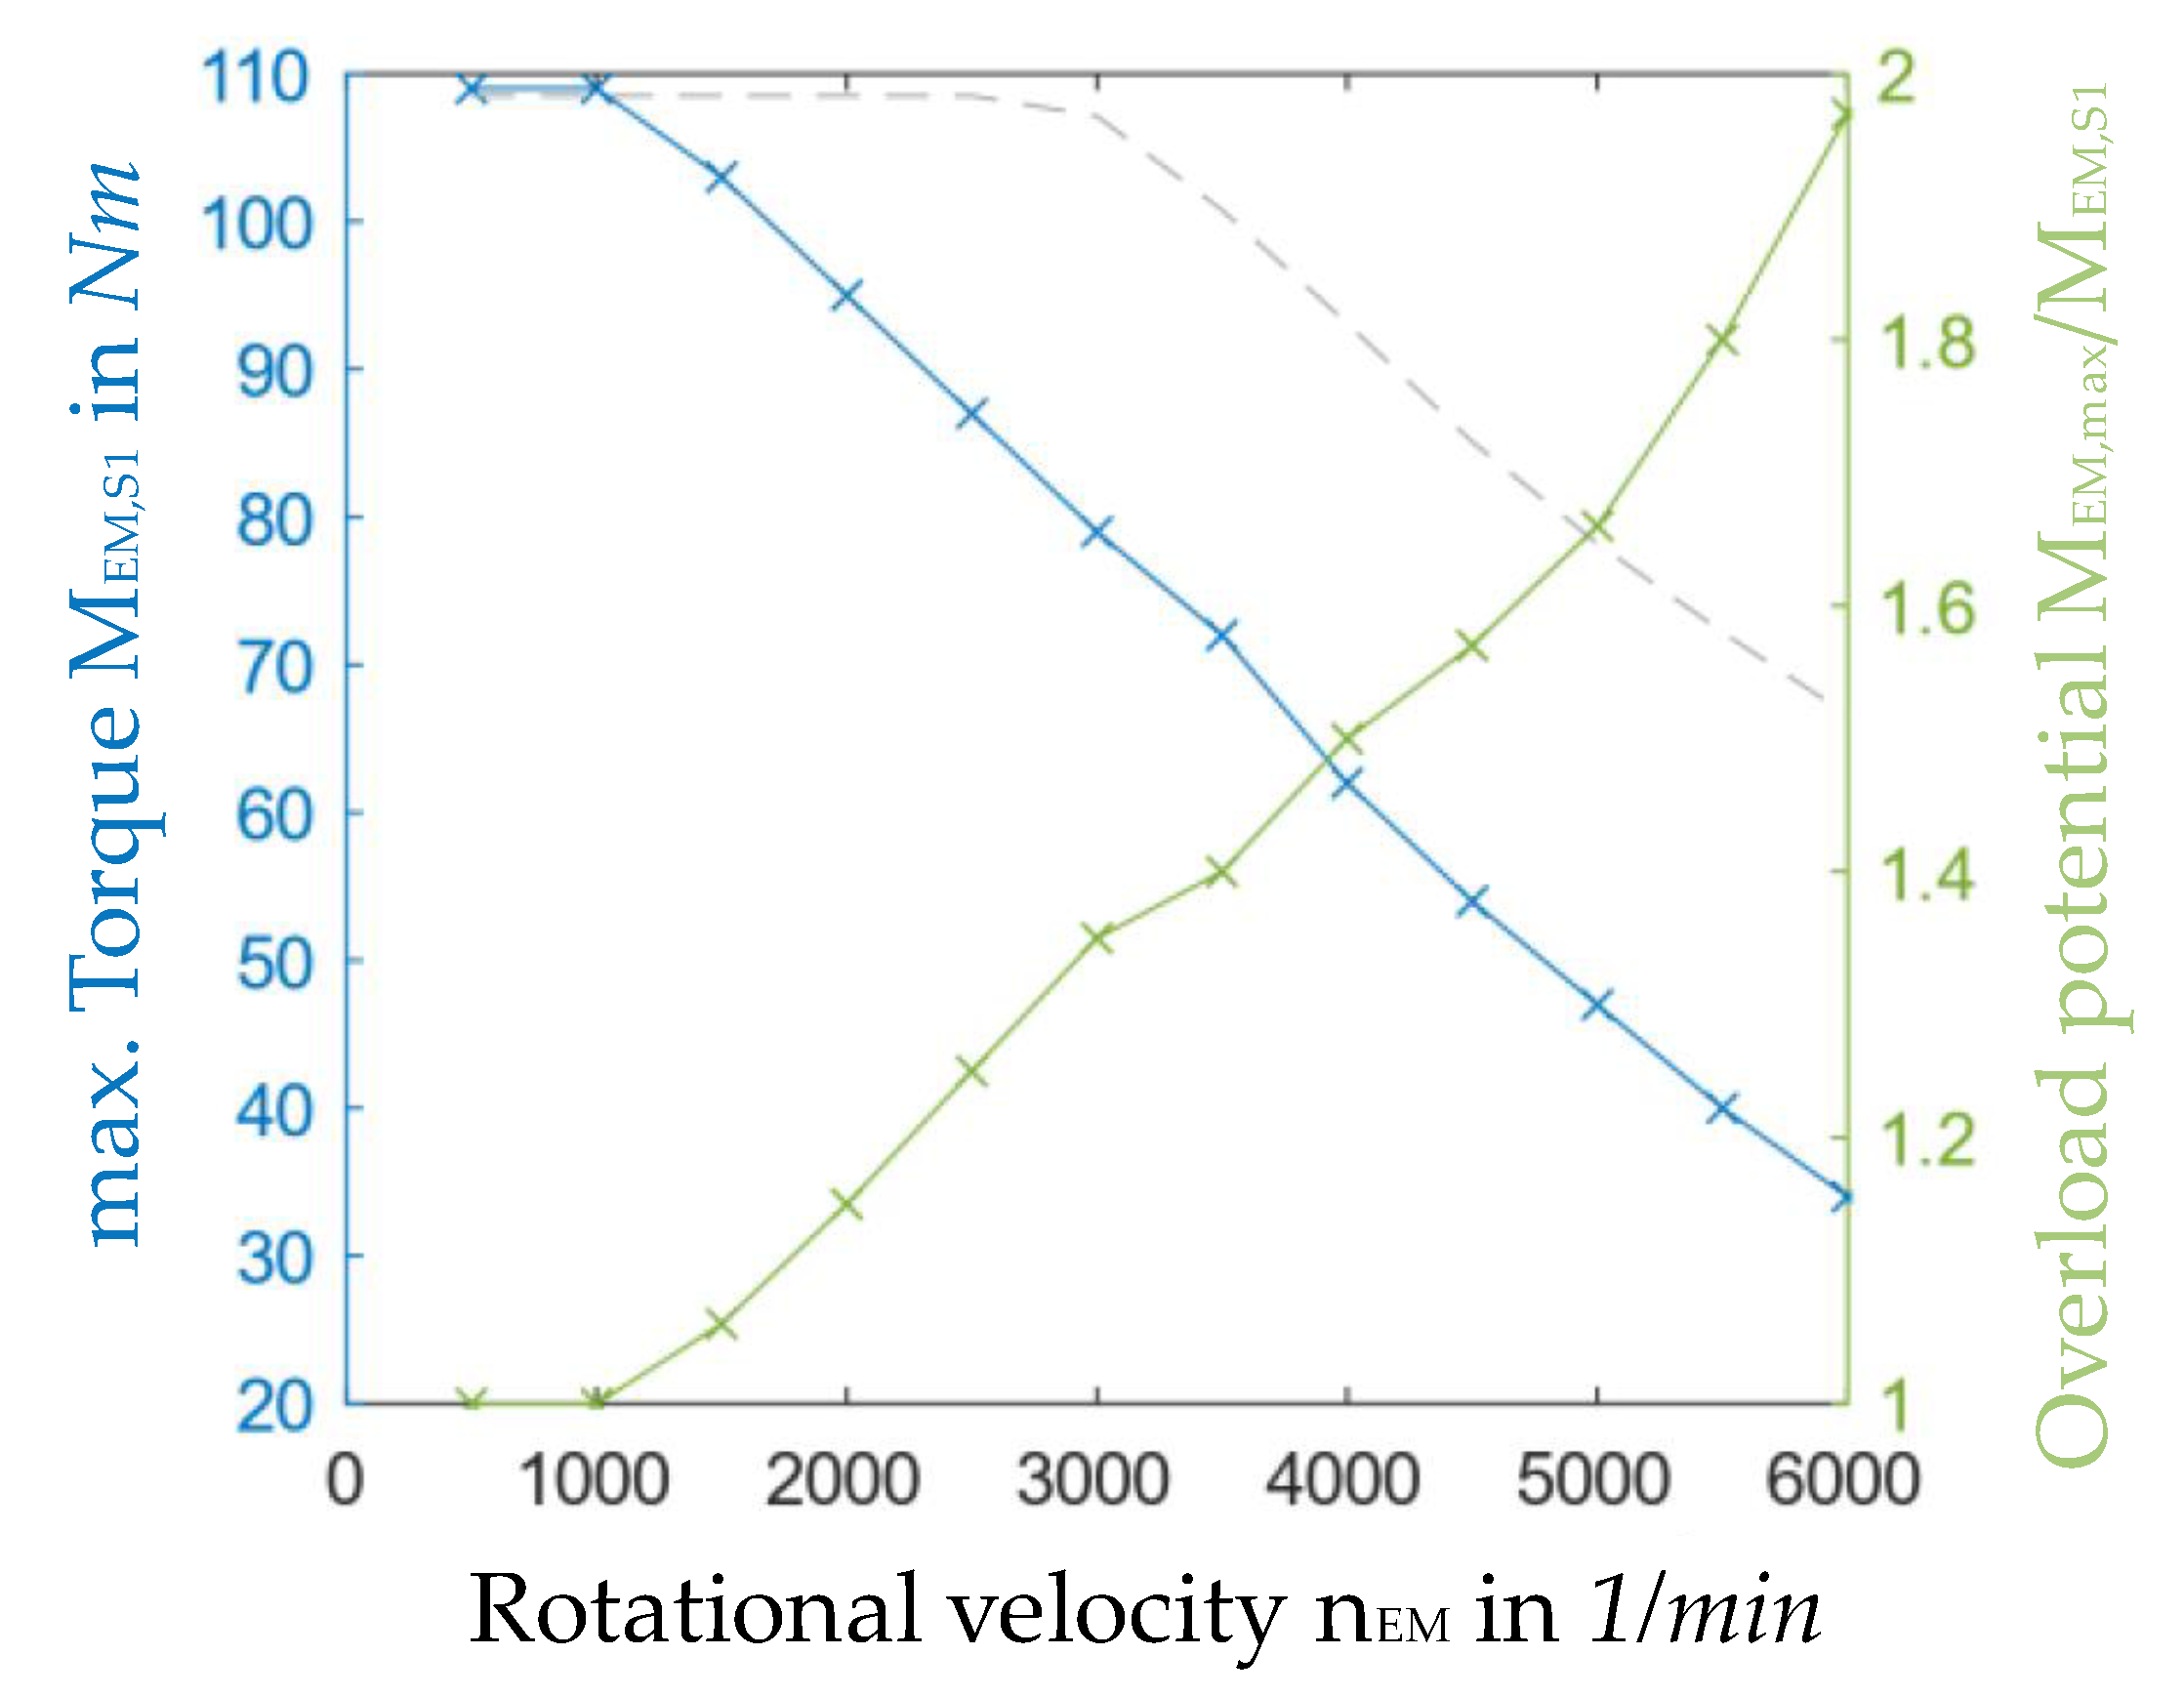
5.1. Overload Potential of Regarded IM

Figure 9 shows the characteristic curve of the nominal torque in blue, whereas the S1-operation represents the full load characteristic behavior of the machine. The maximum torque of the electric machine from the machine characteristic diagram is shown in gray. The green line shows the quotient of the maximum torque and the continuous torque, also known as the overload factor. It ranges between 1 at low speeds and a factor of 1.98 at maximum speed. Thus, the overload factor of the IM of the NEmo is at the lower edge of the usual range in the literature from two to five [4].

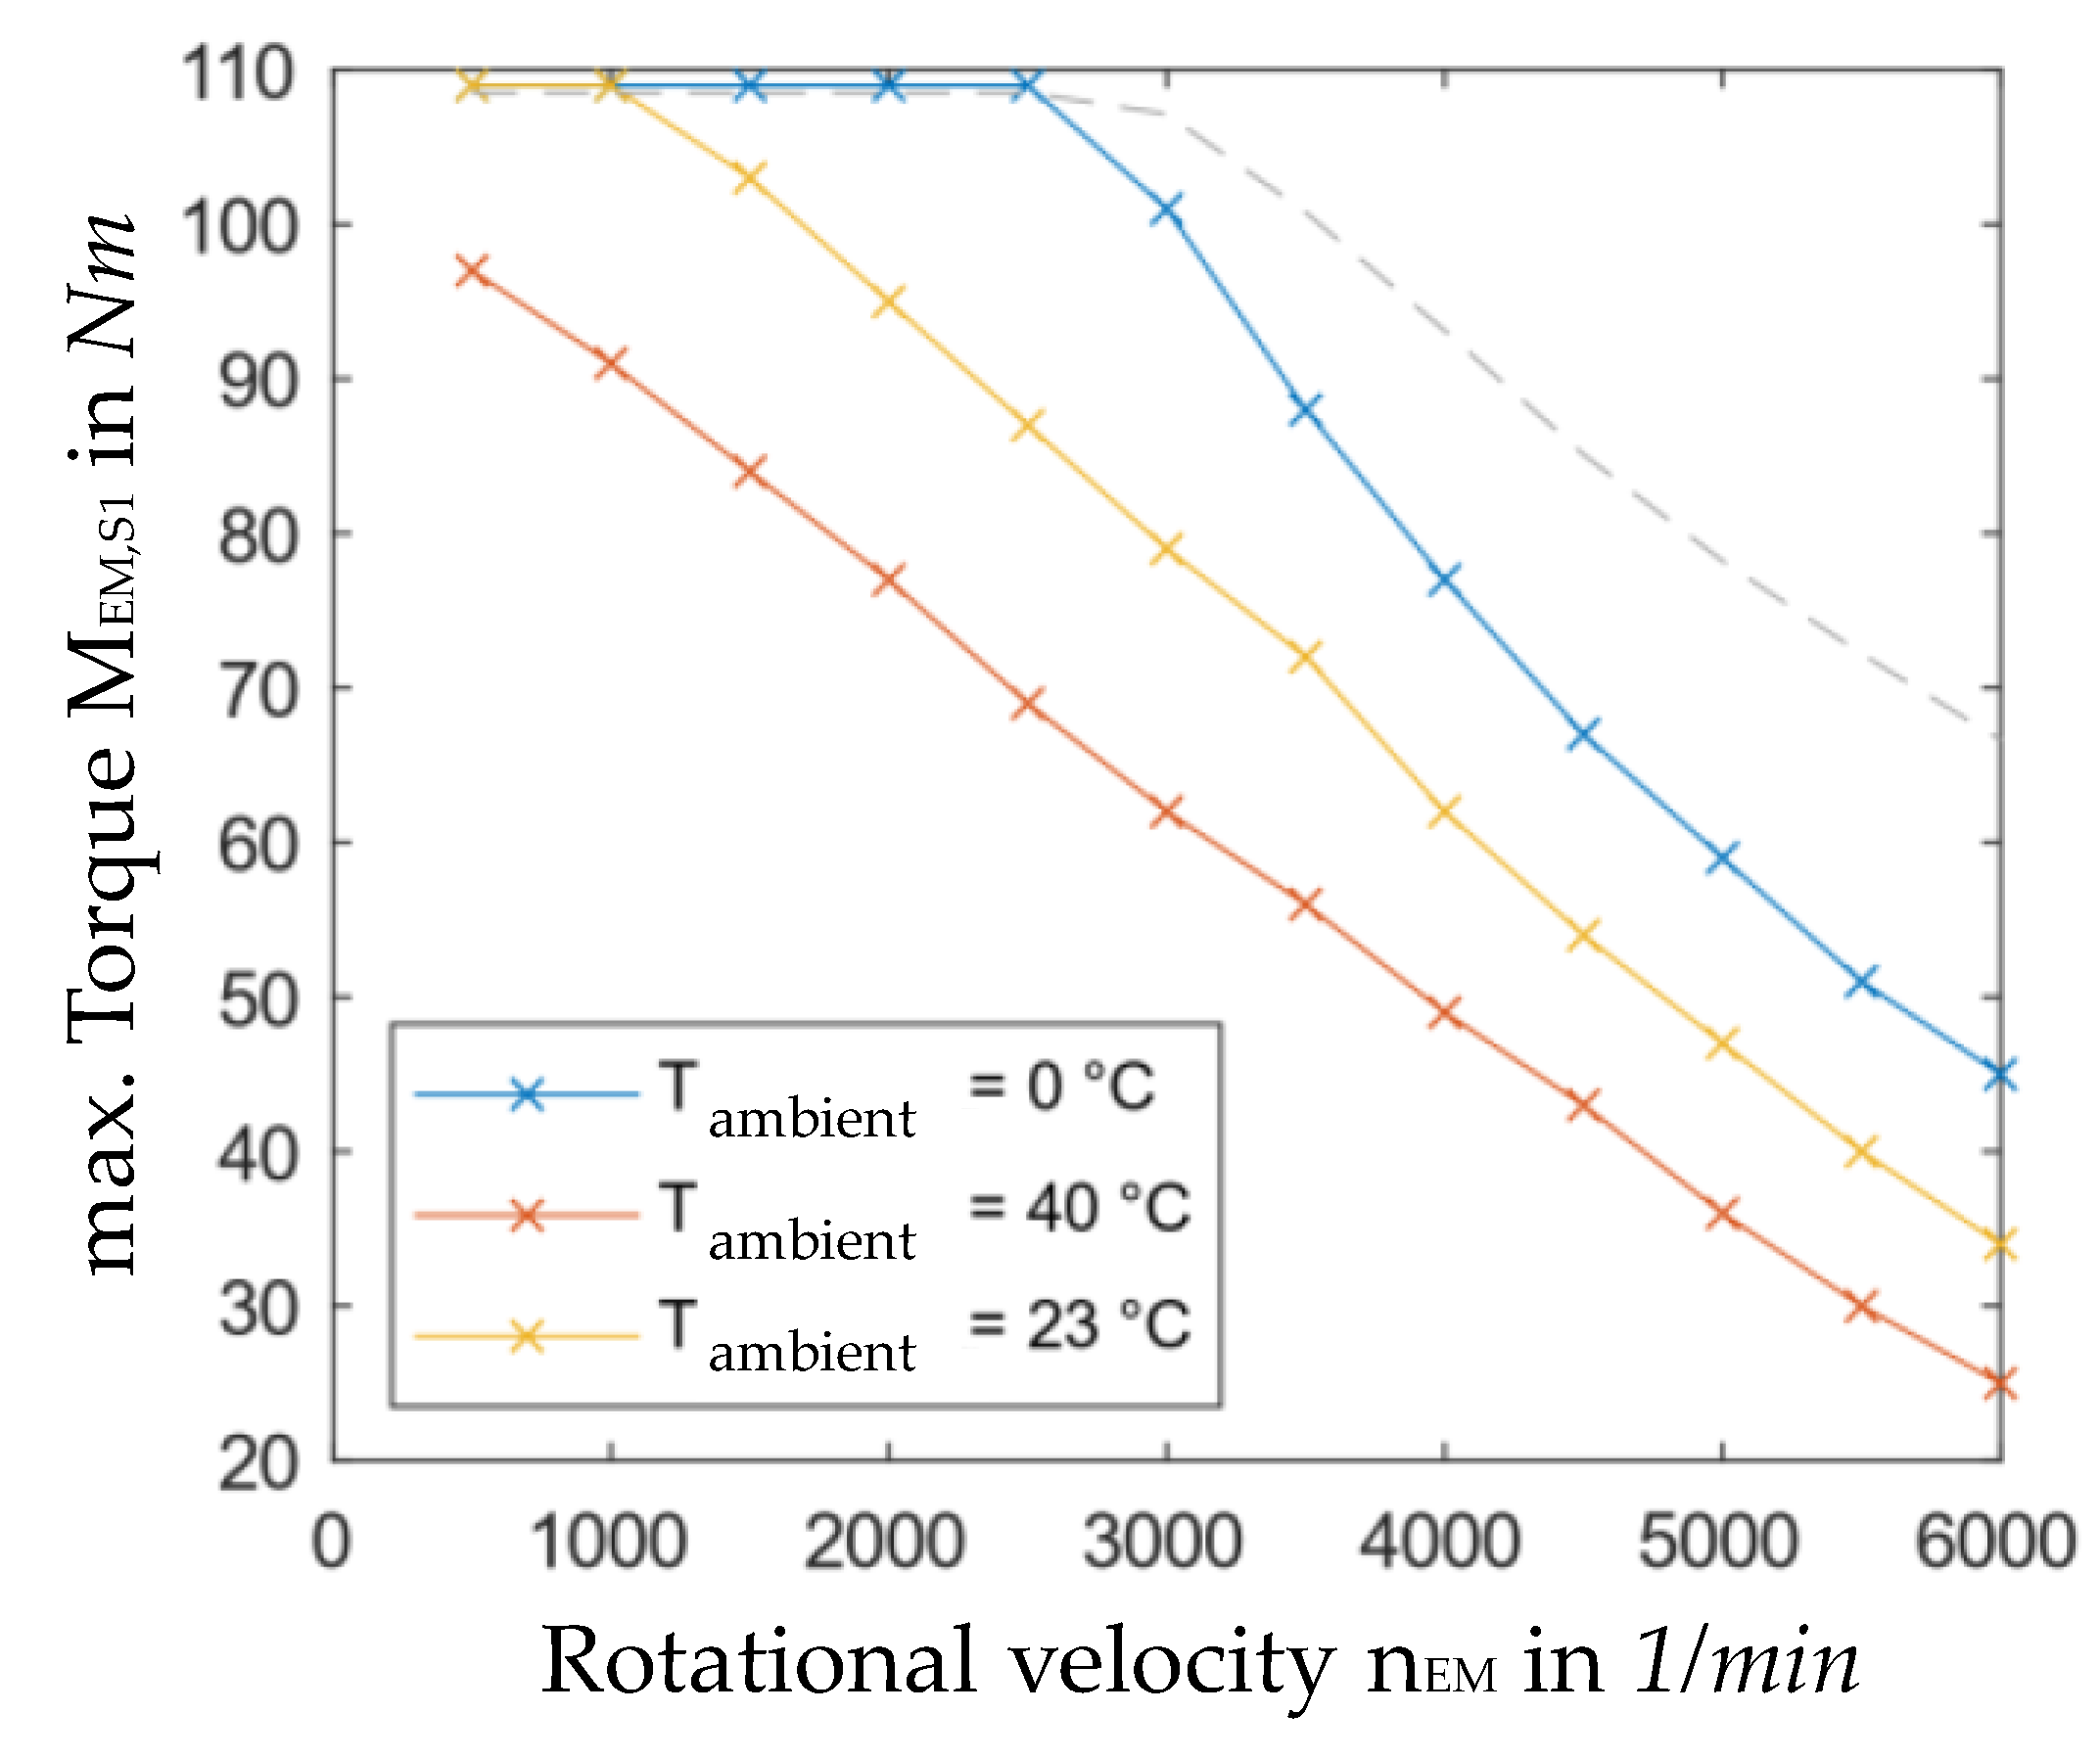
5.2. Effect of Ambient Temperature on Thermal Behavior of Machine

For the variation, the two ambient temperatures, a range between 0 and 40 °C, are considered. The density of the air ρair at the regarded minimum and maximum temperature is 1.276 and 1.023 kg⋅m−3, respectively [30]. For 0 °C, the simulation of the WLTC cycle results in a specific energy requirement of the electric machine of 10.4 kWh/100 km. In order to separately measure the effect of reduced air resistance at 40 °C ambient temperature, a second simulation is carried out with the air density reduced to 1.023 kg⋅m−3. This results in a specific energy requirement of 9.3 kWh/100 km. The lower air resistance thus ensures a consumption saving of 11.1%.
During S1-operation, the increased temperature is accompanied by a significantly reduced maximum torque over the entire speed range. Figure 10 shows the characteristic curves for 0, 23 and 40 °C ambient and starting temperatures of the electric machine. A difference in the maximum torque of 40 N·m at 2500 r/min between the blue and orange curves can be seen. The mean difference between the two curves is 26 N·m. The relative reduction of the continuous power of the electric machine at 40 °C compared to 0 °C ranges from 11% at 500 r/min to 44% at a maximum speed of 6000 r/min.

5.3. Effect of Thermal Behavior

The behavior of the thermal masses in the network will be investigated. For this purpose, the temperature development of the IM in the standard settings (S1-operation) is considered. The complete temperature development of the simulation can be viewed graphically for the two operating points described below in Figure 11 for 1500 r/min and 103 N·m and Figure 12 for 6000 r/min and 34 N·m, each with maximum permissible torque in respect to speed.
It can be seen that at a speed of 1500 r/min and a maximum torque of 103 N·m, the highest temperatures occur in the rotor. They amount to 196 °C both at the short-circuit rings and in the middle of the rotor iron, but represent an uncritical value for copper conductors and iron sheets. Due to the high rotor temperatures, peak temperatures of 169 °C are also present at the thermal nodes of the passive rotor shaft, which connect directly to the bearings. At the housing covers on the outside of the bearings, the temperature for this operating point is 74 °C. It is, therefore, assumed that the average temperature in the bearings is 122 °C, which is not a critical value for common lubricants [31].
In the stator, the temperature gradient between the winding heads and the middle of the winding is 21.5 K. In the stator teeth and yoke, the gradient is reduced to 4.6 K and 2.5 K, respectively. The mean temperature in the air-gap is about 150 °C and the coolant reaches 49.4 °C. A total power loss of 1352 W is calculated.
At 6000 r/min and 34 N·m, a higher total power loss of 1539 W occurs in the electric machine, which results in a higher coolant temperature of 53.6 °C. While the temperatures in the rotor and air-gap drop with an average of 170 and 140 °C compared to the operating point at lower rotational velocity, there is a rise in temperature for all stator components as well as in the housing. At the same maximum winding head temperature, this leads to a reduced temperature gradient of 13 K within the stator winding.
In the rotor, a small gradient of 2 K in the direction of lower temperatures can be seen on the short-circuit rings. This speaks for increased heat dissipation via the internal air convection at high speed. The effect can also be seen in the housing covers, which are 14 K warmer at 88 °C. The heat dissipation of the inner air convection at high speed is also reduced.
Finally, it can be stated that in the IM of the NEmo, no other components of the electric machine besides the winding overhang are operated at or near their limit temperature. Only on the temperature at the bearings must be taken into account when selecting the lubricant so that it does not undergo thermal decomposition. In this case, however, the thermal network can only provide a guide value due to the lack of more precise modeling of the bearings.

6. Summary and Outlook

This article investigates the thermal load limits of an induction machine of a specific use case and examines the associated change in machine efficiency during operation. For this purpose, measurement data of a battery electric vehicle was analyzed and a thermal machine model was built and validated in MATLAB Simulink®. This thermal model was used to investigate the sensitivity of model parameters, as well as analyses of continuous load capacity, thermal load and efficiency in the WLTC driving cycle under changing boundary conditions. For the thermal modeling of the electric machine, a two-dimensional, thermal equivalent circuit with 50 individual masses was built according to common approaches used in literature.
The parameterization of the model is kept variable by using efficiency diagrams, dimensions and other specifications of the electric machine from a machine design tool at the author’s institute [7]. Thus, different variants of water-cooled IM can be simulated without great computational effort. The thermal model can also be quickly and easily extended by using the Simscape® extension in Simulink®. This enables the investigation of the dependency of machine efficiency on the thermal behavior of an electric machine and evaluates its effects on powertrain efficiency. For example, simulations with different cooling capacities of the cooling system or ambient temperatures were carried out. It can be seen that the temperature-dependent power losses have a significant influence on the calculation of the continuous load capacity of the electric machine. The increase in temperature for the regarded electric machine during the obtained test drives leads to an increase in power loss of up to 30% and thus lowers the overall range of the vehicle and the continuous load.
The selected modeling approach of the thermal equivalent circuit for the calculation of the machine temperatures can be quickly and easily extended or modified due to the implementation in MATLAB Simulink®. As a positive result of the thermal simulation, it has to be emphasized that the agreement of model and measurement data is plausible and the relative comparison was validated. No fitting of the model had to take place. As the evaluations show, the IM of the NEmo only has a small overload factor. Especially in the low speed range, the maximum machine torque can be approached continuously without overheating the electric machine.
In future work, a finer resolution of the winding overhang would be particularly desirable since it is the most critical and, therefore, most interesting component in regard to the thermal behavior of the simulation. Due to the lack of exact construction data, a resolution higher than one was not possible in the conducted analysis, since only the mass of the winding head was known.
Additionally, the electric machine of an electric vehicle is in constant heat exchange with other components and systems of the powertrain, which is why the question of the consideration limit in the thermal modeling must be determined. The most obvious exchange takes place with the cooling system or, in the case of an air-cooled electric machine, with the ambient air. In addition, a gearbox is connected to the electric machine in conventional drive train topologies. On the one hand, heat can be dissipated into the gearbox via a contact surface. On the other hand, the gearbox also has an efficiency, i.e., power losses, which can have a partial effect on the electric machine. However, due to the typically high gear efficiency (>96%), this influence can be regarded as very small [29].

Author Contributions

As first author, S.K. initiated the idea of the presented topic, drew up the overall concept of this paper and conducted the implementation. K.L.S. and P.N. supported as part of their thesis with the data analysis, implementation of the thermal model and evaluation of the results. T.H. supported in the discussion of results and implementation of the methodology. All authors discussed and commented on the article at all stages. M.L. made an essential contribution to the conception of the research project. He revised the paper critically for important intellectual content. M.L. gave final approval of the version to be published and agrees to all aspects of the work. As a guarantor, he accepts responsibility for the overall integrity of the paper. All authors have read and agreed to the published version of the manuscript.

Funding

This research received no external funding.

Conflicts of Interest

The authors declare no conflict of interest.

Open-Source

References

  1. Mähler, C. Batterien in Elektroautos: Aktueller Stand und Perspektiven. Available online: https://www.stromschnell.de/technik/batterien-in-elektroautos-aktueller-stand-und-perspektiven_5123204_ 5093776.html (accessed on 10 October 2019).
  2. Roeder, S. Zweigang-Automatik von ZF Sorgt für Mehr Reichweite. Available online: https://www.autogazette.de/zf/getriebe/elektro/zweigang-automatik-von-zf-sorgt-fuer-mehr-reichweite-989396271.html (accessed on 10 October 2019).
  3. Automobilkonstruktion, K.E.M. Getriebe Haben Auch im E-Fahrzeug Eine Zukunft. Available online: https://automobilkonstruktion.industrie.de/alternative-antriebe/getriebe-haben-auch-im-e-fahrzeug-eine-zukunft/ (accessed on 10 October 2019).
  4. Horlbeck, L. Auslegung Elektrischer Maschinen für Automobile Antriebsstränge unter Berücksichtigung des Überlastpotentials. Ph.D. Thesis, Institute of Automotive Technology, Technical University of Munich, München, Germany, 2018. [Google Scholar]
  5. Bolvashenkov, I.; Herzog, H.-G. Approach to predictive evaluation of the reliability of electric drive train based on a stochastic model. In Proceedings of the 2015 International Conference on Clean Electrical Power (ICCEP), Taormina, Italy, 16–18 June 2015; pp. 486–492. [Google Scholar]
  6. Auinger, H. Determination and designation of the efficiency of electrical machines. Power Eng. J. 1999, 13, 15–23. [Google Scholar] [CrossRef]
  7. Kalt, S.; Erhard, J.; Danquah, B.; Lienkamp, M. Electric Machine Design Tool for Permanent Magnet Synchronous Machines. In Proceedings of the 2019 Fourteenth International Conference on Ecological Vehicles and Renewable Energies (EVER), Monte-Carlo, Monaco, 8–10 May 2019. [Google Scholar]
  8. Hombitzer, M.; Franck, D.; von Pfingsten, G.; Hameyer, K. Permanentmagneterregter Traktionsantrieb für ein Elektrofahrzeug: Bauraum, Wirkungsgrad und Kosten—Das Auslegungsdreieck. In Elektrische Antriebstechnologie für Hybrid- und Elektrofahrzeuge: Das Kostenoptimale Elektrische Antriebssystem, Mitentscheidend für den Markterfolg; Expert Verlag: Renningen, Germany, 2014. [Google Scholar]
  9. Doerr, J.; Attensperger, T.; Wittmann, L.; Enzinger, T. Die neuen elektrischen Achsantriebe von Audi. MTZ Motortech. Z. 2018, 79, 16–25. [Google Scholar] [CrossRef]
  10. Knoblauch, D. Elektrische Maschine mit gekühlter Rotorwelle. Patent DE102013104711A1, November 2014. [Google Scholar]
  11. Kresser, T. E-Motor mit Direktkühlung: Mehr Leistung, Weniger Verschleiß. Available online: https://www.ingenieur.de/technik/fachbereiche/e-mobilitaet/e-motor-mit-direktkuehlung-mehr-leistung-weniger-verschleiss/ (accessed on 20 October 2019).
  12. Pyrhonen, J.; Jokinen, T.; Hrabovcová, V. Design of Rotating Electrical Machines; Wiley: Chichester, UK, 2014. [Google Scholar]
  13. Fräger, C. Formelsammlung Elektrische Antriebe; Springer: Hannover, Germany, 2017. [Google Scholar]
  14. Müller, G.; Vogt, K.; Ponick, B. Berechnung Elektrischer Maschinen, 6th ed.; WILEY-VCH: Weinheim, Germany, 2008. [Google Scholar]
  15. Saari, J. Thermal Modelling of High Speed Induction Machines; Finnish Acad. of Technology: Helsinki, Finland, 1995. [Google Scholar]
  16. Schutzhold, J.; Hofmann, W. Analysis of the temperature dependence of losses in electrical machines. In Proceedings of the 2013 IEEE Energy Conversion Congress and Exposition, Denver, CO, USA, 15–19 September 2013; pp. 3159–3165. [Google Scholar]
  17. Wallscheid, O.; Böcker, J. Global identification of a low-order lumped-parameter thermal network for permanent magnet synchronous motors. IEEE Trans. Energy Convers. 2015, 31, 354–365. [Google Scholar] [CrossRef]
  18. Pischinger, S.; Seiffert, U. Vieweg Handbuch Kraftfahrzeugtechnik; Springer: Wiesbaden, Germany; Fachmedien: Wiesbaden, Germany, 2016. [Google Scholar]
  19. Görke, D. Untersuchungen zur Kraftstoffoptimalen Betriebsweise von Parallelhybridfahrzeugen und Darauf Basierende Auslegung Regelbasierter Betriebsstrategien; Springer: Wiesbaden, Germany; Fachmedien: Wiesbaden, Germany, 2016. [Google Scholar]
  20. UNECE. Sustainable Development Goals, Proposal for Amendment 5 to Global Technical Regulation No. 15 (Worldwide Harmonized Light Vehicles Test Procedures (WLTP)): ECE/TRANS/WP.29/GRPE/2019/2, Report. 2018. [Google Scholar]
  21. Reiter, C.; Wassiliadis, N. NEmo—Nutzerorientierte Elektromobilität. Available online: https://www.ftm.mw.tum.de/nemo/ (accessed on 1 August 2019).
  22. Adermann, J. FORELMO Smart Dokumentation; Institute of Automotive Technology, Technical University of Munich: Munich, Germany, 2016. [Google Scholar]
  23. DriverSide. Technical Specifications 2013 Smart fortwo Passion Coupe. Available online: https://www.driverside.com/specs/smart-fortwo-2013-30980-54223-0 (accessed on 15 October 2019).
  24. Otto, S. Zubehör: Felgen. Available online: https://www.smart-roadster-club.de/download/Zubehoer Felgen.pdf (accessed on 10 October 2019).
  25. Oechslen, S. Thermische Modellierung Elektrischer Hochleistungsantriebe; Springer: Wiesbaden, Germany; Fachmedien: Wiesbaden, Germany, 2018. [Google Scholar]
  26. Kral, C.; Haumer, A.; Bäuml, T. Thermal model and behavior of a totally-enclosed-water-cooled squirrel-cage induction machine for traction applications. IEEE Trans. Ind. Electron. 2008, 55, 3555–3565. [Google Scholar] [CrossRef]
  27. Boglietti, A.; Cavagnino, A.; Staton, D.; Shanel, M.; Mueller, M.; Mejuto, C. Evolution and modern approaches for thermal analysis of electrical machines. IEEE Trans. Ind. Electron. 2009, 56, 871–882. [Google Scholar] [CrossRef] [Green Version]
  28. Gieras, J.F. Advancements in Electric Machines; Springer: Dordrecht, The Netherlands, 2008. [Google Scholar]
  29. Jürgens, G. Vergleich von Getriebesysteme. In Proceedings of the LuK-Kolloquium; Schaeffler Automotive Buehl GmbH & Co. KG: Bühl, Germany, 1994; p. 149. [Google Scholar]
  30. Verein Deutscher Ingenieure. VDI-Wärmeatlas; Springer: Berlin/Heidelberg, Germany, 2006. [Google Scholar]
  31. SKF GmbH. SKF Schmierfett-Auswahltafel. Available online: https://www.ludwigmeister.de/content/techn-informationen/chemische-produkte/schmiermittel/skf_waelzlager-schmierstoffe.pdf (accessed on 10 October 2019).
Figure 1. (a) Power dissipation diagram and (b) efficiency diagram of an electric machine [7].
Machines 08 00009 g001
Figure 2. Proportion of different loss types in the efficiency diagram of the machine.
Machines 08 00009 g002
Figure 3. Vehicle speed (a) and machine torque (b) for the NEmo.
Machines 08 00009 g003
Figure 4. Speed curve of the standard and worldwide harmonized light vehicles test cycle (WLTC) driving cycle adapted for the NEmo [20] (p.22).
Machines 08 00009 g004
Figure 5. Machine winding overhang temperature for the NEmo.
Machines 08 00009 g005
Figure 6. Machine winding overhang temperature for the NEmo.
Machines 08 00009 g006
Figure 7. Individual components of the induction machine (IM) in a radial section.
Machines 08 00009 g007
Figure 8. Overview of thermal network.
Machines 08 00009 g008
Figure 9. Simulative overload potential of the IM for the NEmo.
Machines 08 00009 g009
Figure 10. Impact of the ambient temperature on the thermal behavior.
Machines 08 00009 g010
Figure 11. Thermal modeling results of the IM for the NEmo at 1500 r/min and 103 N·m.
Machines 08 00009 g011
Figure 12. Thermal modeling results of the IM for the NEmo at 6000 r/min and 34 N·m.
Machines 08 00009 g012
Table 1. General vehicle parameters NEmo (Smart 451 fortwo basic).
ParameterVariableValueUnitSource
Vehicle mass (+ load)mveh825 (+80)kg[22]
Frontal areaAfront2.00m2[22]
Drag coefficientcW0.37-[22]
Rolling resistance coefficientfR0.013-[18]
Dynamic tire radiusrdyn0.2774m[22]
Static tire radiusrstat0.2870m[22]
Gear ratio machine – tireiEM-T5,697-[23]
Front wheel mass (rim + tires)mFR14.7kg[24]
Back wheel mass (rim + tires)mBR15.6kg[24]
Table 2. Overview of all measured test drives, NEmo 08/2018 to 02/2019.
ParameterValue
Number of measured test drives52
Total driving time952 min
Average driving time18 min
Shortest/longest trip1 min 24 s/125 min

