Abstract
In the recent years, distributed energy production has been one of the main research topics about renewable energies. The decentralization of electric production from wind resources raises the issues of reducing the size of generators, from the MW scale of industrial wind farm turbines to the kW scale, and possibly employing them in urban areas, where the wind flow is complex and extremely turbulent because of the presence of buildings and obstacles. On these grounds, the use of small-scale vertical axis small wind turbines (VASWT) is a valid choice for on-site generation (OSG), considering their low sensitivity with respect to turbulent flow and that there is no need to align the turbine with wind direction, as occurs with horizontal axis small wind turbines (HASWT). In addition, VASWTs have a minor acoustic impact with respect to HASWTs. The aim of this paper is to study the interactions that take place between a 1.2 kW, vertical axis, Darrieus VASWT turbine and a small, experimental building, in order to analyze the noise and the vibrations transmitted to the structure. One method to damp the vibrations is then assessed through spectral analysis of data acquired through accelerometers located both in the mast of the wind turbine and at the building walls. The results confirm the usefulness of dampers to increase the building comfort regarding vibrations.
1. Introduction
The recent trend in energy production is supporting large industrial intensive power plants and possibly locating small-scale energy systems close to the end users. As concerns wind energy, distributed production can be achieved using small wind turbines with 1.4–20 kW of rated power [1] with horizontal or vertical rotation axis.
Challenging problems related to distributed power production regard the necessity to place the turbines in an environment that is remarkably complex with respect to the optimal conditions of an open field, where, instead, large wind plants are typically sited. Placing small wind turbines close to final users, mostly in urban locations or in off-grid configuration [2,3], means that the airflow affecting the turbines is strongly turbulent [4,5,6,7], rapidly variable in speed and direction with the presence of boundary layer effect caused by building, obstacles and a lower rotor altitude. For these reasons, the choice of the appropriate wind turbine model for on-site generation (OSG) applications is a crucial step in order to produce energy efficiently.
Wind turbines can be divided in two main categories according to the rotational axis disposition: horizontal or vertical [8]. Although in large wind farms horizontal axis models are the most used because of higher efficiency [4] and consequently a better return on investment [4], for OSG purposes vertical axis small wind turbines (VASWT) can be preferred with respect to horizontal axis small wind turbines (HASWT) for the following main reasons [9]:
- there is no need to constantly align the turbine with wind direction;
- better behaviour with turbulent or disturbed flow;
- less noise emissions [10].
The absence of yaw controls [11] is advantageous for small size applications, because diminshing the use of actuators and controllers also means reducing the initial required investment.
Considering that interest in vertical axis wind turbines (VAWTs) is growing thanks to OSG applications, the objective of this study is to analyze how a turbine installed on a small building can interfere with human activities or well-being and how the comfort can be increased by mounting a decoupler on the turbine tower for dampening vibrations. This is accomplished through the analysis and the interpretation of the vibration spectra of a small VASWT installed on the rooftop of a small building.
It should be noticed that there are very few studies of this kind in the scientific literature. For example, in [12], dynamic analysis of Darrieus turbine bevel spur gear subjected to transient aerodynamic loads is carried out. In [13], further developments are achieved: the effect of the number of blades on aerodynamic performance and dynamic vibration of the Darrieus turbine geared transmission system is discussed at several tip speed ratios in non-stationary operation. The most important contribution of that study is to establish a correlation between the aerodynamic parts and the dynamic vibration of the gearing system by studying the effect of some design parameters on the dynamic vibration of the Darrieus turbine gearing system in non-stationary regime. Similar results are achieved in [14]. In [15], a test case rooftop VAWT similar to the one in the present work is considered: a health monitoring system is implemented and the dynamic behavior of the VAWT is studied using vibration measurements under ambient conditions. To process the vibration data, an automated algorithm based on stochastic subspace identification (SSI) and a fast clustering approach is developed and presented to show how modes could be determined: one of the main result of the study is that the modal behaviors can be differentiated into building-associated and non-building-associated modes. Consequently, a discussion is conducted about the effect of building-associated and non-building-associated modes on the VAWT tower responses and this could be useful for improving the design of the VAWT tower. The environmental effects on the ambient vibration data are addressed too and it arises that the blade rotation speed has a significant effect on the VAWT vibration power spectral density amplitudes. An interesting discussion about the technical requirements for successful condition monitoring of VAWTs is presented in [16].
The aim of this investigation in practice has therefore been the characterization of the dynamic behavior of the VAWT with the decoupler, measuring its ability to diminish vibrations. Vibrations have been measured at three particular points of the experimental setup: two monoaxial accelerometers have been placed in the turbine mast above the decoupler in two perpendicular directions, a triaxial accelerometer below the decoupler and the last monoaxial one has been installed at a wall inside the building. The measurement points have been selected in order to acquire the non-damped wind turbine vibrations and the vibrations mitigated by the decoupler. The main practical outcome of this work is that the decoupler results being capable to damp vibrations in a wide range of frequencies, decreasing the amplitude of the frequency content of about 90%, except on the range covering the orders between 60th and 100th, where the decreasing of the vibration amplitude is smaller (33%). Furthermore, from the order analysis and the discussion in Section 5, it has been possible to interpret the rotation-related phenomena mostly characterizing the system.
The manuscript is therefore organized as follows: in Section 2, an overview about the aerodynamics of vertical axis small wind turbines is presented. Section 3 is devoted to the description of the methods and facilities. The results are presented in Section 4 and discussed in Section 5. Conclusions are drawn and some further directions of the present work are indicated in Section 6.
2. Aerodynamics of Vertical Axis Small Wind Turbines
Vertical axis wind turbines can be divided in two main categories:
- Savonius;
- Darrieus.
Savonius turbines have the simplest design and are composed by two or more semi-cylindrical buckets that, thanks to the drag force, put in rotation the vertical shaft and, consequently, the electric generator (Figure 1a. The main advantages of this kind of model are [17]:
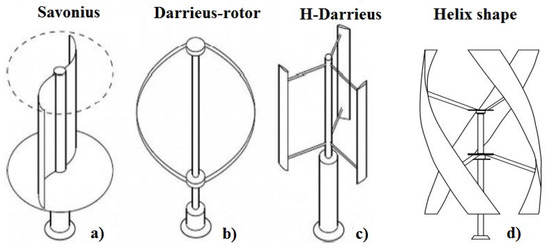
Figure 1.
Different kinds of vertical axis wind turbines (VAWT): (a) Savonius; (b) Darrieus with “egg beater” design rotor; (c) H-shape blades; (d) helix shape blades.
- constructive simplicity;
- cheap initial and maintenance costs;
- low vision impact for urban applications;
- startup with low wind speed independent of the wind direction;
- high torque.
In spite of this, the efficiency of Savonius turbines is typically lower than other conventional rotors [18]. For this reason, the diffusion of Savonius style generators is mostly limited in very small scale application or in developing countries.
The second type of VAWT, Darrieus wind turbines (Figure 1b–d), uses airfoil shape blades, usually three, that generate lift force to rotate the main shaft. The rotor of Darrieus turbines can assume different configurations [19,20], as “egg beater”, H-shape or helical shape.
In contrast to Savonius turbines, Darrieus have a better efficiency for high rotational speed, but lower starting torque. For this reason there are some hybrid Savonius–Darrieus turbines that try to join the positive aspects of both models [21] (Figure 2).
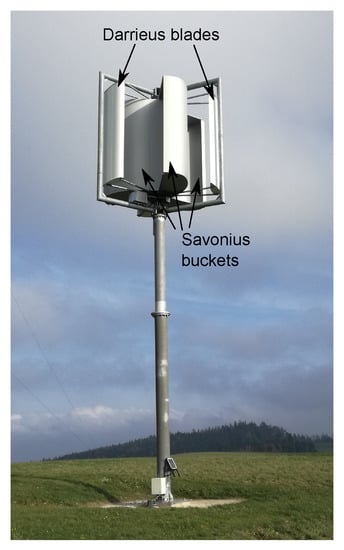
Figure 2.
Vertical wind turbine with hybrid rotor configuration Savonius–Darrieus.
In this paper a commercial Darrieus, three bladed, helical shape wind turbine was tested. In the following, the aerodynamic of this machine is addressed. An airfoil can be defined as a surface with particular shape that produces two perpendicular forces, called lift (L) and drag (D) when it is invested by a fluid flow. As depicted in Figure 3, the lift acts in perpendicular direction with respect to the relative flow velocity, whereas the drag is parallel to that vector. For a rotating machine, the resultant force R, composition of L and D, can be projected in the radial and tangential directions: in this way is possible to obtain the net forces generating torque [22]. The L and D forces are function of the angle of attack (AoA) and can be calculated following Equations (1) and (2):
where and are, respectively lift and drag non-dimensional coefficients, is the fluid density, V is the flow relative speed with respect to the airfoil and A is the foil section area.
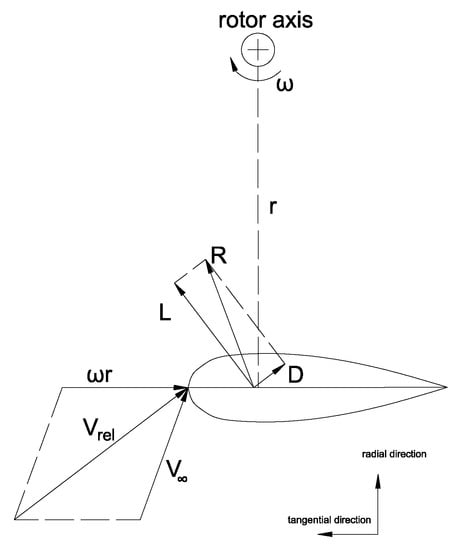
Figure 3.
Aerodynamic forces on the airfoil.
As and depend on the AoA, in literature (i.e., [23,24]) experimental tables, graphics or formulas are available for the extrapolation of these values.
A VAWT turbine equipped with three helical blades can be investigated starting with the following hypothesis:
- symmetric, non cambered airfoil;
- the airfoil mean line is perpendicular to the turbine radius;
- steady and uniform wind speed.
Characteristic of the particular twisted design of the blades is that the AoA is not constant among the blade height, as occurs for H-shape. For this reason, it is helpful to consider three sections of the blade: the top section (T), the centerline (C) and the bottom one (B) (Figure 4). Being the undisturbed wind speed and the blade tangential speed, where is the rotational speed and r the distance from center of rotation, the relative speed can be calculated in magnitude and orientation in all the three sections. In this way, it is possible to obtain the AoA in T, C and B and, consequently, calculate lift and drag forces and decompose them in radial and tangential directions in order to have an estimation of the torque on the shaft. This approach can be repeated for all the sections of a blade: in this way it is possible to define a total force acting on it and on the remaining blades of the turbine.
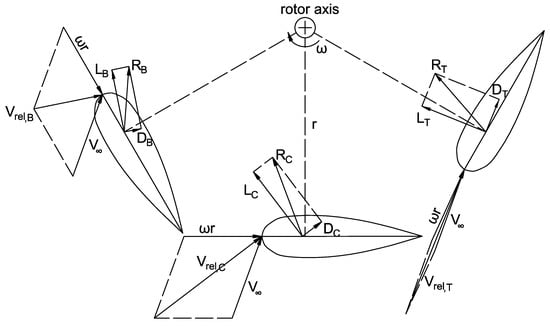
Figure 4.
Scheme of central (C), top (T) and bottom (B) sections of an helix blade. As the angle of attack (AoA) changes, lift (L) and drag (D) in different sections are modified.
3. Methods and Facilities
This paper was based on experimental measurements carried out in real environmental conditions that took place in Lichtenegg test field of FH Technikum Wien. This site is situated at 800 m a.s.l., with a long-term wind speed mean value of m/s on predominant directions of North–West and South, as shown in Figure 5.
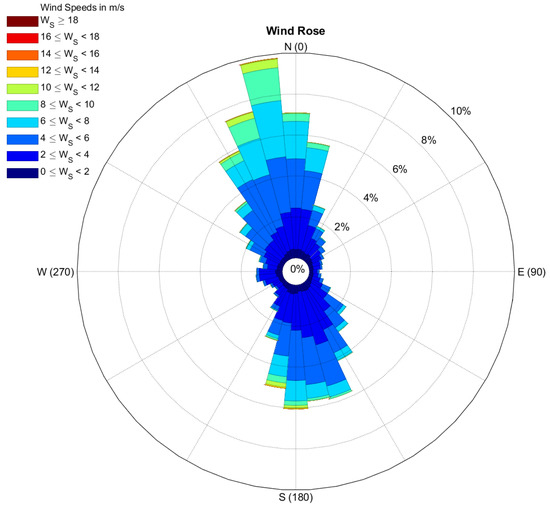
Figure 5.
Long-term wind rose of Lichtenegg test site.
The non-trivial wind characteristics (presence of turbulence and rapidly changing wind direction) make the Lichtenegg site an appropriate environment to test VASWTs. In addition, to better consider the interaction of the wind with buildings, the turbine has been installed on the rooftop of a small structure, 7 m, that affects the incoming wind profile [25]. The building was also necessary to investigate the effects of the presence of the turbine on the structure itself for what concerns vibrations and noises.
The experimental setup used in this study is composed by:
- Vertical axis wind turbine installed on a small building;
- Decoupler for damping the tower vibrations;
- Accelerometers: three uniaxial and one triaxial;
- Microphone;
- Ultrasonic Doppler anemometer( UDA);
- Amperometer and voltmeter;
- Data acquisition (DAQ) system.
3.1. Wind Turbine, Building and Decoupler System
The turbine used for this experiment was a commercial Darrieus rotor with three fiberglass helix blades. The rotor diameter was m, as its height, for a nominal power of kW. The airfoil was expressly designed to have a low cut-in speed equal to 3 m/s, operational range up to 16 m/s; for a wind speed between 14 m/s and 16 m/s, the maximum power of 1700 W can be achieved thanks to a permanent magnet synchronous generator.
This model of aerogenerator was located on the rooftop of a small building in order to simulate the mutual interaction between buildings and turbines in urban environment and assess the performance of the decoupler in damping vibrations. As shown in Figure 6, the turbine tower has been anchored to the timber truss of the roof. In this way, the particular placement of the accelerometers allows examining the damping effect of the combination of decoupler and truss.
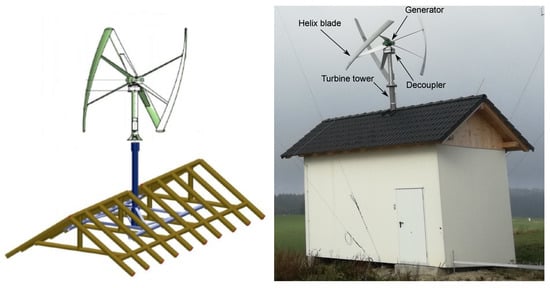
Figure 6.
Rooftop support structure and picture of the experimental system composed by turbine, decoupler and building.
The positive damping effect of wooden structures on vibration has been stated, for example, by Heiduschke et al. [26], who studied the behavior of timber tubular support for VASWT. The present paper, instead, proposes a more classical approach where the truss, that is normally present in civil buildings, is used with the dual purpose of holding the turbine and damping its vibrations in combination with the decoupler.
3.2. Vibration and Noise Measurement
To measure vibrations, three accelerometers have been used in different points, or layers, of the system. The first point was situated on the mast immediately below the turbine generator. At this point, two uniaxial accelerometers were installed in perpendicular directions. A triaxial accelerometer was placed in a second layer below the decoupler. This arrangement allowed a comparison of the accelerations before and after the decoupler, characterizing its effect on vibrations spectra. The last uniaxial accelerometer was located inside the building (third layer) and was used to measure the wall acceleration in a direction perpendicular to the vertical plane. Thanks to this last instrument, it was possible take into account the damping effect of the timber truss and have an outlook on the comfort inside the building. Monoaxial accelerometers have a g range, with a sensitivity of 66 . Triaxial accelerometer ranges from g and the sensitivity is 100 . Both models of accelerometers were sealed to prevent water and infiltrations and suited high thermal excursions. The noise measurement was carried out with a microphone, with 10,000 Hz of sample rate and range of Pa, installed in the edifice room. The support of the microphone was insulated with respect to the ground, in order to avoid that vibrations may affect the measurement. Figure 7 shows the installation layers of the instruments.
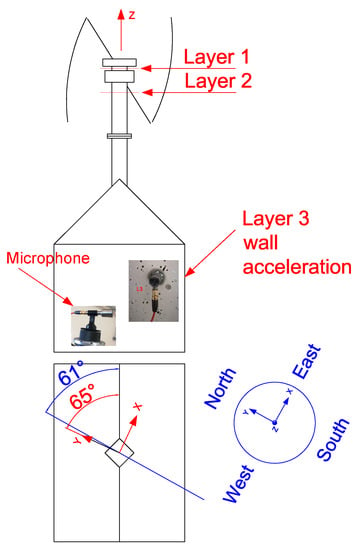
Figure 7.
Scheme of accelerometers and microphone arrangements (not to scale).
3.3. UDA, Instruments for Electrical Measurements and DAQ
To constantly survey the wind speed and direction, an ultrasonic Doppler anemometer was placed in the north side of the building. It integrated the wind magnitude and direction measurement in a single instrument. For power measurement, an effective/active three-phase power converter has been used in a single phase setup. All these sensors were connected to a data acquisition system. For accelerometers the band width is 1000 Hz, this value was chosen in order to remain under the instrument’s first resonance but, at the same time, being able to catch high frequency phenomena.
4. Results
With the arrangement described in the previous section, a measurement campaign took place in the test field for an overall period of about a month, between December and January. The average wind speed during the measurement campaign was of the order of 7 m/s. During this period, accelerations and noise have been recorded and then post processed in order to analyze the decoupler behavior. Wind speed and direction, as well as power measurements, are used to constantly survey the turbine performances and, during the post processing, to select the time lapses where the turbine has been full working, allowing to detect faulty events that have been not considered in the discussion.
One of the most used method to study rotating machines is order tracking (OT) analysis [27]. This mathematical instrument turns out to be particularly useful when a non-stationary vibrating phenomena has to be correlated with rotational speed varying in time, as for example the wind turbine rotor speed. An advantage of OT techniques is that a spectral analysis was not carried out with respect to an absolute frequency scale but relatively to passing frequency of the shaft: in this way is possible to clearly isolate all the phenomena that are proportional to the rotating speed. The reference rotational frequency, in the following paragraphs, will be labeled as “P” and its multiples as “2P”, “3P” and so on, to refer to be multiples of the rotor speed. Since the maximum rotational speed of the turbine was 320 rpm (5.33 Hz), the highest multiple, also called “order”(P), that could be studied esd the 187th. Frequency resolution of the fast Fourier tranform (FFT), the mathematical theory behind OT, is 0.10 Hz with a windowing of 10 s.
Accelerations of Layers 1 and 2
Accelerations above and below the decoupler are analyzed with 3D waterplots showing peaks in correspondence of higher values of accelerations. In this plots, in the x-axis the frequencies are represented, in the y-axis the rotational speeds of the shaft and in the z-axis the acceleration magnitude. For a given rotational speed, sectioning the plot with planes at const, is possible to visualize the frequency content of the vibration. In this plot, orders appears as straight lines lying in x–y plane described in Equation (3):
where for order 1P, for order 2P and so on.
Figure 8, Figure 9, Figure 10 and Figure 11 show the acceleration spectra up to 50 Hz in x and y directions for rotational speeds ranging from 25 to 300 rpm.
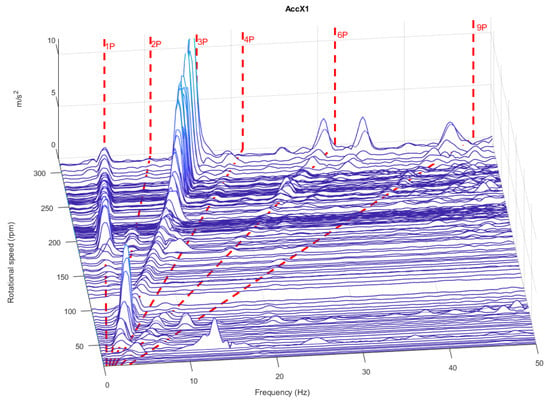
Figure 8.
Waterplot of accelerations in x direction on layer 1.
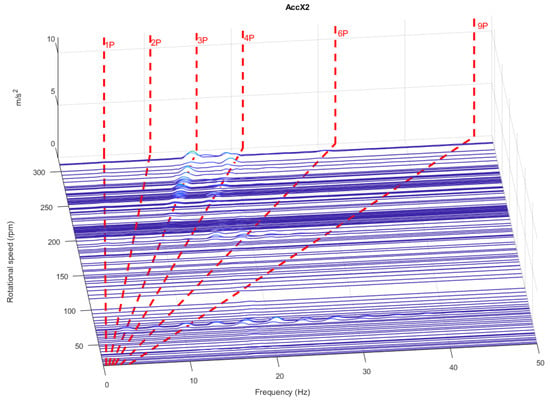
Figure 9.
Waterplot of accelerations in x direction on layer 2.
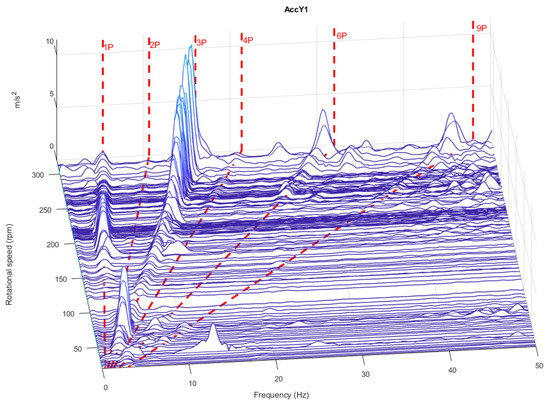
Figure 10.
Waterplot of accelerations in y direction on layer 1.
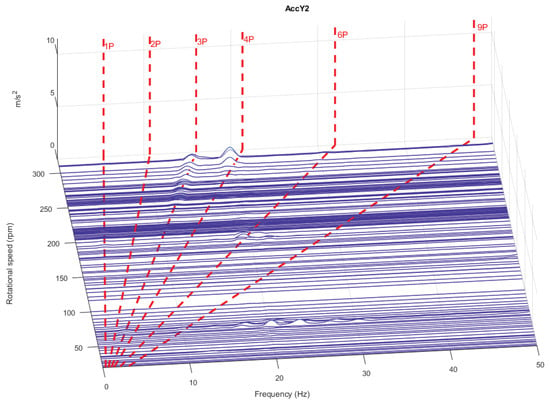
Figure 11.
Waterplot of accelerations in y direction on layer 2.
From the plots, it arises that the lower orders had the highest amplitude of acceleration in layer 1, in particular for 1P and 3P, and this happened both in x and y directions. In correspondence of rotational speed higher than 250 rpm, 6P and 9P tended to have a non-negligible magnitude.
As concerns the behaviour of the decoupler, it can be stated that it was able to damp efficiently vibrations on all the range of frequencies that were investigated. To have a better outlook on a wider frequency range, Figure 12 shows up to 200th order. This kind of plot is realized calculating the average of the acceleration in correspondence of each order value.
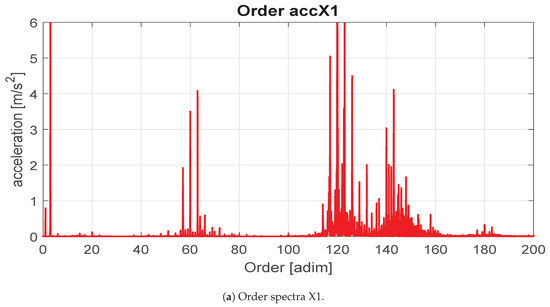
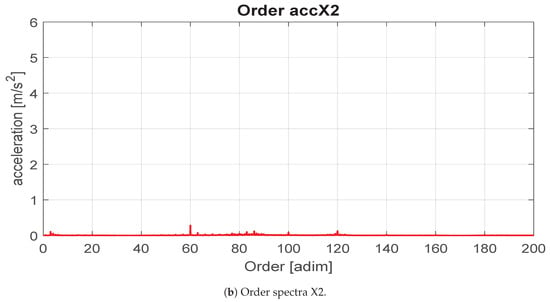
Figure 12.
Comparison between spectra of layer 1 and layer 2 in x direction.
From this it can be seen that the decoupler was particularly efficient to decrease vibrations of low orders. Generally all orders underwent an important reduction in magnitude and this attests the positive effect of the decoupler. The order 1P, that in layer 1 has a magnitude of , is completely damped the by decoupler and disappears in layer 2. Similarly as regards order 3P, which has a reduction of about . In spite of this, between 60th and 100th orders, the damping tended to be lower, as happens for the 80th order, where the amplitude decreased by , and for 100th order where vibrations were not diminished. Above the 120th order, the damping effect was once again prominent and the decreasing was attested between and .
Thanks to accelerometers placed in layers 1 and 2, it was possible to evaluate the behaviour of the deocupler, meanwhile with the wall accelerometer the vibration to the structure and the timber truss damping effect were taken in account. Figure 13 shows the order spectra of wall acceleration. From this, it can be seen that all the frequencies have a lower acceleration magnitude: by this point of view, it results that the timber truss had a positive effect on damping vibrations mostly in that frequency range where the decoupler was less effective.
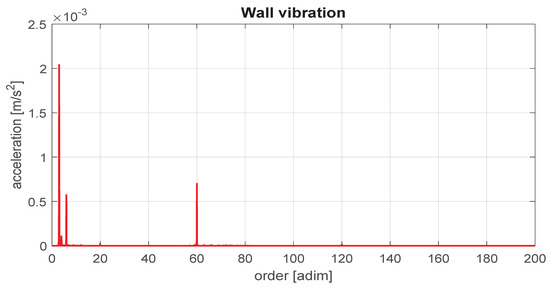
Figure 13.
Order spectra of wall acceleration.
5. Discussion
Once the vibration order spectra have been analyzed, in this section some explanations about the main causes of vibrations on the tested VASWT are proposed.
5.1. Order 1P
Vibrations with a predominant contribution at the 1P frequency, so that take place one time per revolution of the shaft, are mainly ascribed to rotor unbalanced masses caused by imperfection on turbine manufacturing or presence of dirt and ice on blades. Because of the imbalance, the center of mass of the rotor is not on the rotational axis but is shifted of a distance r from it. As stated in [28], the imbalance load is directly proportional to ( being the rotational speed of the rotor) and it can be described by a vector rotating at the same frequency of the shaft directed from the center of rotation to the center of mass. Presence of the imbalance is also confirmed by a deeper analysis of vibrations velocities on x and y axis in time domain, Figure 14. In this considered interval of 1.64 seconds, velocity fluctuations have a period (T) of about s and the two curves are delayed by . Considering that the x and y axes are perpendicular, the delay of the curves certifies the presence of an unbalanced mass that, during the rotation, causes peaks in x and y directions with a phase angle.
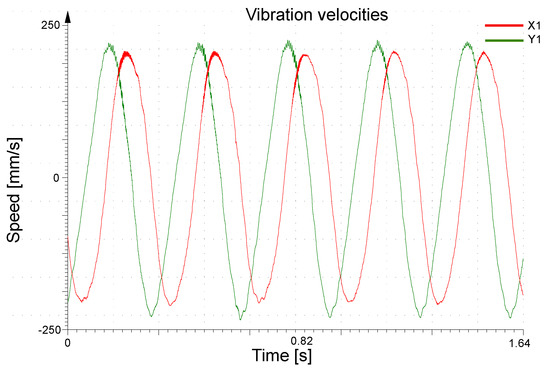
Figure 14.
Speeds on x (red) and y (green) axis. As the two curves are delayed by rads, the rotor is affected by imbalance.
5.2. Order 3P
A relevant contribution to vibrations in layer 1 is given by 3P order acceleration due to the variability of aerodynamic forces that act on blades during a revolution of the rotor. As previously shown in Figure 4, meanwhile rotating, each section of the blade undergoes different AoA depending on the wind direction. As a consequence, aerodynamic forces will vary from a maximum to a minimum value during one revolution. With a three bladed turbine, this phenomenon takes place with a cadence of three time per rotation of the shaft and so it goes to excite 3P order vibrations. With respect to HAWTs, in VAWTs the 3P order vibration are more important because of the design of the device: the wind turbine tends to block the air flow on the downwind blade, increasing the fluctuation of aerodynamic forces. By this point of view, helix blades are useful to smooth this effect, having a more regular transition between upwind and downwind areas.
5.3. Order 6P
During an investigation of accelerations and vibration speed on time series, in some cases, especially in correspondence of the excitation of resonance frequencies, prominent 6P order vibrations has been noted. For this reason, an overlook of that kind of vibration is addressed in order to understand how this phenomenon arises. As introduced in Section 1, each section of the blade has a different AoA, so that at a given instant the aerodynamic forces along the blade are not uniform. In Figure 15 it is shown how lift and drag forces are variable with respect to angular position of airfoil section. This variability is reflected on the cyclical moments that the blades impress to the mast. To confirm this hypothesis, an approximated calculation of blade loads is carried out with the purpose of supporting that a variable moment arises with a periodicity of 6P. Taking as reference a common operative condition of 7 m/s of wind speed and a rotational speed of 200 rpm, aerodynamic forces have been calculated, with an table, in function of the rotation angle. After this, each blade has been discretized in several sections: Figure 16 and Figure 17 show how the forces in x and y directions vary with respect to rotational angle and discrete section height. Subsequently, the torque generated from each blade is computed and, composing, the effect of all the three blades to stress on the mast is accounted. This numerical approach, even if accomplished with an appropriate aerodynamic analysis, includes some approximations as, for example, the absence of wakes and turbulence that in the real case are not negligible. Stall events are computed through an abrupt decreasing of coefficient: this can be considered an approximation too, as more detailed fluid dynamic effects are neglected. However, it has to be taken into account that in this particular operational conditions, where 6P vibrations are more relevant, the maximum computed AoA is about 16.5, but more complex stall phenomena appears only at 20, as stated by Wauters and Degroote [29]. Considering that an accurate simulation of stall is a challenging task for specialized algorithm (RANS, LENS) and should be addressed in combination with PIV measurements [30], this aspect goes beyond the main purpose of this numerical simulation that is to assess the possibility that 6P vibrations can be generated by the aerodynamic forces.
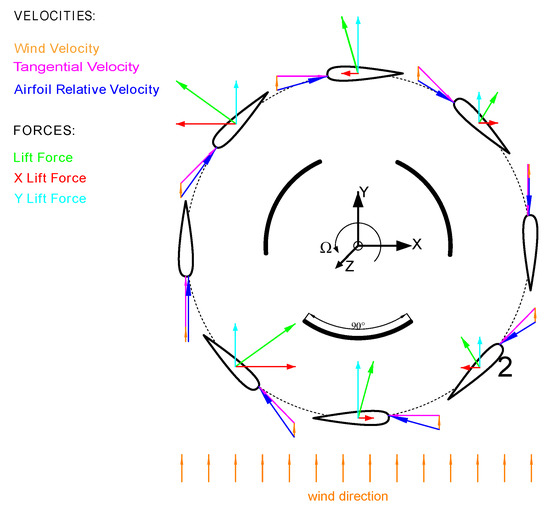
Figure 15.
Forces component variability with respect angular position.
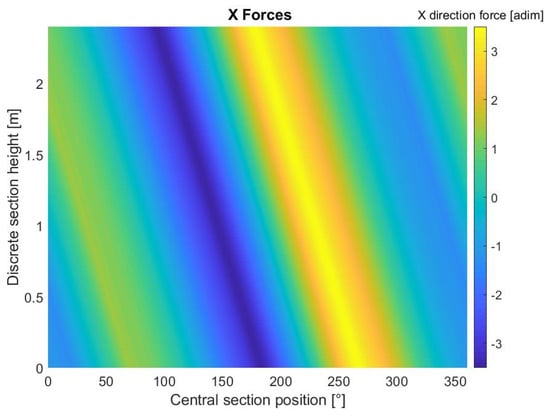
Figure 16.
Distribution of x forces on discrete sections of the blade. Values are dimensionless.
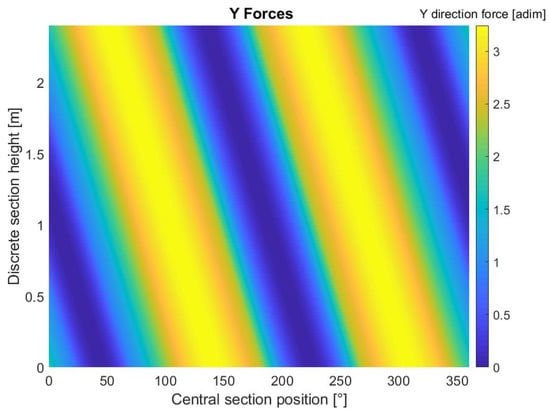
Figure 17.
Distribution of y forces on discrete sections of blade. Values are dimensionless.
As can be seen in Figure 18, the contribution of the moments on x and on y directions, that have a slight different phase, produces a vibration that has six peaks on every shaft revolution, confirming that aerodynamic forces are the main responsible of 6P vibrations. Further simulations, performed with H-shape design turbine, show the absence of moment induced vibrations. This latter test is useful to underline that the typical shape of helical blades is the main cause of 6P vibrations.
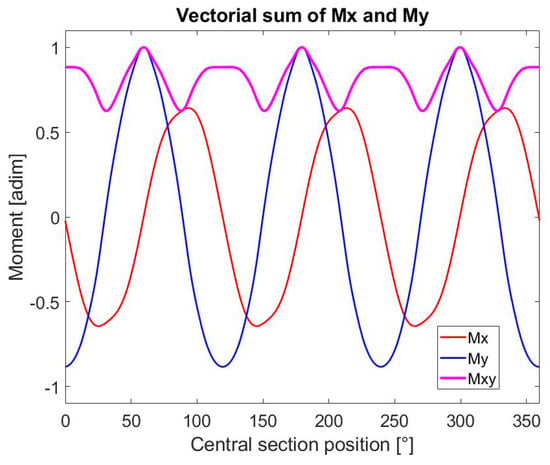
Figure 18.
Estimation of moments in x (red line) and y (blue line) direction and their vector composition (magenta). The resultant shows six peaks on each cycle. Magnitude is dimensionless.
5.4. Orders 60th and 120th
High order vibrations can be related to the wind turbine electrical apparatus. In particular the synchronous generator is composed by a three poles permanent magnet rotor and a ten couples winding stator. In this configuration, each time a pole is aligned with a stator winding, a current peak is generated that is reflected on variable torque applied to the shaft and, consequently, an imposed vibration to the turbine structure. During a revolution of the shaft, each pole causes a total of twenty peaks of current and, as the rotor is comprehensive of 3 poles, 60P vibrations are induced. This line of reasoning is similar to the one proposed in [31] for interpreting the experimental vibration spectra of a small HAWT device.
120P vibrations can be attributable to four diodes Graetz bridge electrical rectifier, whose task is to reverse the negative component of the current produced. This element uses a condenser too, that cyclically gets charged and discharged, to smooth the current peaks. This phenomenon takes place with a frequency that is two times with respect to the current and so it goes to excite the 120th order.
5.5. Decoupler Overload
Knocking is an undesired effect caused by an excessive deflection of the decoupler, induced by heavy loads. A hole and pin system is arranged inside the decoupler in order to avoid that dangerous displacements may cause the failure of the device. In spite of this, when pin and hole come in contact there is a prominent vibration, also called beat or knock, that can negatively affect the comfort inside the building, generating a non negligible noise too. As can be seen in Figure 19, remarkable vibrations are recorded in occurrence of the highest displacements of the decoupler. The knocking phenomenon is visible both in x and y directions at the same instants: this means that the contact point of the pin and hole is not aligned with either of the two axis, probably with an approximate angle of 45 respect to the x direction.
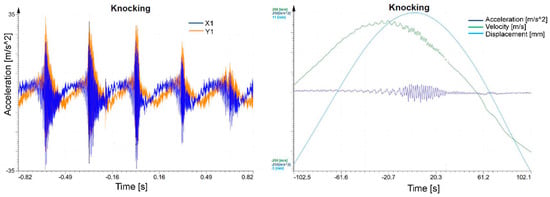
Figure 19.
Knocking phenomena in decoupler. On the left, accelerations in X1 (blue) and in Y1 (orange) are shown; beats appears at the same time. On the right, maximum vibration magnitude (blue line) is reached in correspondence of highest displacement (light blue), in green X1 velocity.
6. Conclusions
The objective of this paper has been the analysis and the interpretation of the vibration spectra of a small VAWT: the test case has been installed on the rooftop of a small building and, using accelerometers placed on the mast and inside the building, the transmission of vibrations to the structure has been recorded with a data acquisition system. The turbine tower has been equipped with a particular element, called decoupler, in order to damp vibrations that turbine transmits to the structure. This kind of studies are useful in the context of the exploitation of small-scale wind turbines in urban environment, where the flow conditions are particularly complex due to the interplay with the buildings.
The aim of this investigation in practice has been the characterization of the behavior of the decoupler, measuring its ability to diminish vibrations and so improving human comfort inside buildings that host small wind turbines installation. Also the contribution of the house timber truss, that is used to hold the turbine and that can play a positive role on damping vibrations, has been considered in this study. The analysis conducted in this paper can be useful to develop a general method that may be applied to numerous different situations every time the interaction between a small wind turbine, either vertical or horizontal, and an edifice has to be studied. It is particularly interesting to use this proposed method with many wind turbine models, in combination with different type of decouplers or truss design with the purpose to make a comparison of the multiple arrangements: this is actually the main further direction of the present study.
Vibrations have been surveyed at three particular points of the experimental setup: two monoaxial accelerometers have been placed at the turbine mast above the decoupler in two perpendicular directions, a triaxial accelerometer below the decoupler and the last monoaxial one has been installed in a wall inside the building. These points have been suitably selected in order to acquire, at first, the non-damped vibrations coming from the turbine and then the mitigated vibrations after the decoupler and the timber truss.
From the order analysis, it has been possible to have an outlook about the rotation-related phenomena mostly stressing the system. From the measurements on the second layer, it has been observed that the decoupler is able to damp vibrations in a wide range of frequencies, decreasing the amplitude of all the orders of about 90%, except on the frequency range covering the orders between 60th and 100th, where the decreasing of the vibration amplitude is smaller (33%). In addition, it has been noticed how the timber truss can be conveniently combined with the decoupler to positively contribute to damp vibrations. A sideffect of the decoupler occurs when excessive loads bring the pin and hole system to get in contact. In this eventuality, strong vibrations are recorded with a consequent worsening of comfort inside the building. Since the decoupler is able to efficiently damp vibrations that are parallel to x or y axis, an upgrade that can be implemented is to allow torsional and bending motion in order to increase the damping effect in more directions. Future studies on the decoupler should be focused on finding a trade off between stiffness and pin and hole dimensions with the purpose of reducing the knocking events.
Author Contributions
Conceptualization, F.C., D.A., M.P. and F.N.; Methodology, F.C., D.A., M.P. and F.N.; Software, F.C., F.N. and D.B.; Validation, F.C., D.A., M.P. and F.N.; Formal Analysis, F.C. and F.N.; Investigation, F.C., D.A., M.P., F.N. and A.H.; Resources, F.C., M.P. and A.H.; Data Curation, F.C., M.P., F.N. and D.B.; Writing-Original Draft Preparation, F.N.; Writing-Review & Editing, D.A.; Visualization, F.C., D.A. and F.N.; Supervision, F.C.; Project Administration, F.C. and M.P.; Funding Acquisition, M.P. and A.H.
Funding
This research was partly funded by the Austrian Federal Ministry of Transportation, Innovation and Technology, Bundesministerium für Verkehr, Innovation und Technologie, Radetzkystraße 2, A-1030 Wien.
Conflicts of Interest
The authors declare no conflict of interest.
Abbreviations
The following abbreviations are used in this manuscript:
| a.s.l. | above sea level |
| AoA | angle of attack |
| DAQ | data acquisition system |
| FFT | fast Fourier transform |
| HAWT | horizontal axis wind turbine |
| HAWST | horizontal axis small wind turbine |
| LES | large eddy simulation |
| OSG | on-site generation |
| OT | order tracking |
| PIV | particle image velocimetry |
| RANS | Reynold averaged Navier–Stokes |
| UDA | ultrasonic Doppler anemometry |
| VAWT | vertical axis wind turbine |
| VASWT | vertical axis small wind turbine |
References
- Tummala, A.; Velamati, R.K.; Sinha, D.K.; Indraja, V.; Krishna, V.H. A review on small scale wind turbines. Renew. Sustain. Energy Rev. 2016, 56, 1351–1371. [Google Scholar] [CrossRef]
- Li, Q.; Maeda, T.; Kamada, Y.; Ogasawara, T.; Nakai, A.; Kasuya, T. Investigation of power performance and wake on a straight-bladed vertical axis wind turbine with field experiments. Energy 2017, 141, 1113–1123. [Google Scholar] [CrossRef]
- Pagnini, L.; Piccardo, G.; Repetto, M.P. Full scale behavior of a small size vertical axis wind turbine. Renew. Energy 2018, 127, 41–55. [Google Scholar] [CrossRef]
- Pagnini, L.C.; Burlando, M.; Repetto, M.P. Experimental power curve of small-size wind turbines in turbulent urban environment. Appl. Energy 2015, 154, 112–121. [Google Scholar] [CrossRef]
- Ishugah, T.; Li, Y.; Wang, R.; Kiplagat, J. Advances in wind energy resource exploitation in urban environment: A review. Renew. Sustain. Energy Rev. 2014, 37, 613–626. [Google Scholar] [CrossRef]
- Sunderland, K.; Woolmington, T.; Blackledge, J.; Conlon, M. Small wind turbines in turbulent (urban) environments: A consideration of normal and Weibull distributions for power prediction. J. Wind Eng. Ind. Aerodyn. 2013, 121, 70–81. [Google Scholar] [CrossRef]
- Battisti, L.; Ricci, M. Wind Energy Exploitation in Urban Environment: TUrbWind 2017 Colloquium; Springer: Cham, Switzwerland, 2018. [Google Scholar]
- Zhang, L.; Zhu, K.; Zhong, J.; Zhang, L.; Jiang, T.; Li, S.; Zhang, Z. Numerical Investigations of the Effects of the Rotating Shaft and Optimization of Urban Vertical Axis Wind Turbines. Energies 2018, 11, 1870. [Google Scholar] [CrossRef]
- Pope, K.; Dincer, I.; Naterer, G. Energy and exergy efficiency comparison of horizontal and vertical axis wind turbines. Renew. Energy 2010, 35, 2102–2113. [Google Scholar] [CrossRef]
- Eriksson, S.; Bernhoff, H.; Leijon, M. Evaluation of different turbine concepts for wind power. Renew. Sustain. Energy Rev. 2008, 12, 1419–1434. [Google Scholar] [CrossRef]
- Castellani, F.; Astolfi, D.; Natili, F.; Mari, F. The Yawing Behavior of Horizontal-Axis Wind Turbines: A Numerical and Experimental Analysis. Machines 2019, 7, 15. [Google Scholar] [CrossRef]
- Mabrouk, I.B.; El Hami, A.; Walha, L.; Zghal, B.; Haddar, M. Dynamic vibrations in wind energy systems: Application to vertical axis wind turbine. Mech. Syst. Sig. Proc. 2017, 85, 396–414. [Google Scholar] [CrossRef]
- Mabrouk, I.B.; El Hami, A. Effect of number of blades on the dynamic behavior of a Darrieus turbine geared transmission system. Mech. Syst. Sig. Proc. 2019, 121, 562–578. [Google Scholar] [CrossRef]
- Mabrouk, I.B.; El Hami, A. Dynamic response analysis of Darrieus wind turbine geared transmission system with unsteady wind inflow. Renew. Energy 2019, 131, 482–493. [Google Scholar] [CrossRef]
- Wang, Y.; Lu, W.; Dai, K.; Yuan, M.; Chen, S.E. Dynamic Study of a Rooftop Vertical Axis Wind Turbine Tower Based on an Automated Vibration Data Processing Algorithm. Energies 2018, 11, 3135. [Google Scholar] [CrossRef]
- Kotulski, L.; Jablonski, A.; Staszewski, W.; Jabłoński, A.; Dziedziech, K.; Czop, P. Comparison of requirements for vibration-based condition monitoring of a vertical-axis vs. horizontal-axis wind turbine. Diagnostyka 2018, 19, 95–100. [Google Scholar] [CrossRef]
- Tian, W.; Song, B.; VanZwieten, J.H.; Pyakurel, P. Computational Fluid Dynamics Prediction of a Modified Savonius Wind Turbine with Novel Blade Shapes. Energies 2015, 8, 7915–7929. [Google Scholar] [CrossRef]
- Altan, B.D.; Atılgan, M. An experimental and numerical study on the improvement of the performance of Savonius wind rotor. Energy Convers. Manag. 2008, 49, 3425–3432. [Google Scholar] [CrossRef]
- Battisti, L.; Brighenti, A.; Benini, E.; Castelli, M.R. Analysis of different blade architectures on small VAWT performance. In Journal of Physics: Conference Series; IOP Publishing: Bristol, UK, 2016; Volume 753, p. 062009. [Google Scholar]
- Battisti, L.; Persico, G.; Dossena, V.; Paradiso, B.; Castelli, M.R.; Brighenti, A.; Benini, E. Experimental benchmark data for H-shaped and troposkien VAWT architectures. Renew. Energy 2018, 125, 425–444. [Google Scholar] [CrossRef]
- Gupta, R.; Biswas, A.; Sharma, K. Comparative study of a three-bucket Savonius rotor with a combined three-bucket Savonius–three-bladed Darrieus rotor. Renew. Energy 2008, 33, 1974–1981. [Google Scholar] [CrossRef]
- Dixon, S.L. Fluid Mechanics and Thermodynamics of Turbomachinery, 7th ed.; Butterworth-Heinemann: Oxford, UK, 2014; ISBN 0-7506-7059-2. [Google Scholar]
- Timmer, W.; Bak, C. 4-Aerodynamic characteristics of wind turbine blade airfoils. In Advances in Wind Turbine Blade Design and Materials; Brøndsted, P., Nijssen, R.P., Eds.; Woodhead Publishing Series in Energy; Woodhead Publishing: Sawston, UK, 2013; pp. 109–149. [Google Scholar]
- Imiela, M.; Faßmann, B.; Heilers, G.; Wilke, G. Numerical airfoil catalogue including 360° airfoil polars and aeroacoustic footprints. Wind Energy Sci. Discuss. 2017, 2017, 1–34. [Google Scholar] [CrossRef]
- KC, A.; Whale, J.; Urmee, T. Urban wind conditions and small wind turbines in the built environment: A review. Renew. Energy 2019, 131, 268–283. [Google Scholar] [CrossRef]
- Heiduschke, A.; Kubowitz, P.; Hamann, M.; Thompson, R.; Haller, P. Tubular timber poles for small wind turbines. In Proceedings of the 11th World Conference on Timber Engineering 2010 (WCTE 2010), Trentino, Italy, 20–24 June 2010; Volume 3, pp. 1821–1825. [Google Scholar]
- Wang, K.; Heyns, P. The combined use of order tracking techniques for enhanced Fourier analysis of order components. Mech. Syst. Sig. Proc. 2011, 25, 803–811. [Google Scholar] [CrossRef]
- Ramlau, R.; Niebsch, J. Imbalance Estimation Without Test Masses for Wind Turbines. J. Sol. Energy Eng. 2009, 131, 011010. [Google Scholar] [CrossRef]
- Wauters, J.; Degroote, J. On the study of transitional low-Reynolds number flows over airfoils operating at high angles of attack and their prediction using transitional turbulence models. Prog. Aerosp. Sci. 2018, 103, 52–68. [Google Scholar] [CrossRef]
- Yang, Y.; Guo, Z.; Zhang, Y.; Jinyama, H.; Li, Q. Numerical investigation of the tip vortex of a straight-bladed vertical axis wind turbine with double-blades. Energies 2017, 10, 1721. [Google Scholar] [CrossRef]
- Castellani, F.; Astolfi, D.; Becchetti, M.; Berno, F.; Cianetti, F.; Cetrini, A. Experimental and numerical vibrational analysis of a horizontal-axis micro-wind turbine. Energies 2018, 11, 456. [Google Scholar] [CrossRef]
© 2019 by the authors. Licensee MDPI, Basel, Switzerland. This article is an open access article distributed under the terms and conditions of the Creative Commons Attribution (CC BY) license (http://creativecommons.org/licenses/by/4.0/).