Impacts of Responsive Loads and Energy Storage System on Frequency Response of a Multi-Machine Power System

 ,
,  , ,
, , 
Abstract
:1. Introduction
- In contrast to previously mentioned literature which either discuss DR [6,7,8,9,10,11] or ESS [16,17,18,19,20], this work considers their combined operation in a smart grid environment. Moreover, prevalent multi-machine power system is considered for mathematical modelling and simulation results instead of a single-machine power system [21,22,23,24,25].
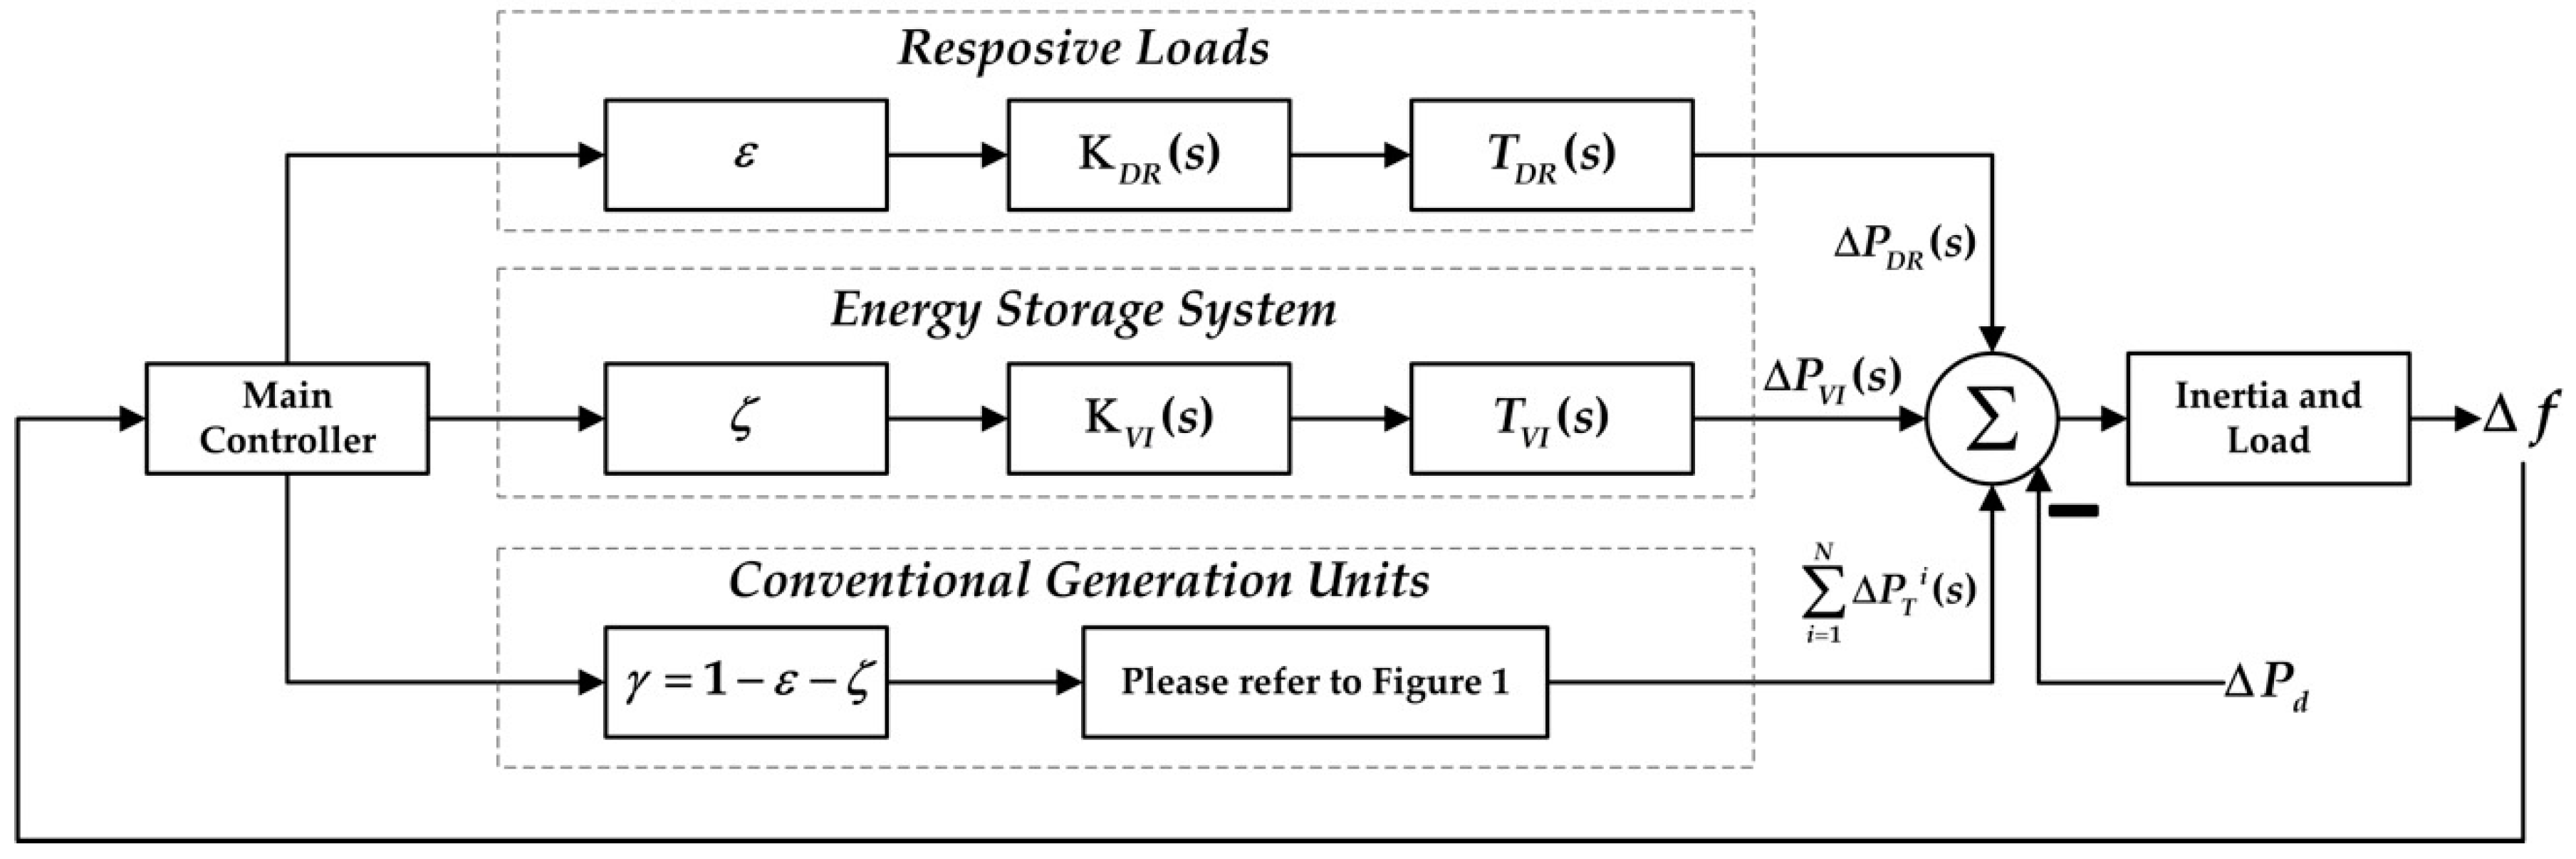
- A mathematical model is developed to include the role of responsive loads and ESS in multi-machine electric power system. For their integration, independent control loops for the DR and the VI powers are introduced, which provide a means of extra degrees of freedom for frequency regulation. Moreover, this approach provides a simpler structure to design the controllers.
- The developed model is verified with the help of simulation results carried out under a comprehensive set of case studies. The case studies range from consideration of an individual machine to combined role of responsive loads and ESS in a multi-machine system. The results show that the responsive loads and ESS can play a vital role in frequency regulation in case of partial or temporary unavailability of generation resources.
2. Development of the Model
| : | time constant of governor (sec) | |
| : | Percentage of power generated in the reheat portion | |
| : | turbine time constant (sec) | |
| : | turbine time constant of reheated turbine (sec) | |
| : | turbine time constant of hydro turbine (sec) |
2.1. Responsive Loads
- Dispatchable programs: where the system operator can manipulate the responsive loads according to power grid’s needs. For example, direct load control is a type of such programs and also considered in this work.
- Non-dispatchable programs: the programs in which the customer is financially encouraged to manipulate the loads but the system operator does not have direct control over the responsive loads. Its examples of are real-time pricing and peak time rebate [27].
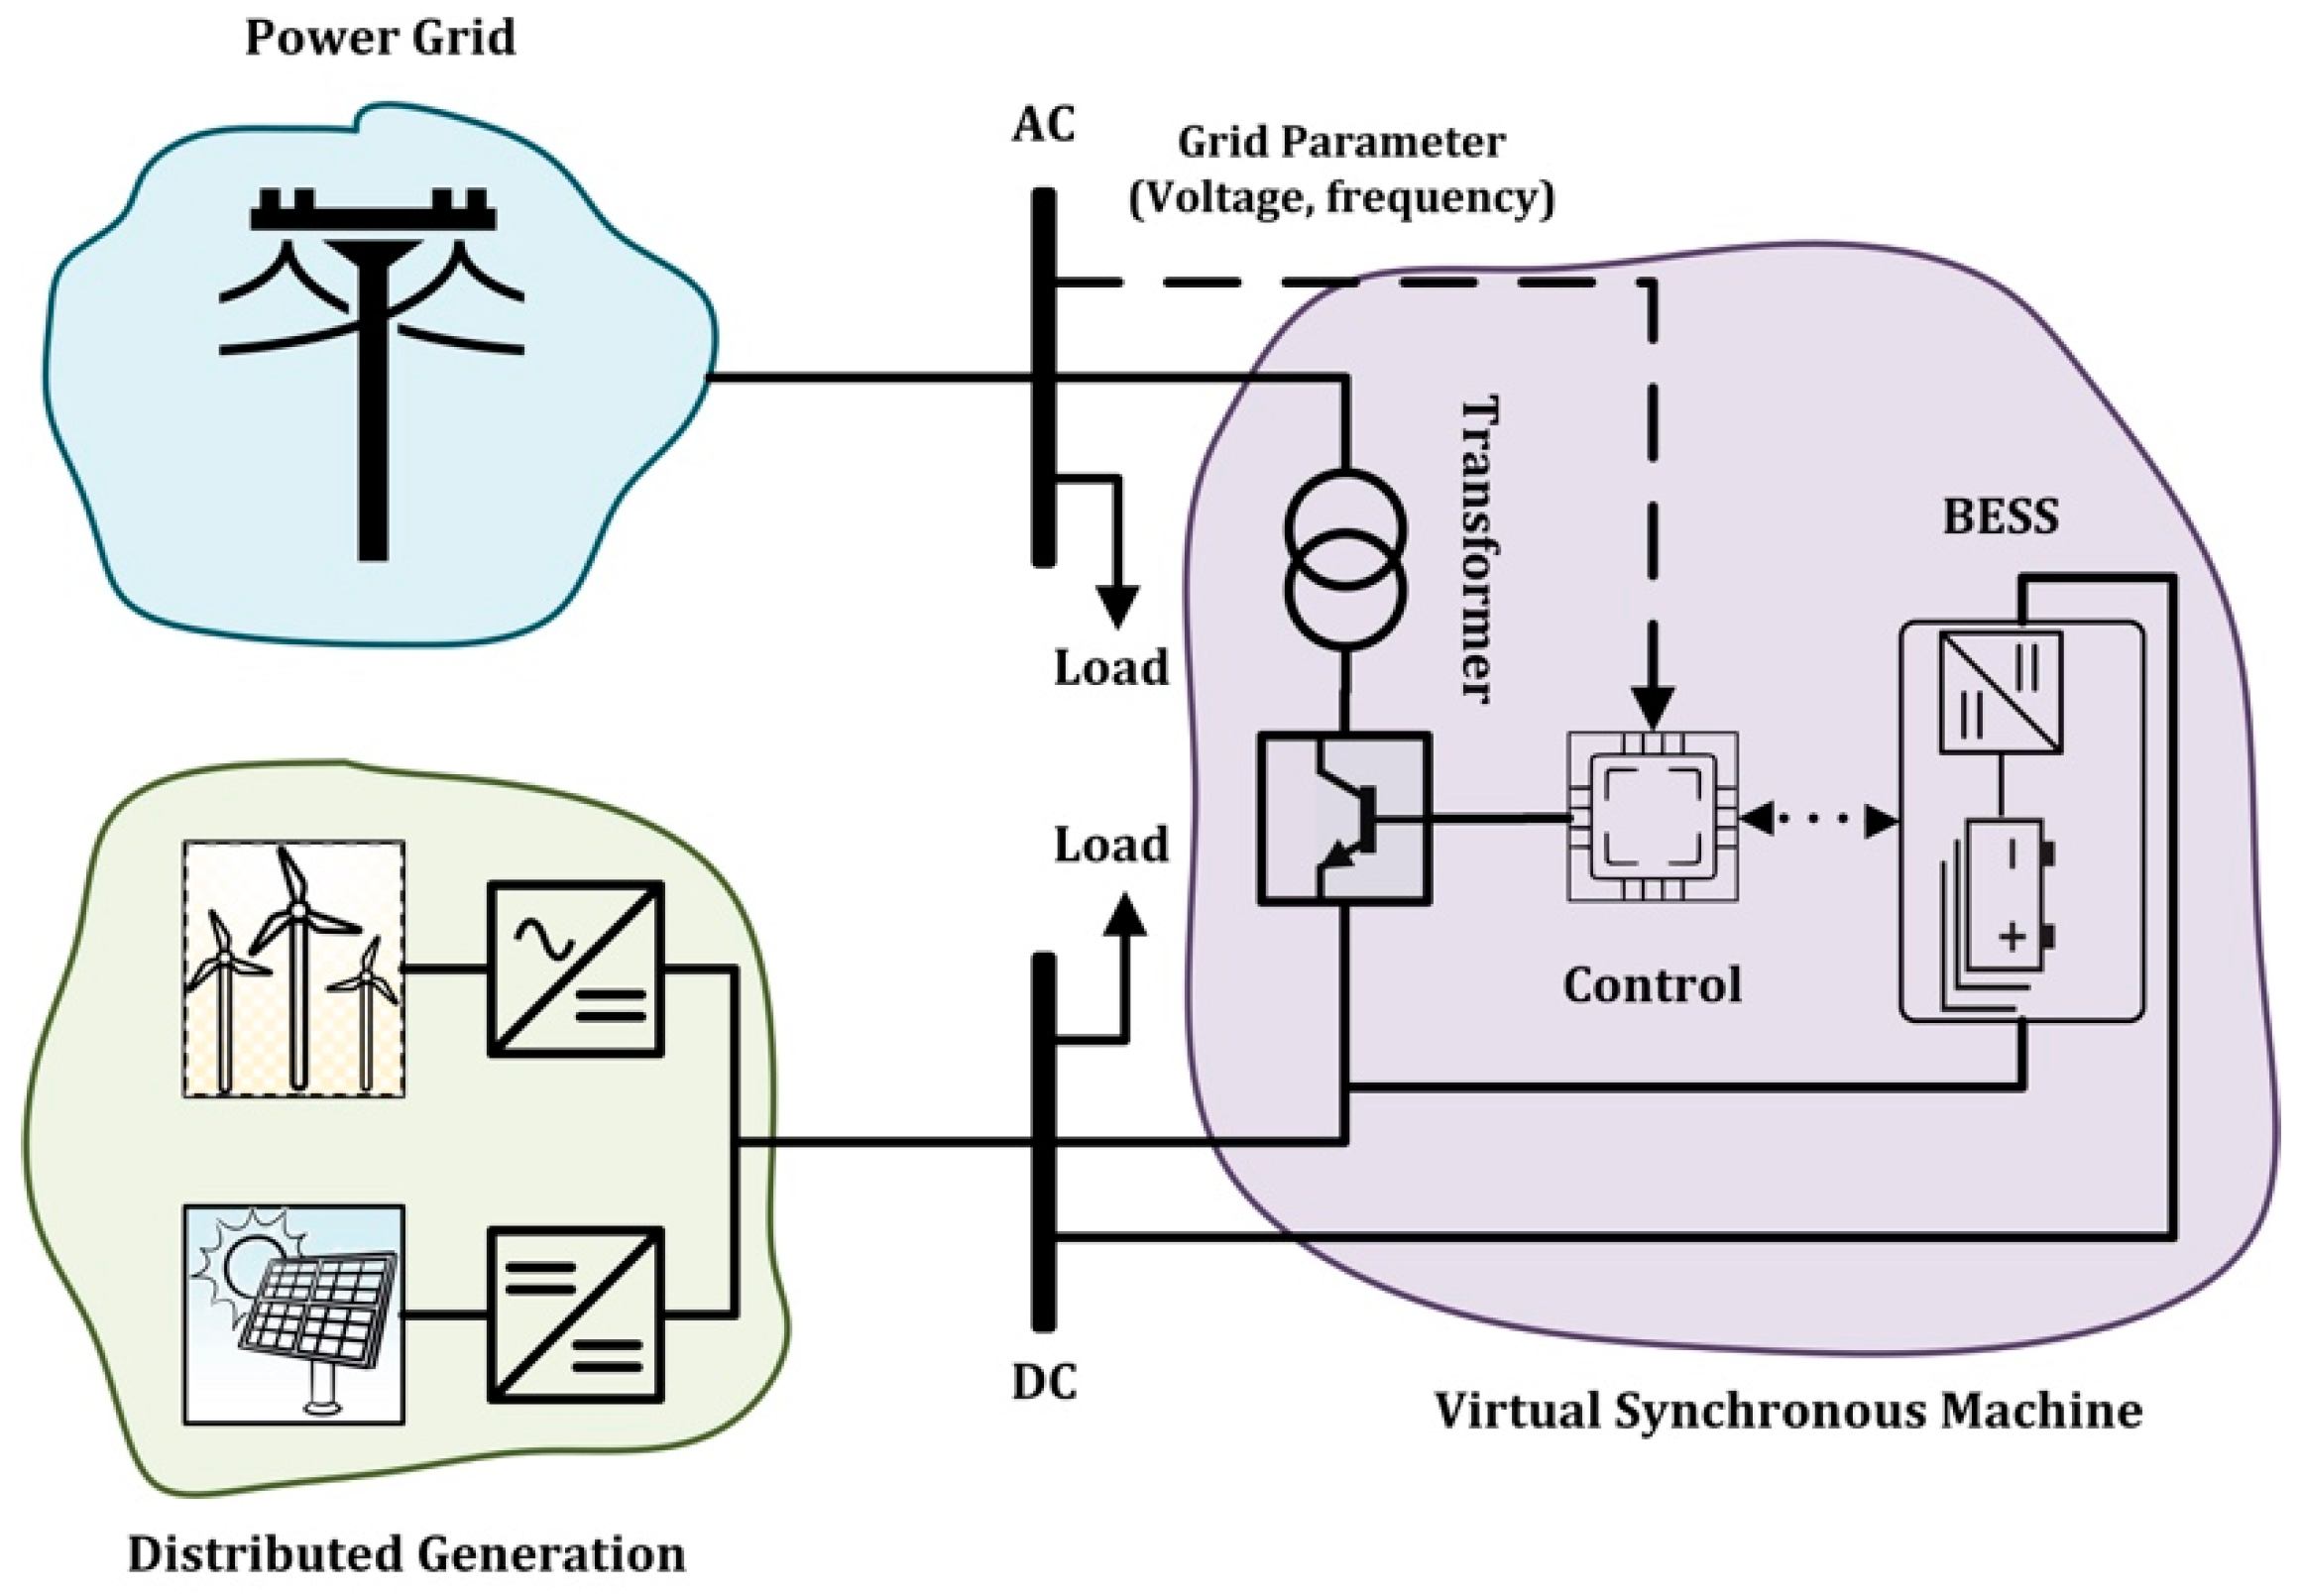
2.2. Energy Storage System
- Virtual generator mode: in this case, BESS provides power to the grid
- Virtual load mode: in this case, excess power from the grid is stored to BESS
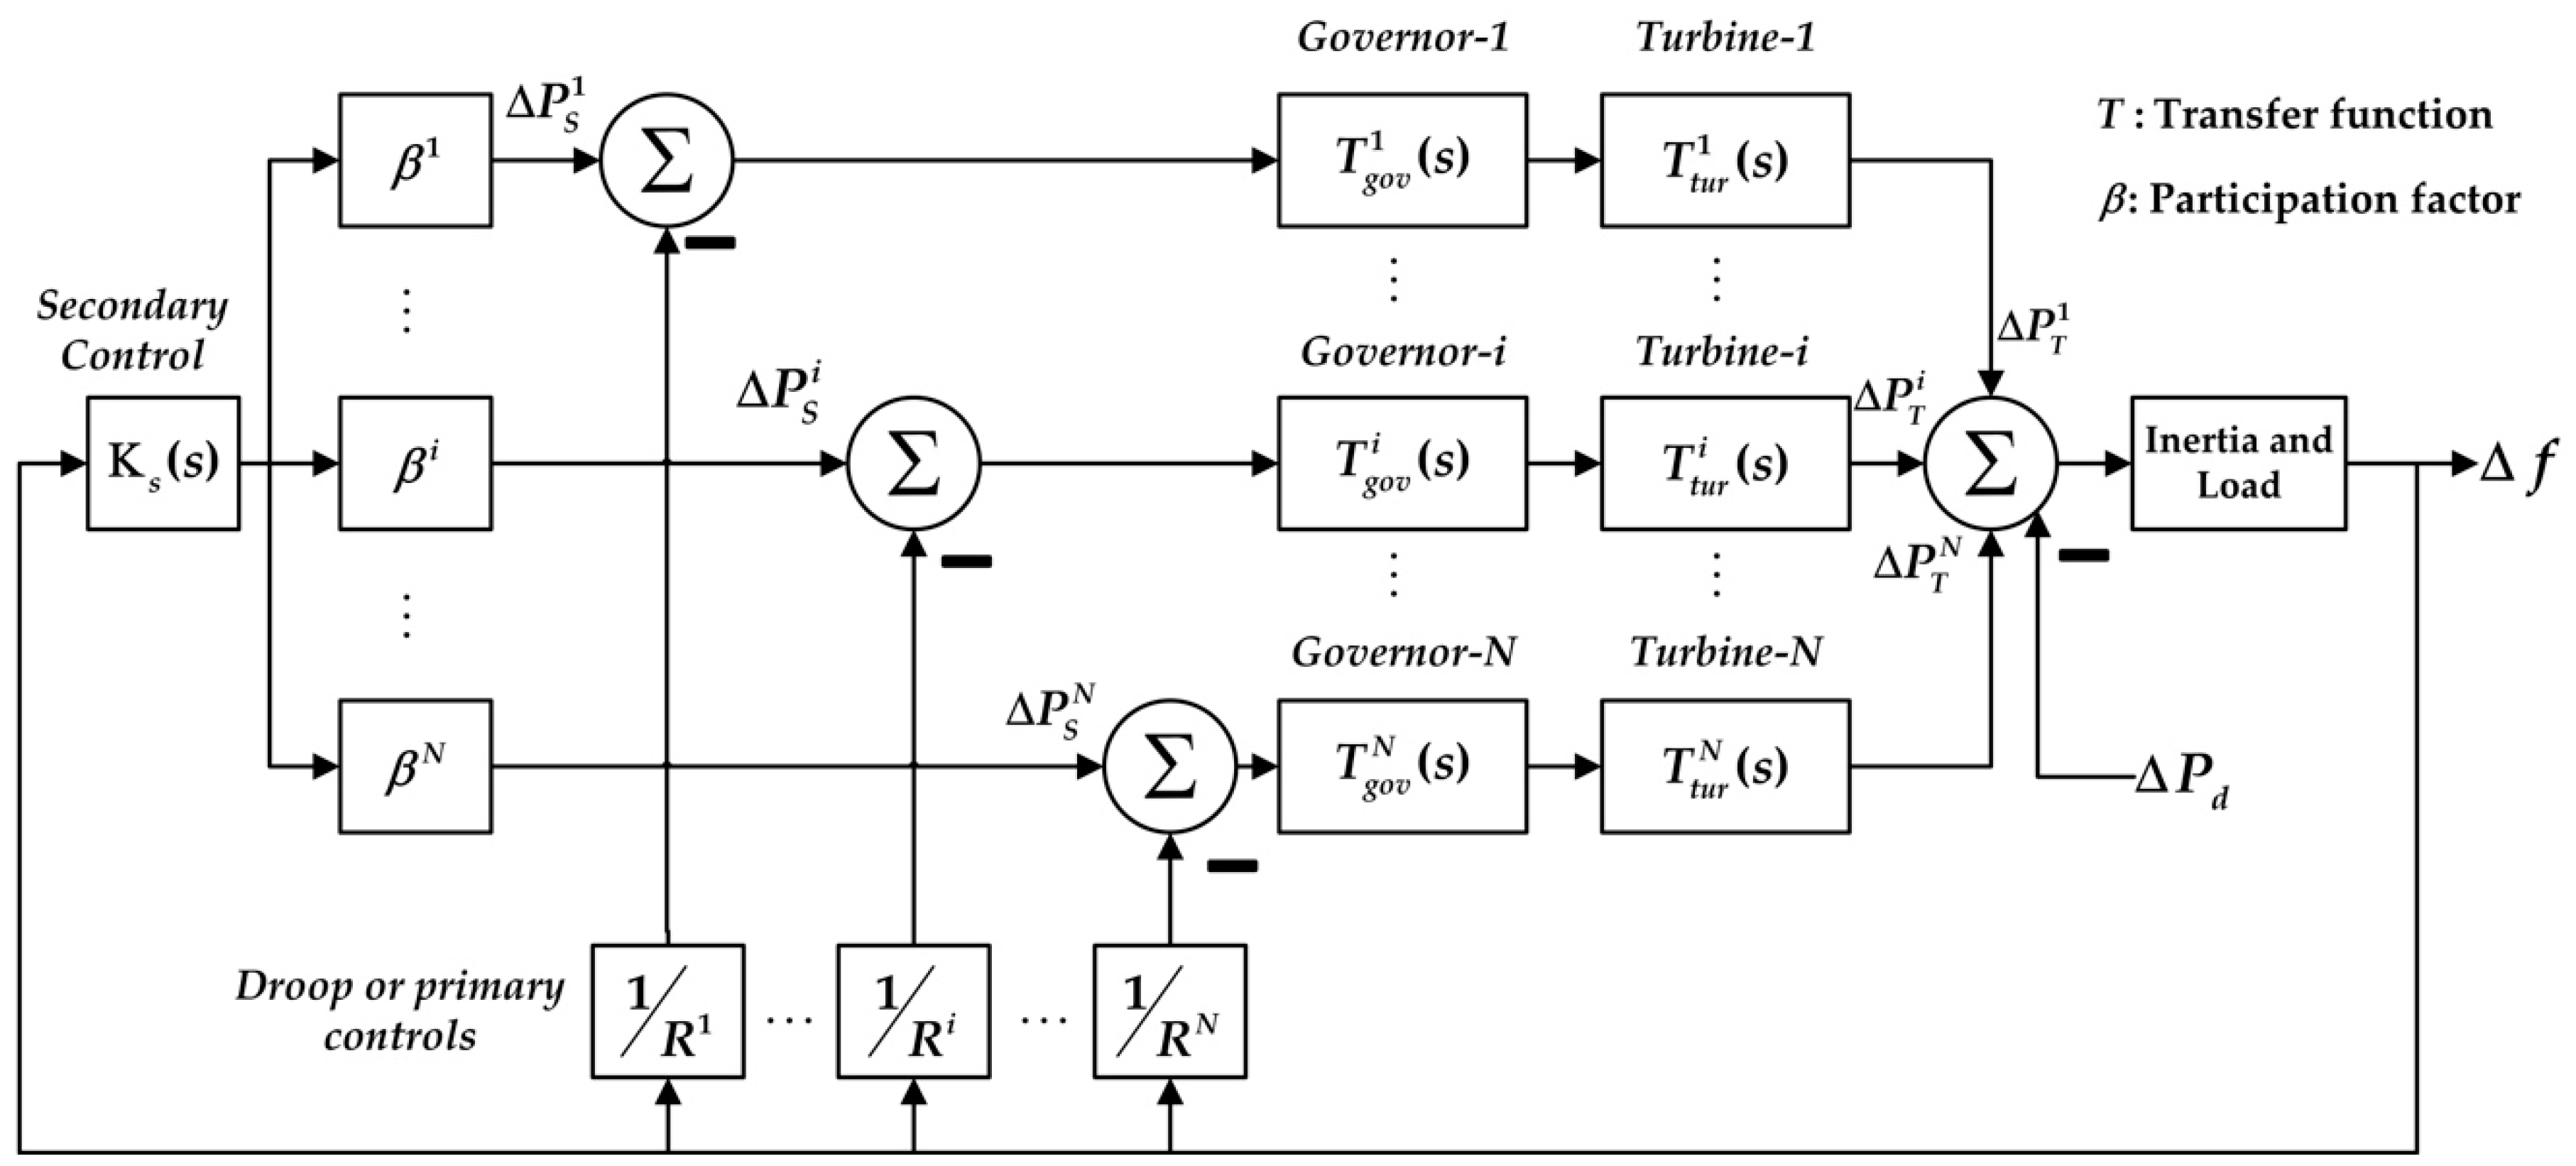
2.3. Multi-Machine System with DR and ESS
3. Case Studies
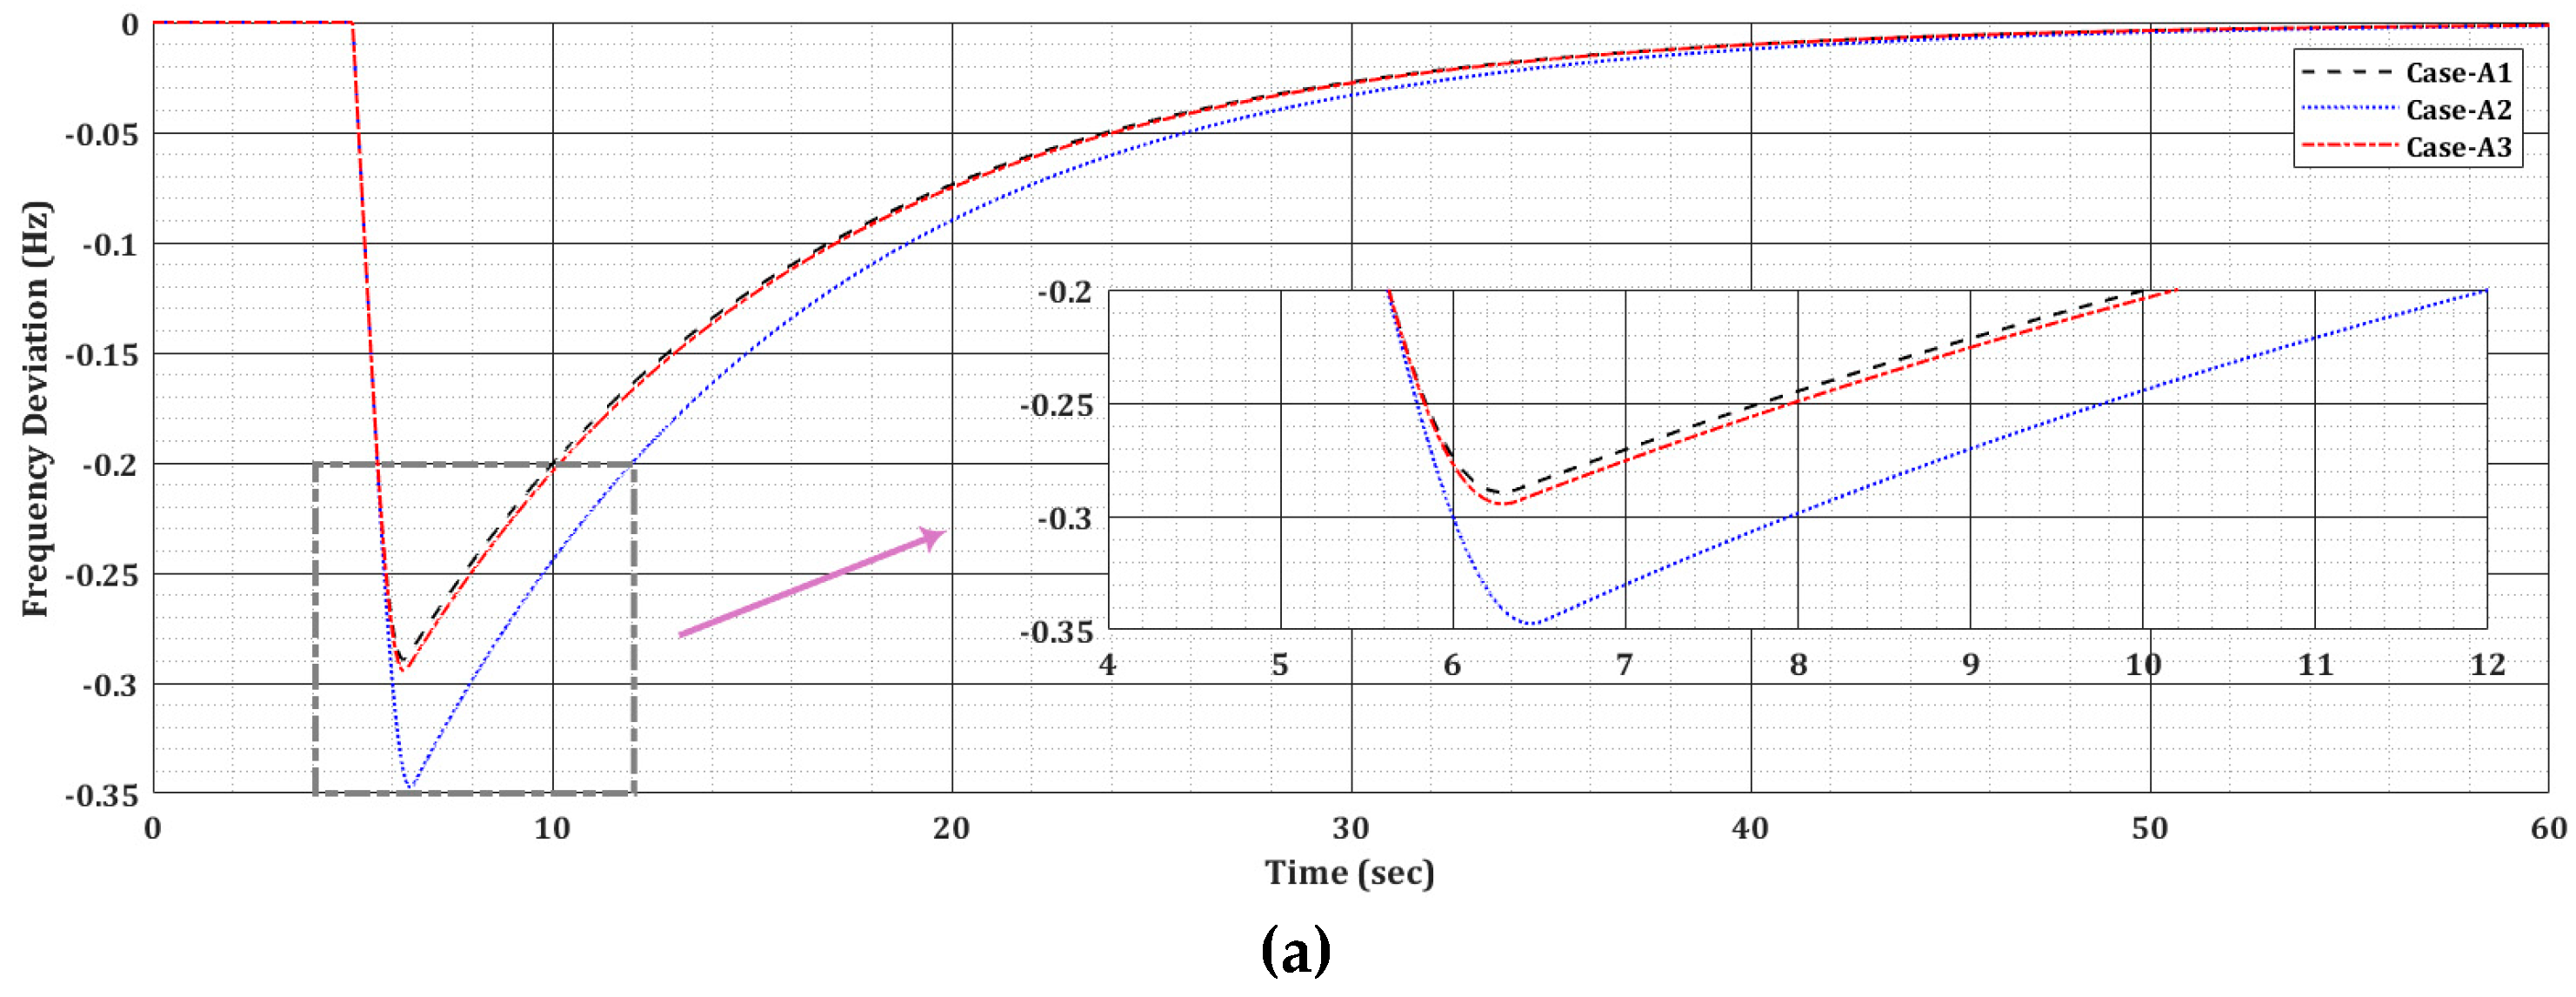
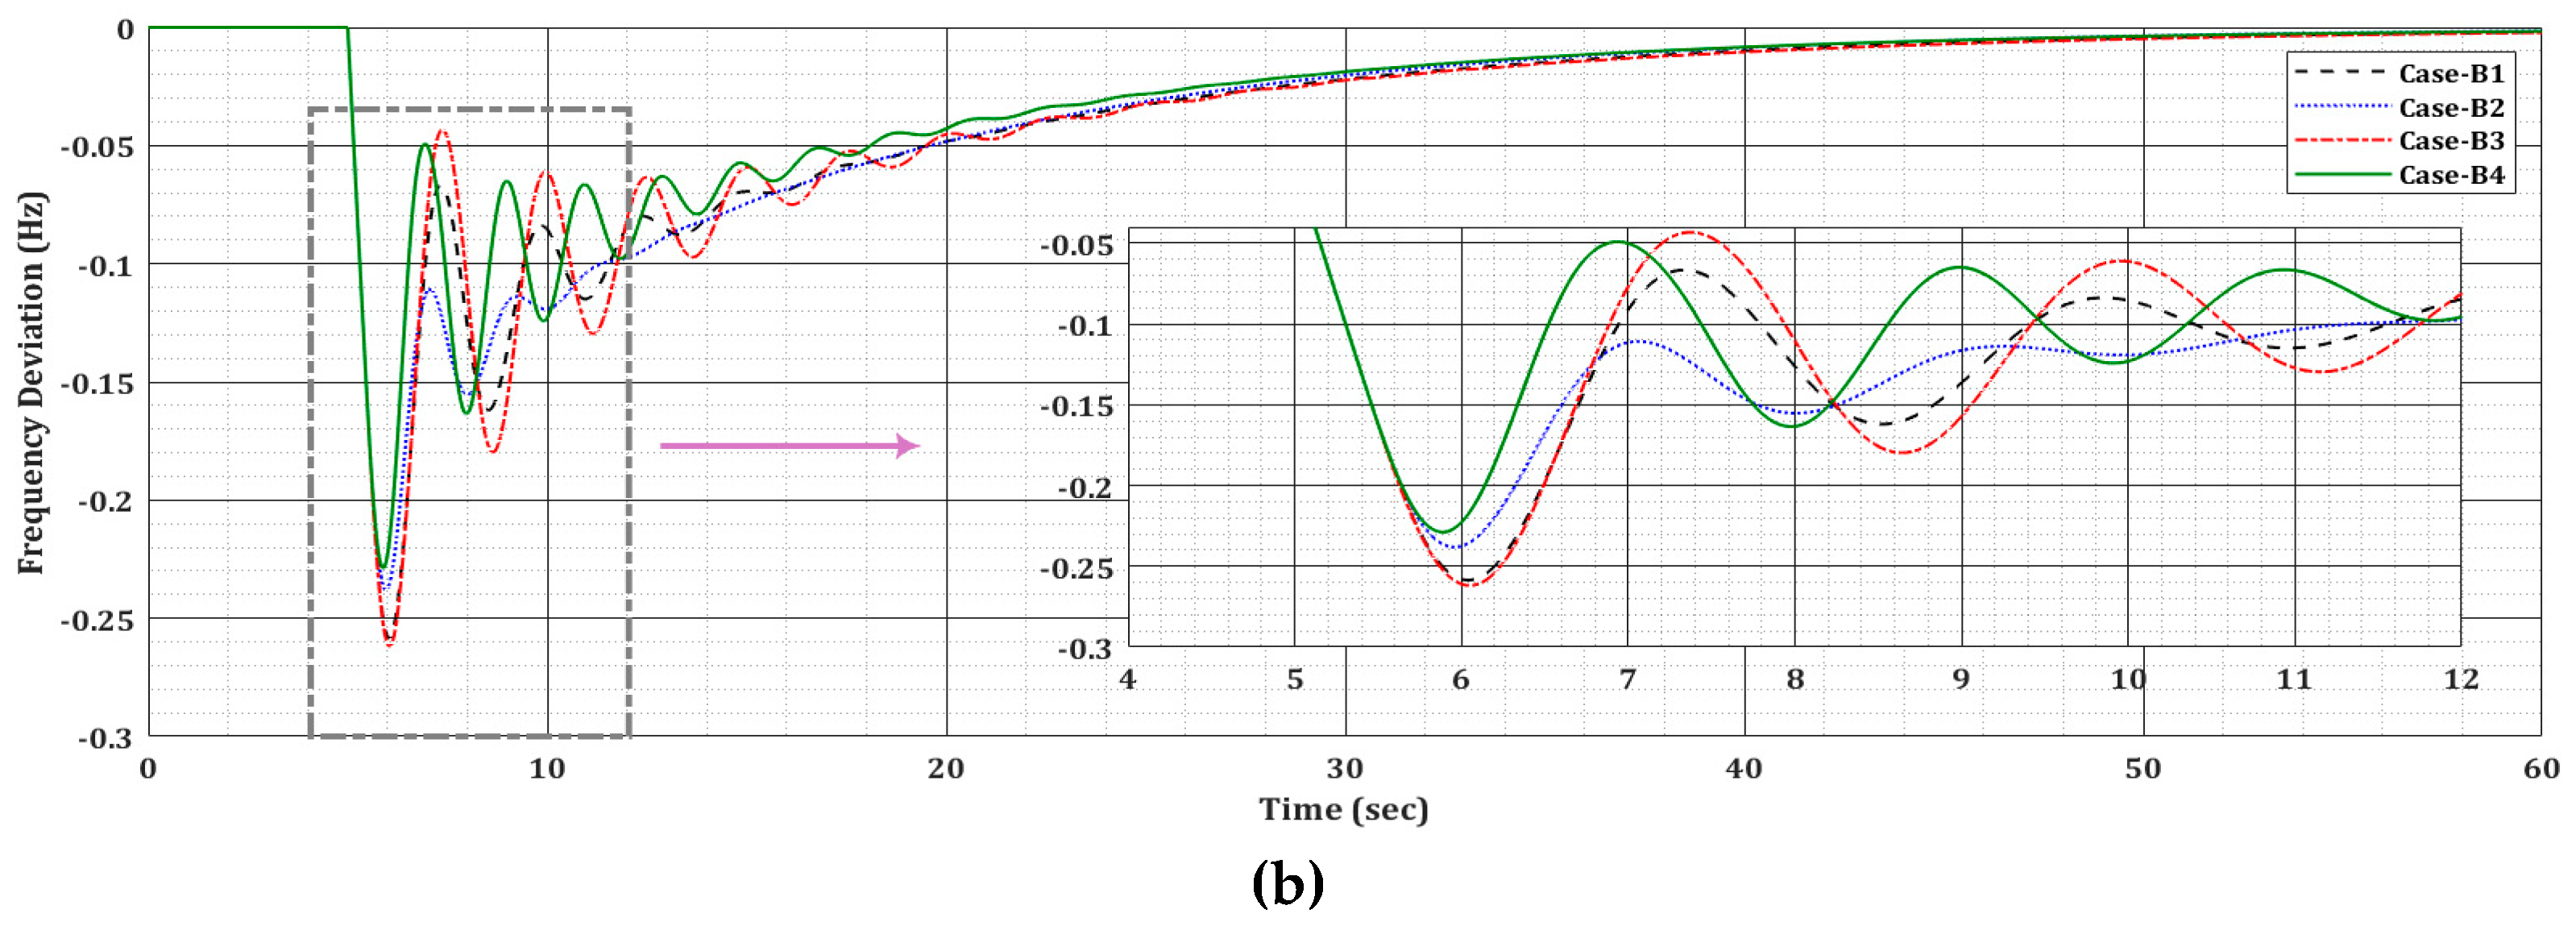
3.1. Conventional Model: Single- and Multi-Machine Cases
3.2. Conventional Model Augmented with Responsive Loads
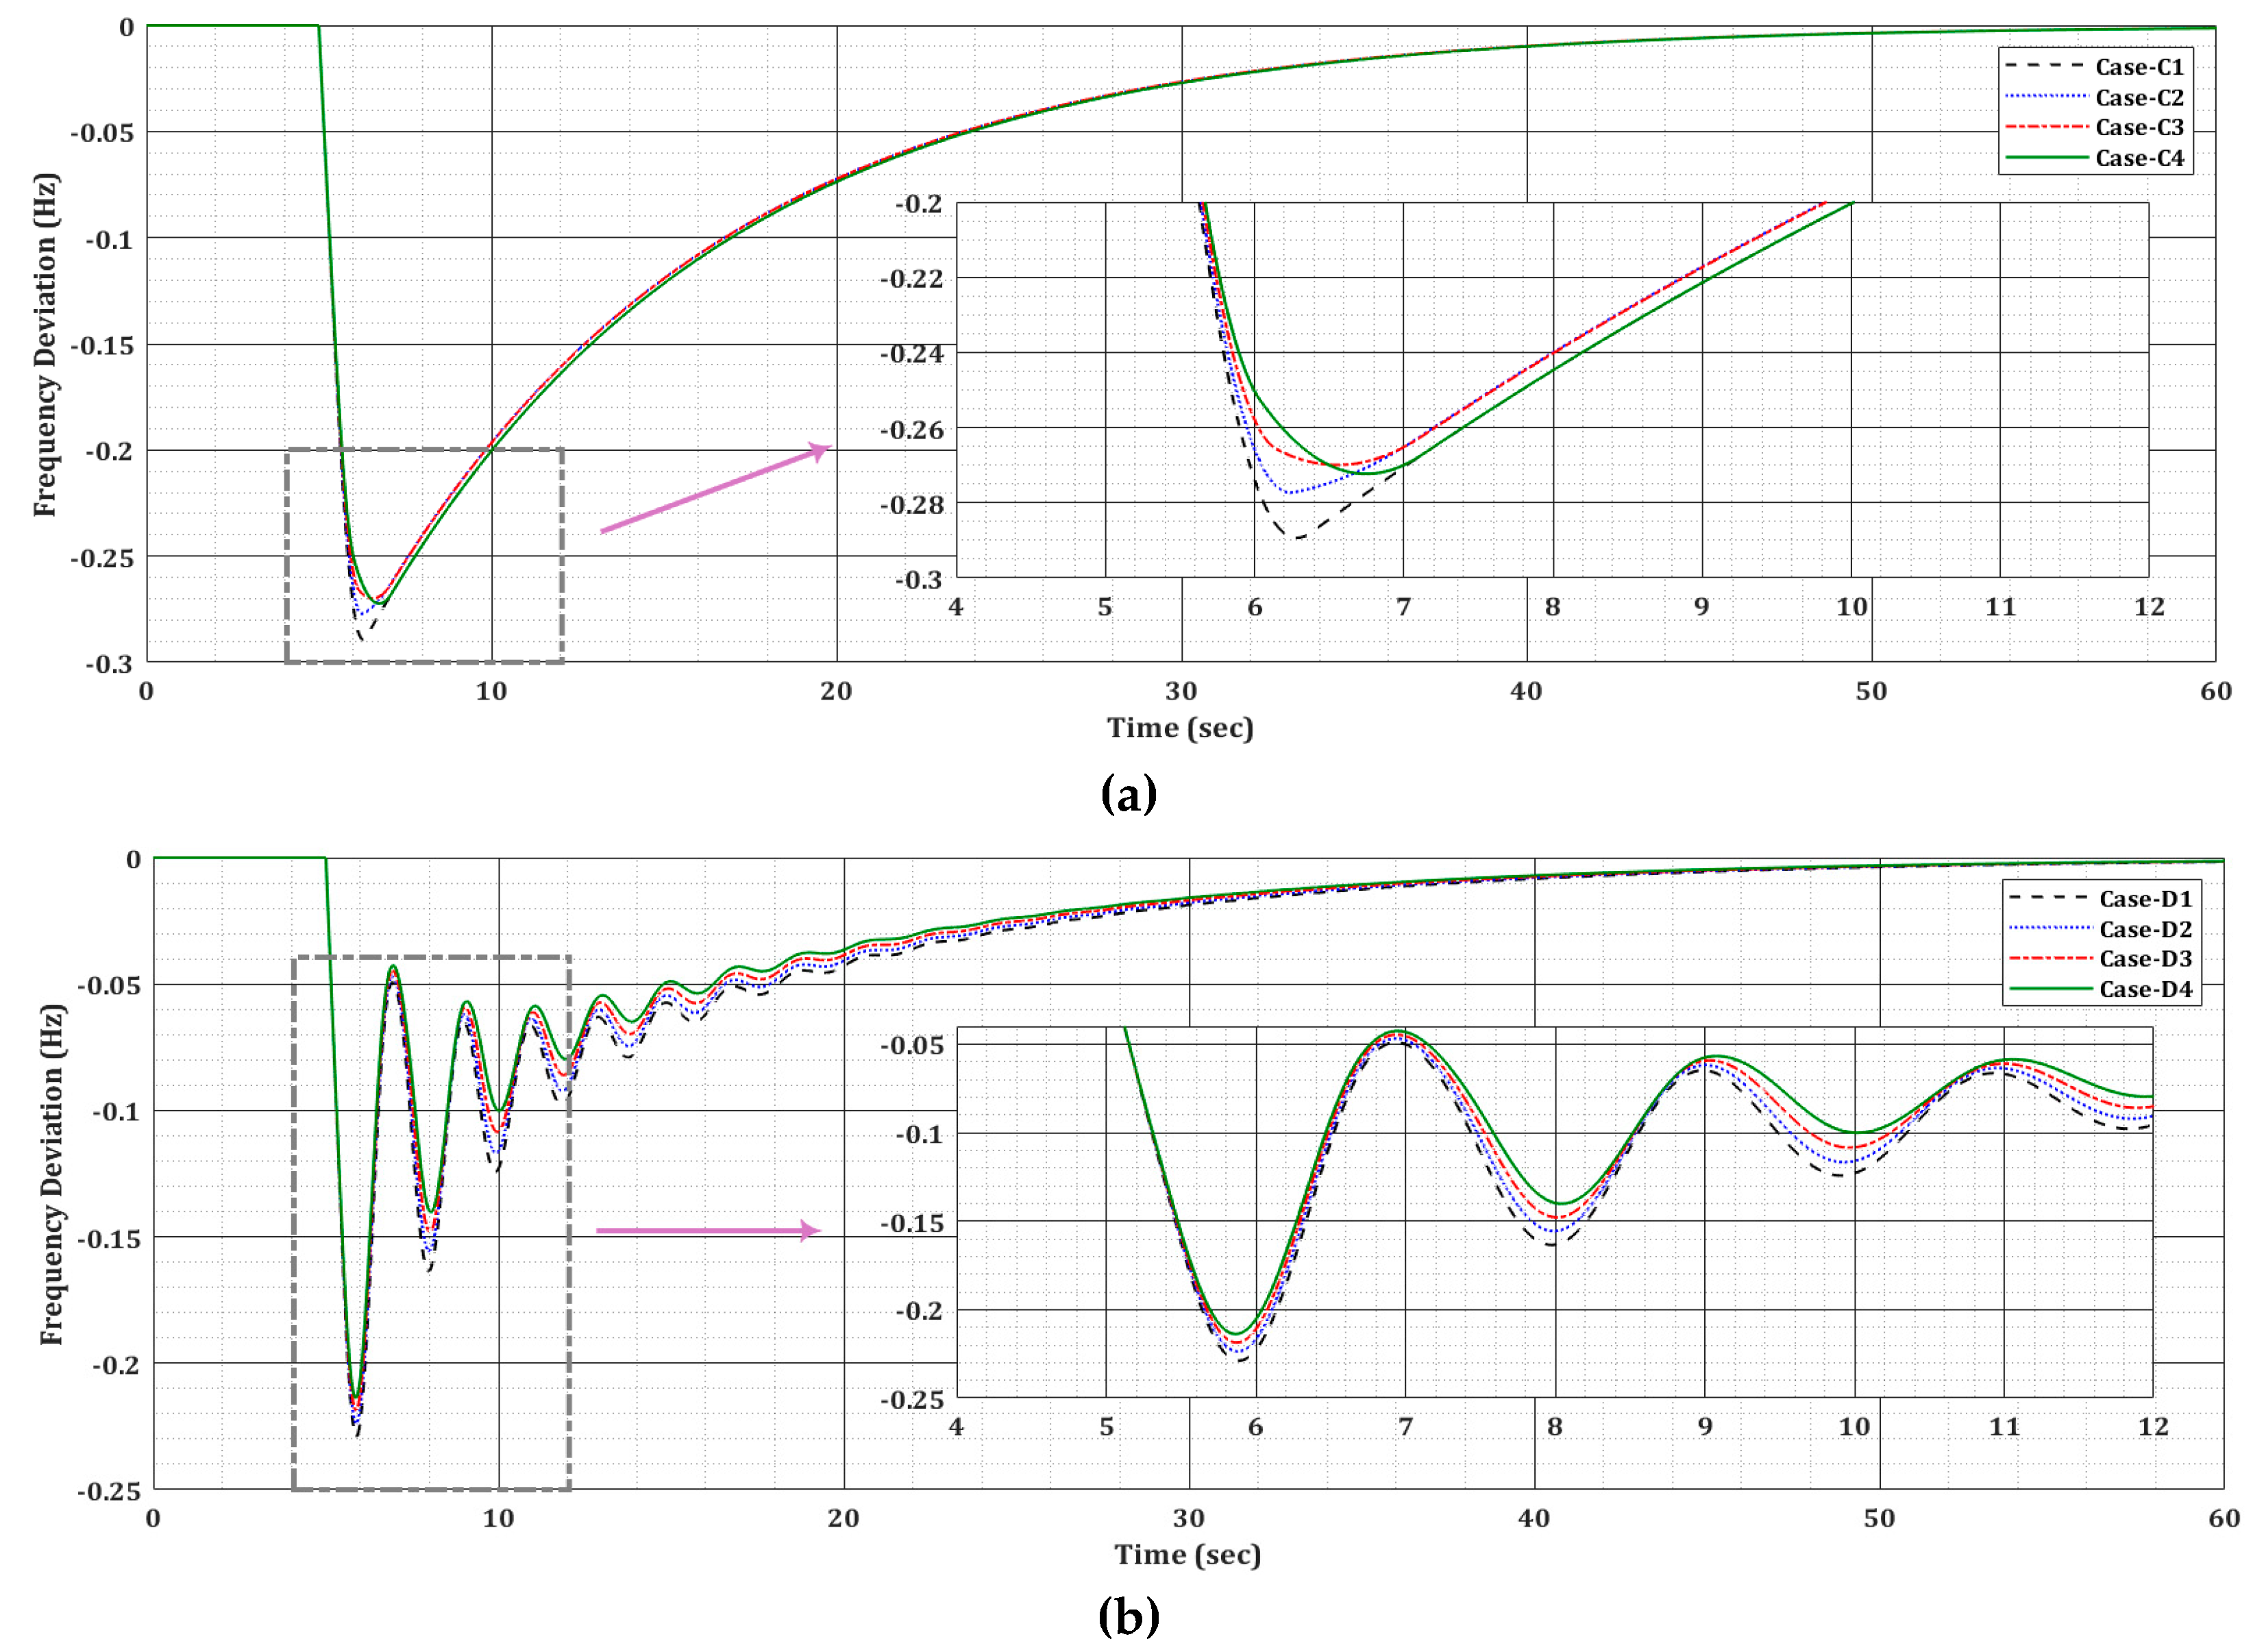
- The presence of responsive loads helps in improving the frequency profile depending on the share () of responsive loads participating for frequency regulation under DR program.
- Depending on the availability and amount of responsive loads, the need for (spinning and non-spinning) reserves reduces as responsive loads can be manipulated according to grid’s needs.
3.3. Conventional Model Augmented with ESS
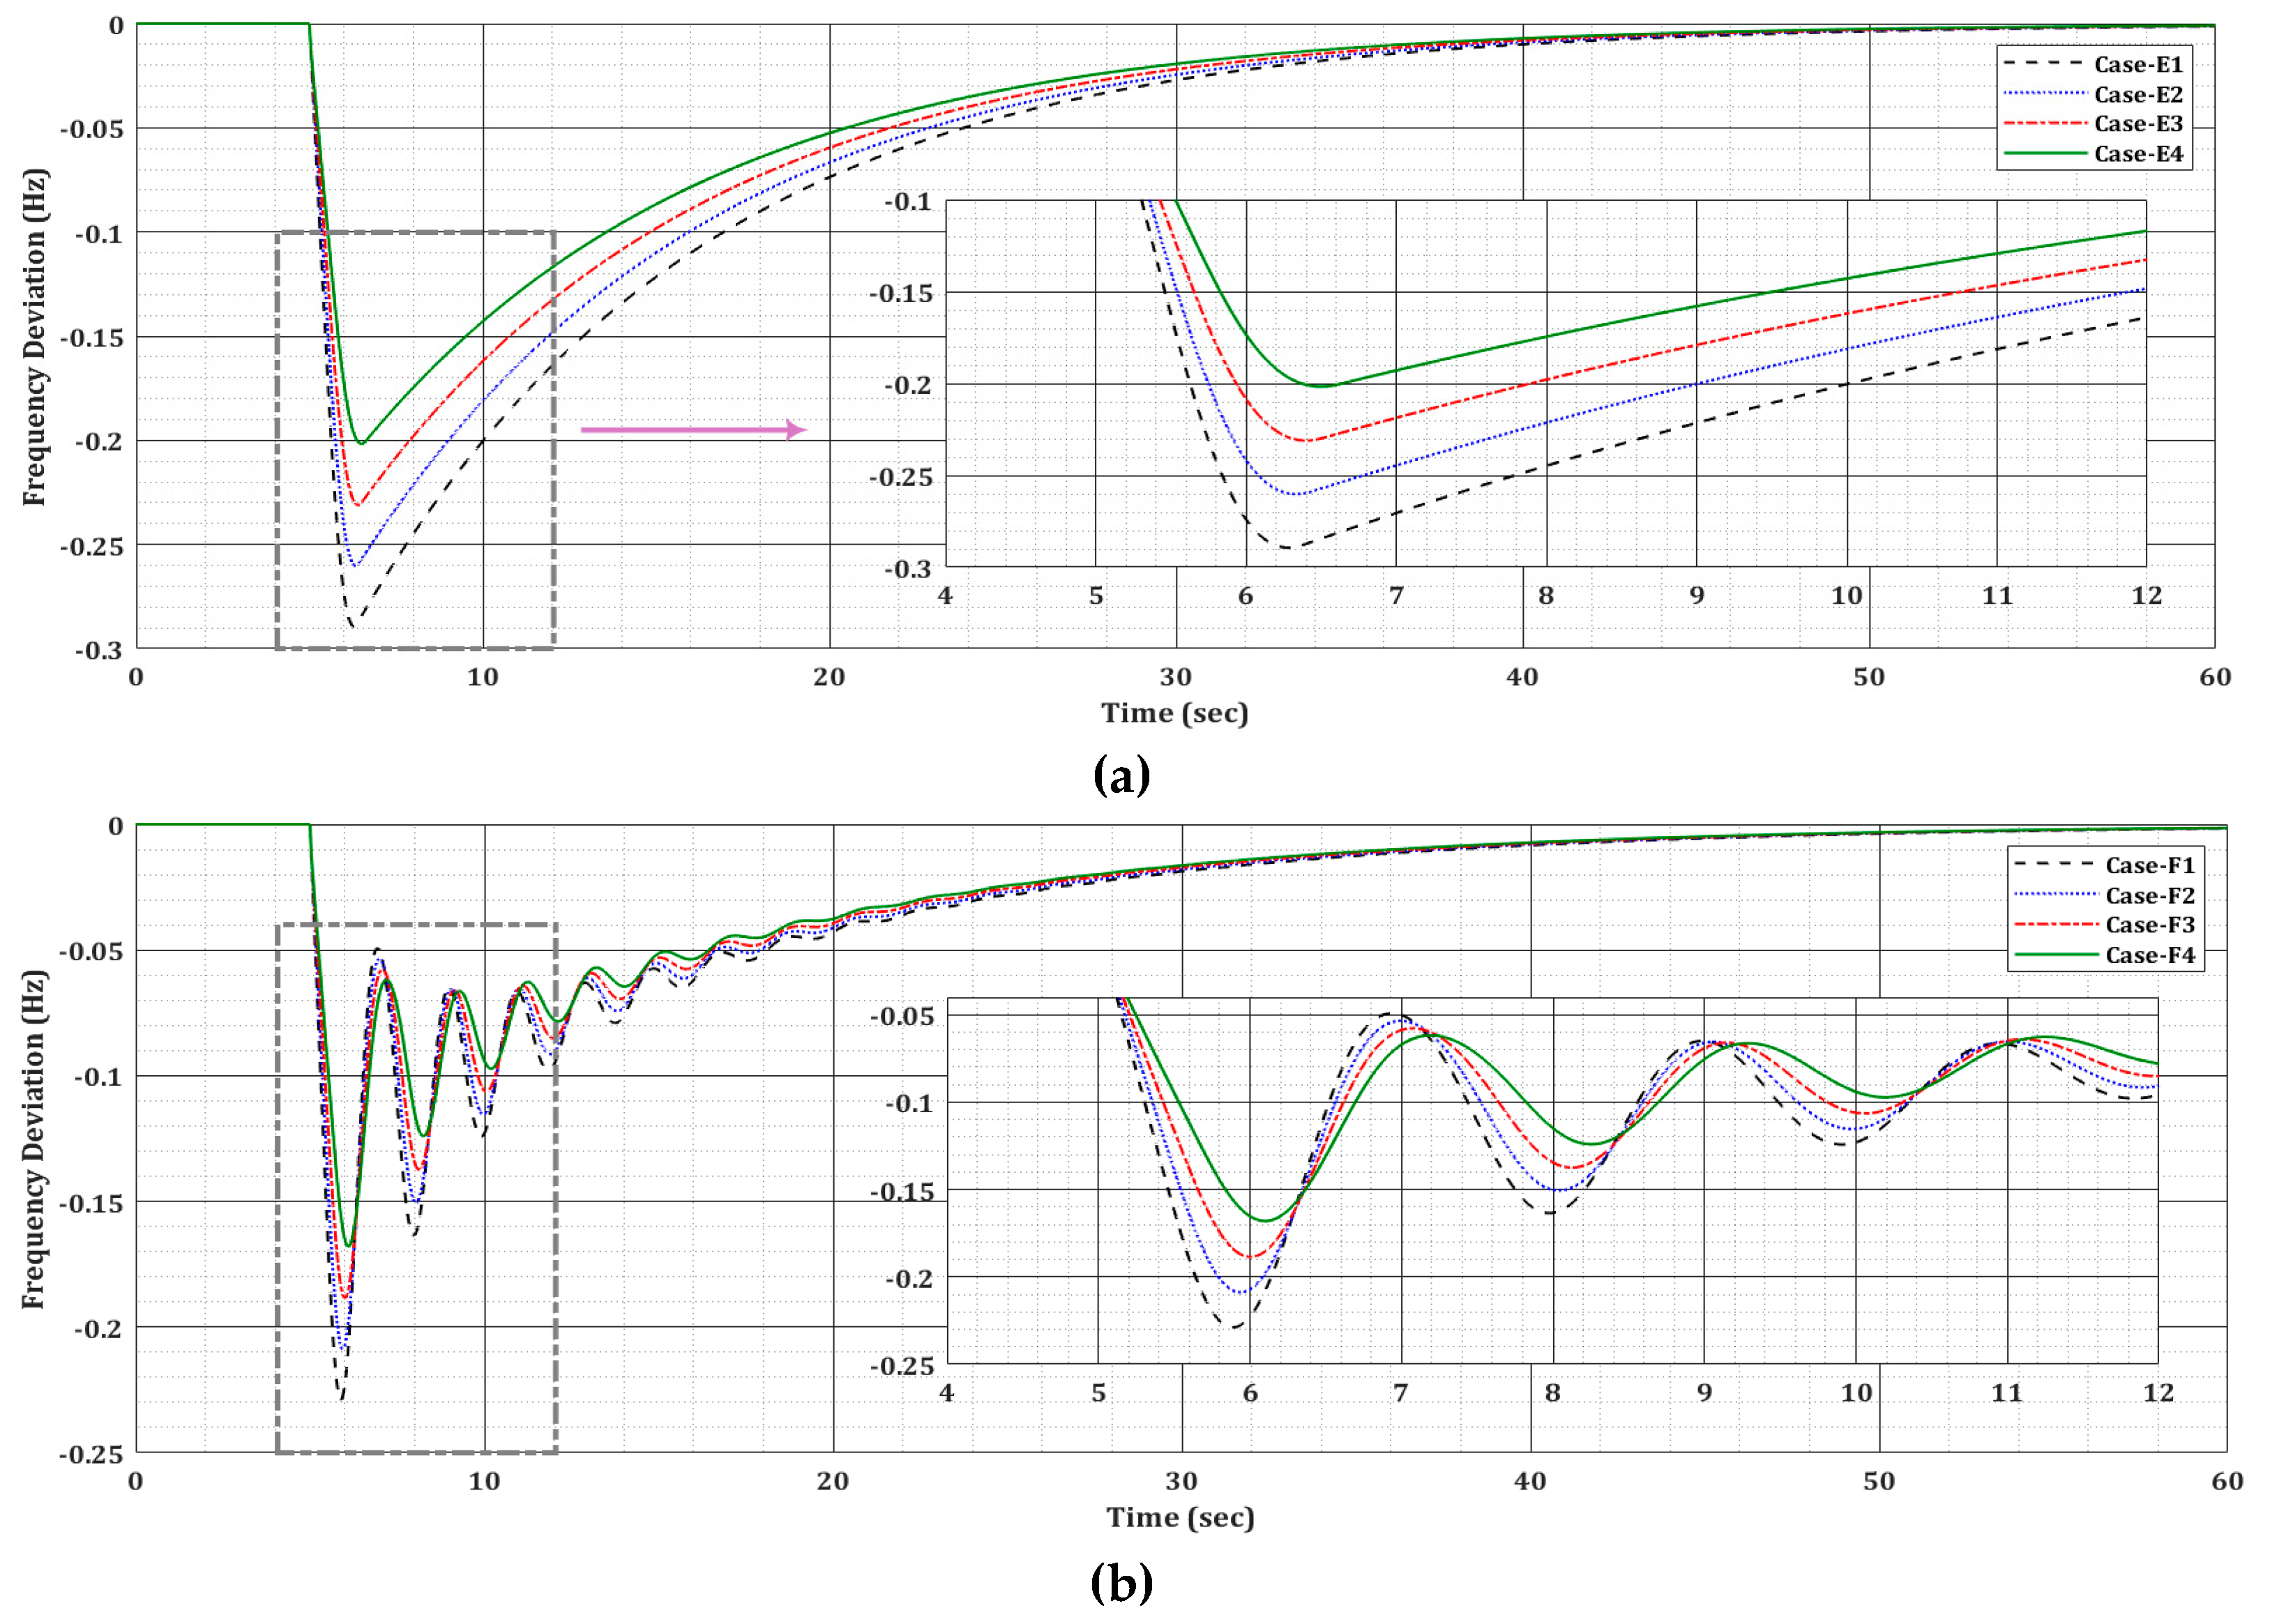
- Figure 7a shows the role of ESS when only Machine-1 is available in the system. The presence of ESS improves the frequency profile in terms of maximum frequency deviation and settling time. Moreover, it can be deduced that the presence of virtual synchronous generator can reduce the size of conventional reserves.
- The impact of ESS in the presence of all three machines is shown in Figure 7b and depends on its share (). Generally, higher the value of , better the frequency response. Moreover, the response of ESS is quicker in comparison to the responsive loads and conventional schemes as well.
3.4. Conventional Model Augmented with Responsive Loads and ESS
- Due to presence of responsive loads and ESS, the response in this scenario is better than conventional control only and between the two already discussed cases.
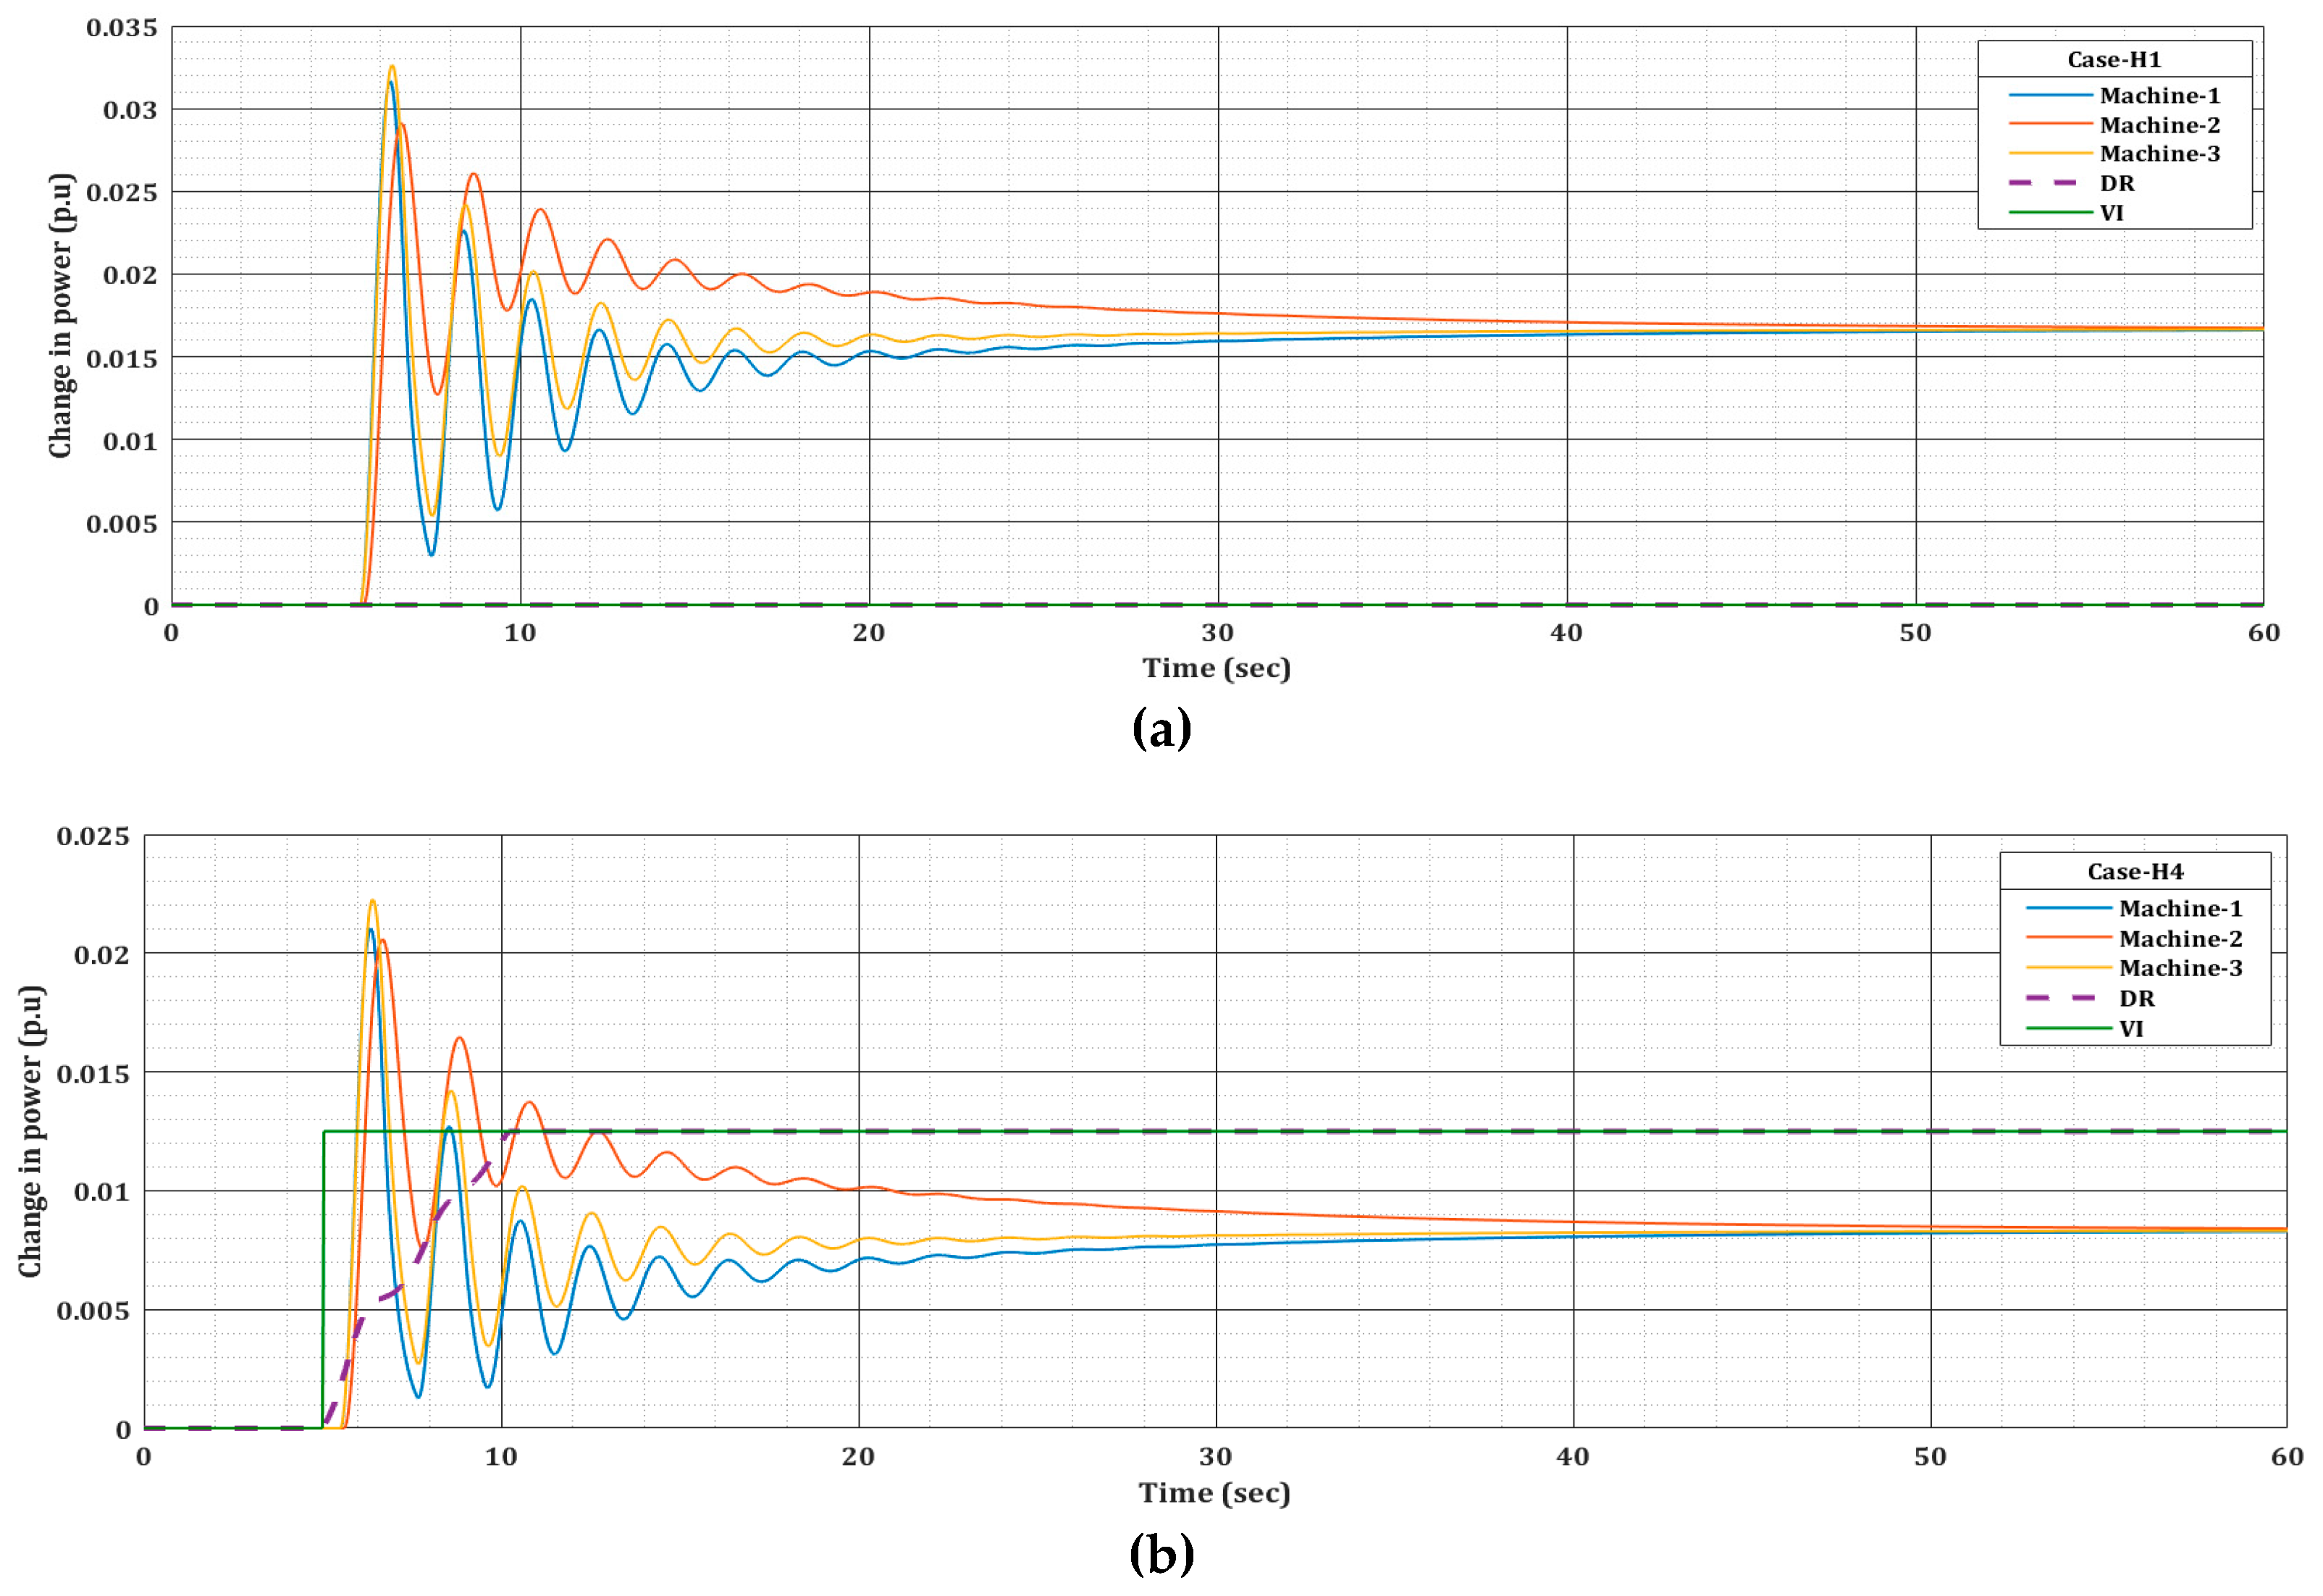
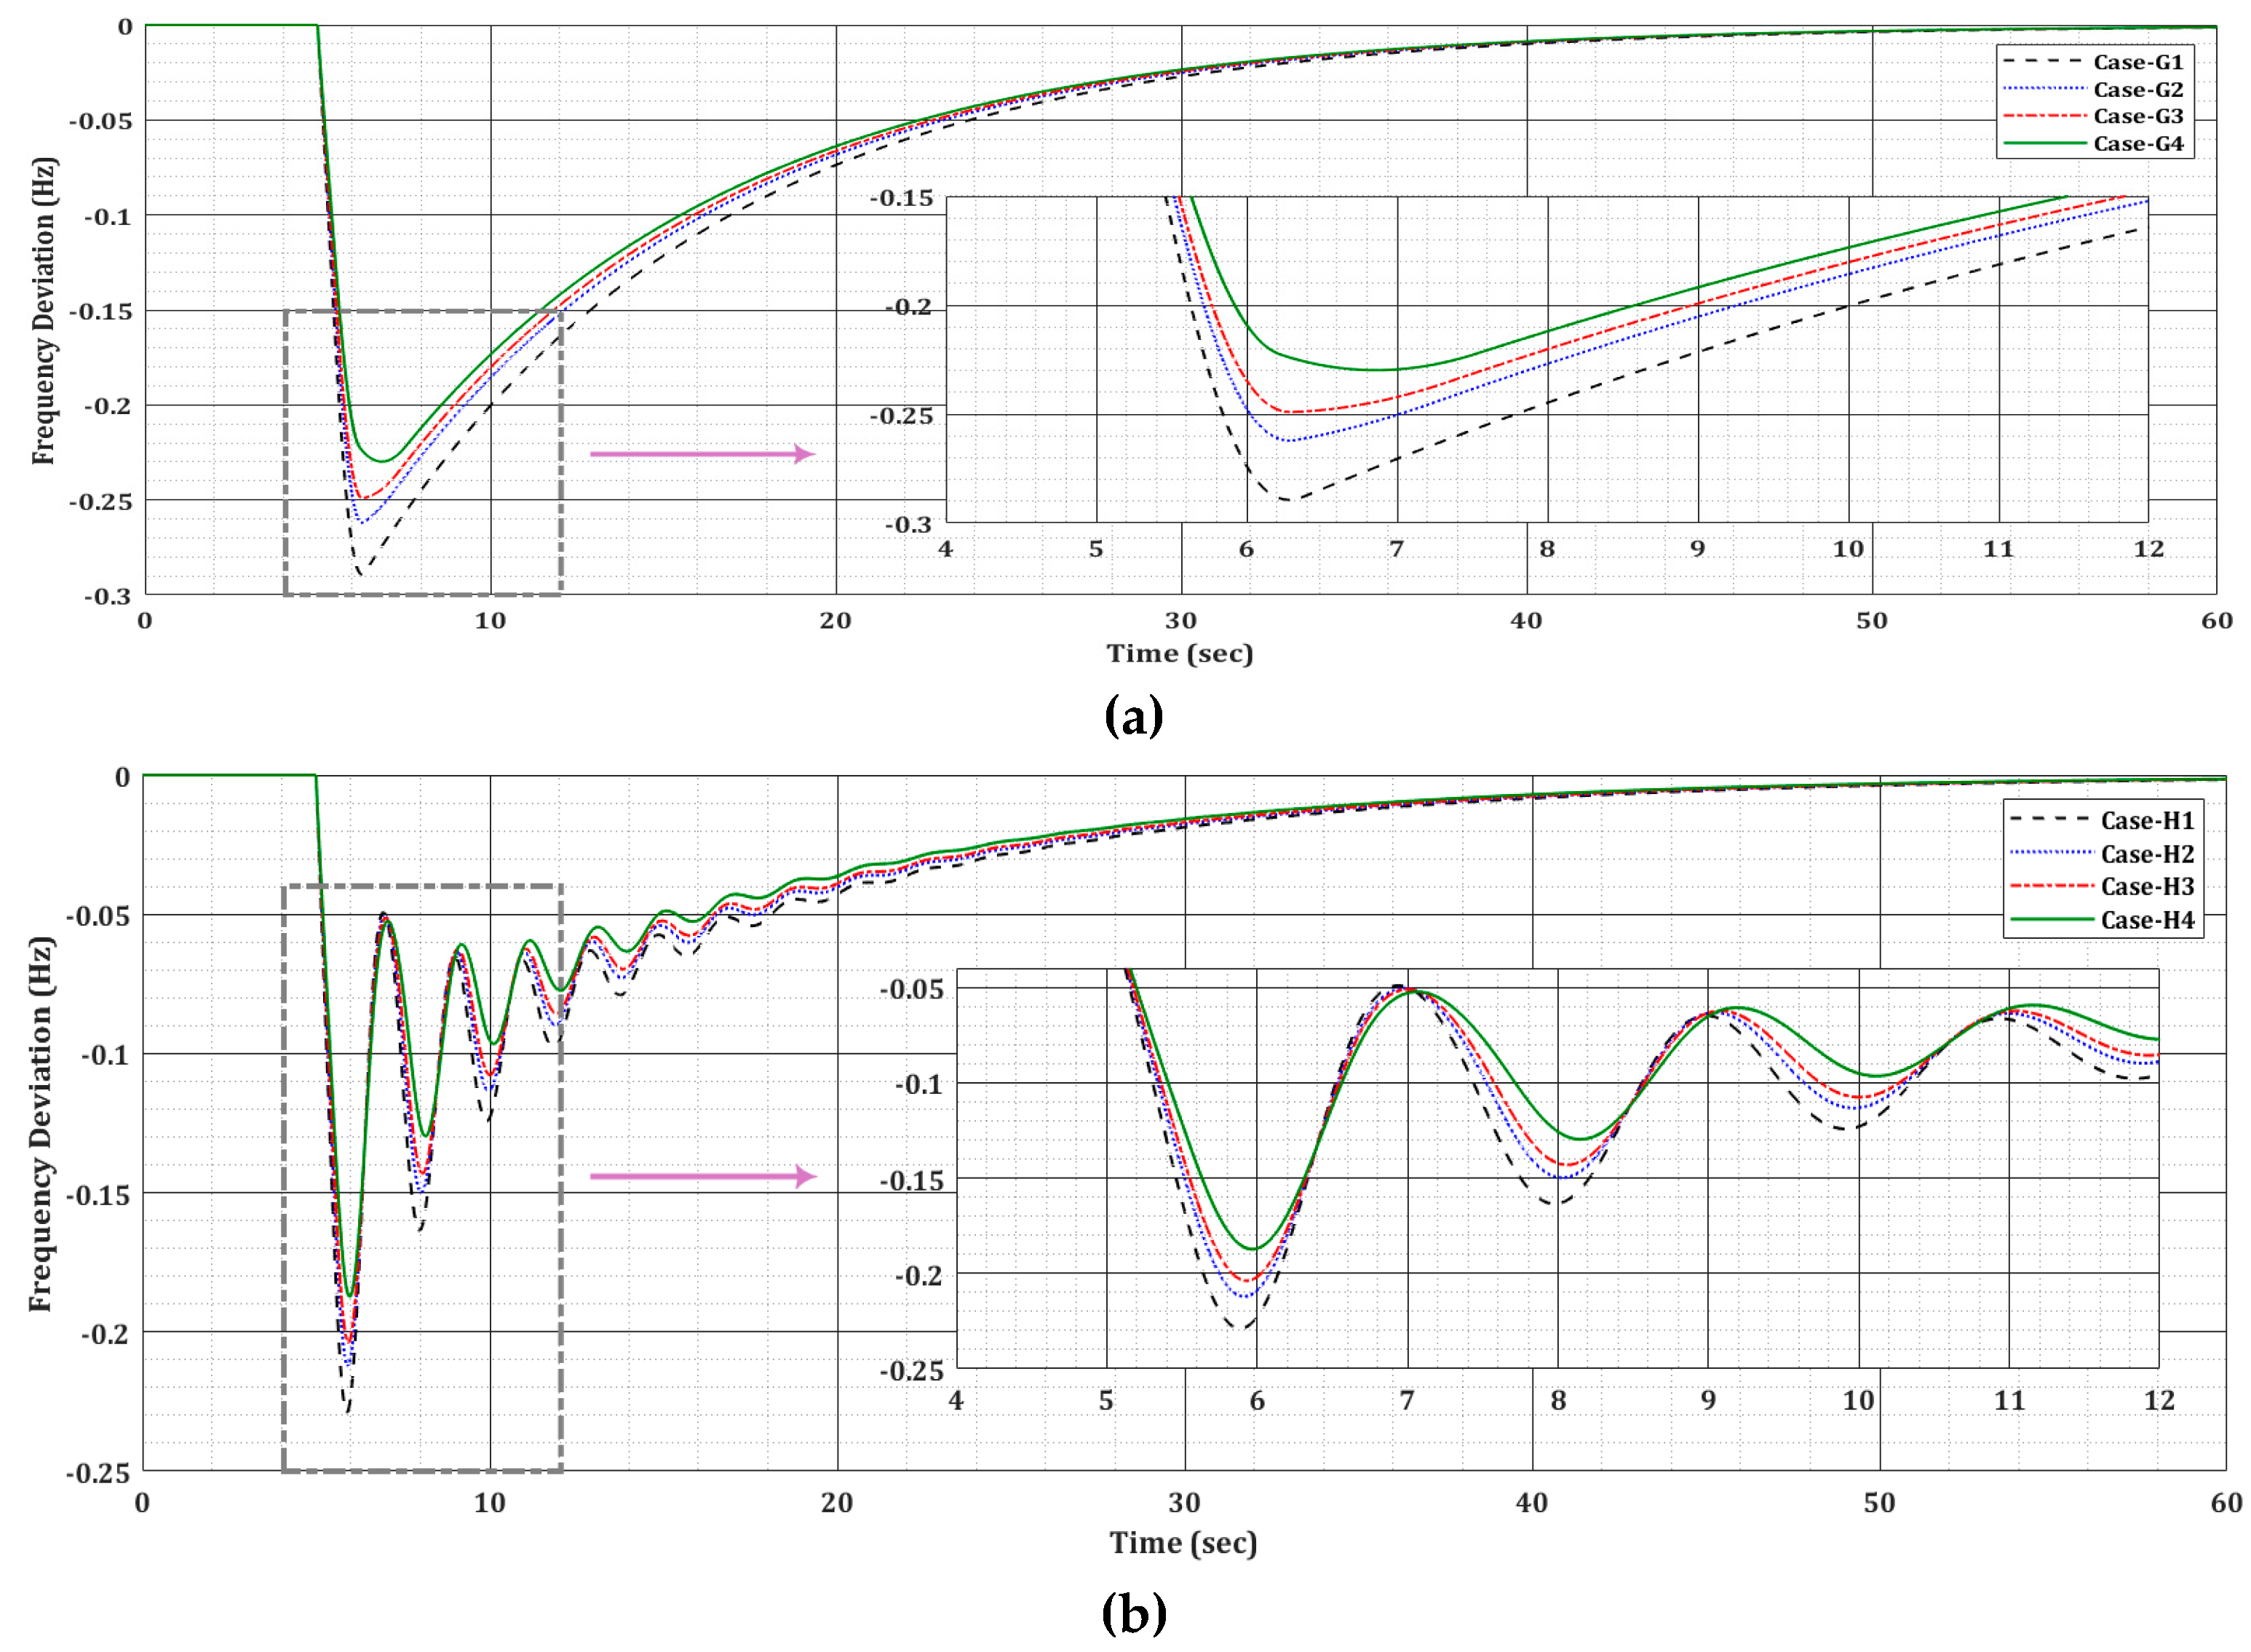
- Figure 9a shows the simulation results for Case-H1 where 3 machines contribute their powers to balance the impact of load disturbance. The slower response of Machine-2 as already discussed is again visible here. In this case, there is no contribution from responsive loads and ESS resources, hence their powers are zero.
- Figure 9b shows the simulation results for Case-H4 where 50% contribution comes from responsive loads and ESS. The ESS has the fastest response as shown in Figure 9b. The contribution of powers from machines, DR and ESS at steady-state agrees with the model developed in Section 2. For example, the contribution of DR is calculated as: , which agrees with the results shown in Figure 9b. Similar calculations are valid for a power contribution from machines and ESS.
3.5. Comaprison
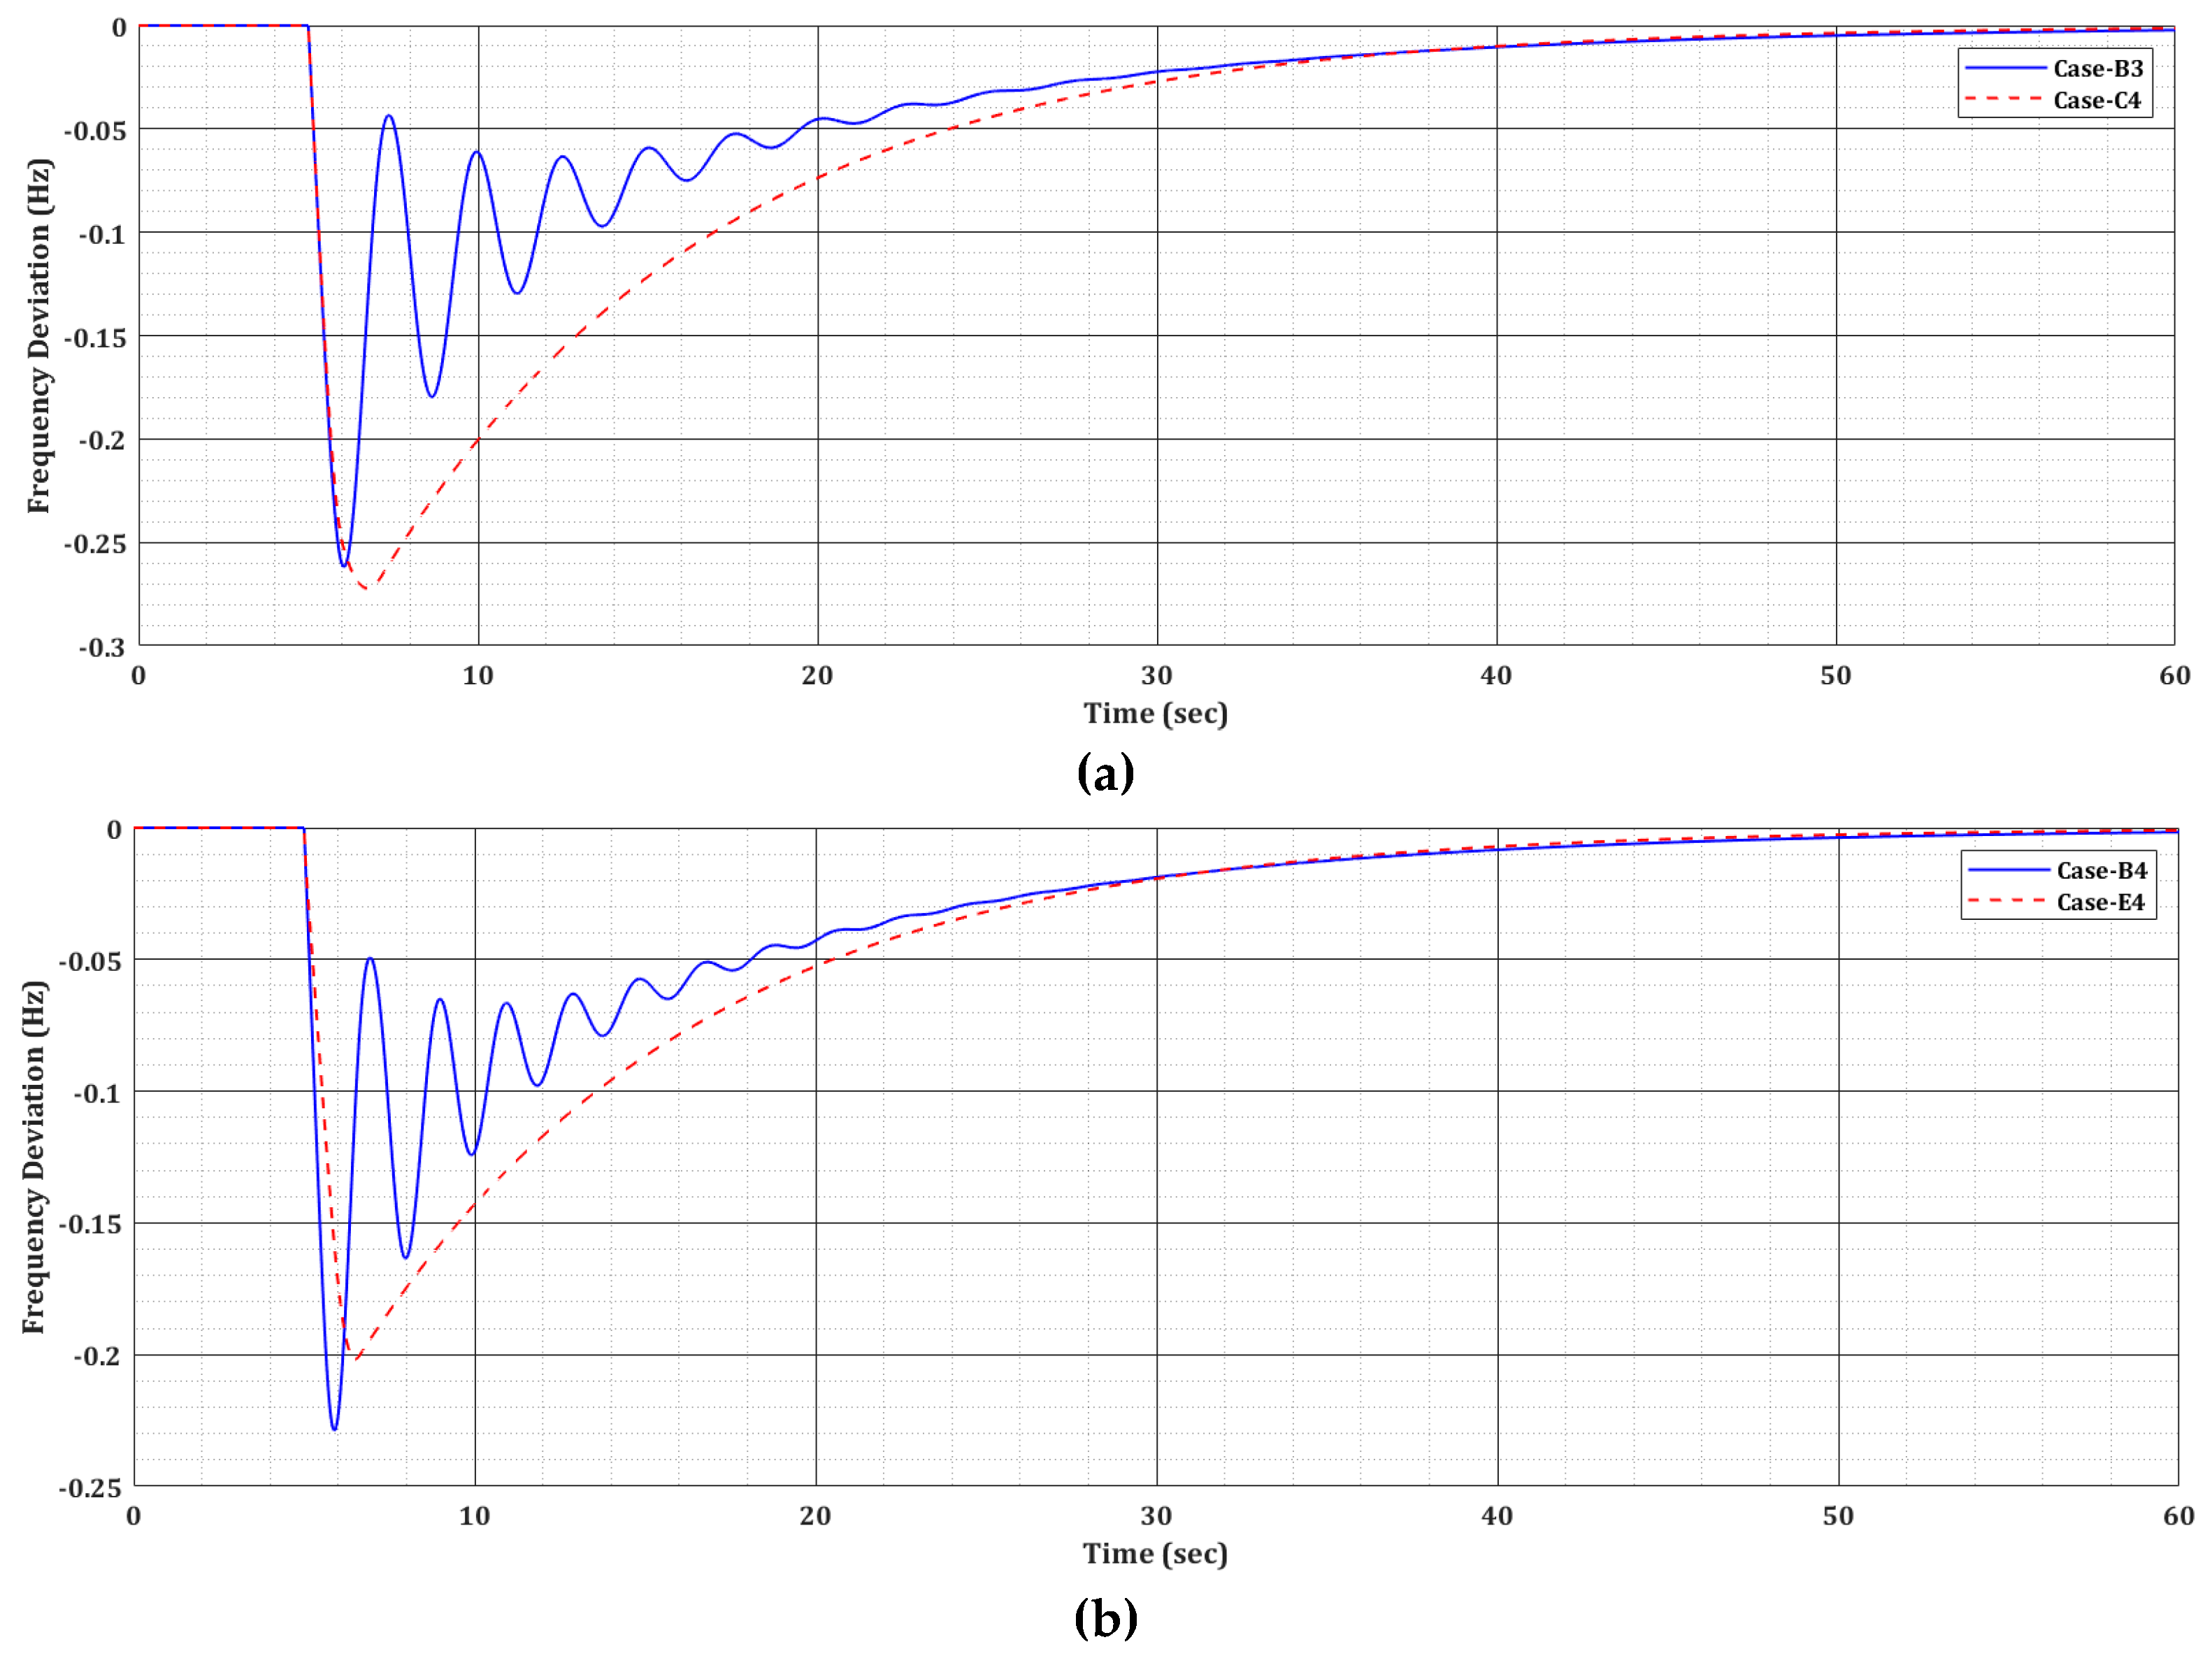
- Figure 10a compares a 2-machine case (Case-B3) with a single machine system augmented with DR (Case-C4). The results show that the responsive loads can effectively handle the load disturbances even when there is partial shortage of conventional supply resources. It is notable that responsive loads cannot fully replace a generation unit if the magnitude of load disturbance is very high. Moreover, despite their benefits, DR programs affect the consumers’ comfort level, so their contribution is limited. However, the presented comparison highlights the fact that responsive loads can play a vital role in frequency regulation in case of partial or temporary unavailability of generation resources.
- Figure 10b compares a 3-machine case (Case-B4) with a single machine system augmented with ESS (Case-E4). The results show that the ESS can quickly restore the frequency deviation. Similar to the previous discussion, it is once again observed that a virtual synchronous machine can efficiently handle the load disturbances in the presence of limited generation resources.
4. Conclusions
Author Contributions
Funding
Conflicts of Interest
Abbreviations and Acronyms
| Share of conventional control | |
| Share of demand response control | |
| Share of energy storage system control | |
| ESS | Energy storage system |
| Percentage of power generated in the reheat portion | |
| Damping coefficient of the power system | |
| DR | Demand response |
| Inertia constant of the power system | |
| Demand response controller | |
| Supplementary controller | |
| Virtual inertia controller | |
| LFC | Load frequency control |
| Droop characteristics | |
| Time constant of governor (sec) | |
| Transfer function of governor | |
| Time constant of reheated turbine (sec) | |
| Time constant of turbine (sec) | |
| Transfer function of turbine | |
| Time constant of hydro turbine (sec) | |
| VI | Virtual inertia |
| Frequency deviation | |
| Load disturbance | |
| Change in turbine power |
References
- Anderson, P.M.; Fouad, A.A. Power System Control and Stability; John Wiley & Sons: Hoboken, NJ, USA, 2008. [Google Scholar]
- Kundur, P. Power System Stability and Control; McGraw-Hill Education: New York, NY, USA, 1994; ISBN 978-0-07-035958-1. [Google Scholar]
- Power Systems Relaying Committee. IEEE Guide for the Application of Protective Relays Used for Abnormal Frequency Load Shedding and Restoration. IEEE Std. C 2007, 37, c1–c43. [Google Scholar]
- Shahid, K.; Altin, M.; Mikkelsen, L.M.; Løvenstein Olsen, R.; Iov, F. ICT Based Performance Evaluation of Primary Frequency Control Support from Renewable Power Plants in Smart Grids. Energies 2018, 11, 1329. [Google Scholar] [CrossRef]
- Pieroni, T.; Dotta, D. Identification of the Most Effective Point of Connection for Battery Energy Storage Systems Focusing on Power System Frequency Response Improvement. Energies 2018, 11, 763. [Google Scholar] [CrossRef]
- Zaman, M.S.; Bukhari, S.B.A.; Haider, R.; Hazazi, K.M.; Kim, C.H.; Ashraf, H.M. Demand Response Augmented Control with Load Restore Capabilities for Frequency Regulation of an RES-Integrated Power System. In Proceedings of the 2018 International Conference on Electrical Engineering (ICEE), Lahore, Pakistan, 15–16 February 2018; pp. 1–5. [Google Scholar]
- Hussain, A.; Bui, V.-H.; Kim, H.-M. Impact Analysis of Demand Response Intensity and Energy Storage Size on Operation of Networked Microgrids. Energies 2017, 10, 882. [Google Scholar] [CrossRef]
- Haider, Z.M.; Mehmood, K.K.; Rafique, M.K.; Khan, S.U.; Lee, S.-J.; Kim, C.-H. Water-filling algorithm based approach for management of responsive residential loads. J. Mod. Power Syst. Clean Energy 2018, 6, 118–131. [Google Scholar] [CrossRef]
- Nisar, A.; Thomas, M.S. Comprehensive Control for Microgrid Autonomous Operation with Demand Response. IEEE Trans. Smart Grid 2017, 8, 2081–2089. [Google Scholar] [CrossRef]
- Pourmousavi, S.A.; Nehrir, M.H. Introducing Dynamic Demand Response in the LFC Model. IEEE Trans. Power Syst. 2014, 29, 1562–1572. [Google Scholar] [CrossRef]
- Pourmousavi, S.A.; Nehrir, M.H. Real-Time Central Demand Response for Primary Frequency Regulation in Microgrids. IEEE Trans. Smart Grid 2012, 3, 1988–1996. [Google Scholar] [CrossRef]
- Delavari, A.; Kamwa, I. Virtual inertia-based load modulation for power system primary frequency regulation. In Proceedings of the 2017 IEEE Power Energy Society General Meeting, Chicago, IL, USA, 16–20 July 2017; pp. 1–5. [Google Scholar]
- Bevrani, H. Robust Power System Frequency Control; Power Electronics and Power Systems; Springer International Publishing: Berlin/Heidelberg, Germany, 2014; ISBN 978-3-319-07277-7. [Google Scholar]
- Tamrakar, U.; Shrestha, D.; Maharjan, M.; Bhattarai, B.P.; Hansen, T.M.; Tonkoski, R. Virtual Inertia: Current Trends and Future Directions. Appl. Sci. 2017, 7, 654. [Google Scholar] [CrossRef]
- Stein, K.; Tun, M.; Musser, K.; Rocheleau, R. Evaluation of a 1 MW, 250 kW-hr Battery Energy Storage System for Grid Services for the Island of Hawaii. Energies 2018, 11, 3367. [Google Scholar] [CrossRef]
- Hirase, Y.; Abe, K.; Sugimoto, K.; Sakimoto, K.; Bevrani, H.; Ise, T. A novel control approach for virtual synchronous generators to suppress frequency and voltage fluctuations in microgrids. Appl. Energy 2018, 210, 699–710. [Google Scholar] [CrossRef]
- Kerdphol, T.; Rahman, F.; Mitani, Y.; Hongesombut, K.; Küfeoğlu, S. Virtual Inertia Control-Based Model Predictive Control for Microgrid Frequency Stabilization Considering High Renewable Energy Integration. Sustainability 2017, 9, 773. [Google Scholar] [CrossRef]
- Van, T.V.; Visscher, K.; Diaz, J.; Karapanos, V.; Woyte, A.; Albu, M.; Bozelie, J.; Loix, T.; Federenciuc, D. Virtual synchronous generator: An element of future grids. In Proceedings of the Innovative Smart Grid Technologies Conference Europe (ISGT Europe), Gothenberg, Sweden, 11–13 October 2010; pp. 1–7. [Google Scholar]
- Karapanos, V.; de Haan, S.; Zwetsloot, K. Testing a virtual synchronous generator in a real time simulated power system. In Proceedings of the International Conference on Power Systems Transients (IPST), Delft, The Netherlands, 14–17 June 2011. [Google Scholar]
- Albu, M.; Calin, M.; Federenciuc, D.; Diaz, J. The measurement layer of the Virtual Synchronous Generator operation in the field test. In Proceedings of the 2011 IEEE International Workshop on Applied Measurements for Power Systems (AMPS), Aachen, Germany, 28–30 September 2011; pp. 85–89. [Google Scholar]
- Saeed Uz Zaman, M.; Bukhari, S.; Hazazi, K.; Haider, Z.; Haider, R.; Kim, C.H. Frequency Response Analysis of a Single-Area Power System with a Modified LFC Model Considering Demand Response and Virtual Inertia. Energies 2018, 11, 787. [Google Scholar] [CrossRef]
- Rezaei, N.; Kalantar, M. Smart microgrid hierarchical frequency control ancillary service provision based on virtual inertia concept: An integrated demand response and droop controlled distributed generation framework. Energy Convers. Manag. 2015, 92, 287–301. [Google Scholar] [CrossRef]
- Lu, Z.; Guo, K.; Yan, G.; He, L. Optimal Dispatch of Power System Integrated with Wind Power Considering Virtual Generator Units of Demand Response and Carbon Trading. Autom. Electr. Power Syst. 2017, 41, 58–65. [Google Scholar]
- Abbasi, E. Coordinated primary control reserve by flexible demand and wind power through ancillary service—Centered virtual power plant. Int. Trans. Electr. Energy Syst. 2017, 27, e2452. [Google Scholar] [CrossRef]
- Bevrani, H. Virtual Inertia-Based Frequency Control. In Robust Power System Frequency Control; Bevrani, H., Ed.; Power Electronics and Power Systems; Springer International Publishing: Berlin/Heidelberg, Germany, 2014; pp. 349–376. ISBN 978-3-319-07278-4. [Google Scholar]
- Sondhi, S.; Hote, Y.V. Fractional order PID controller for load frequency control. Energy Convers. Manag. 2014, 85, 343–353. [Google Scholar] [CrossRef]
- Shariatzadeh, F.; Mandal, P.; Srivastava, A.K. Demand response for sustainable energy systems: A review, application and implementation strategy. Renew. Sustain. Energy Rev. 2015, 45, 343–350. [Google Scholar] [CrossRef]
- Zhong, Q.-C.; Weiss, G. Synchronverters: Inverters That Mimic Synchronous Generators. IEEE Trans. Ind. Electron. 2011, 58, 1259–1267. [Google Scholar] [CrossRef]


| Parameter | Value | ||
|---|---|---|---|
| D | 0.015 p.u/Hz | ||
| H | 0.075 p.u sec | ||
| 0.05 p.u | |||
| Governor Deadband | ±0.6% | ||
| Machine-1 | Machine-2 | Machine-3 | |
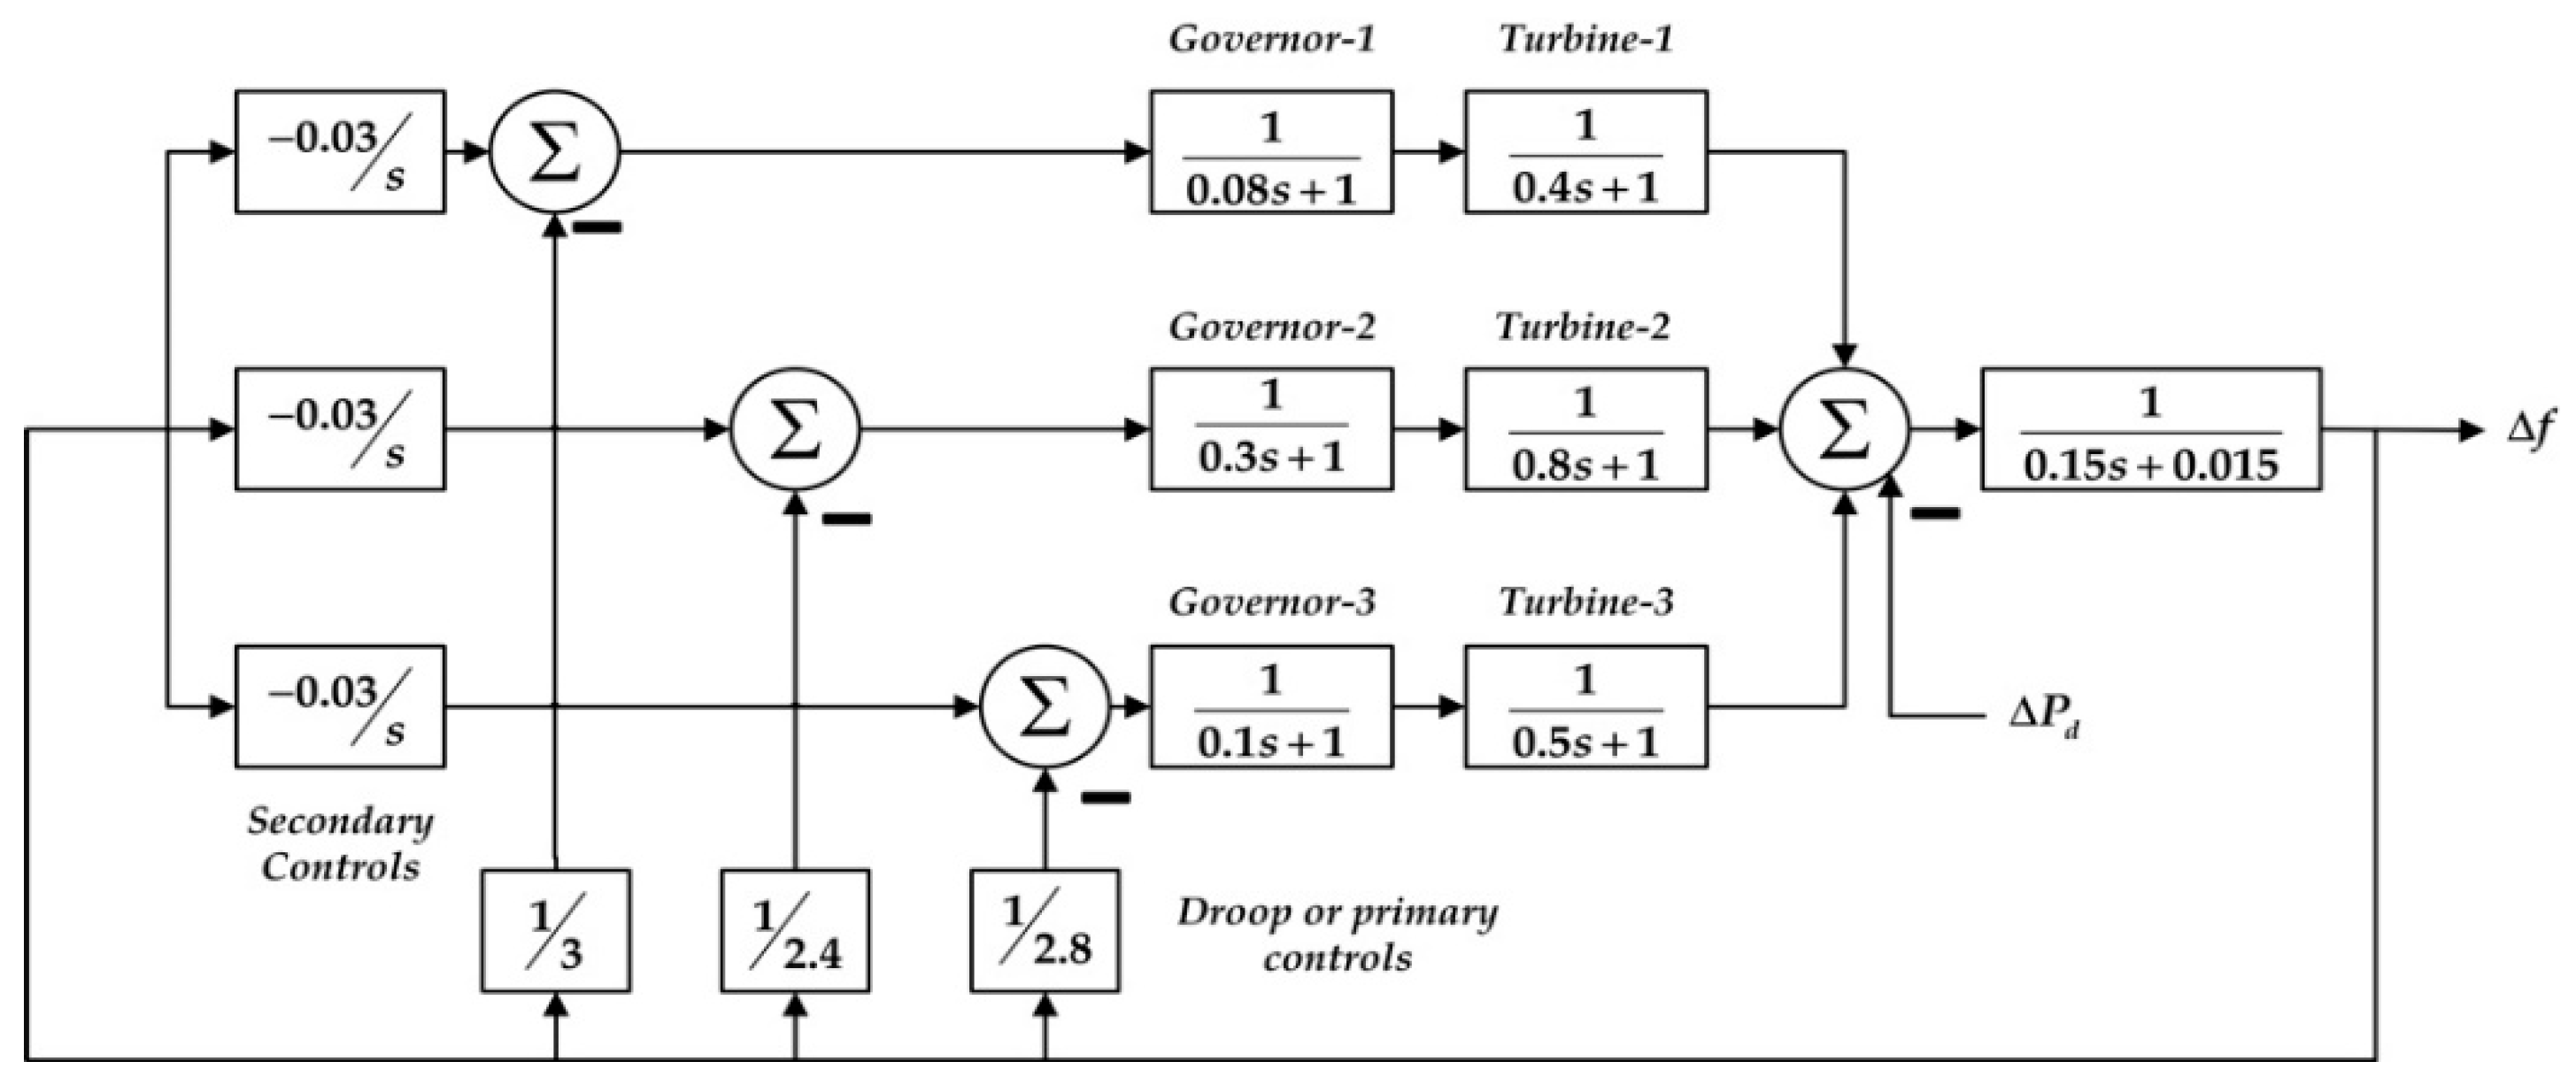
| R | 3 Hz/p.u | 2.4 Hz/p.u | 2.8 Hz/p.u |
| 0.4 sec | 0.8 sec | 0.5 sec | |
| 0.08 sec | 0.3 sec | 0.1 sec | |
| Controller | Transfer function | ||
| Single Machine | Case | A1 | A2 | A3 | A4 |
| Description | Machine 1 | Machine 2 | Machine 3 | ||
| Multi-machine | Case | B1 | B2 | B3 | B4 |
| Description | Machine 1,2 | Machine 1,3 | Machine 2,3 | Machine 1,2,3 | |
| Single machine with DR | Case | C1 | C2 | C3 | C4 |
| Description | |||||
| Multi-machine with DR | Case | D1 | D2 | D3 | D4 |
| Description | |||||
| Single machine with BESS | Case | E1 | E2 | E3 | E4 |
| Description | |||||
| Multi-machine with BESS | Case | F1 | F2 | F3 | F4 |
| Description | |||||
| Single machine with DR, BESS | Case | G1 | G2 | G3 | G4 |
| Description | |||||
| Multi-machine with DR, BESS | Case | H1 | H2 | H3 | H4 |
| Description |
© 2019 by the authors. Licensee MDPI, Basel, Switzerland. This article is an open access article distributed under the terms and conditions of the Creative Commons Attribution (CC BY) license (http://creativecommons.org/licenses/by/4.0/).
Share and Cite
Saeed Uz Zaman, M.; Haider, R.; Bukhari, S.B.A.; Ashraf, H.M.; Kim, C.-H. Impacts of Responsive Loads and Energy Storage System on Frequency Response of a Multi-Machine Power System. Machines 2019, 7, 34. https://doi.org/10.3390/machines7020034
Saeed Uz Zaman M, Haider R, Bukhari SBA, Ashraf HM, Kim C-H. Impacts of Responsive Loads and Energy Storage System on Frequency Response of a Multi-Machine Power System. Machines. 2019; 7(2):34. https://doi.org/10.3390/machines7020034
Chicago/Turabian StyleSaeed Uz Zaman, Muhammad, Raza Haider, Syed Basit Ali Bukhari, Hafiz Muhammad Ashraf, and Chul-Hwan Kim. 2019. "Impacts of Responsive Loads and Energy Storage System on Frequency Response of a Multi-Machine Power System" Machines 7, no. 2: 34. https://doi.org/10.3390/machines7020034
APA StyleSaeed Uz Zaman, M., Haider, R., Bukhari, S. B. A., Ashraf, H. M., & Kim, C.-H. (2019). Impacts of Responsive Loads and Energy Storage System on Frequency Response of a Multi-Machine Power System. Machines, 7(2), 34. https://doi.org/10.3390/machines7020034