Article

Development of a Delamination Fatigue Testing Machine for Composite Materials

by
António B. Pereira
1,*,
Fábio A.O. Fernandes
1,
Alfredo B. de Morais
2 and
Pedro Carvalhoso
1
1
TEMA - Centre for Mechanical Technology and Automation, Department of Mechanical Engineering, University of Aveiro, Campus de Santiago, 3810-193 Aveiro, Portugal
2
University of Aveiro, Department of Mechanical Engineering, RISCO Research Unit, Campus Santiago, 3810-193 Aveiro, Portugal
*
Author to whom correspondence should be addressed.
Machines 2019, 7(2), 27; https://doi.org/10.3390/machines7020027
Submission received: 11 March 2019 / Revised: 7 April 2019 / Accepted: 18 April 2019 / Published: 21 April 2019

Abstract

:
Experimental studies on fatigue behavior are usually conducted on servo-hydraulic testing machines that are expensive and have high maintenance costs. In this work, a much simpler testing machine was developed, intended mainly for delamination fatigue tests on composite materials. After a literature review on the methods and parameters of such tests, the machine was designed, and its parts manufactured and assembled into a fully operational testing machine. Additionally, the electrical components and the control and data acquisition software were also developed and implemented. Finally, several mode II delamination fatigue tests were conducted using the end-notched flexure test. The results were consistent with the well-known Paris law, which for composite materials relates the crack propagation rate to the strain-energy release rate range. Therefore, the developed machine seems to be an excellent alternative to the highly costly testing machines.

1. Introduction

High-performance composite materials are nowadays used in a wide range of structural applications, being a consolidated alternative to metals [1]. In addition to their excellent mechanical properties and low specific weight, polymer matrix composites enable a more flexible design stage relative to conventional materials. It is also possible to manufacture complex shapes in a wide range of dimensions. These advantages have led to increased applications in various industries, such as aeronautical, automotive, and sports [2]. However, in high-performance laminated composites, layers may separate, a failure mode that is known as delamination.
Delamination occurs mainly due to the low strength of the thin resin layer that binds the laminate layers [1,2]. In addition, delamination occurs preferentially in regions with significant interlaminar stresses, especially between layers with different orientations. Delamination may also occur due to transverse cracks in the layers. Delamination resistance is analyzed in the scope of fracture mechanics. Accordingly, there are three pure modes of delamination (j = I, II, III), which are characterized by critical strain-energy release rates Gjc [3] measured in different tests [4].
Fatigue testing involves the application of cyclic loads below the strength of materials. Such loads cause the formation and propagation of damage, which, in the end, can promote failure. In homogeneous and isotropic materials, fatigue failure is usually dictated by the initiation and propagation of a single crack, while in composite materials there is an accumulation of different types of damage, e.g., transverse cracking, delamination, and longitudinal cracking. Nevertheless, delamination under fatigue has been considered relevant enough to warrant specific testing procedures. In fact, delamination under fatigue loading has been the subject of several studies [4,5,6,7,8,9,10,11,12,13]. In those studies, cyclic loads have been applied to specimens adopted by the standards for fracture toughness testing.
Fatigue testing is a time-consuming procedure, which often requires long periods of continuous testing, and gives rise to costly experimental programs. Therefore, it is of considerable interest to have dedicated low-cost machines for fatigue testing. For example, McAlorum et al. [13] recently developed a low-cost small-scale machine (25 kN) for the custom fatigue testing of structural beams. The authors carried out an analysis comparing the costs of a dedicated machine with those of outsourcing. The results indicated that the custom machine was the preferred option for long-term testing of at least 373 h.
The development of several fatigue testing machines (FTMs) has been developed and reported in the literature, e.g., the closed loop servo-hydraulic FTM developed by Lee [14]. This testing machine consists of a structural bending load frame, a structural torsion load frame, a hydraulic system, and a control system. The hydraulic system allows bending loadings up to 490 kN. Such value makes this machine appropriate for large-scale testing, but there are high costs involved. Therefore, FTMs are typically designed for lower loading capacities, unless the specificity of the test and the lack of standard equipment justify custom-made solutions. More recently, Pach et al. [15] developed an FTM in order to study the fatigue behavior of fibre-reinforced polymer (FRP) composites under constant amplitude load-cycles and a wide range of load ratios. Pach et al. [15] highlighted the need for conducting the tests at low frequencies, in order to avoid temperature rises resulting from viscoelastic dissipation of the polymer matrix. Consequently, the test programs demand much more time than those involving metals. In contrast to Lee [14], Pach et al. [15] also adopted a low-cost solution instead of conventional servo-hydraulic testing machines. The approach consisted of applying axial loads (10 kN max) by using an “seesaw” motion created by a set of helical springs compressed by an electric motor driven mechanism [16]. Nevertheless, some design problems were identified, such as lack of correct grip [16]. Vincent et al. [16] designed a much simpler FTM based on an electric motor drive. However, this simple and low-capacity solution was very limited in terms of maximum load (300 N). This is a significant constraint for fatigue testing of composites.
This paper describes a fatigue testing machine (FTM) developed for fatigue testing of composite materials. Its main advantages are the low costs and easy adaptability to the standard delamination test specimens.

2. Materials and Methods

2.1. Fatigue Testing Machine

The machine overall 3D drawing is shown in Figure 1. Basically, it consists of a rigid frame and a movable cross-head. The rigid frame has a top and a bottom table, which are connected to each other by four support rods, while the movable cross-head is driven by two sets of nut/spindle (TR24 × 5) along a maximum 600 mm course. The two spindles that drive the cross-head are mounted and connected to the machine tables by means of bearings. One of the spindles is coupled to the stepper motor. The other spindle is simultaneously driven by a timing-belt transmission. To adjust the belt tension, there is also a stretcher mounted on the machine’s top table. The gear ratio between the motor and the spindles is 1:1. The load cell bolted to the movable crosshead allows the attachment of loading rigs needed for various types of tests. The lower table has a 300 mm wide open workspace and can accommodate various types of fixtures.
In the design of the FTM, a BSHB3913-H hybrid stepper motor was chosen [17]. Hybrid motors have high precision and high torque, and can be configured for small angles. Stepper motors are useful in applications with accurate incremental actions [18].
Regarding the load cell, a Ningbo Xinlan XL 8111 with 10 kN capacity was used. This is an S-type tensile/compression load cell. The load cell support system made of a nonconductive thermoplastic was machined in a Mikron VCE 500 CNC machine centre. Other parts of the FTM were also machined in this centre.
A DM3522M driver [17] was used to power the stepper motor of the FTM. The driver’s main purpose is to amplify the current received from the microcontroller (Arduino Uno Rev3 based on the ATmega328) that controls the motor. In addition, the driver’s characteristics make it easier to control the rotor [17]. The driver has a built-in panel to program parameters, such as micro or single step, number of steps per rotation, and direction of rotation, among others.
The power and amplification of the signal from the load cell were carried out by an integrated circuit, model INA 125 [19]. This model is a low-power, high-accuracy instrumentation amplifier with a precision voltage reference.
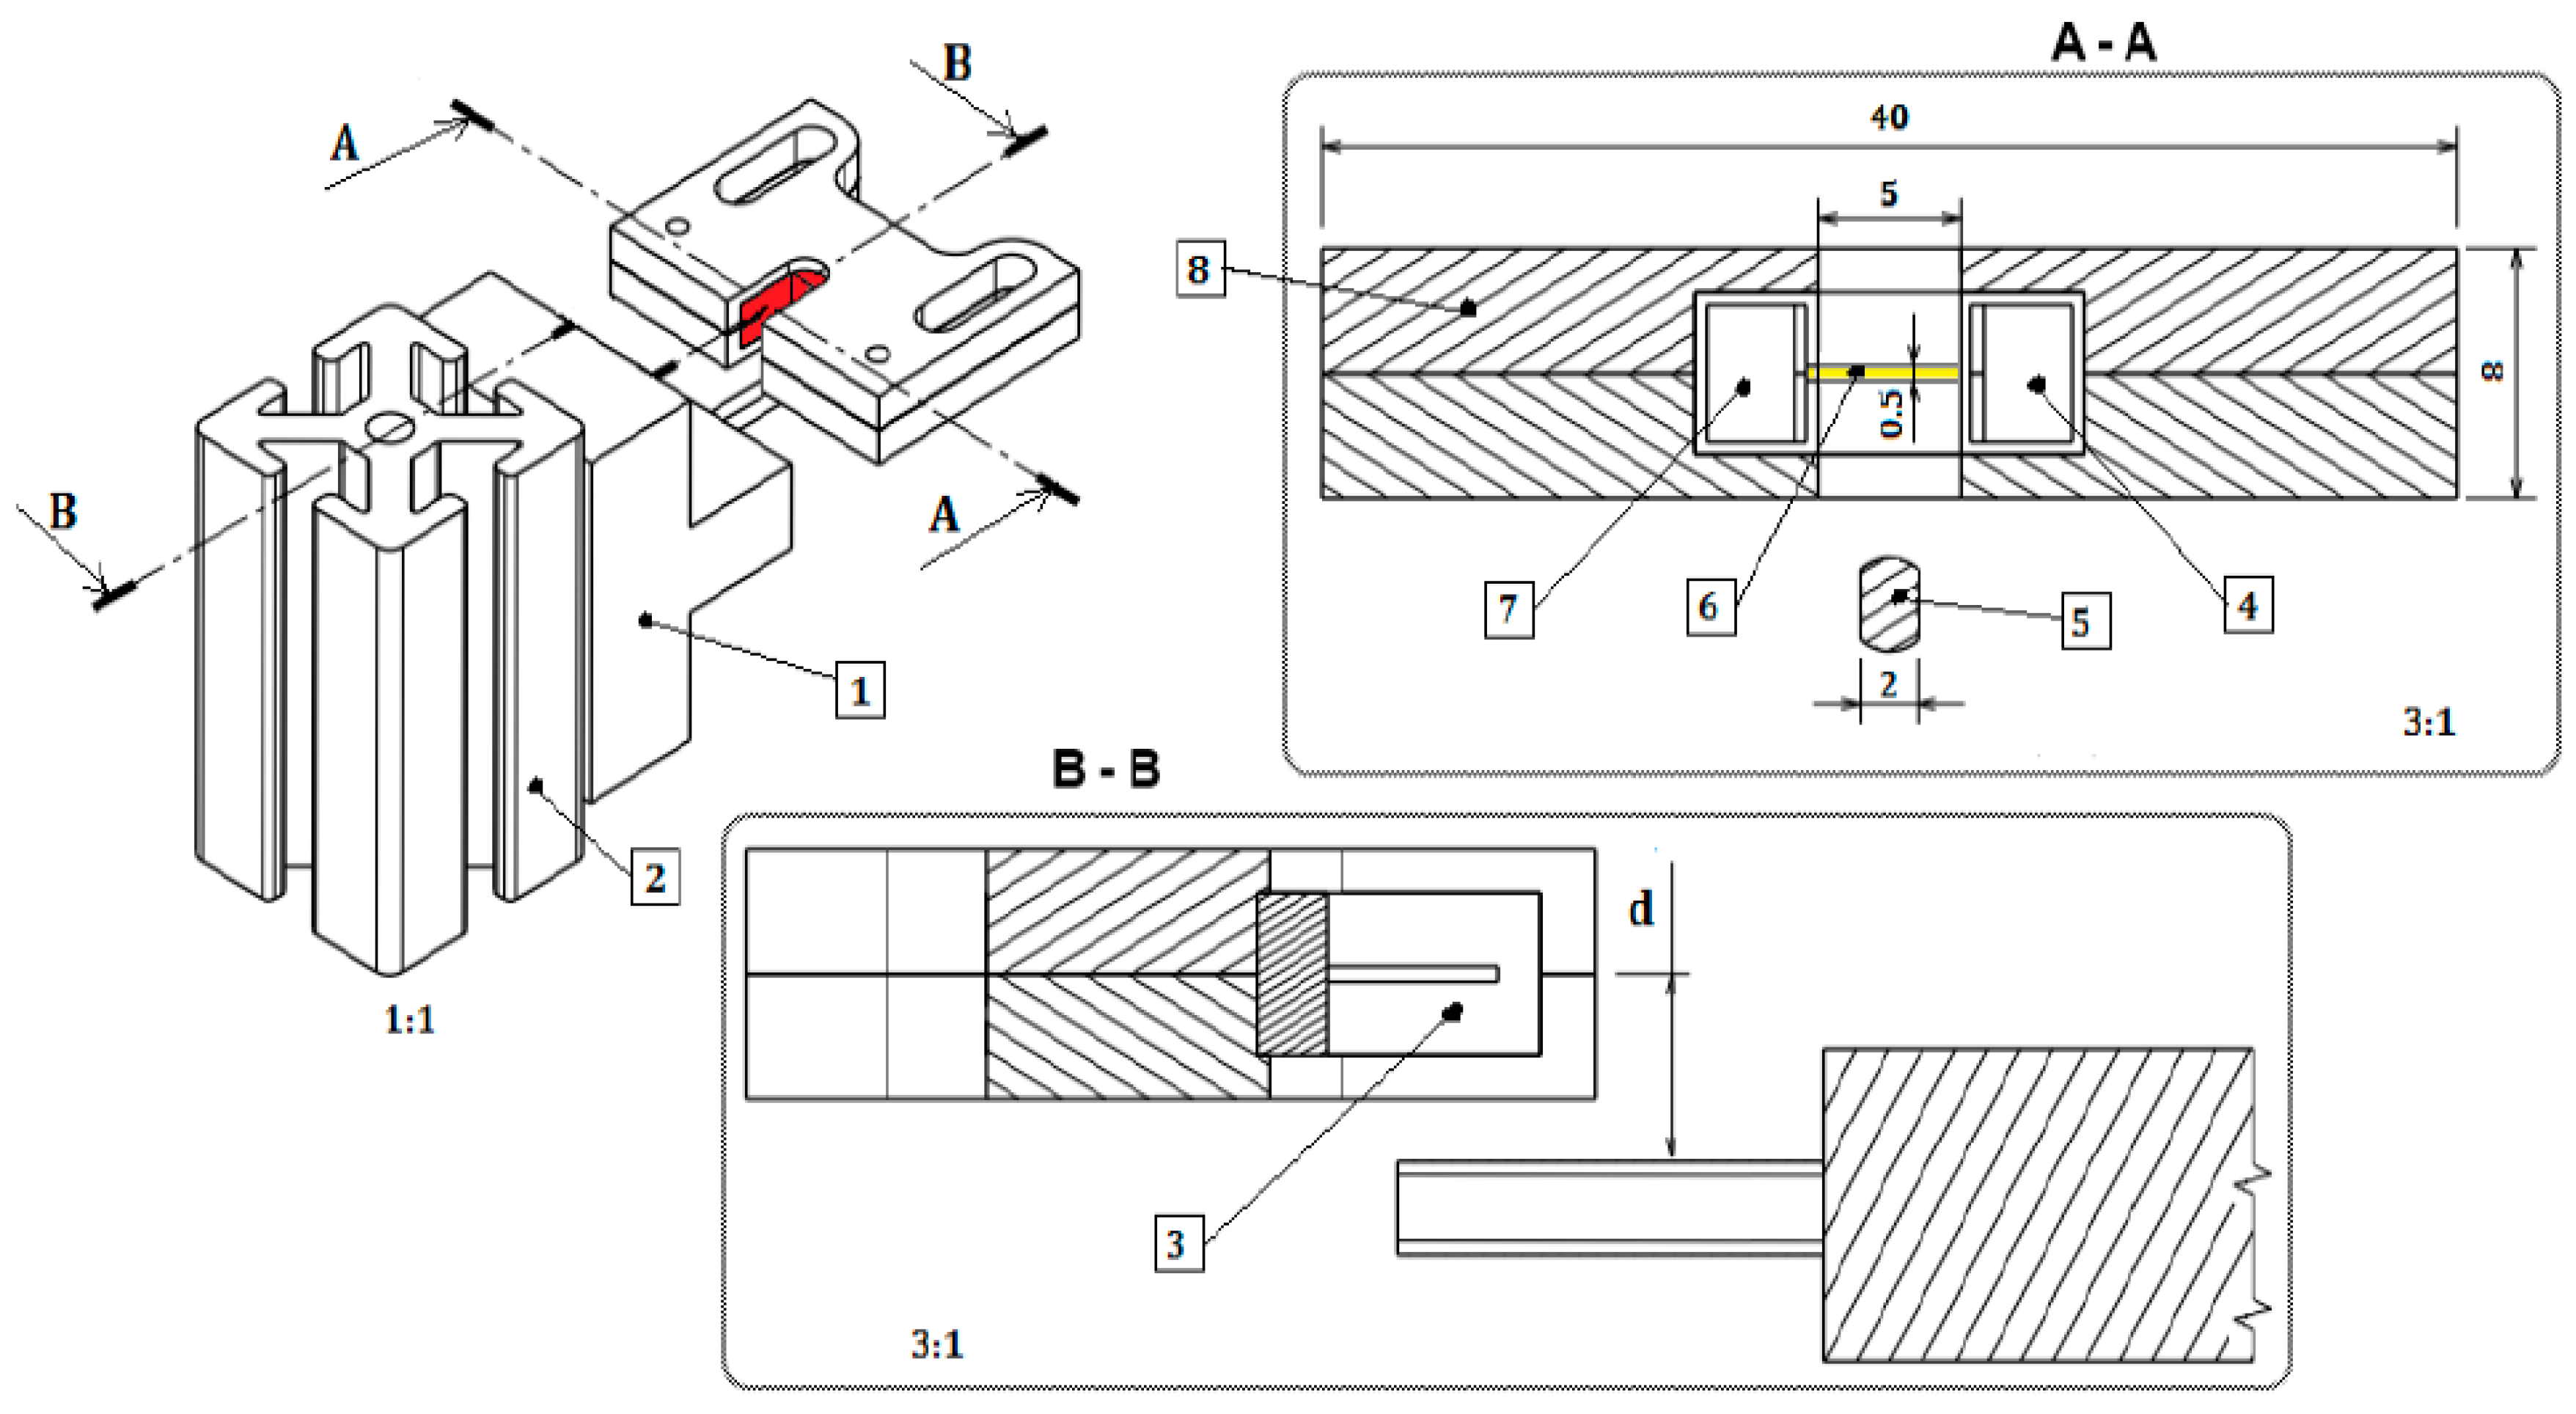
To correct any possible errors in the number of steps of each cycle, a Sharp GP1S53V000F sensor was used to evaluate and correct any loss of steps. This sensor was employed instead of other systems such as encoders, because it is a cheaper and easier solution to implement. This sensor has an infrared light-emitting diode (LED) and a phototransistor detector. It was placed in a housing attached to the movable beam, as shown in Figure 2. This adjustable system is connected to an aluminum beam, which is rigidly connected to the tables.
Figure 3 shows schematically the FTM’s main components and electrical connections. The control can be divided into two main sectors: a first sector with Arduino, driver, stepper motor, and sensor; and a second sector with the power supply, load cell, and amplifier. In the first sector, the computer with the control software sends via USB input to Arduino, which processes the commands and transmits to the driver the operation sequence of the stepper motor. The zero sensor sends to the Arduino the maximum and minimum values, adjusting them in the case of missing steps. In the second sector, the load cell is powered with 10 V. The data sent from the load cell to the Arduino are amplified by the INA125 instrumentation amplifier. These data are sent to the computer by the Arduino, displaying it graphically by another routine developed in Processing 1.5.1 and recording it in a text file for later processing. All cables from the load cell, sensor, and Arduino were connected to an electrical panel, which includes buttons to rotate the engine in a specific direction, a switch for manual/automatic control, a speed control potentiometer, and an emergency button. Additionally, ground connections were created for the machine’s structure and electric circuit.
In the first measurements, significant noise was detected. A GoldStar Oscilloscope OS-9020A 20 MHz showed that the noise was caused essentially by the stepper motor and, to a lesser extent, by the driver. The noise was of the order of 1 V and had a low frequency. In order to reduce noise to acceptable levels, shielded cables were used to insulate against electromagnetic interference. Additionally, a low-pass filter was used between the load cell and the INA125 instrumentation amplifier.
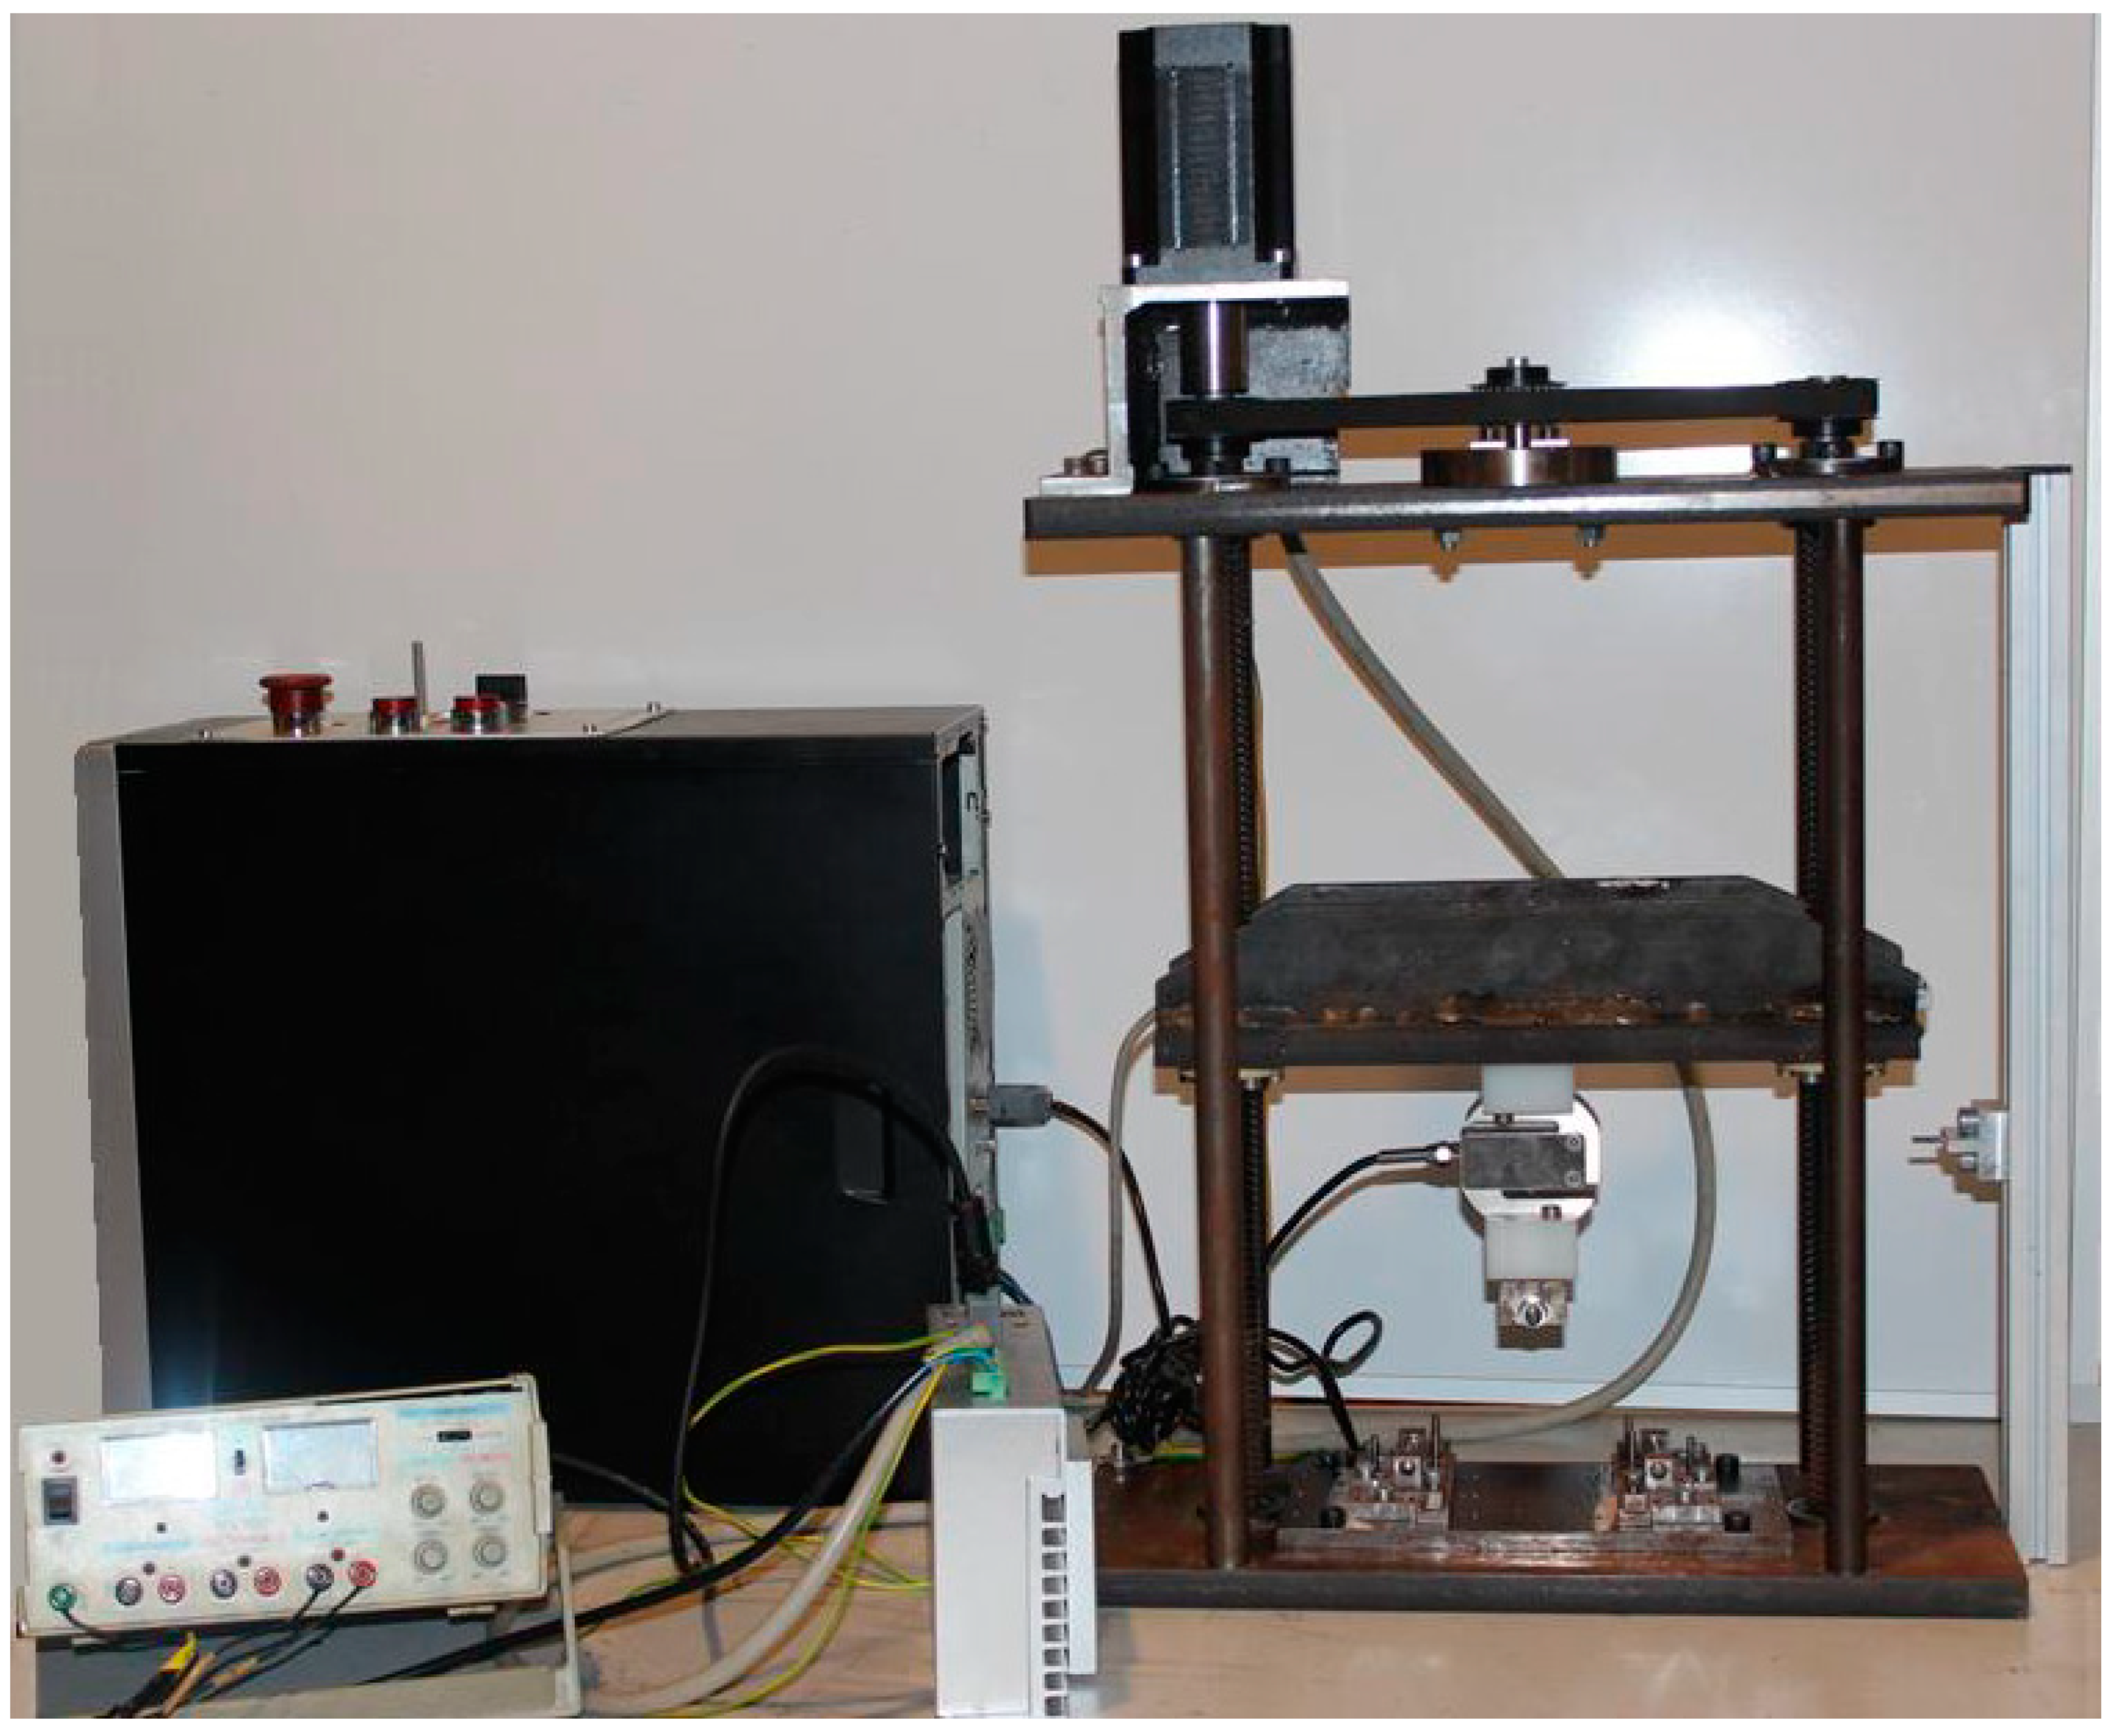
Finally, the load cell was successfully calibrated in a Shimadzu AG 50 kN testing machine. A maximum load of 1 kN was used for calibration, since this value was above the maximum load expected in mode II fatigue tests. Figure 4 shows the completely assembled FTM. Table 1 presents the key performance parameters of the FTM developed in this work, comparing it with traditional ones.
As seen in Table 1, the FTM has the high accuracy levels needed for fatigue tests on composite materials. Its results were validated by using simultaneously with Arduino the NI CDAQ-9178 data acquisition board, manufactured by National Instruments (mV precision). This equipment is typically used for highly precise measurements, and thus was employed for calibration of the FTM measurement systems. It is also worth mentioning that the closed circuit used for the stepper motor and the zero sensor enables precise control of the displacement. In addition, the machine compliance was measured and taken into account when imposing or computing displacements.
The fatigue strength of the FTM components experiencing significant stress levels was carefully approached during the design process. Nevertheless, bearings and timing belt will have to be replaced in due time, which depends on the recorded usage.
After the aforementioned calibrations and validations, the mode II fatigue delamination tests described below provided further assessment of the FTM performance and practical usefulness.

2.2. Mode II Fatigue Delamination

The first application of the developed testing machine concerned the mode II fatigue delamination of a carbon/epoxy material. Considerable research has been reported on this issue, especially on measurement and modeling of crack propagation rates [8,20]. The main goal of the experimental work conducted was precisely to measure crack propagation rates within the framework of the well-known Paris law [21], which relates the crack propagation rate to the stress intensity factor range ΔK. Actually, strain-energy release rates G are used for characterizing delamination resistance of composites, and thus, in the scope of mode II loadings, Paris law has been expressed as
d a d N = D ( Δ G II ) m ,
where a is the crack length, N the number of load cycles, ΔGII the strain-energy release rate range, and D and m empirical parameters. Nevertheless, it is well known that GII = ψ(KII)2, where ψ is a function of the material elastic constants. Therefore, in order to ensure the correctness of loading superposition and similitude with ΔK of the original Paris law, one should define ΔGII = (√GIImax − √GIImin)2 [20]. The comprehensive review by Pascoe et al. [21] showed that such definition of ΔG provides more consistent results.
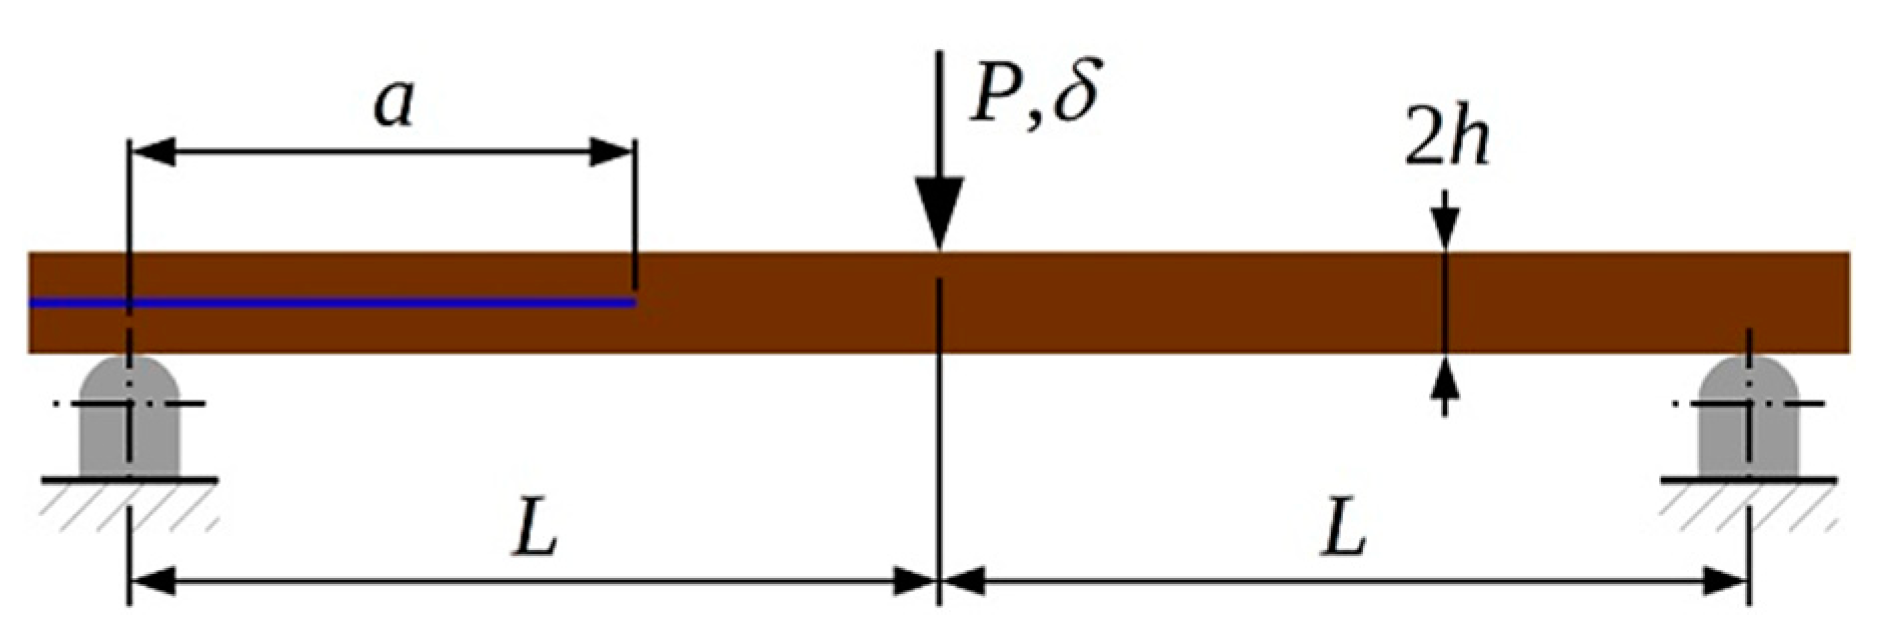
Unidirectional specimens were prepared from a high-strength carbon fiber (T300)/toughened epoxy Pre-preg (reference HS160REM) supplied by Seal. The specimen preparation procedures adopted are detailed in previous studies [22], in which the main elastic properties were found to have the following average values: longitudinal Young’s modulus E1 = 130 GPa, transverse Young’s modulus E2 = 8.2 GPa, in-plane shear modulus G12 = 4.1 GPa, and longitudinal Poisson’s ratio ν12 = 0.27. The mode II test selected was the well-known end-notched flexure (ENF) (Figure 5). The specimens had nominal thickness 2h = 3 mm, width b = 20 mm, and a starter delamination created by a 13 μm thick polytetrafluoroethylene (PTFE) insert. In order to check that no spurious dynamic, friction, or specimen sliding effects were relevant, two combinations of starter crack length (a0) and span (2L) were used: a0 = 40 mm, 2L = 125 mm; and a0 = 32 mm, 2L = 100 mm. The total length of the specimens was 200 mm, so that several tests could be carried out on each specimen: a first quasi-static test to measure the critical strain-energy release rate GIIc, fatigue tests, and a final quasi-static test.
The data reduction method employed was the effective crack method (ECM) in the form presented in [22,23]. It consists of computing an effective crack length
a e = 8 E 1 bh 3 C f 2 L 3 3 3
from experimental values of the longitudinal flexural modulus E1 and specimen flexural compliance Cf. The latter is obtained by discounting the contribution of transverse shear to the total experimental compliance C by
C f = C 3 L 10 G 13 b h
where G13 is the through-thickness shear modulus. The strain-energy release rate is then obtained from
G II = 9 P 2 a e 2 16 b 2 E 1 h 3
As discussed in [22], the main advantages of the ECM are twofold: simplicity, since it avoids the crack length monitoring known to be particularly difficult in mode II tests; and accuracy, as it intrinsically takes into account the extensive Fracture Process Zone (FPZ) associated to mode II delamination [24]. Under steady-state crack propagation conditions, the FPZ remains constant and thus dae/dNda/dN. On the other hand, during the initial stages of quasi-static and fatigue tests, the ECM is unable to distinguish FPZ formation from actual crack propagation. Therefore, in quasi-static tests, GIIc was defined at the plateau of the GII-ae curves. Similarly, the GII-dae/dN data for the first Δae values were discarded, which also avoided the effects of the previous test the specimens had undergone. Evidently, this approach demanded that fatigue damage was confined to the close vicinity of the crack tip. As seen below, the results proved that this hypothesis was valid.
Fatigue tests were carried out at a low 2 Hz test frequency in order to avoid viscoelastic effects. Displacement control was adopted rather than load control, which in the ENF specimen would lead to very fast crack propagation and produce very few data points. The stress ratio R = δmin/δmax was varied from 0.26–0.36, while GIImax/GIIc = 0.32–0.66, so that tests were not excessively long, e.g., typically around 105 cycles. Another advantage of displacement control was that GIImin and GIImax varied mildly with crack propagation, i.e., less than 3% for a Δae = 1 mm increment, except very close (2 mm) to the load-point, a region that the crack should not be allowed to reach. This enabled a very robust evaluation of dae/dN, which is particularly important, given the unavoidable noise in raw data.

3. Results

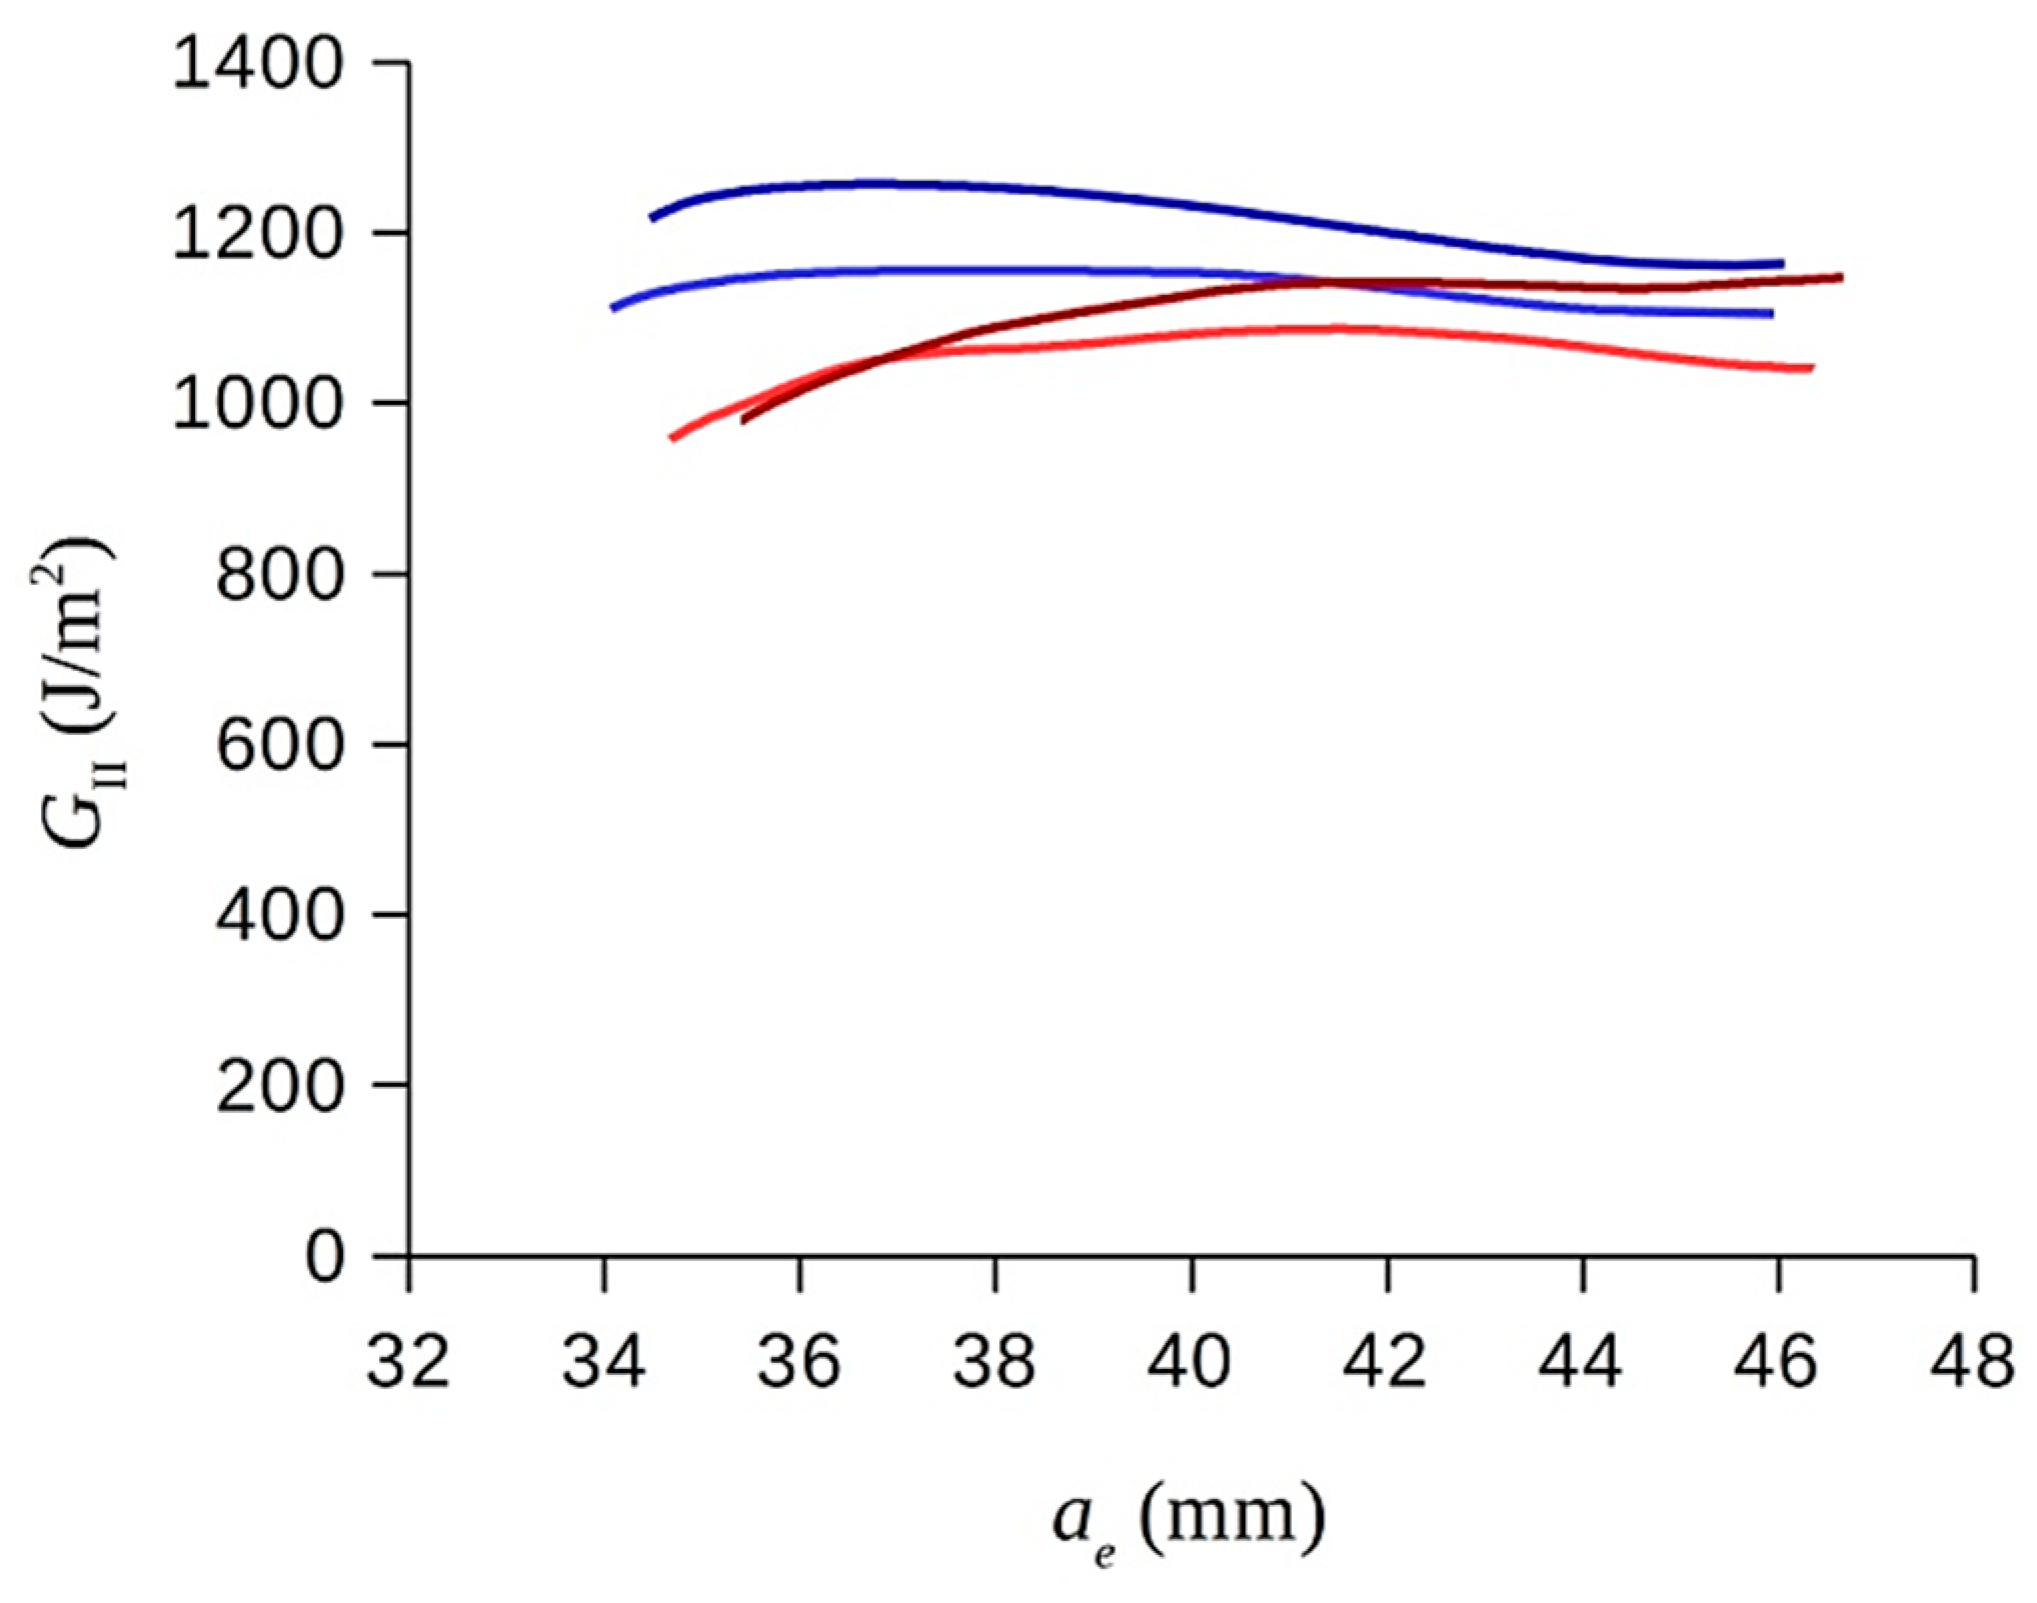
In order to verify the correct functioning and accuracy of the developed FTM, an experimental study was carried out on mode II delamination. Figure 6 depicts typical GII-ae curves measured in quasi-static tests. Tests conducted from the insert did not reveal any R-curve effect. In turn, because of fatigue damage, a very mild R-curve was seen in tests conducted from the fatigue pre-crack. Nevertheless, there was no significant difference in the maximum GIIc of specimens tested from the insert (average 1.21 kJ/m2, 6.9% standard deviation) or from the fatigue pre-crack (average 1.12 kJ/m2, 4.5% standard deviation). This shows that fatigue damage was limited to the FPZ and did not affect the other regions of the specimen, thereby supporting the data reduction approach adopted (Section 2.2). In order to take into account the scatter in fracture toughness values, the maximum R-curve plateau GIIc from the fatigue pre-crack was used to normalize fatigue results. The Paris law form adopted was thus
da e dN = D [ ( ( G IImax ) ( G IImin ) ) 2 G IIc ] m
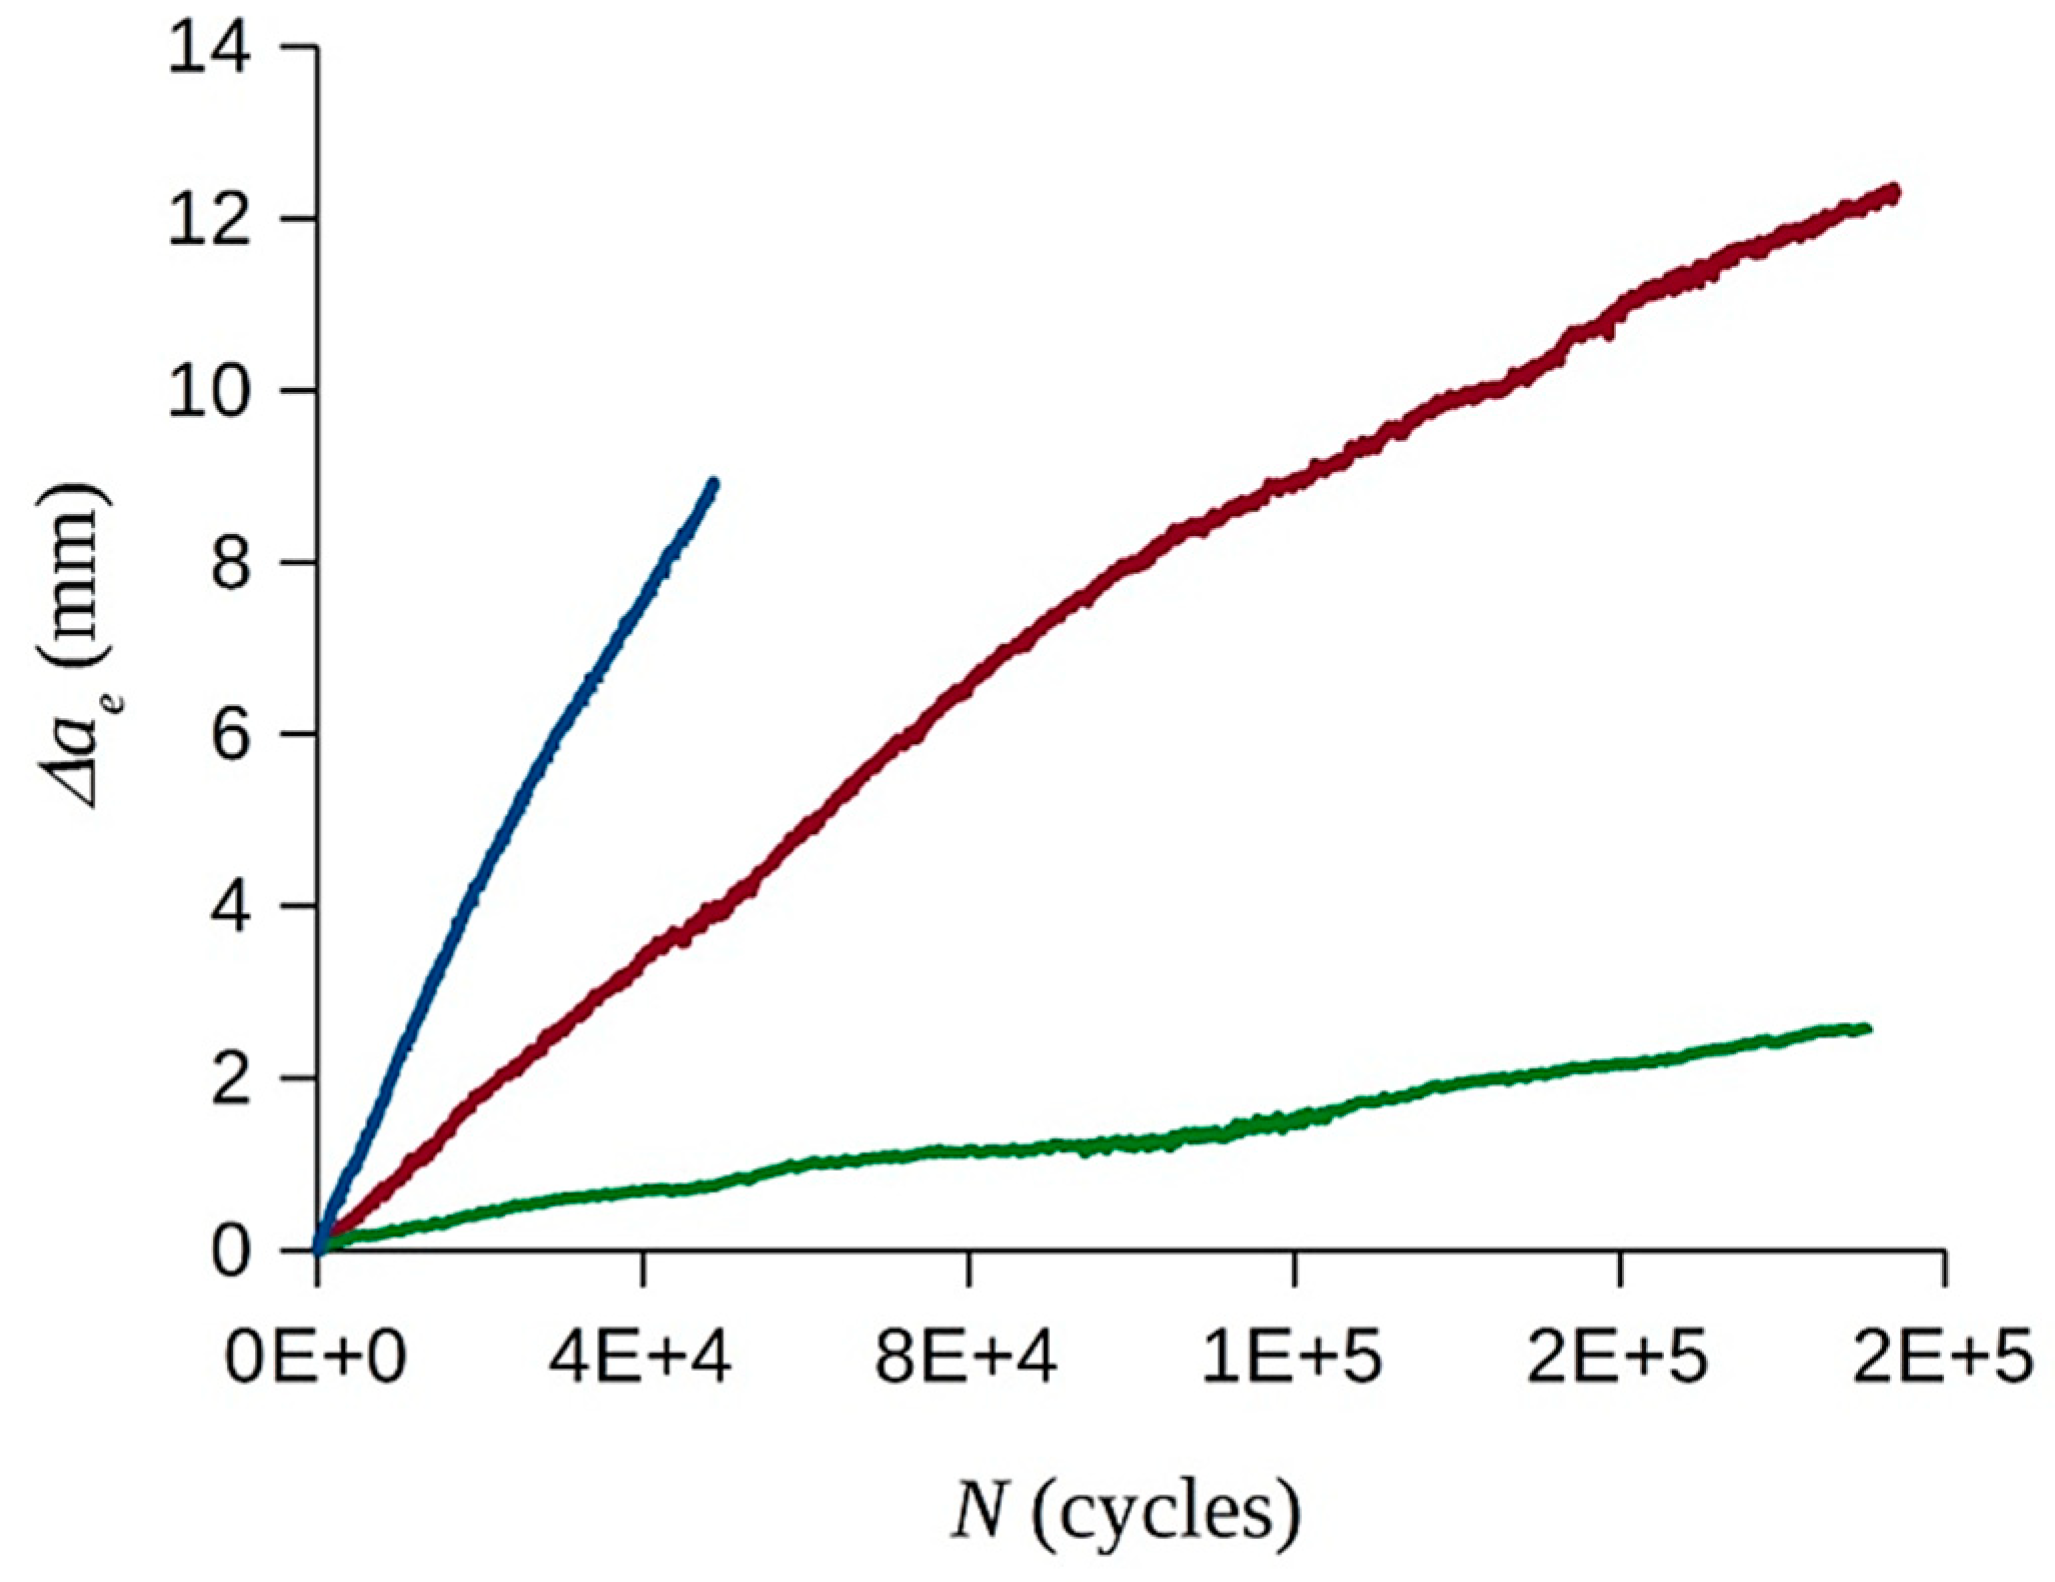
As expected from the aforementioned specimen characteristics, ae versus N plots presented several quasi-linear regions, despite some noise and scatter (Figure 7). In other words, dae/dN remained nearly constant throughout considerable parts of the test, hence favoring the consistency and representativeness of GII-dae/dN data under steady-state propagation. It is worth reminding that, as discussed above, GII-dae/dN data for the first Δae values (typically Δae = 1–1.5 mm) were discarded.
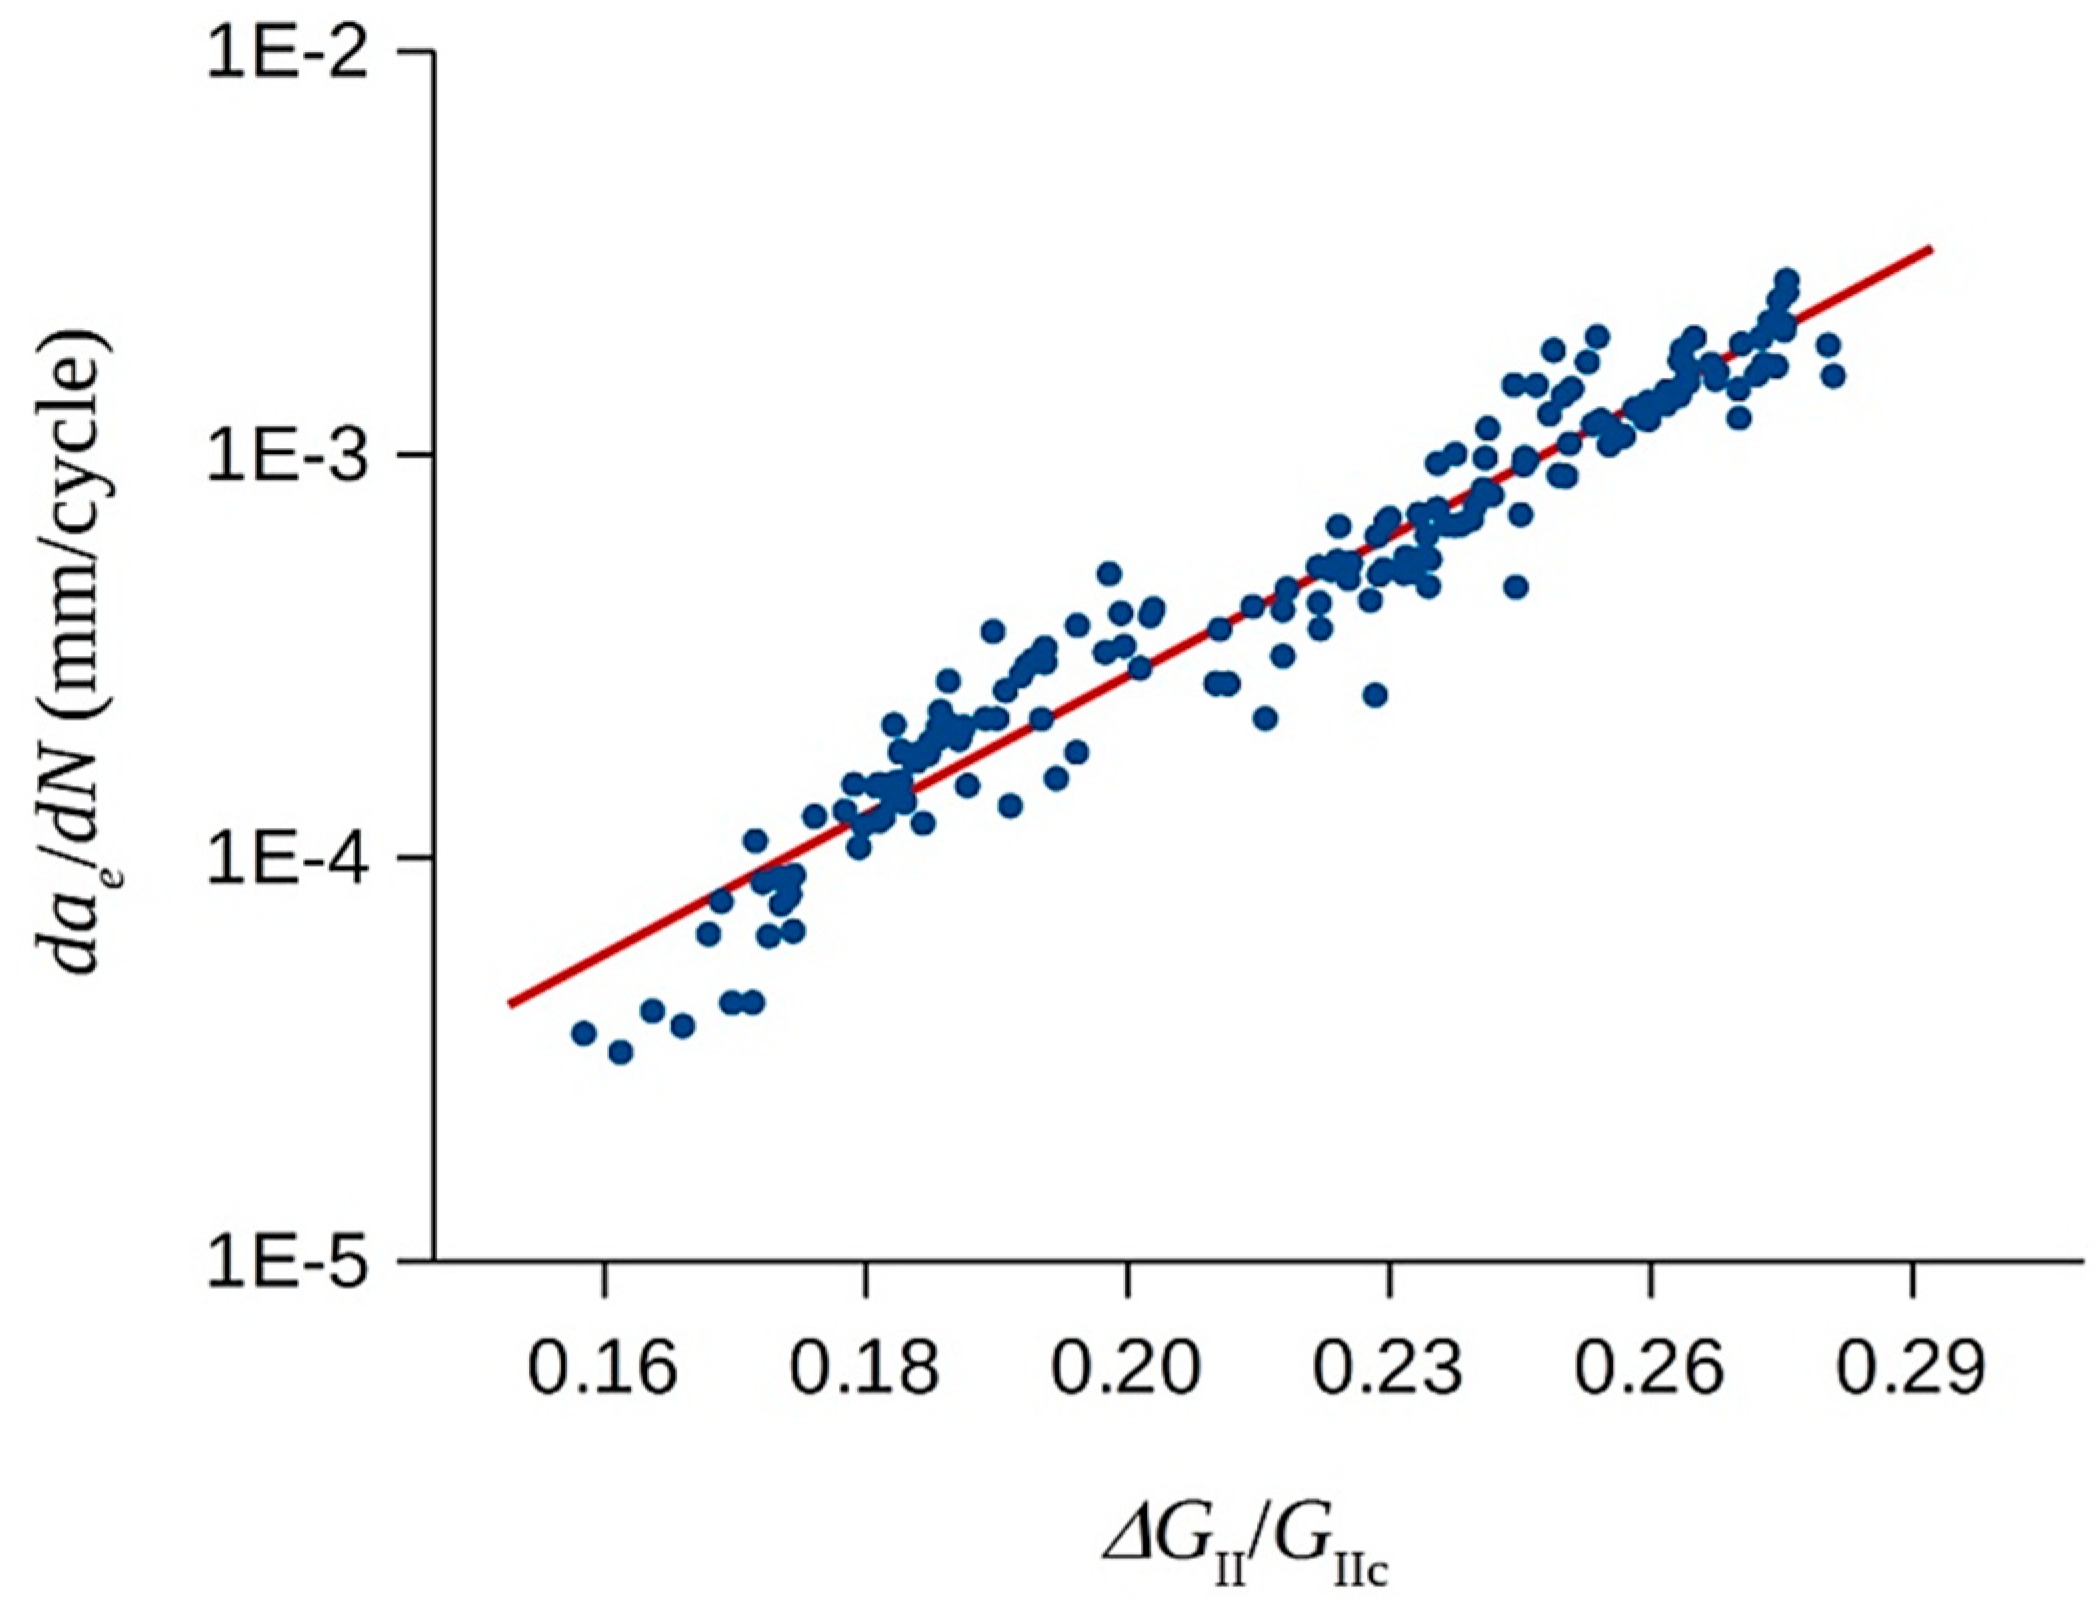
Figure 8 plots dae/dN-ΔGII/GIIc results obtained in all fatigue tests. The experimental results were subsequently very well fitted by Equation (5) with D = 16.7 mm/cycle and m = 6.9, given the high 0.967 correlation coefficient. Moreover, the m = 6.9 of Equation (5) obtained was similar to the values reported in other studies [11,25]. In fact, Matsubara et al. [11] obtained m = 6.5 for a unidirectional glass/epoxy material tested under a stress ratio R = 0.3, which was within the range here adopted. Matsubara et al. [11] employed a form of the Paris law similar to Equation (5), but used the threshold GII range, ΔGIIth, instead of GIIc. Using the ΔGIIth, GIIc, and the Paris law parameters reported in [11], one concludes that, if processed with Equation (5), the results by Matsubara et al. [11] give D = 7.1 mm/cycle. This value is lower than the one measured here, with the obvious explanation being the different materials employed. Tanaka et at. [26] studied the mode II fatigue delamination of a unidirectional carbon/epoxy material under different R-ratios. They [26] adopted the original form of the Paris law, i.e., they used Equation (1) with ΔKII instead of ΔGII. Considering that ΔGII = ψ(ΔKII)2 when ΔGII = (√GIImax − √GIImin)2, we conclude that Equation (5) applied to the R = 0.2–0.5 results of Tanaka et al. [26] yields m = 6–9.5, an interval where the present m = 6.9 fits quite well. Moreover, using the ΔKIIth and KIIc measured in [26], one finds that Equation (5) gives D = 2.8–393 mm/cycle, an interval which, again, includes the present D value.
A broader scope study of the mode II fatigue delamination of the carbon/epoxy composites can be found in [27]. Here, it is important to stress out that the testing machine developed proved to be suitable for mode II delamination fatigue testing of composites.

4. Conclusions

The present work presents the entire development of a fully operational FTM, including its control and data acquisition software. The design, assembly, control system, and software for test data acquisition are also described. The solution here presented is simple, robust, and has low manufacturing and maintenance cost, especially when compared to servo-hydraulic testing machines. Moreover, it has a significant loading capacity relative to other similar machines described in the literature.
Additionally, in order to assess the performance of the FTM, several mode II delamination fatigue tests were conducted. The results were consistent with the well-known Paris law and compared favorably with results available in the literature, thereby confirming the suitability and usefulness of the FTM. Preliminary work devoted to mode I fatigue has already been carried out with the FTM, confirming its advantageous characteristics.

Author Contributions

Conceptualization, A.B.P., F.A.O.F., A.B.M., and P.C.; methodology, A.B.P., F.A.O.F., A.B.M., and P.C.; software, A.B.P., F.A.O.F., A.B.M., and P.C.; validation, A.B.P., F.A.O.F., A.B.M., and P.C.; formal analysis, A.B.P., F.A.O.F., A.B.M., and P.C.; investigation, A.B.P., F.A.O.F., A.B.M., and P.C.; resources, A.B.P., F.A.O.F., A.B.M., and P.C.; data curation, A.B.P., F.A.O.F., A.B.M., and P.C.; writing—original draft preparation, A.B.P., F.A.O.F., A.B.M., and P.C.; writing—review and editing, A.B.P., F.A.O.F., A.B.M., and P.C.; visualization, A.B.P., F.A.O.F., A.B.M., and P.C.; supervision, A.B.P., F.A.O.F., A.B.M., and P.C.; project administration, A.B.P., F.A.O.F., A.B.M., and P.C.; funding acquisition, A.B.P.

Funding

This research was funded by Fundação para a Ciência e a Tecnologia (FCT): UID/EMS/00481/2013-FCT and CENTRO-01-0145-FEDER-022083.

Acknowledgments

Fundação para a Ciência e a Tecnologia (FCT): CEECIND/01192/2017.

Conflicts of Interest

The authors declare no conflict of interest.

References

  1. Chung, D.D.L. Composite Materials; Springer: London, UK, 2010; ISBN 978-1-84882-831-5. [Google Scholar]
  2. Gibson, R.F. Principles of Composite Material Mechanics; CRC Press: Boca Raton, FL, USA, 2016; ISBN 9781498720694. [Google Scholar]
  3. Hojo, M.; Ando, T.; Tanaka, M.; Adachi, T.; Ochiai, S.; Endo, Y. Modes I and II interlaminar fracture toughness and fatigue delamination of CF/epoxy laminates with self-same epoxy interleaf. Int. J. Fatigue 2006, 28, 1154–1165. [Google Scholar] [CrossRef]
  4. Brunner, A.J.; Blackman, B.R.K.; Davies, P. Mode I delamination. Eur. Struct. Integr. Soc. 2001, 28, 277–305. [Google Scholar]
  5. Argüelles, A.; Viña, J.; Canteli, A.F.; Bonhomme, J. Fatigue delamination, initiation, and growth, under mode I and II of fracture in a carbon-fiber epoxy composite. Polym. Compos. 2009. [Google Scholar] [CrossRef]
  6. Beghini, M.; Bertini, L.; Forte, P. Experimental investigation on the influence of crack front to fiber orientation on fatigue delamination growth rate under mode II. Compos. Sci. Technol. 2006, 66, 240–247. [Google Scholar] [CrossRef]
  7. Blanco, N.; Gamstedt, E.K.; Asp, L.E.; Costa, J. Mixed-mode delamination growth in carbon–fibre composite laminates under cyclic loading. Int. J. Solids Struct. 2004, 41, 4219–4235. [Google Scholar] [CrossRef]
  8. Brunner, A.J.; Stelzer, S.; Pinter, G.; Terrasi, G.P. Mode II fatigue delamination resistance of advanced fiber-reinforced polymer–matrix laminates: Towards the development of a standardized test procedure. Int. J. Fatigue 2013, 50, 57–62. [Google Scholar] [CrossRef]
  9. Bureau, M.N.; Perrin, F.; Denault, J.; Dickson, J.I. Interlaminar fatigue crack propagation in continuous glass fiber/polypropylene composites. Int. J. Fatigue 2002, 24, 99–108. [Google Scholar] [CrossRef]
  10. Kenane, M.; Benzeggagh, M.L. Mixed-mode delamination fracture toughness of unidirectional glass/epoxy composites under fatigue loading. Compos. Sci. Technol. 1997, 57, 597–605. [Google Scholar] [CrossRef]
  11. Matsubara, G.; Ono, H.; Tanaka, K. Mode II fatigue crack growth from delamination in unidirectional tape and satin-woven fabric laminates of high strength GFRP. Int. J. Fatigue 2006, 28, 1177–1186. [Google Scholar] [CrossRef]
  12. Shindo, Y.; Takeda, T.; Narita, F.; Saito, N.; Watanabe, S.; Sanada, K. Delamination growth mechanisms in woven glass fiber reinforced polymer composites under Mode II fatigue loading at cryogenic temperatures. Compos. Sci. Technol. 2009, 69, 1904–1911. [Google Scholar] [CrossRef]
  13. Sousa, J.A.; Pereira, A.B.; Martins, A.P.; de Morais, A.B. Mode II fatigue delamination of carbon/epoxy laminates using the end-notched flexure test. Compos. Struct. 2015, 134, 506–512. [Google Scholar] [CrossRef]
  14. McAlorum, J.; Rubert, T.; Fusiek, G.; Niewczas, P.; Zorzi, G.; McAlorum, J.; Rubert, T.; Fusiek, G.; Niewczas, P.; Zorzi, G. Design and Demonstration of a Low-Cost Small-Scale Fatigue Testing Machine for Multi-Purpose Testing of Materials, Sensors and Structures. Machines 2018, 6, 30. [Google Scholar] [CrossRef]
  15. Lee, S.-B. Stress analysis and design for a structural fatigue testing machine. KSME J. 1991, 5, 115–124. [Google Scholar] [CrossRef]
  16. Pach, E.; Korin, I.; Ipiña, J.P. Simple Fatigue Testing Machine for Fiber-Reinforced Polymer Composite. Exp. Tech. 2012, 36, 76–82. [Google Scholar] [CrossRef]
  17. Vincent, M.K.; Varghese, V.; Sukumaran, S. Fabrication and Analysis of Fatigue Testing Machine. Int. J. Eng. Sci. 2016, 5, 15–19. [Google Scholar]
  18. Shenzhen Baishan Mechatronics. 2011. Available online: http://www.bsjd.com (accessed on 17 May 2015).
  19. Rizzoni, G. Principals and Applications of Electrical Engineering; McGraw-Hill: New York, NY, USA, 2004. [Google Scholar]
  20. Burr-Brown Corporation. INA125—Instrumentation Amplifier with Precision Voltage Reference; Burr-Brown Corporation: Tucson, AZ, USA, 1997. [Google Scholar]
  21. Pascoe, J.A.; Alderliesten, R.C.; Benedictus, R. Methods for the prediction of fatigue delamination growth in composites and adhesive bonds—A critical review. Eng. Fract. Mech. 2013, 112–113, 72–96. [Google Scholar] [CrossRef]
  22. Paris, P.; Erdogan, F. A Critical Analysis of Crack Propagation Laws. J. Basic Eng. 1963, 85, 528. [Google Scholar] [CrossRef]
  23. De Morais, A.B.; Pereira, A.B. Application of the effective crack method to mode I and mode II interlaminar fracture of carbon/epoxy unidirectional laminates. Compos. Part A Appl. Sci. Manuf. 2007, 38, 785–794. [Google Scholar] [CrossRef]
  24. De Morais, A.B. Novel cohesive beam model for the End-Notched Flexure (ENF) specimen. Eng. Fract. Mech. 2011, 78, 3017–3029. [Google Scholar] [CrossRef]
  25. O’Brien, T. Composite Interlaminar Shear Fracture Toughness. In Composite Materials: Fatigue and Fracture: 7th Volume; ASTM International: West Conshohocken, PA, USA, 1998; pp. 3–16. [Google Scholar]
  26. Tanaka, K.; Tanaka, H. Stress ratio effect on mode II propagation on interlaminar fatigue cracks in graphite/epoxy composites. In Composite Materials: Fatigue and Fracture; STP 1285; ASTM International: West Conshohocken, PA, USA, 1997; Volume VI, pp. 126–142. [Google Scholar]
  27. Allegri, G.; Jones, M.I.; Wisnom, M.R.; Hallett, S.R. A new semi-empirical model for stress ratio effect on mode II fatigue delamination growth. Compos. Part A Appl. Sci. Manuf. 2011, 42, 733–740. [Google Scholar] [CrossRef]
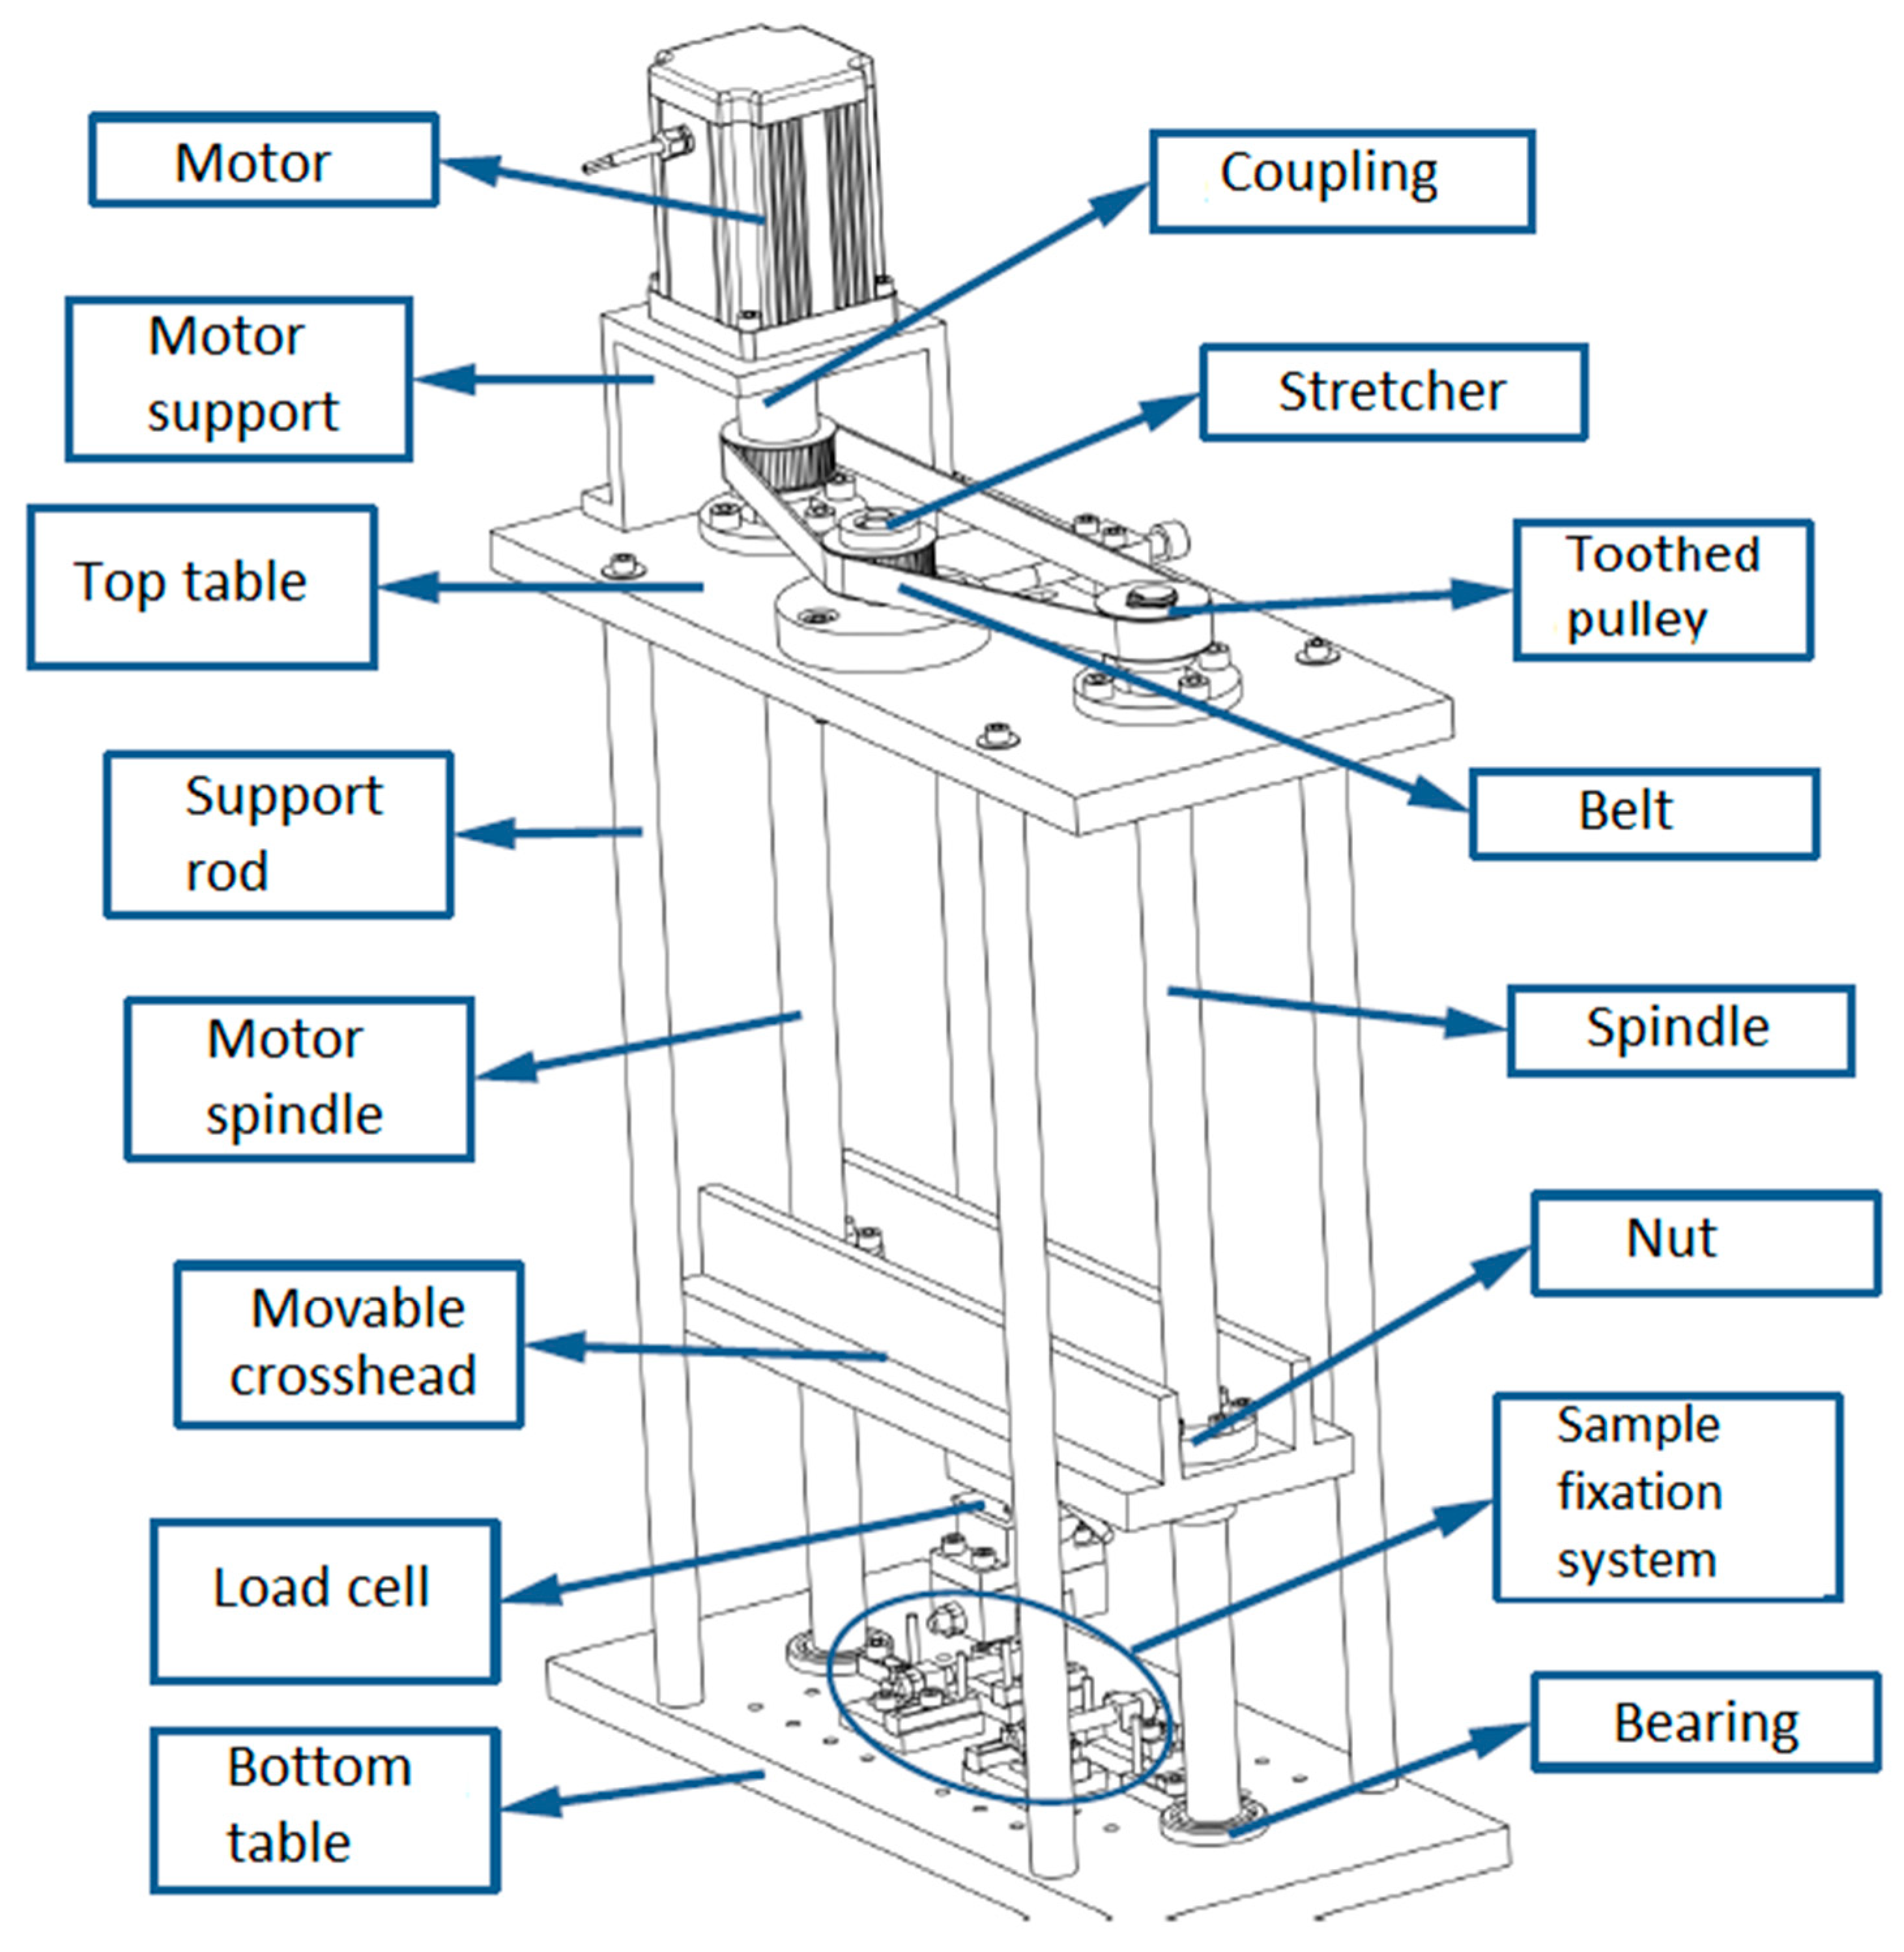
Figure 1. Illustration of the fatigue testing machine.
Machines 07 00027 g001
Figure 2. Illustration of the sensor mounting system ((1) end-pin support; (2) aluminium beam; (3) sensor; (4) transistor; (5) adjustable end-pin, distance d; (6) 0.5 mm beam; (7) light-emitting diode (LED); and (8) housing) [mm].
Machines 07 00027 g002
Figure 3. Scheme of fatigue testing machine (FTM)’s main components and electrical connections.
Machines 07 00027 g003
Figure 4. FTM.
Figure 4. FTM.
Machines 07 00027 g004
Figure 5. Schematic representation of the end-notched flexure (ENF) specimen.
Machines 07 00027 g005
Figure 6. Typical R-curves measured from the insert (blue lines) and fatigue pre-crack (red lines).
Machines 07 00027 g006
Figure 7. Examples of effective crack growth versus the number of load cycles plots.
Machines 07 00027 g007
Figure 8. Effective crack propagation rate versus the strain-energy release rate range experimental data points. The fitting with Paris law-type Equation (5) is also shown.
Machines 07 00027 g008
Table 1. Comparison of key performance parameters between the FTM and traditional machines.
Performance ParametersFTMElectrodynamic (e.g., Electroforce 3330)Hydraulic
Capacity (kN)5 13100
Displacement (mm)600150500
Maximum linear velocity (m/s)0.0122
Displacement resolution (μm)511
Load resolution (N)1 20.010.1
Maximum frequency (Hz)10100100
Weight (kg)5211810000
Cost of 24 h running (electricity - €)0.50 110
Maintenance (€)Grease spindles – 1 € every 106 cyclesAlmost noneGrease, oil – 1000 € every year
Cost of the equipment (k€)1150200
1 A 10 kN load cell was employed, but it is only used up to 5 kN in order to guarantee durability in fatigue cycles; 2 Resolution is dependent on the cell used. For forces in the range of 1 kN, an 8-bit Arduino makes it possible to get 0.98 N.