Abstract
In face milling, the roughness of the machined surface varies due to the movement of the cutting edge. Changes in roughness parameter values in the axis of rotation (symmetry plane) have been examined at a constant depth of cut for symmetrical milling. In this paper, the effect of increasing feed per tooth on the topography of the surface is studied in fly-cutting and in multi-point face milling. The study takes into account the axial run-out of the inserts. Theoretical roughness values were modelled, the real values were tested in experiments and in both cases the impact of the run-out of the cutting edges and the change of the chip cross-section were also taken into account. Based on the performed experiments it can be stated that the accuracy of the introduced roughness prediction method increases with the increase in feed and therefore the application of the method in the case of high-feed milling is particularly effective. The results have also shown that the run-out of the insert significantly effects the roughness of the milled surfaces and therefore the measurement and minimization of these setting errors is essential.
1. Introduction
Increasing the productivity of machining requires more intensive material separation. This can be characterized by increasing both the values of the cutting data (the removed chip cross-sections) and the Material Removal Rate (MRR) and the Surface Rate (SR) values. At the same time, consideration should be given to the rigidity of the Machine/Fixture/Tool/Workpiece (MFTW) system and to the required/expected quality of the machined surface. Among the cutting data, increasing the feed directly affects the material removal rate (MRR) but due to its increased value, the roughness of the machined surfaces may deteriorate, since it primarily determines the height of the roughness peaks on the surface. Therefore, the experimental examination and estimation of the expected roughness characteristics for the machined surface, which may limit the applicable feed values, becomes increasingly important. The relevance of this topic is demonstrated by the fact that many researchers are concerned with the investigation of the roughness of milled surfaces, using different approaches and test methods.
The simplest machining process for modelling surface roughness is turning. Numerous studies deal with the simulation of theoretical roughness in turning, the most recent ones being briefly presented here. He et al. [1] introduced a systematic review of influencing factors and theoretical modelling methods of surface roughness in turning process. They found that the most important factors are the kinematic and dynamic properties of the machine tool, the geometrical parameters of the cutting tool, the properties of the workpiece material and the applied coolant. They have classified these factors as easy and difficult to modelling and the coolant and workpiece material properties belong to the second group. Tomov et al. [2] presented a methodology for modelling and predicting the roughness shape in longitudinal turning that is utilized for both the kinematical-geometrical replication of the cutting tool geometry onto the machined surface and other cutting conditions and factors that are considered a black box—the latter include mechanical properties, thermal preparation, the material of the inserts, the positioning of the tool, the working conditions of the machine, the cutting force, the cutting temperatures, the tool wear, the vibrations of the workpiece and so forth. In the case of milling, it is more difficult to precisely map the theoretical topography due to the multi-point tool design and to the more complex kinematic conditions. Nevertheless, there are many studies on this topic too, some of which are described here in brief. Grzenda and Bustillo [3] proposed a hybrid algorithm which combines a Genetic Algorithm (GA) with Artificial Neural Networks (ANN) for the selection of major parameters for the prediction of surface roughness in high-torque face milling operations. The input data set includes the following parameters: cutting tool geometry, technological parameters and cutting phenomena. Colak et al. [4] used a Gene Expression Programming (GEP) method to predict the surface roughness of end-milled surfaces from cutting parameters such as cutting speed, feed and depth of cut. El-Sonbaty et al. [5] used Artificial Neural Network (ANN) models to analyse and predict the relationship between the cutting conditions and the corresponding fractal parameters of machined surfaces in face milling. The input parameters of the ANNs were the following: rotational speed (n), feed (f), depth of cut (ap), pre-tool flank wear and vibration level. The output parameters were the corresponding calculated fractal parameters: fractal dimension “D” and vertical scaling parameter “G.” Tseng et al. [6] used design of experiments (DoE) to determine the significant factors and then fuzzy logic approach for the prediction of surface roughness. The factors considered for DoE were the depth of cut (ap), feed per tooth (fz), cutting speed (vc), tool nose radius (rε), the use of cutting fluid and the three components of the cutting force (Fx, Fy, Fz). The impact of the most important factors on the surface roughness in semi-solid AA 7075 face milling were investigated in Reference [7]. The considered factors were the spindle speed (n), feed rate (vf) and depth of cut (ap) and it was found that the surface roughness was mostly affected by the feed rate ratio and the speed, while the impact of the depth of cut was insignificant. A surface reconstruction model is introduced in Reference [8] that is based on a methodology developed for the prediction of cutting forces in freeform milling. From the global and local geometry of the tool, initial surface and tool path, this approach allows the prediction of cutting forces, surface form and roughness directly from CAM data. A generalized mathematical model of roughness formation is introduced in Reference [9] for surfaces generated by round-nose tools. The model enables the calculation of surface roughness taking into account the tool characteristics, undeformed chip thickness, tool vibrations, tool runout (for multi-point tools) and tool wear. The developed mathematical model was verified by surfaces sculptured by face milling. A statistical model is presented in Reference [10] for surface roughness estimation in high-speed flat end milling using machining variables such as spindle speed (n), feed rate (vf), depth of cut (ap) and width of cut (ae). In Reference [11] optimal cutting parameters were determined, resulting in minimal surface roughness in up peripheral milling of Ti-6Al-4V alloys. Theoretical roughness indexes (Ra) were determined by a model utilizing an artificial neural network. RSM and ANOVA were used to determine the input and output parameters. Miko et al. [12] used an experimental verification method to analyse the of cusp height evolution in end ball milling. The relationship which describe the effect of the direction of milling cutter motion on cusp heights has been derived from the geometrical interpretation of inclined elementary surface.
Shyha et al. [13] studied the microstructure of machined surfaces and chip formation in step-shoulder down-milling, using Ti-6Al-4V material with water-miscible vegetable oil-based coolant and lubricant. It has been found that the micro-geometry of machined surfaces largely depends on the cutting speed and the flow rate of the cutting fluid. Kilickap et al. [14] investigated the effect of cutting speed, feed rate and depth of cut on cutting force, surface roughness and tool wear when milling Ti-6242S alloy. The experimental data were compared with values determined by ANN and RSM methods.
A so-called desirability approach was applied in Reference [15] for the modelling of the following output responses by Response Surface Methodology (RMS): surface roughness (Ra), cutting force (Fc), cutting power (Pc), specific cutting force (Ks) and metal removal rate (MRR), during the face milling of the austenitic stainless steel X2CrNi18-9 with coated carbide inserts (GC4040). A full factorial design (L27) is selected for the experiments and ANOVA is used in order to evaluate the influence of the cutting parameters of cutting speed (vc), feed per tooth and depth of cut (ap) on the out-put responses. Nguyen and Hsu [16] investigated the effect of the cutting parameters on the surface roughness parameter Ra with a combination of the Taguchi method and the RSM. They have used quadratic mathematical modelling to estimate and the desirability function to minimize the Ra parameter. The effects of the insert runout errors and the variation of the feed rate on the surface roughness and the dimensional accuracy were analysed in Reference [17] in a face-milling operation using a surface roughness model. Schmitz et al. [18] investigated the effect of milling cutter teeth runout on surface topography, surface location error and stability in end milling. They pointed out that the cutter runout is an important issue in machining as commercially-available cutter bodies often exhibit significant deviations in milling insert locations in axial and radial directions; therefore, the chip load on the individual cutting teeth varies periodically. A numerical calculation model is presented in Reference [19] for predicting the profile of the surface and surface roughness values (Ra) as a function of feed (f), cutting tool geometry and tool errors. The research was focused on cutting with inserts that had a relatively large nose radius (r), and the influence of such tool errors were described in-depth as radial (εr) and axial (εa) runouts.
The investigations in many directions also point to the fact that face milling is characterized by inhomogeneity of roughness and its values differ in the different planes and surface elements of the surface. There are different roughness values measured in the direction of feed in the direction of the rotational axis of the tool and at different distances to the symmetry line. Theoretically, the highest roughness of the milled surface is in the symmetry plane. Therefore, in this study, the effect of increasing the feed is examined for the topography of the surface in the symmetry plane while analysing the change in the roughness values for single and multi-point milling operations. In the meantime, the axial setting errors of the inserts were also considered. For estimating roughness parameters, surface topography modelling is used that allows the determination and analysis of the theoretical values of 2D and 3D roughness parameters and that can take setting errors into account [20]. This article focuses on how the two- and three-dimensional surface roughness characteristics are affected when using a constant depth of cut. The considered 2D roughness parameters are the following: Ra—arithmetical average of the profile heights; Rz—average value of the absolute values of the heights of five highest profile peaks and the depths of five deepest valleys; Rq—root mean square average of the profile heights. The investigated 3D roughness parameters are the following: Sa—arithmetic mean height of the surface; Sz—maximum height of the surface; Sq—root mean squared height of the surface.
2. Materials and Methods
The aim of the conducted experiments was to investigate the effect of feed increase on the topography of the surface in face milling with one or more inserts by analysing the theoretical and real values of the 2D and 3D roughness parameters. The analysis is performed in the direction of feed in the rotational axis of the tool. The studies also take into account the axial run-outs of the inserts.
2.1. Investigation Method
The analysis of topography was performed by analysing the theoretical and real values of 2D and 3D roughness parameters and studying the relationship between the two value sets (Figure 1). The 2D and 3D surface roughness was measured on an AltiSurf 520 surface roughness tester device using a CL2 confocal chromatic probe. The data was evaluated using AltiMap software.
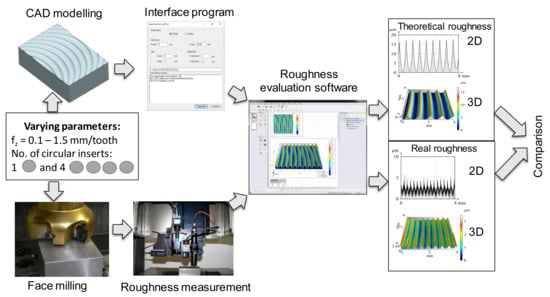
Figure 1.
The applied investigation method.
2.2. Experimental Conditions
The milling tests were performed on C45 (1.0503 or AISI-1045) normalized plain carbon steel workpieces. The chemical composition of this material grade is summarized in Table 1. According to the material certification data sheet obtained from the manufacturer, the hardness of the material is 250 HB, its tensile strength is 700 Mpa, while its 0.2% proof stress (Rp0.2) is 400 N/mm2. The specimens were prepared as simple blocks with the dimensions of 100 × 50 × 50 mm3. The cutting data of the experiments and the characteristics of the machine tool and the tool can be found in Table 2.

Table 1.
Chemical composition of the C45 material.

Table 2.
The applied technological data.
During the experiments, a single insert was used in the first stage, while in the second series four inserts were clamped into the milling head. The position of inserts (cutting edges) was checked by a Zoller Hyperion tool pre-setter device, which has a measurement accuracy of around 2 μm and display accuracy of 1 μm. As the effect of radial run-outs on the machined surface is negligible with the investigated insert geometry, they were not investigated.
For the four inserts, the axial run-out values were the following: Insert1: 0 (the deepest one), Insert2: 14 µm, Insert3: 13 µm, Insert4: 4 µm.
2.3. Determination of Roughness Values by CAD Modelling
The analyses were carried out using a method for determining the theoretical values of surface roughness measurements [21]. Its essence is the CAD modelling of the machined surface. In this process, first the geometric model of the workpiece and the tool was created and then the imprints of the tool were made on the workpiece surface according to the kinematics characteristic of the process. The points of the surface (x, y and z coordinates)—i.e., the theoretical surface—were transferred to a professional surface topography analysis software using an interface software that performs evaluations based on standard two- or three-dimensional roughness parameters to the theoretical values. The AltiMap commercial surface roughness evaluation software was used to evaluate the desired two- and three-dimensional surface roughness parameters as well as visualization of roughness profiles.
One of the great advantages of this method is that both two-dimensional roughness profiles and three-dimensional surfaces can be generated in any measuring position and direction. The novelty of the method is that it is possible to analyse the complex surface topography created by any tool and the workpiece motion combination using the applied principle and the adjustment errors can be taken into account when using multi-point tools. Another great advantage is that it is relatively easy to introduce additional factors into the model. In this research, the option of modelling axial and radial differences between individual inserts has been used.
2.4. Examination of Roughness of the Machined (Milled) Surface
Examination of the machined surface is based on the 2D and 3D images from the topography and on the values of the measurements. For the evaluation of the surfaces of milling experiments the same topography measurement system is used; therefore, the data obtained by theoretical modelling can be validated on the same basis with the measured roughness profiles and values. The two-dimensional profiles, which are recorded in the feed direction at the centreline of the milling head, are measured in accordance with ISO 4287: 1997 [22] and ISO 4288: 1998 [23] standards. Three-dimensional surfaces are measured and evaluated in accordance with ISO 25178-2: 2012 [24].
3. Results
The tests were performed with either one or four circular inserts and the roughness parameters were analysed in 2D and 3D systems. Parameters measured in the 2D system: Ra, Rq and Rz. In the 3D system, their equivalents were measured: Sa, Sq and S10z. In each case a profile chart was taken in the 2D system and a topographic graph in the 3D system.
3.1. Roughness of the Modelled (Theoretical) Surface
Input parameters of the modelling (material quality, geometrical and technological parameters, etc.) were matched to the intended machining experiments and the ranges to be examined. After the modelling steps were completed, both the 2D and 3D profiles and the previously calculated theoretical values were available. From the theoretical values obtained by modelling, Figure 2 shows the results of three feed values for the simulation performed with a single circular insert (iC = 12 mm). Based on the presented topographic graphs, it can be seen, that profiles and three-dimensional surfaces obtained by modelling show a regular periodicity and accurately characterize the increase in surface roughness by increasing the feed.
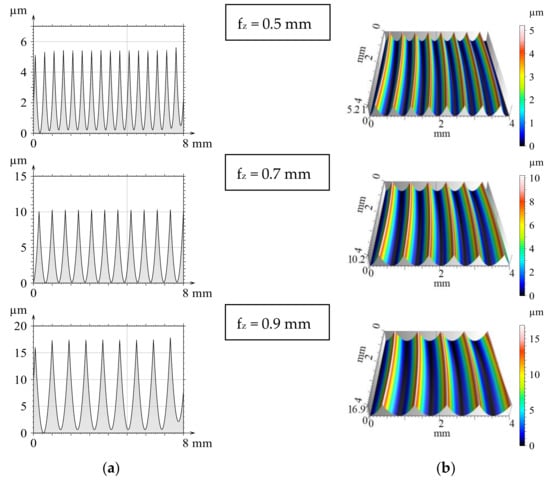
Figure 2.
The modelled theoretical 2D (a) and 3D (b) surfaces when applying a single insert.
A similar conclusion can be drawn from Figure 3, where four inserts are applied, with the exception that both profiles are more irregular. The periodicity can be observed here for one tool rotation. Within a revolution, traces of the inserts vary in depth, which is the consequence of the setting error (run-out). If there were no setting errors, then the profiles theoretically would be the same for the same feed per tooth when using one and four inserts. At this time and in this sense, cutting with a single insert can be considered as machining without a setting error.
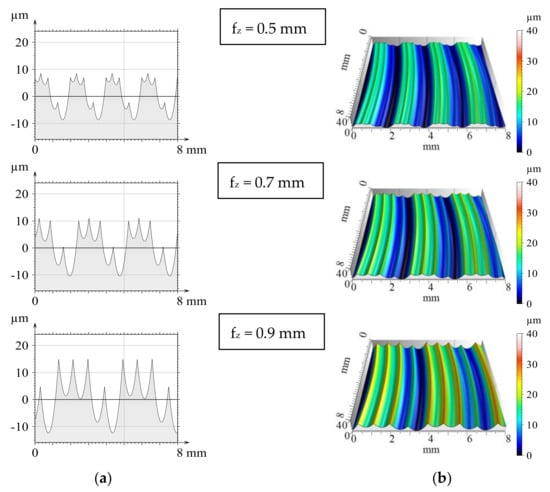
Figure 3.
Modelled theoretical 2D (a) and 3D (b) surfaces when using four inserts.
3.2. Roughness of Milled Surfaces
Figure 4 and Figure 5 show the measured roughness of the surfaces machined at the same feed but with one and four inserts respectively. If there were no insert run-outs, then the theoretical roughness would be the same in these cases. However, there are no multi-point milling tools without runout in the reality, so these should be considered in the modelling phase as well.
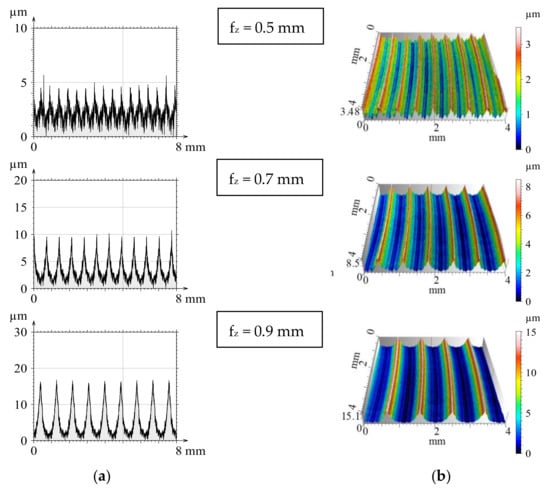
Figure 4.
Roughness profiles (a) and topographic images (b) of face milling with one insert.
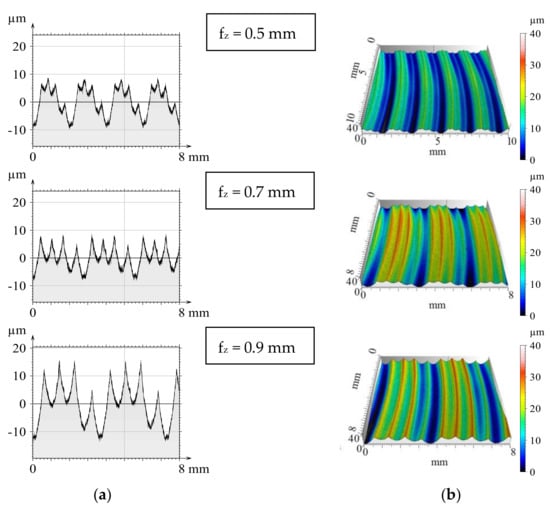
Figure 5.
Milled 2D profiles (a) and 3D surfaces (b) when four inserts were applied.
By comparing the theoretical and the measured profiles, it can be stated that the profiles are in good agreement and with the increasing value of the feed the theoretical profile more closely follows the real profile. This is typical for both single- and four-insert milling. In the case of four circular inserts, imprints of the successive non-coplanar inserts are clearly visible.
From the theoretical and measured values of roughness parameters, the values of Ra, Rq, Rz and Sa, Sq, S are summarized in Table 3 and Table 4. In the tables bold values are used to indicate the same feed values for both cases.

Table 3.
Roughness values on surfaces milled by a single insert.

Table 4.
Roughness values on surfaces milled by four inserts.
4. Discussion
The analysis should be started by comparing the roughness values of milled surfaces machined by one and four inserts. In both cases, values of all parameters increase with increasing feeds and the change is of the same nature. It was also observed, that the Ra and Rq parameters as well as the Sa and Sq ones are varying in the same way and their values are very close to each other. So, only one of them, namely the much more widely used Ra (and Sa in 3D) will be evaluated in the following. Along with the same feed per tooth, the roughness is always lower for cutting with a single insert. After machining with four inserts, the roughness of the surface has increased considerably compared to machining with a single insert. For fz = 0.5 mm, the theoretical values are 3.81 times greater for Ra, 3.31 times for Rz, 3.79 times for Sa and Sz is 3.45 times larger when machining with four inserts. Table 5 shows that the differences in measured values are even greater.

Table 5.
The degree of increase in roughness values when changing the number of inserts.
When using feed per tooth of fz = 0.9 mm, this difference is reduced by nearly 1.5-fold and the difference between the measured and the theoretical values is smaller. This means that the accurate setting of the insert is at least as important as changing feed values. It also shows that due to smaller deviations at higher feed, roughness can be more easily predicted. It can also be stated that the greater the value of the feed per tooth, the better the correlation between theoretical and the real roughness. One explanation for this is that in the range of lower feed values the additional effects of chip removal (such as vibrations in the milling cutter, tearing of the workpiece material during the chip removal, built-up edge, defects in the homogeneity of the workpiece material, undeformed chip thickness and tool wear) and the influence of the edge radius and the roughness of the cutting edge are greater in proportion.
Analysing the complete investigation range of one and four inserts, it is also found that the difference between the theoretical and the real roughness values is smaller for one insert than when cutting with four inserts (Figure 6 and Figure 7).
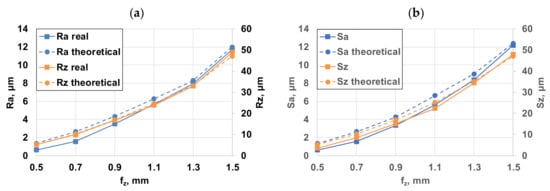
Figure 6.
The roughness results of single-insert face milling: (a) 2D roughness parameters; (b) 3D roughness parameters.
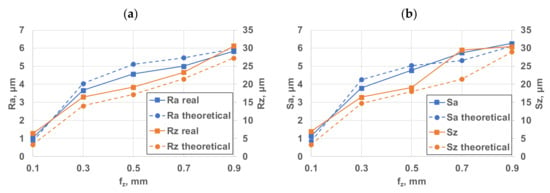
Figure 7.
Comparison diagrams of four-insert roughness: (a) 2D roughness parameters; (b) 3D roughness parameters.
However, it is worth noting that, especially with respect to the Ra and Sa parameters, the theoretical methods described above have provided slightly greater roughness values than those found on the measured surfaces. This is caused by the relatively large radius (related to the roughness) and here the plastic deformation is more dominant because the cutting effect (material separation) on the tool edge is insufficiently applied, thus the roughness profile is distorted related to the theoretical one. Previous experience has shown that—as it was already mentioned before—the Ra and Rq parameters vary in the same way and their values are almost the same. Therefore, using only one of them—the more general Ra—is enough during the measurements. It has also been observed that neither Ra nor Rq reflects the change of roughness with sufficient sensitivity. Rz responds much more sensitively and more accurately to roughness than Ra. The tendency in the 2D profiles seems to increase the number of deep grooves forming by increasing the feed per tooth (fz). This is unfavourable from a fatigue stress viewpoint but it is beneficial for oil storage. On the 3D profile pictures, however, there is a characteristic embossment which can be explained by the setting errors of the edges. In 3D images, the microgeometric shape of the surface can be said to be regular. A “bump” corresponds to a revolution of the tool.
When studying the data, it is apparent that the roughness parameters are considerably worse in the case of the four-insert milling tool with unchanged feed per tooth. This significant deterioration is clearly due to the run-out errors of the successive inserts. The result of axial run-out is that the inserts engage at different depths, resulting in a similar change in roughness amplitudes. By illustrating the measurement results, it can be established that when using four inserts, roughness can be increased up to seven times at low feed rates. This result is worse than expected. The main reason for this significant roughness deterioration is the setting inaccuracy of the inserts. The roughness peaks and the periodicity that correspond to a revolution of the tool can be easily tracked on the 3D topographic figures.
5. Summary and Outlook
The method of the study described in this article—simultaneously examining the roughness of the modelled surface and the machined surface—provides a good opportunity to analyse the topography of the machined surface. Based on the experiments carried out it can be stated that the accuracy of the approximation increases with the increase in feed and therefore the application of the method in the case of high-feed milling is particularly effective. Overall, it is therefore suitable for determining the theoretical values of the surface roughness and for estimating the expected roughness of the surfaces machined under the given conditions. In the case of single-insert face milling (fly-cutting), the roughness is gradually deteriorating with the increasing of the feed per tooth fz. This change is most strongly reflected by the change in roughness parameters Rz and Sz. By comparing these roughness values and the four-insert experimental results, it was found that, depending on the feed rate—for the investigated settings—the surface had a 1.44–7.71 times worse roughness, which can be explained by the run-outs of the inserts. Commercial milling heads and commercial inserts were used in the experiments. The insert setting errors can be much higher in case of using non-standard cutter heads with special design, for example, in Reference [25]. Since tool assembly may result in a run-out that has a significant impact on the topography, it is advisable to check the run-out every time the inserts are replaced. Comparative analysis of modelled and measured roughness data showed that there is good compliance between the two values. Therefore, the roughness of the surfaces milled with various feeds can be well estimated in advance.
Acknowledgments
The authors greatly appreciate the support of the National Research, Development and Innovation Office—NKFIH (No. of Agreement: OTKA K 116876). The described article was carried out as part of the EFOP-3.6.1-16-00011 “Younger and Renewing University—Innovative Knowledge City—institutional development of the University of Miskolc aiming at intelligent specialisation” project implemented in the framework of the Szechenyi 2020 program. The realization of this project is supported by the European Union, co-financed by the European Social Fund.
Author Contributions
János Kundrák and Csaba Felhő conceived and designed the experiments; Csaba Felhő performed the experiments; János Kundrák and Csaba Felhő analysed the data; Csaba Felhő contributed reagents/materials/analysis tools; János Kundrák wrote the paper.
Conflicts of Interest
The authors declare no conflict of interest.
References
- He, C.L.; Zong, W.J.; Zhang, J.J. Influencing factors and theoretical modelling methods of surface roughness in turning process: State-of-the-art. Int. J. Mach. Tools Manuf. 2018. [Google Scholar] [CrossRef]
- Tomov, M.; Kuzinovski, M.; Cichosz, P. Modelling and prediction of surface roughness profile in longitudinal turning. J. Manuf. Process. 2016, 24, 231–255. [Google Scholar] [CrossRef]
- Grzenda, M.; Bustillo, A. The evolutionary development of roughness prediction models. Appl. Soft Comput. 2013, 13, 2913–2922. [Google Scholar] [CrossRef]
- Colak, O.; Kurbanoglu, C.; Kayacan, M.C. Milling surface roughness prediction using evolutionary programming methods. Mater. Des. 2007, 28, 657–666. [Google Scholar] [CrossRef]
- El-Sonbaty, I.A.; Khashaba, U.A.; Selmy, A.I.; Ali, A.I. Prediction of surface roughness profiles for milled surfaces using an artificial neural network and fractal geometry approach. J. Mater. Process. Technol. 2008, 200, 271–278. [Google Scholar] [CrossRef]
- Tseng, T.-L.; Konada, U.; Kwon, Y. A novel approach to predict surface roughness in machining operations using fuzzy set theory. J. Comput. Des. Eng. 2016, 3, 1–13. [Google Scholar] [CrossRef]
- Rawangwong, S.; Chatthong, J.; Boonchouytan, W.; Burapa, R. Influence of Cutting Parameters in Face Milling Semi-Solid AA 7075 Using Carbide Tool Affected the Surface Roughness and Tool Wear. Energy Procedia 2014, 5, 448–457. [Google Scholar] [CrossRef]
- Zeroudi, N.; Fontaine, M. Prediction of machined surface geometry based on analytical modelling of ball-end milling. Procedia CIRP 2012, 1, 108–113. [Google Scholar] [CrossRef][Green Version]
- Miko, E.; Nowakowski, L. Analysis and Verification of Surface Roughness Constitution Model after Machining Process. Procedia Eng. 2012, 39, 395–404. [Google Scholar] [CrossRef]
- Ozcelik, B.; Bayramoglu, M. The statistical modelling of surface roughness in high-speed flat end milling. Int. J. Mach. Tools Manuf. 2006, 46, 1395–1402. [Google Scholar] [CrossRef]
- Karkalos, N.E.; Galanis, N.I.; Markopoulos, A.P. Surface roughness prediction for the milling of Ti–6Al–4V ELI alloy with the use of statistical and soft computing techniques. Measurement 2016, 90, 25–35. [Google Scholar] [CrossRef]
- Mikó, B.; Beno, J.; Mankova, I. Experimental Verification of Cusp Heights when 3D Milling Rounded Surfaces. Acta Polytech. Hung. 2012, 9, 101–116. [Google Scholar]
- Shyha, I.; Gariani, S.; El-Sayed, M.A.; Huo, D. Analysis of Microstructure and Chip Formation When Machining Ti-6Al-4V. Metals 2018, 8, 185. [Google Scholar] [CrossRef]
- Kilickap, E.; Yardimeden, A.; Celik, Y.H. Mathematical Modelling and Optimization of Cutting Force, Tool Wear and Surface Roughness by Using Artificial Neural Network and Response Surface Methodology in Milling of Ti-6242S. Appl. Sci. 2017, 7, 1064. [Google Scholar] [CrossRef]
- Selaimia, A.-A.; Yallese, M.A.; Bensouilah, H.; Meddour, I.; Khattabi, R.; Mabrouki, T. Modelling and optimization in dry face milling of X2CrNi18-9 austenitic stainless steel using RMS and desirability approach. Measurement 2017, 107, 53–67. [Google Scholar] [CrossRef]
- Nguyen, H.-T.; Hsu, Q.-C. Surface Roughness Analysis in the Hard Milling of JIS SKD61 Alloy Steel. Appl. Sci. 2016, 6, 172. [Google Scholar] [CrossRef]
- Baek, D.K.; Ko, T.J.; Kim, H.S. Optimization of feedrate in a face milling operation using a surface roughness model. Int. J. Mach. Tools Manuf. 2001, 41, 451–462. [Google Scholar] [CrossRef]
- Schmitz, T.L.; Couey, J.; Marsh, E.; Mauntler, N.; Hughes, D. Runout effects in milling: Surface finish, surface location error and stability. Int. J. Mach. Tools Manuf. 2007, 47, 841–851. [Google Scholar] [CrossRef]
- Franco, P.; Estrems, M.; Faura, F. Influence of radial and axial runouts on surface roughness in face milling with round insert cutting tools. Int. J. Mach. Tools Manuf. 2004, 44, 1555–1565. [Google Scholar] [CrossRef]
- Felho, C. Investigation of Surface Roughness in Machining by Single and Multi-Point Tools. Ph.D. Thesis, Otto von Guericke University, Magdeburg, Germany, 2014. [Google Scholar]
- Felho, C.; Karpuschewski, B.; Kundrak, J. Surface roughness modelling in face milling. Procedia CIRP 2015, 31, 136–141. [Google Scholar] [CrossRef]
- International Organization for Standardization (ISO). Geometrical Product Specifications (GPS)—Surface Texture: Profile Method—Terms, Definitions and Surface Texture Parameters; ISO 4287; ISO: Geneva, Switzerland, 1997. [Google Scholar]
- International Organization for Standardization (ISO). Geometrical Product Specifications (GPS)—Surface Texture: Profile Method—Rules and Procedures for the Assessment of Surface Texture; ISO 4288; ISO: Geneva, Switzerland, 1998. [Google Scholar]
- International Organization for Standardization (ISO). Geometrical Product Specifications (GPS)—Surface Texture: Areal—Part 2: Terms, Definitions and Surface Texture Parameters; ISO 25178-2; ISO: Geneva, Switzerland, 2012. [Google Scholar]
- Beno, J.; Mankova, I.; Vrabel, M.; Karpuschewski, B.; Emmer, T.; Schmidt, K. Operation Safety and Performance of Milling Cutters with Shank Style Holders of Tool Inserts. Procedia Eng. 2012, 48, 15–23. [Google Scholar] [CrossRef][Green Version]
© 2018 by the authors. Licensee MDPI, Basel, Switzerland. This article is an open access article distributed under the terms and conditions of the Creative Commons Attribution (CC BY) license (http://creativecommons.org/licenses/by/4.0/).