2.3. Tuning of the Stiffness Parameter of the FE Model
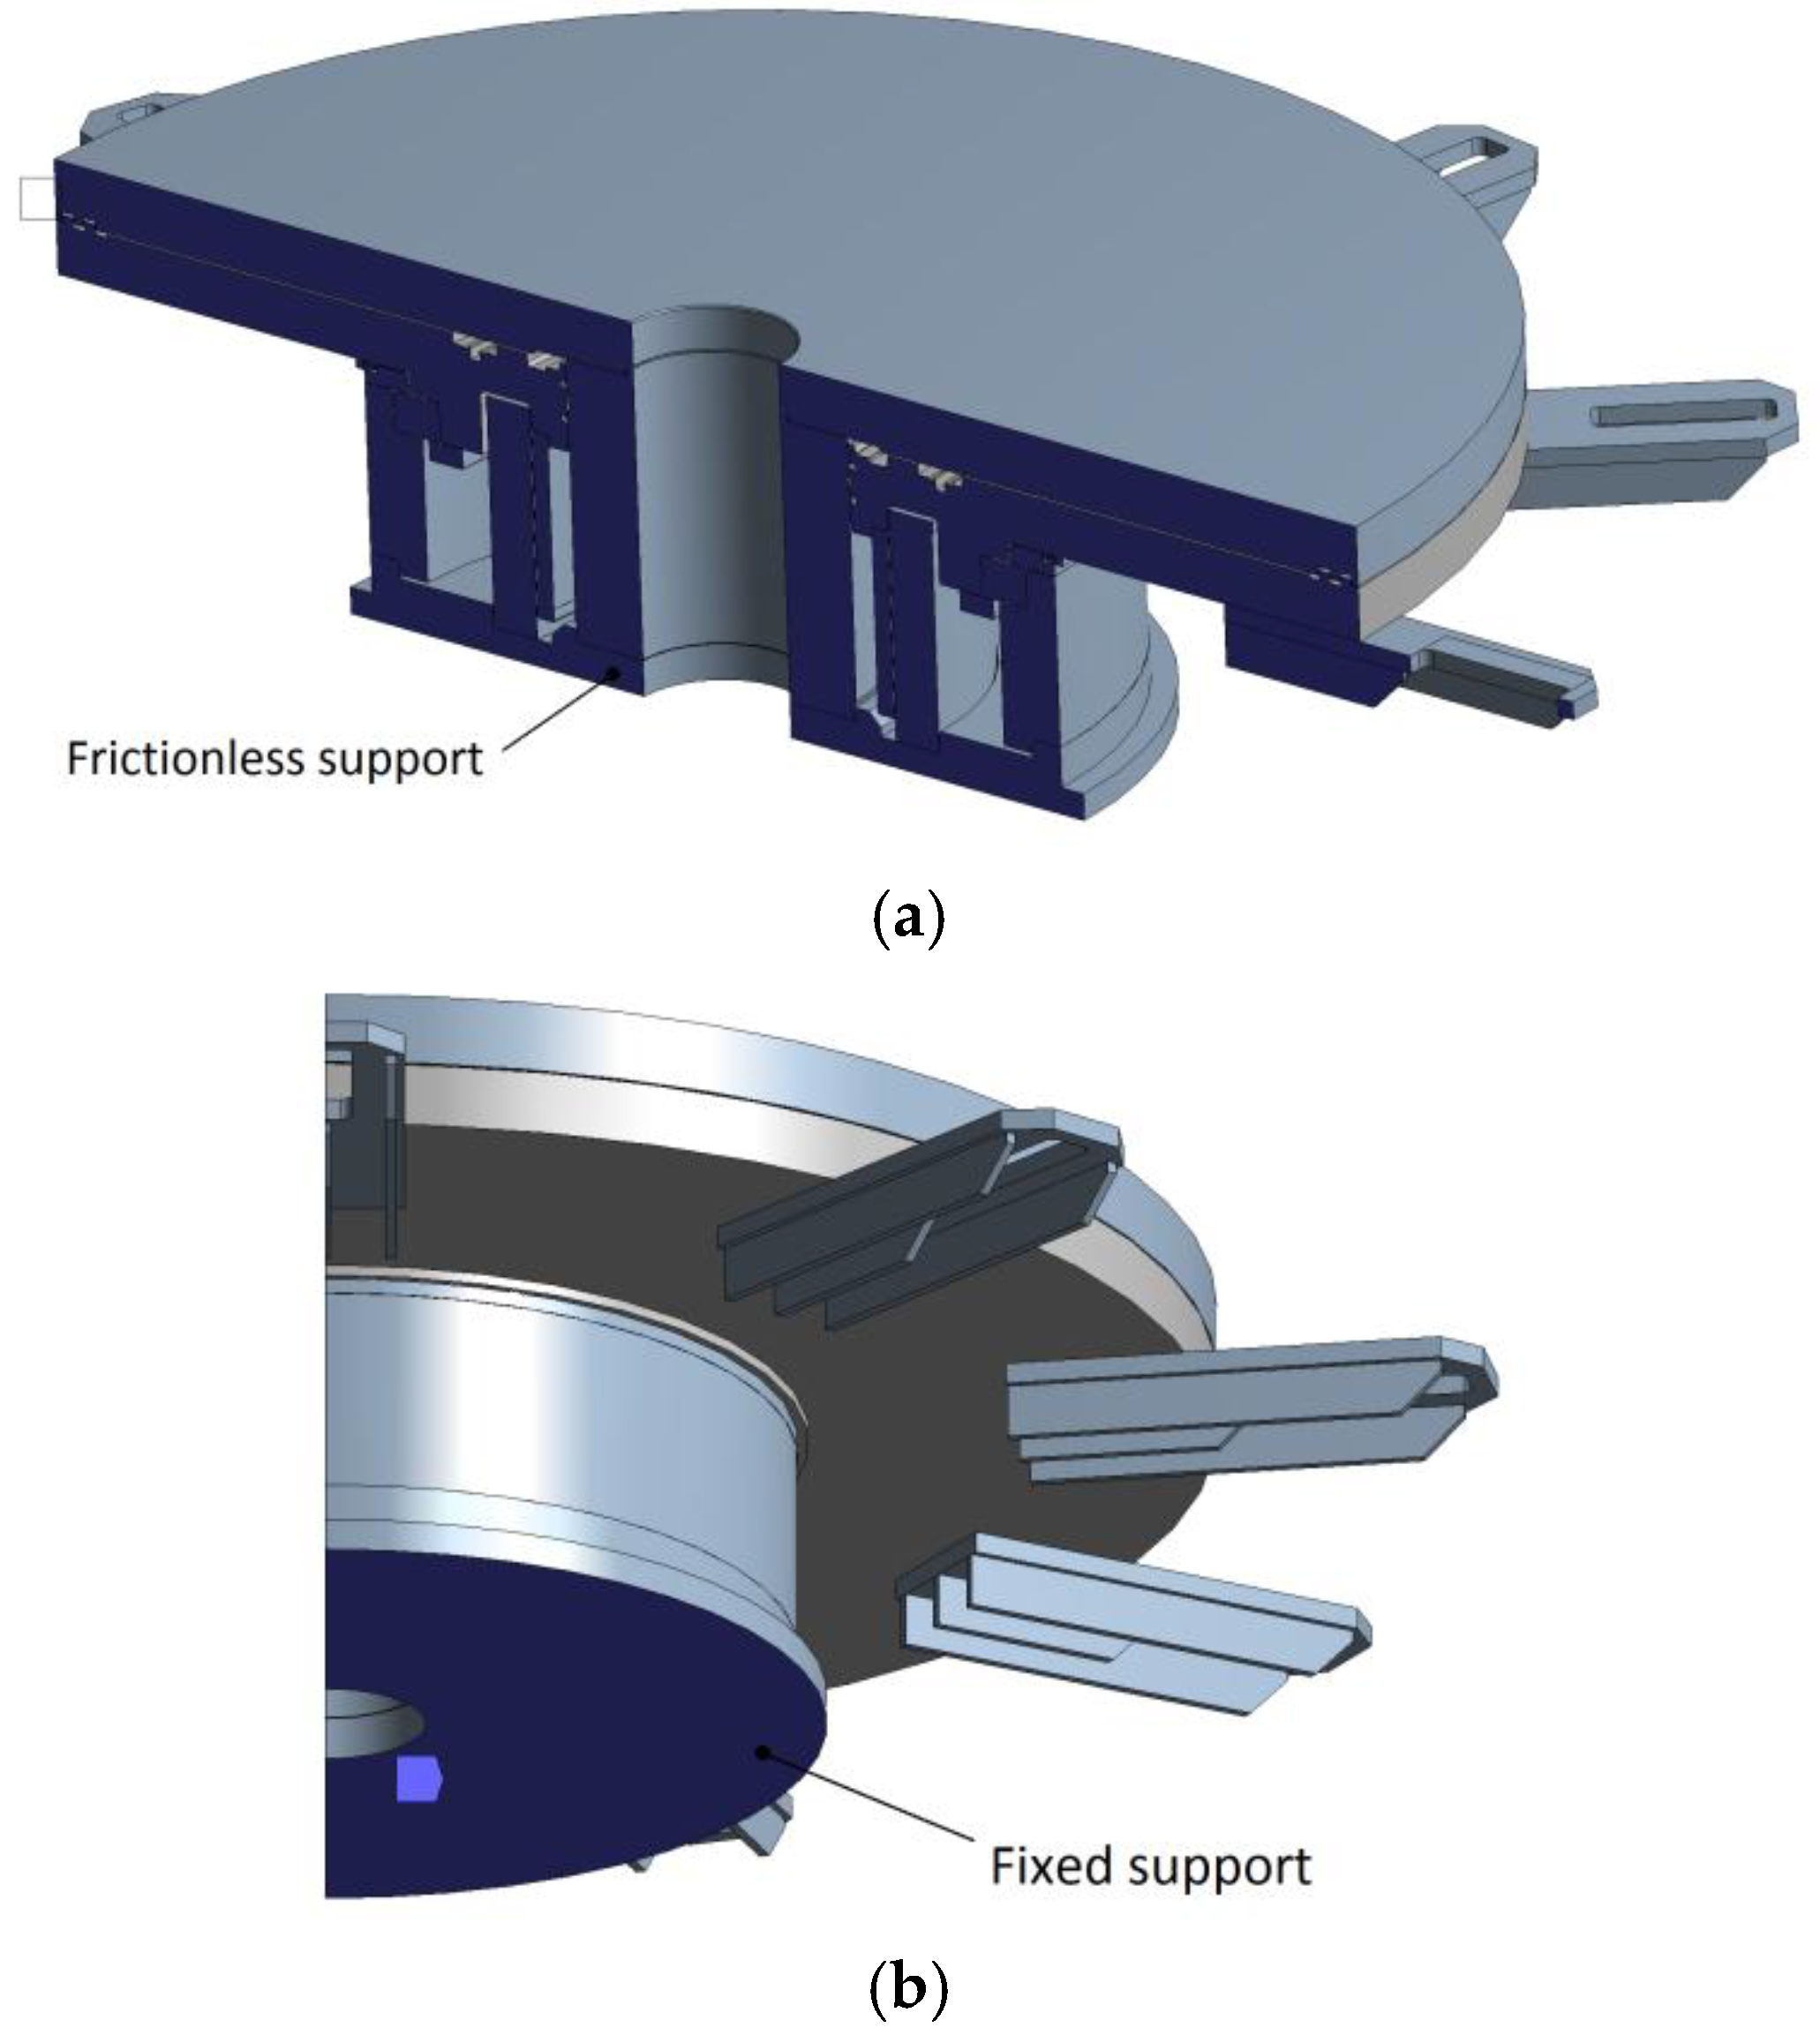
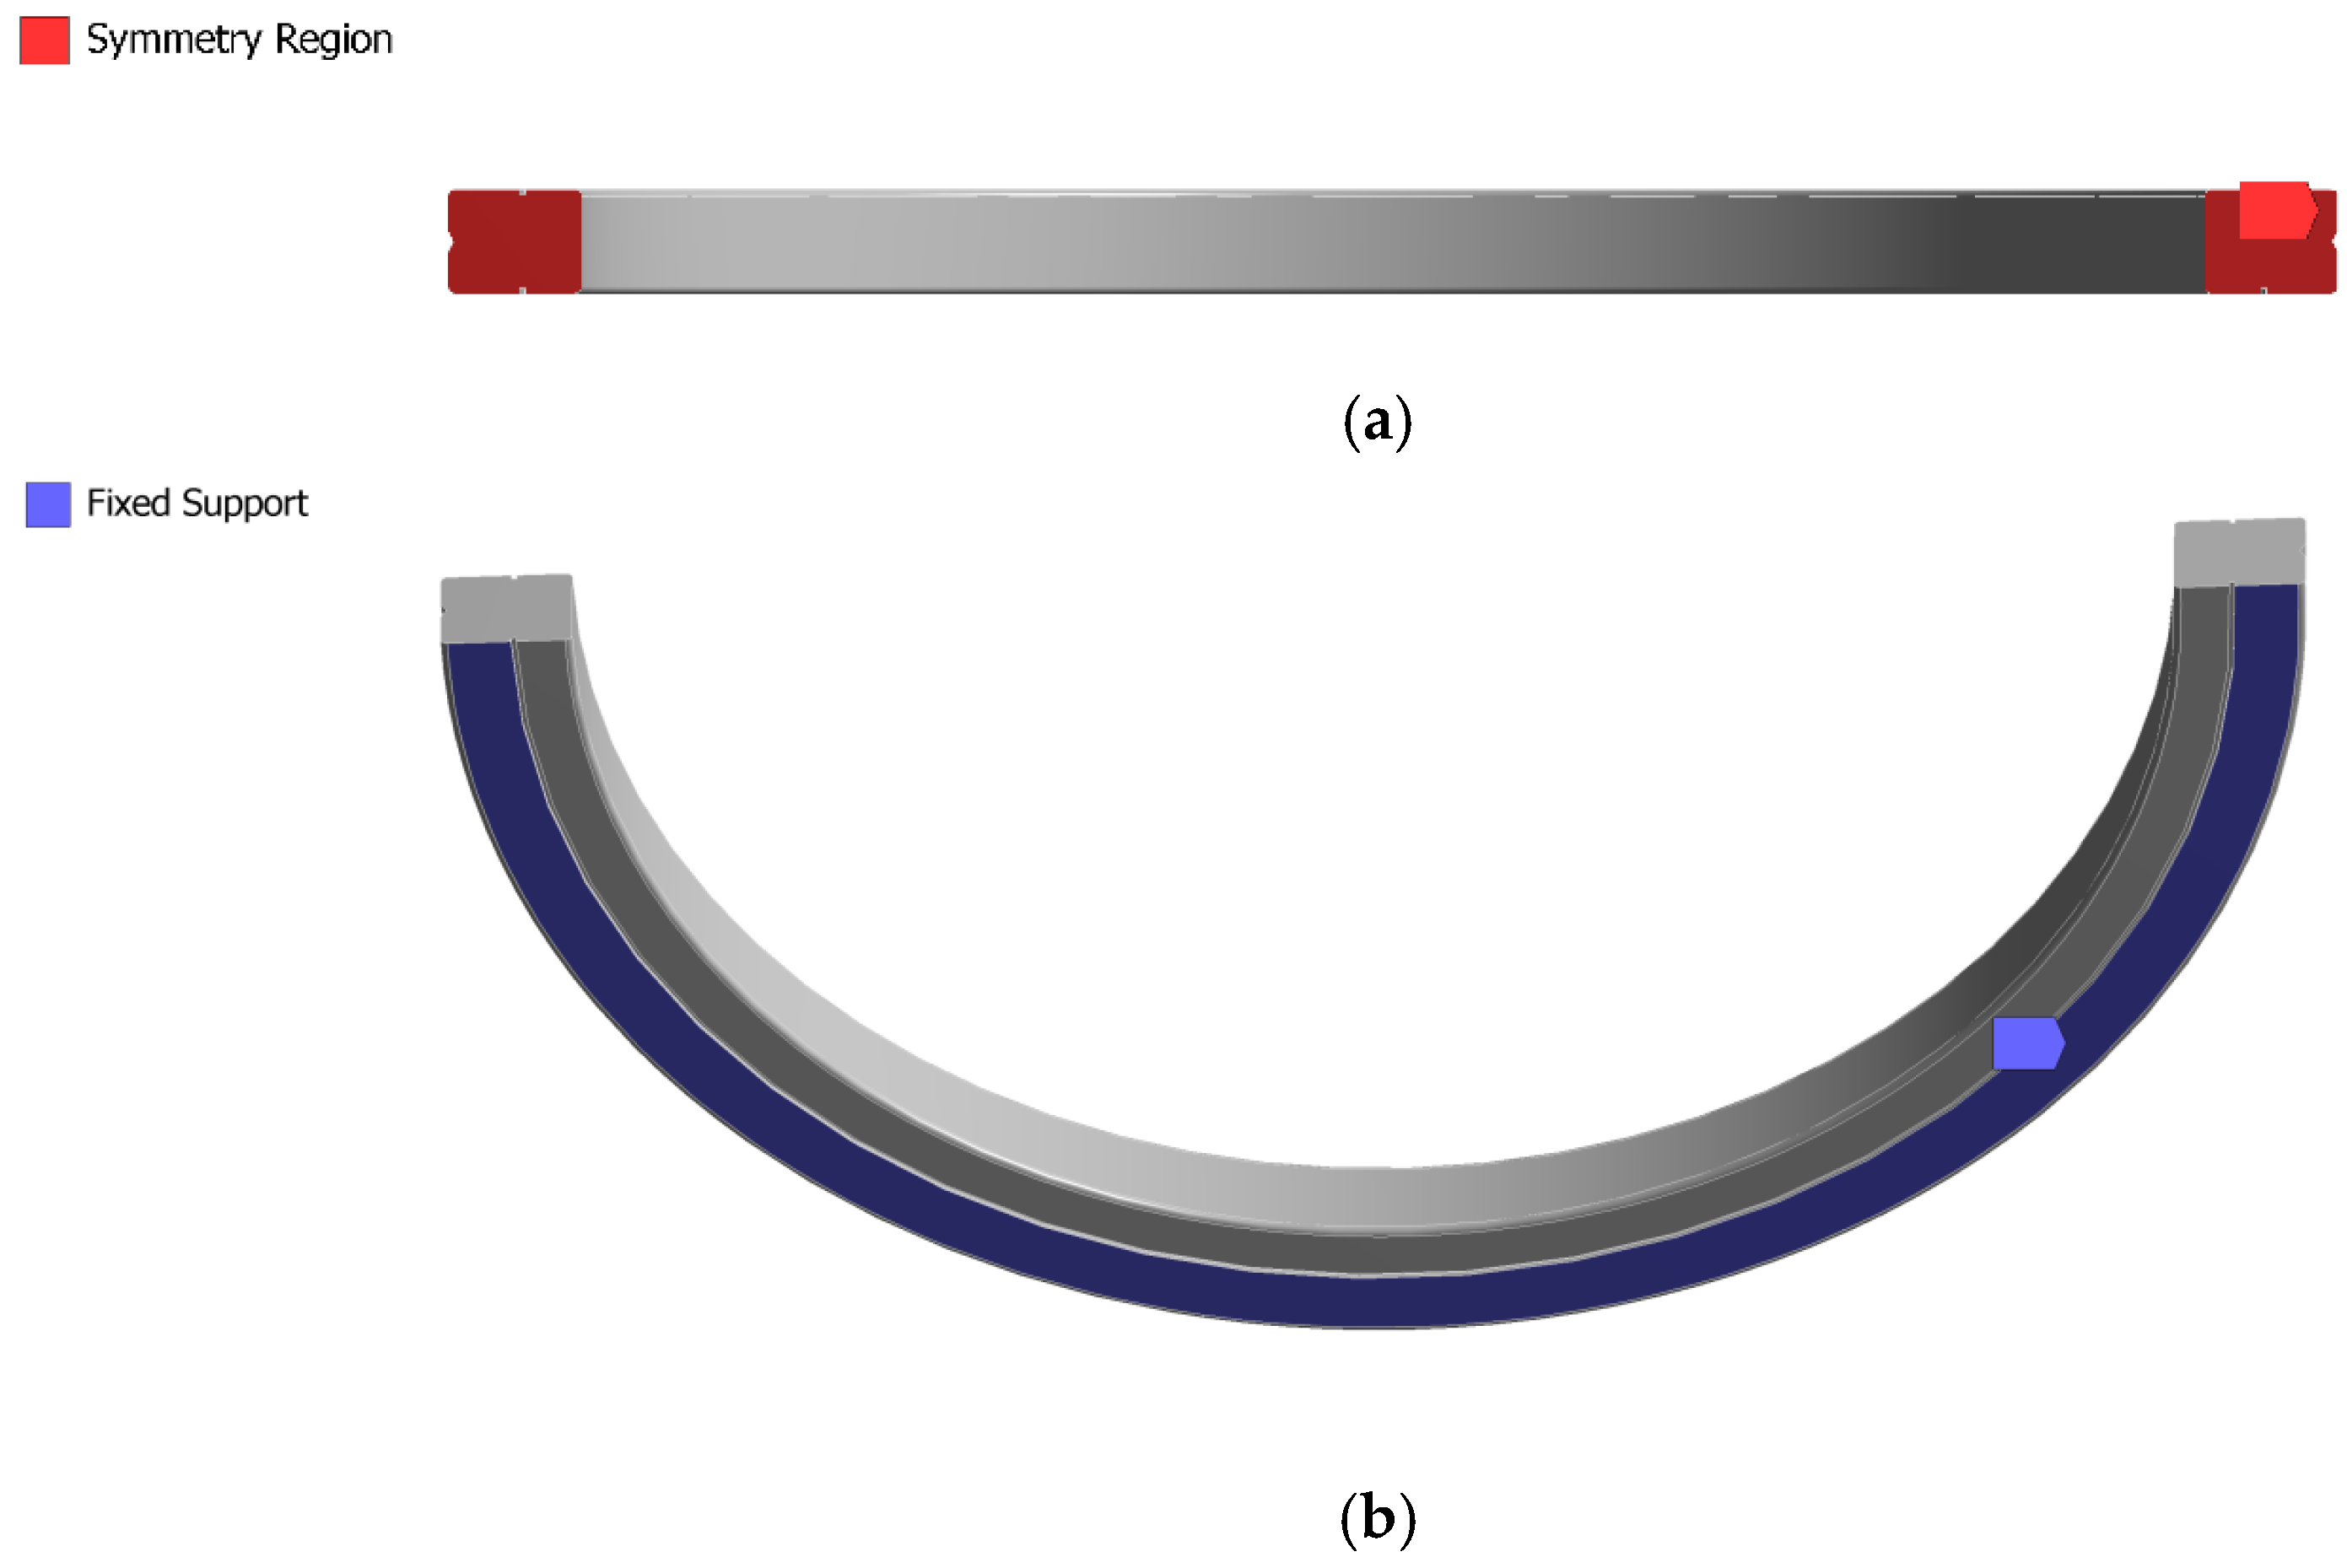
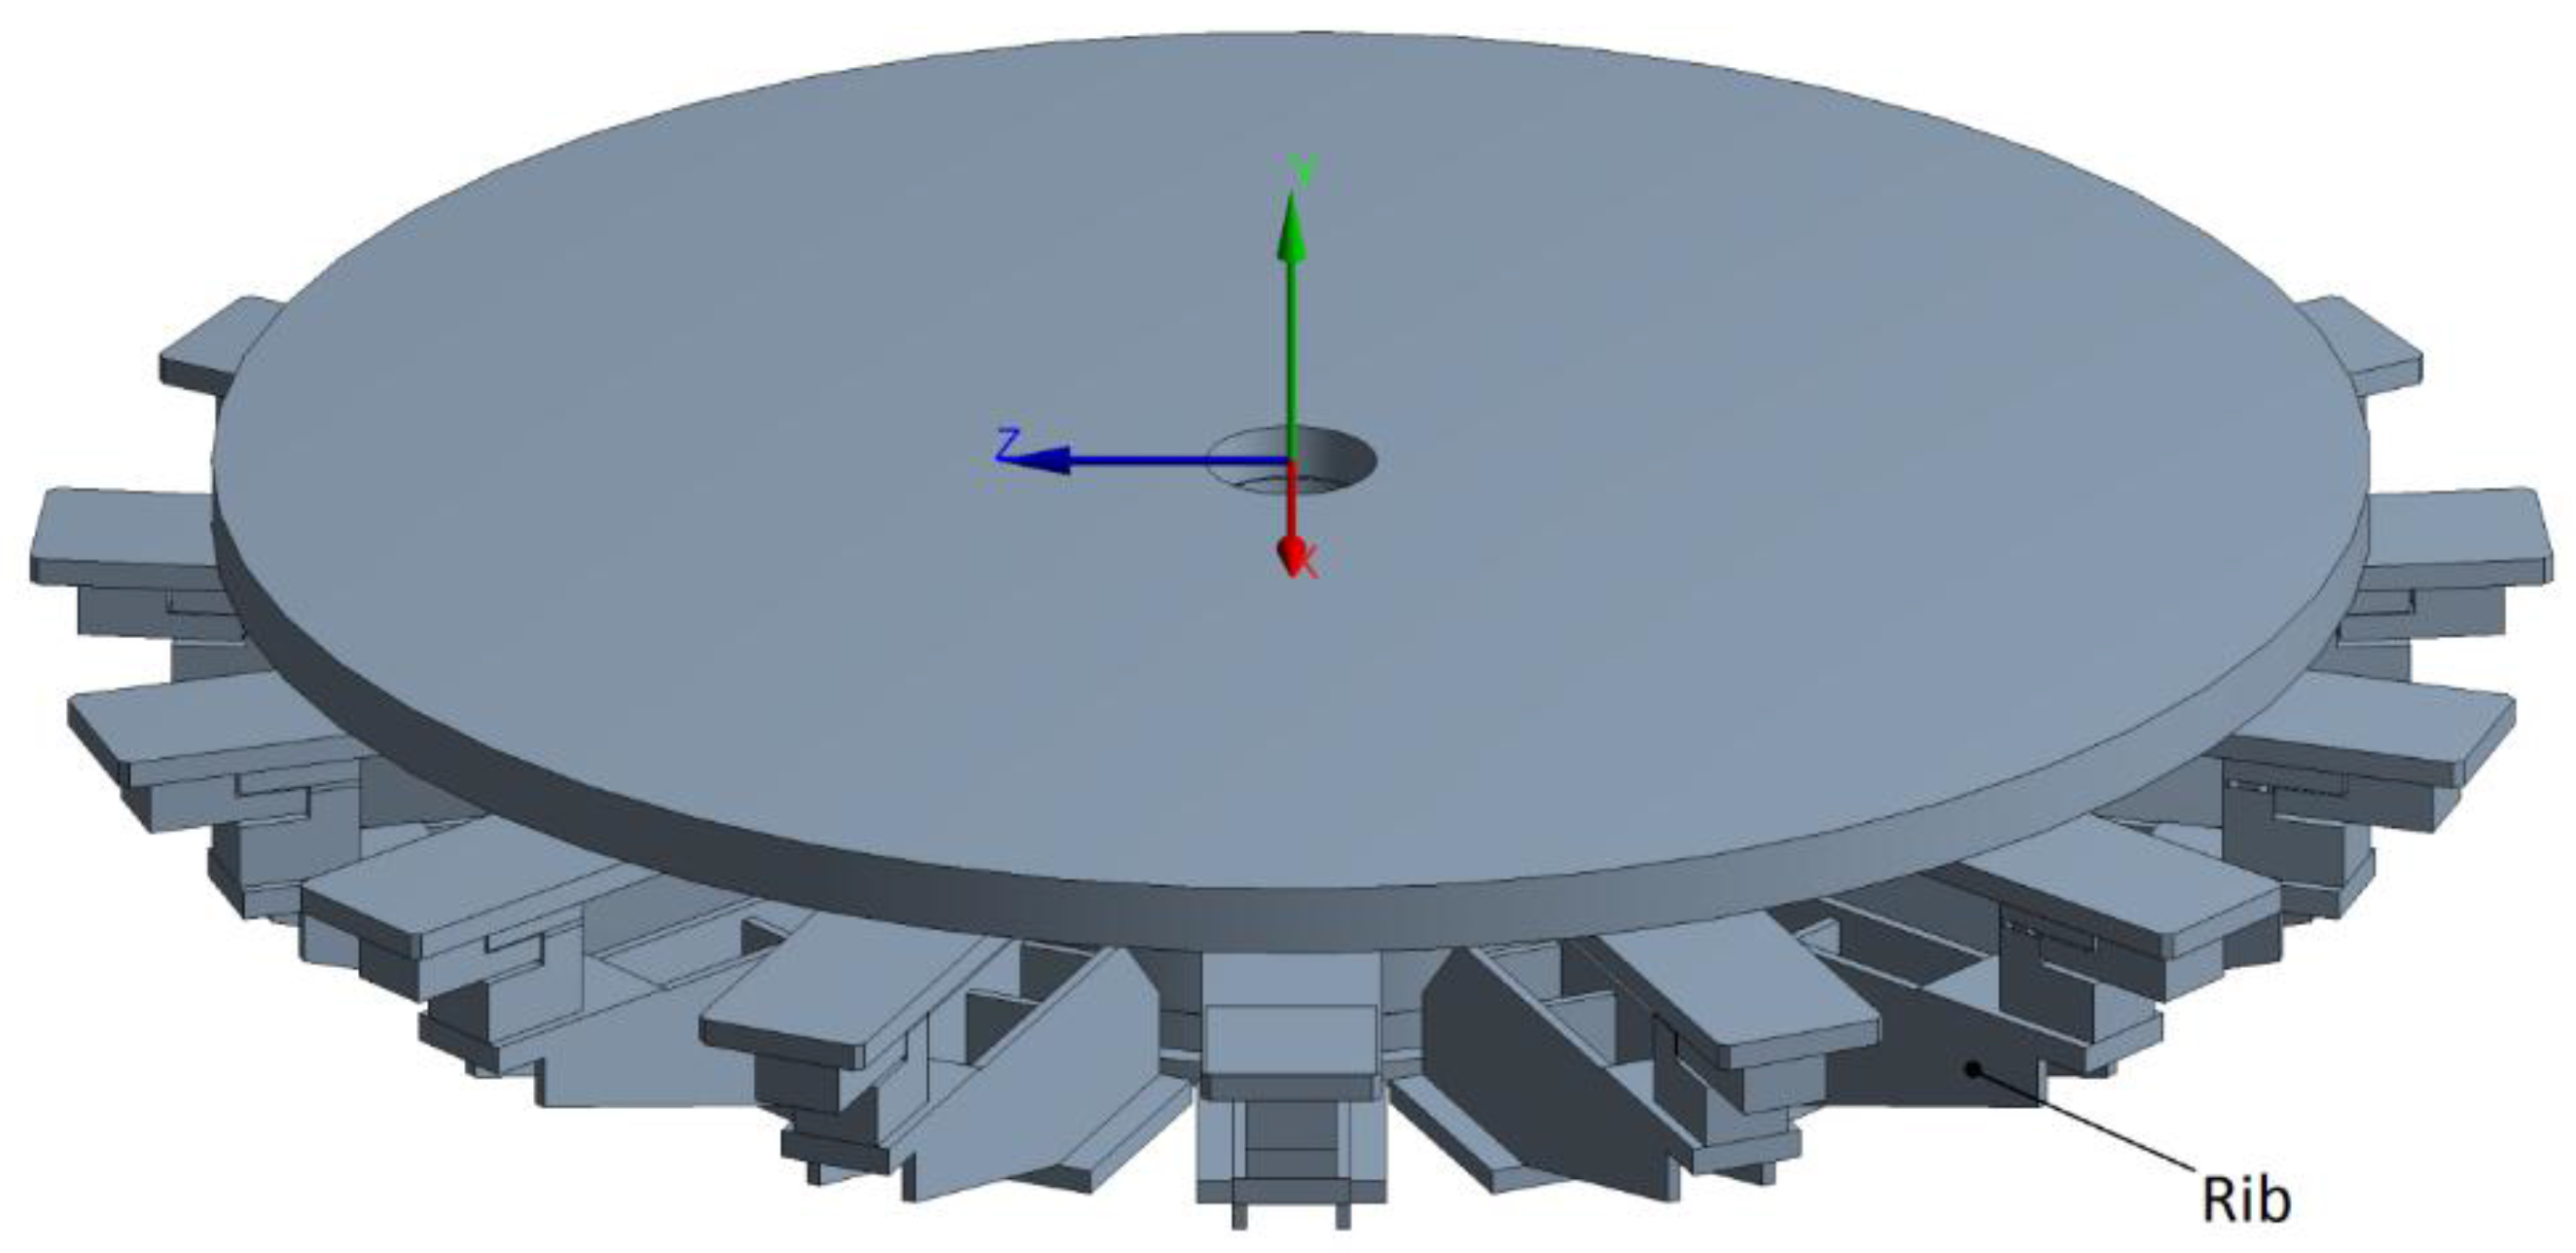
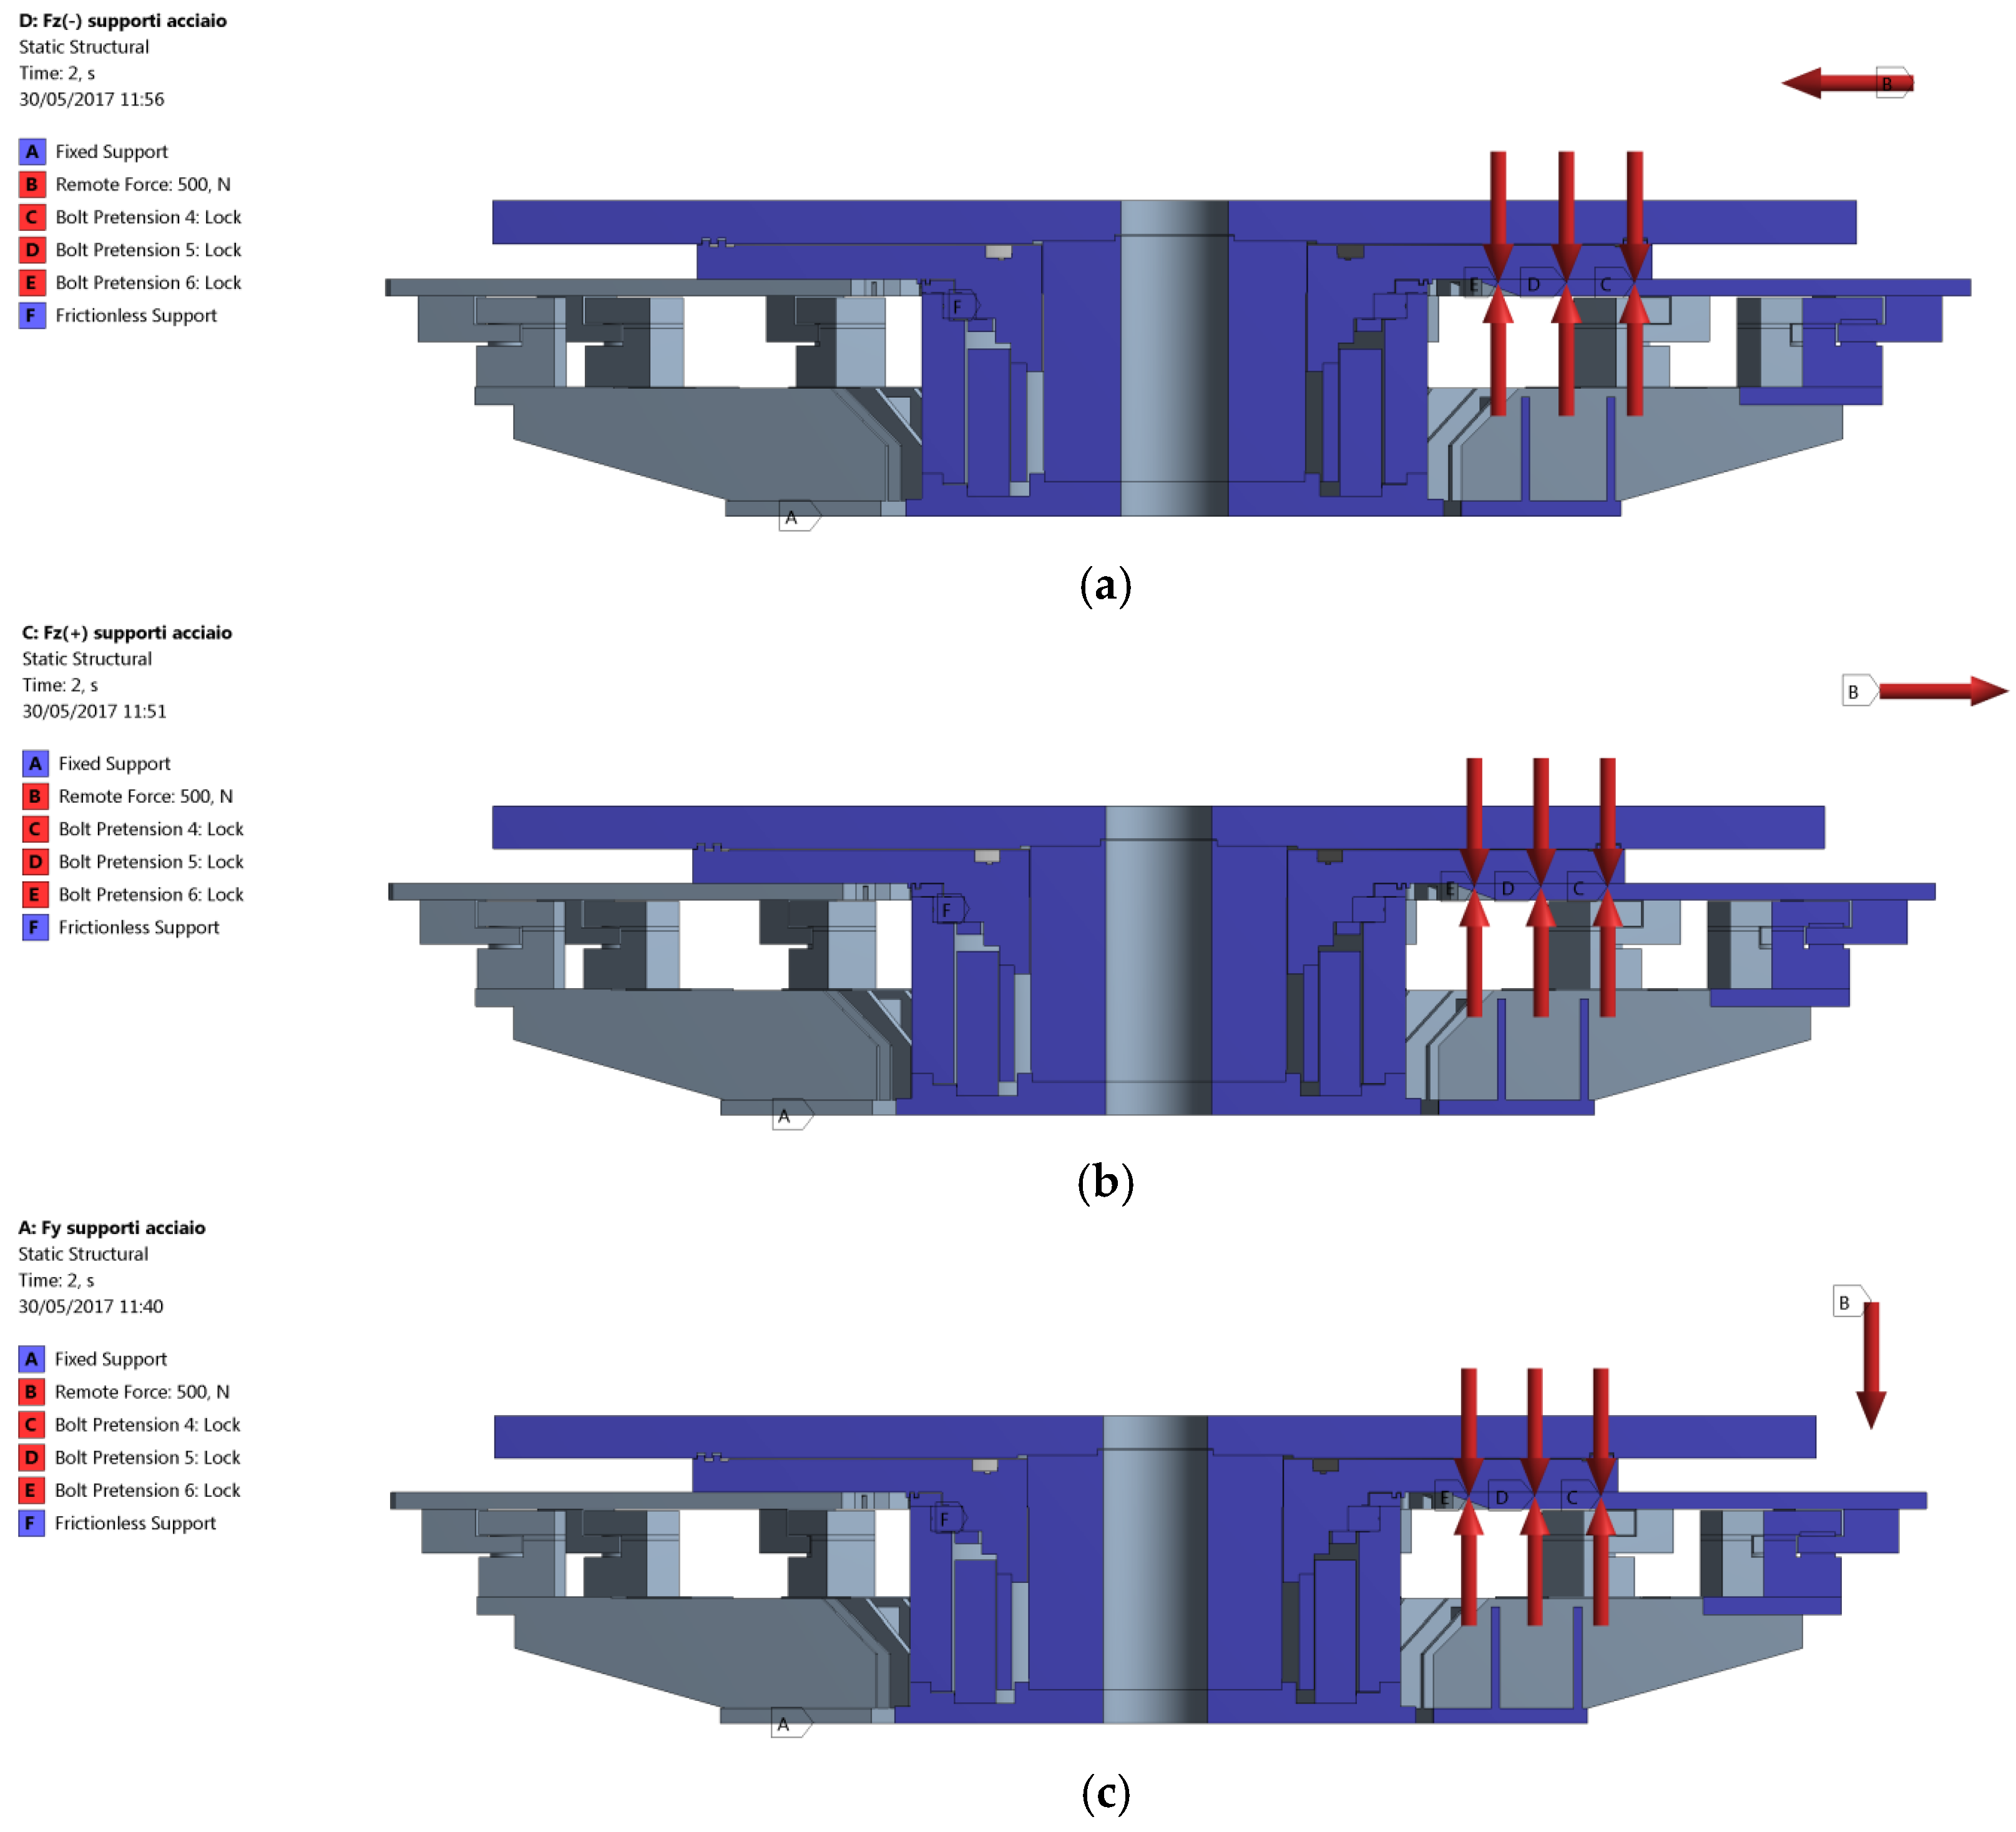
At first, the CAD geometry of the Transfer Machine with nine divisions has been simplified, in order to reduce the computational effort without significantly affecting the accuracy of the results: it must be remarked that the accurate evaluation of the stresses at notches or joints is beyond the scope of the present analysis. In fact, previous investigations carried out on similar machines showed that no significant stresses are generated on the key components of the frame during operation. Hence, the present analysis focuses just on the stiffness performance of the structure. Due to geometrical and loading symmetry conditions, a half of the geometry has been considered. A frictionless support has been applied on the symmetry plane, as shown in
Figure 5a, in order to enforce the symmetry condition. Moreover, the base of the column has been constrained by means of a fixed support (
Figure 5b): in the actual application, such a surface is constrained to the lower part of the frame, which can be considered perfectly rigid.
The materials assigned to the parts are AlMg0.7Si (
E = 69.5 GPa,
ν = 0.33) for the rotating table and a structural steel (
E = 200 GPa,
ν = 0.30) for any other part. The geometry has been meshed with SOLID187 tetrahedral and hexahedral elements, for a total node count
n ≈ 95,000. All the contacts in the model are set as bonded, assuming a pure penalty formulation and a normal stiffness factor controlled by the software (FKN = 1, [
14,
15]). The applied force
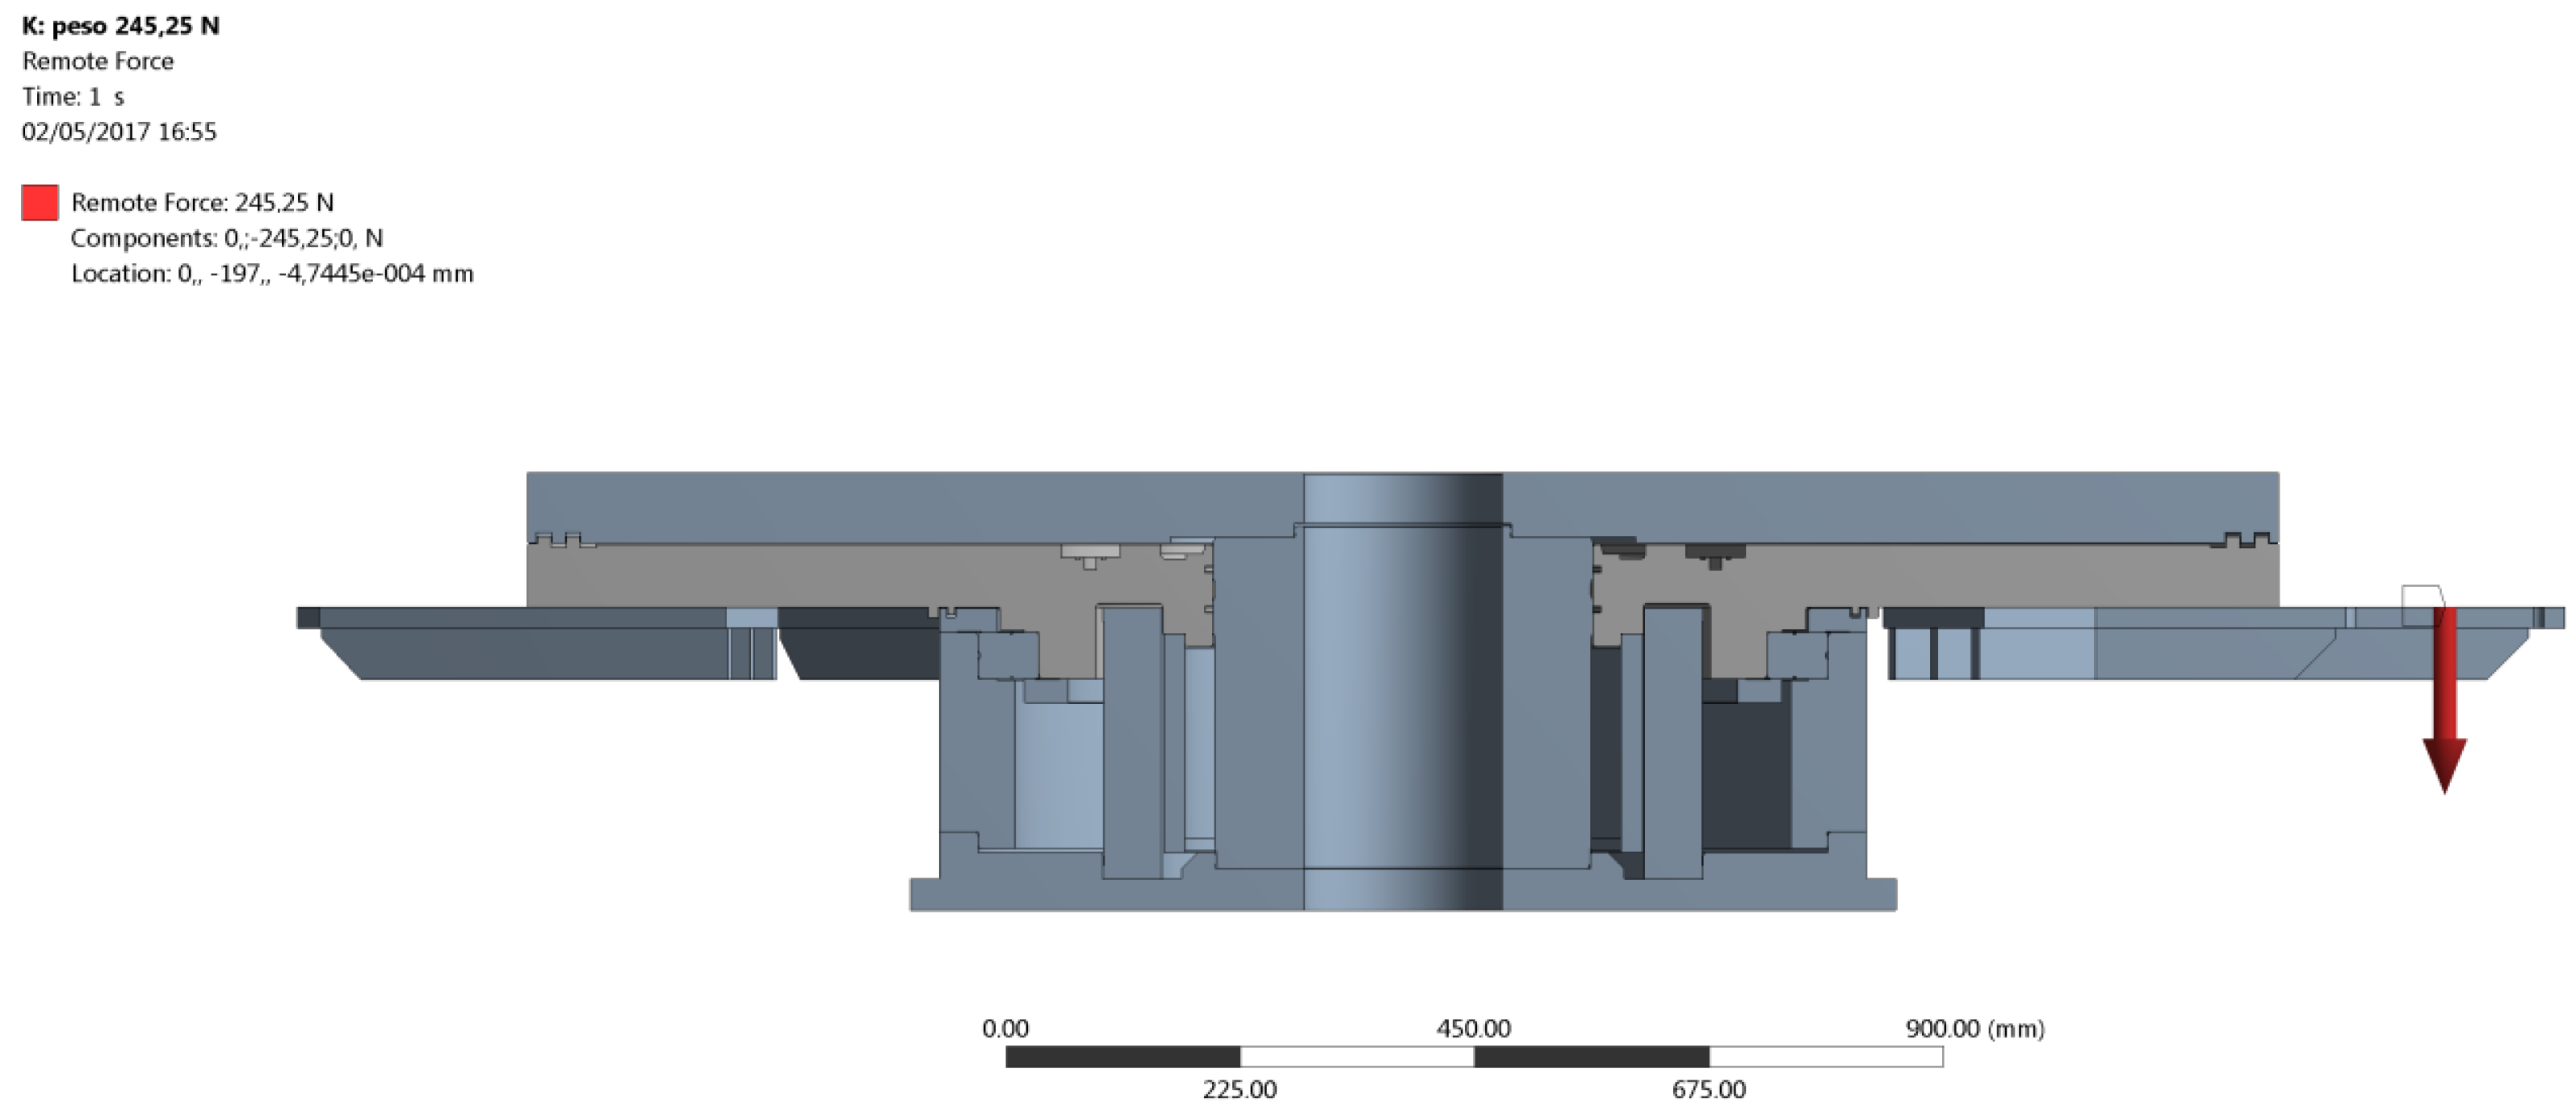
Fy is calculated according to Equation (1), where term 2 in the denominator is due to the symmetry of the model.
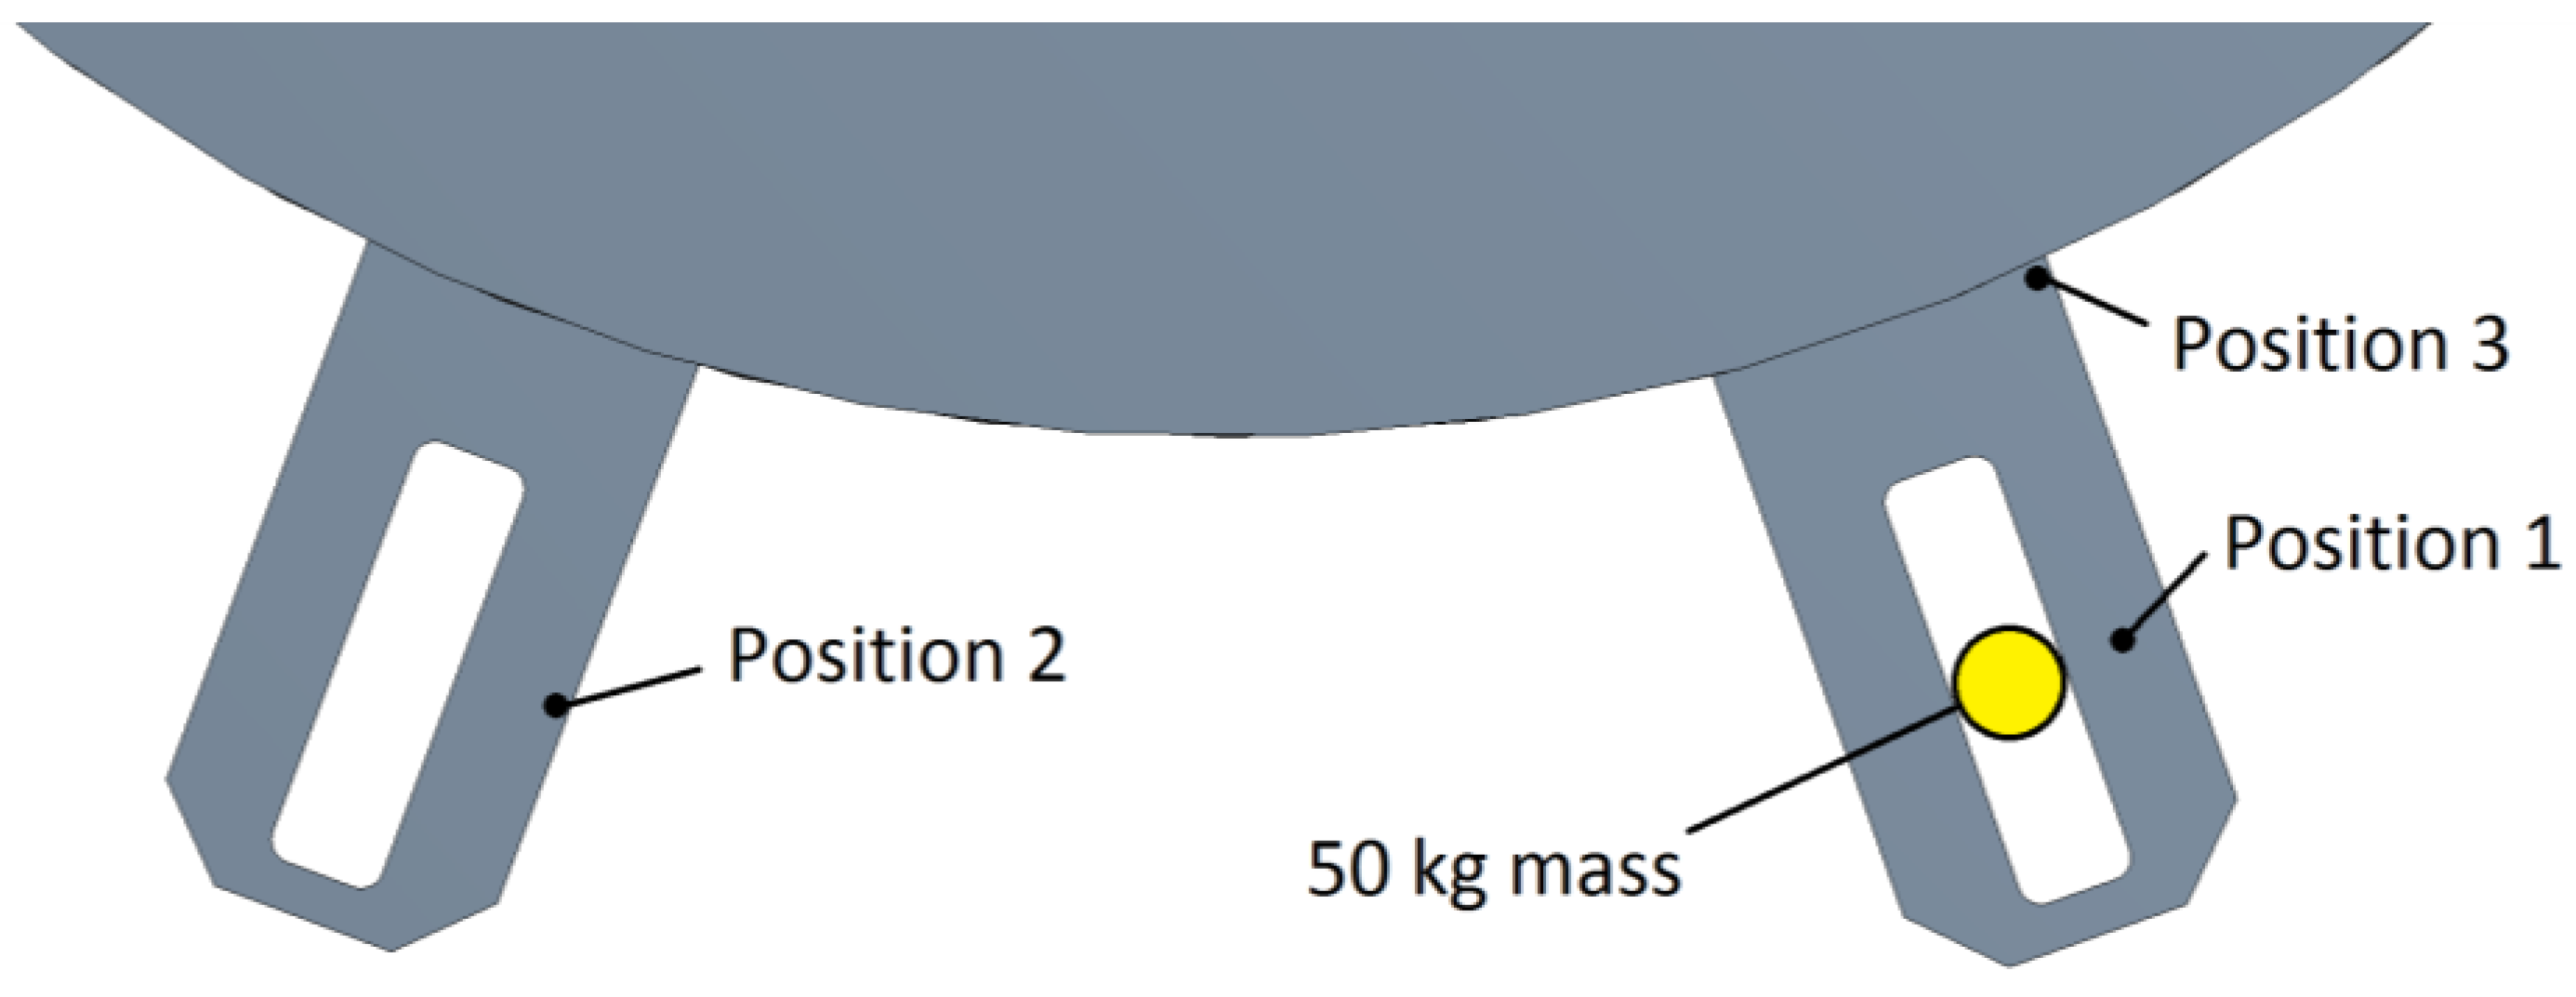
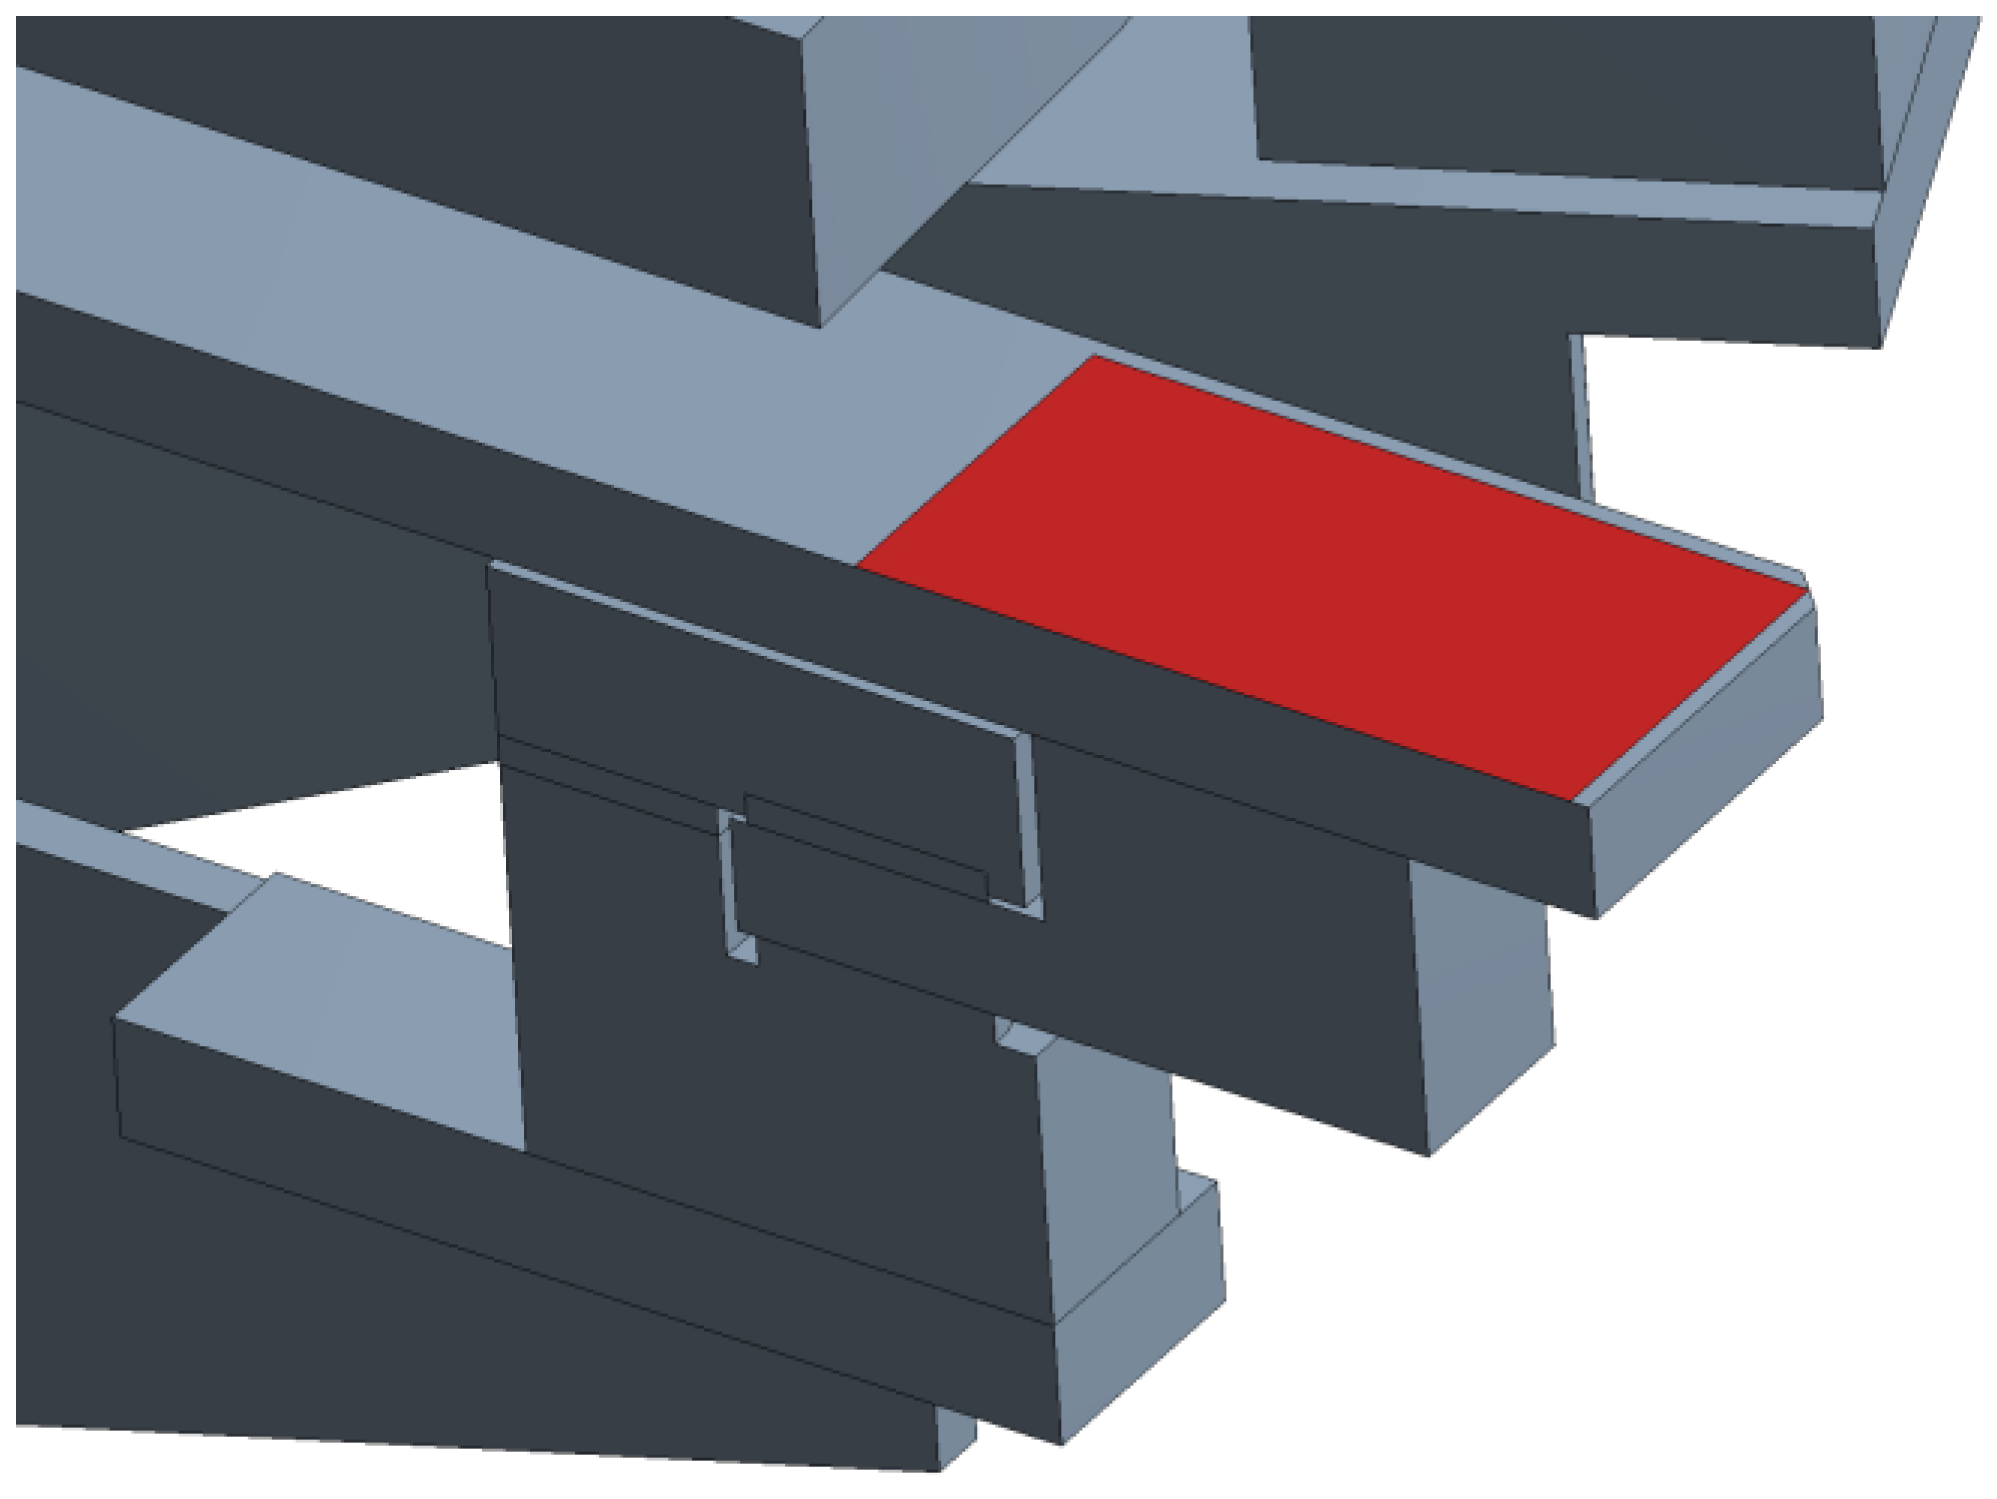
Fy acts on the upper surface of the reference support, as shown in
Figure 6.
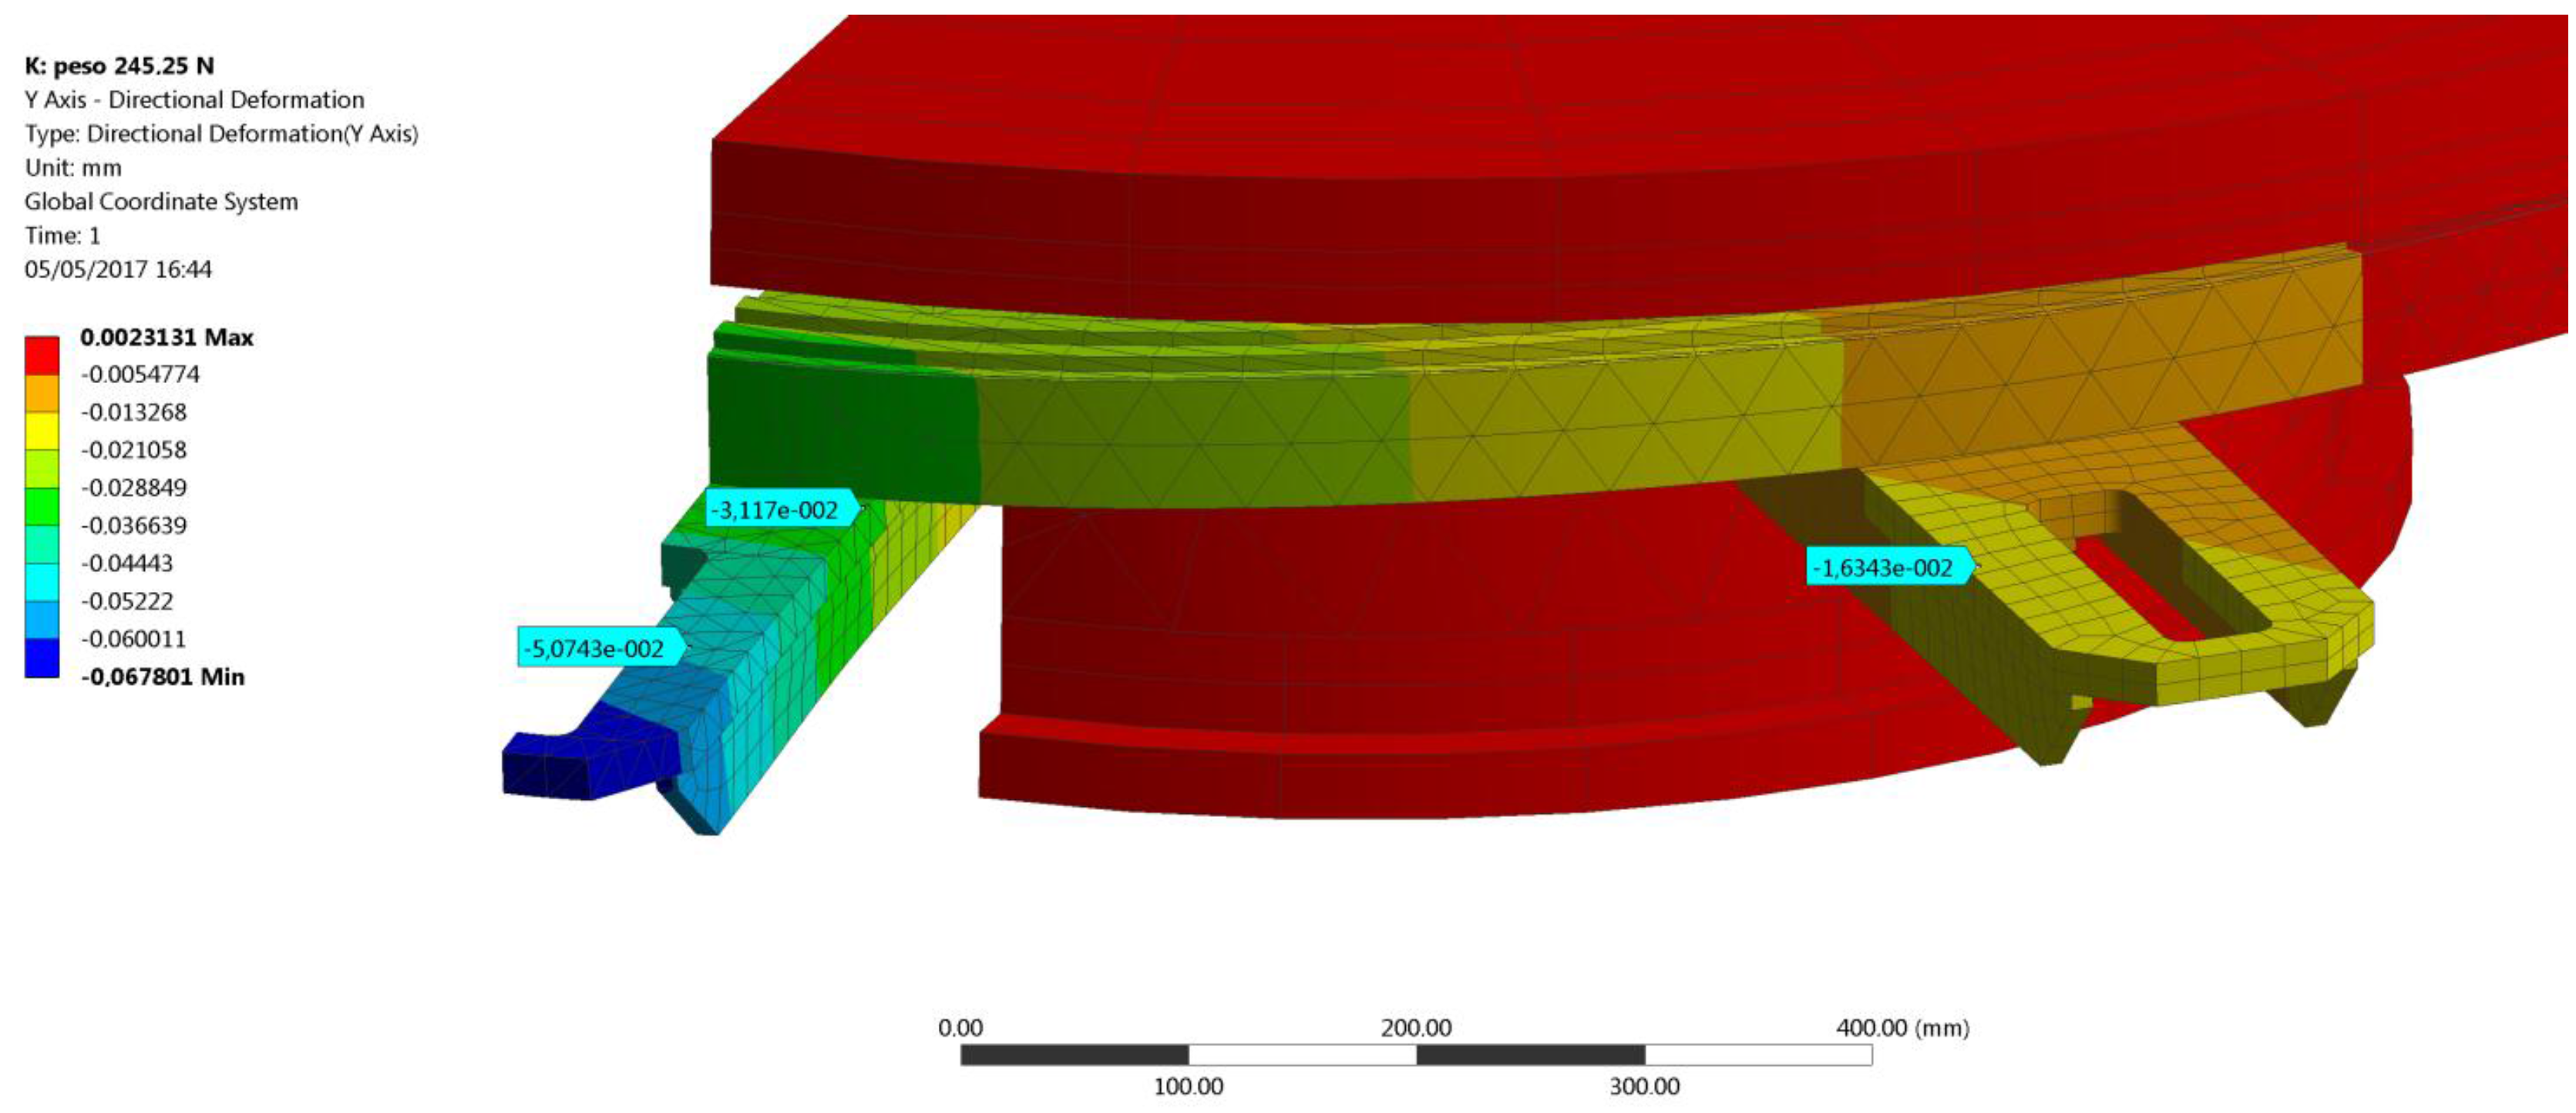
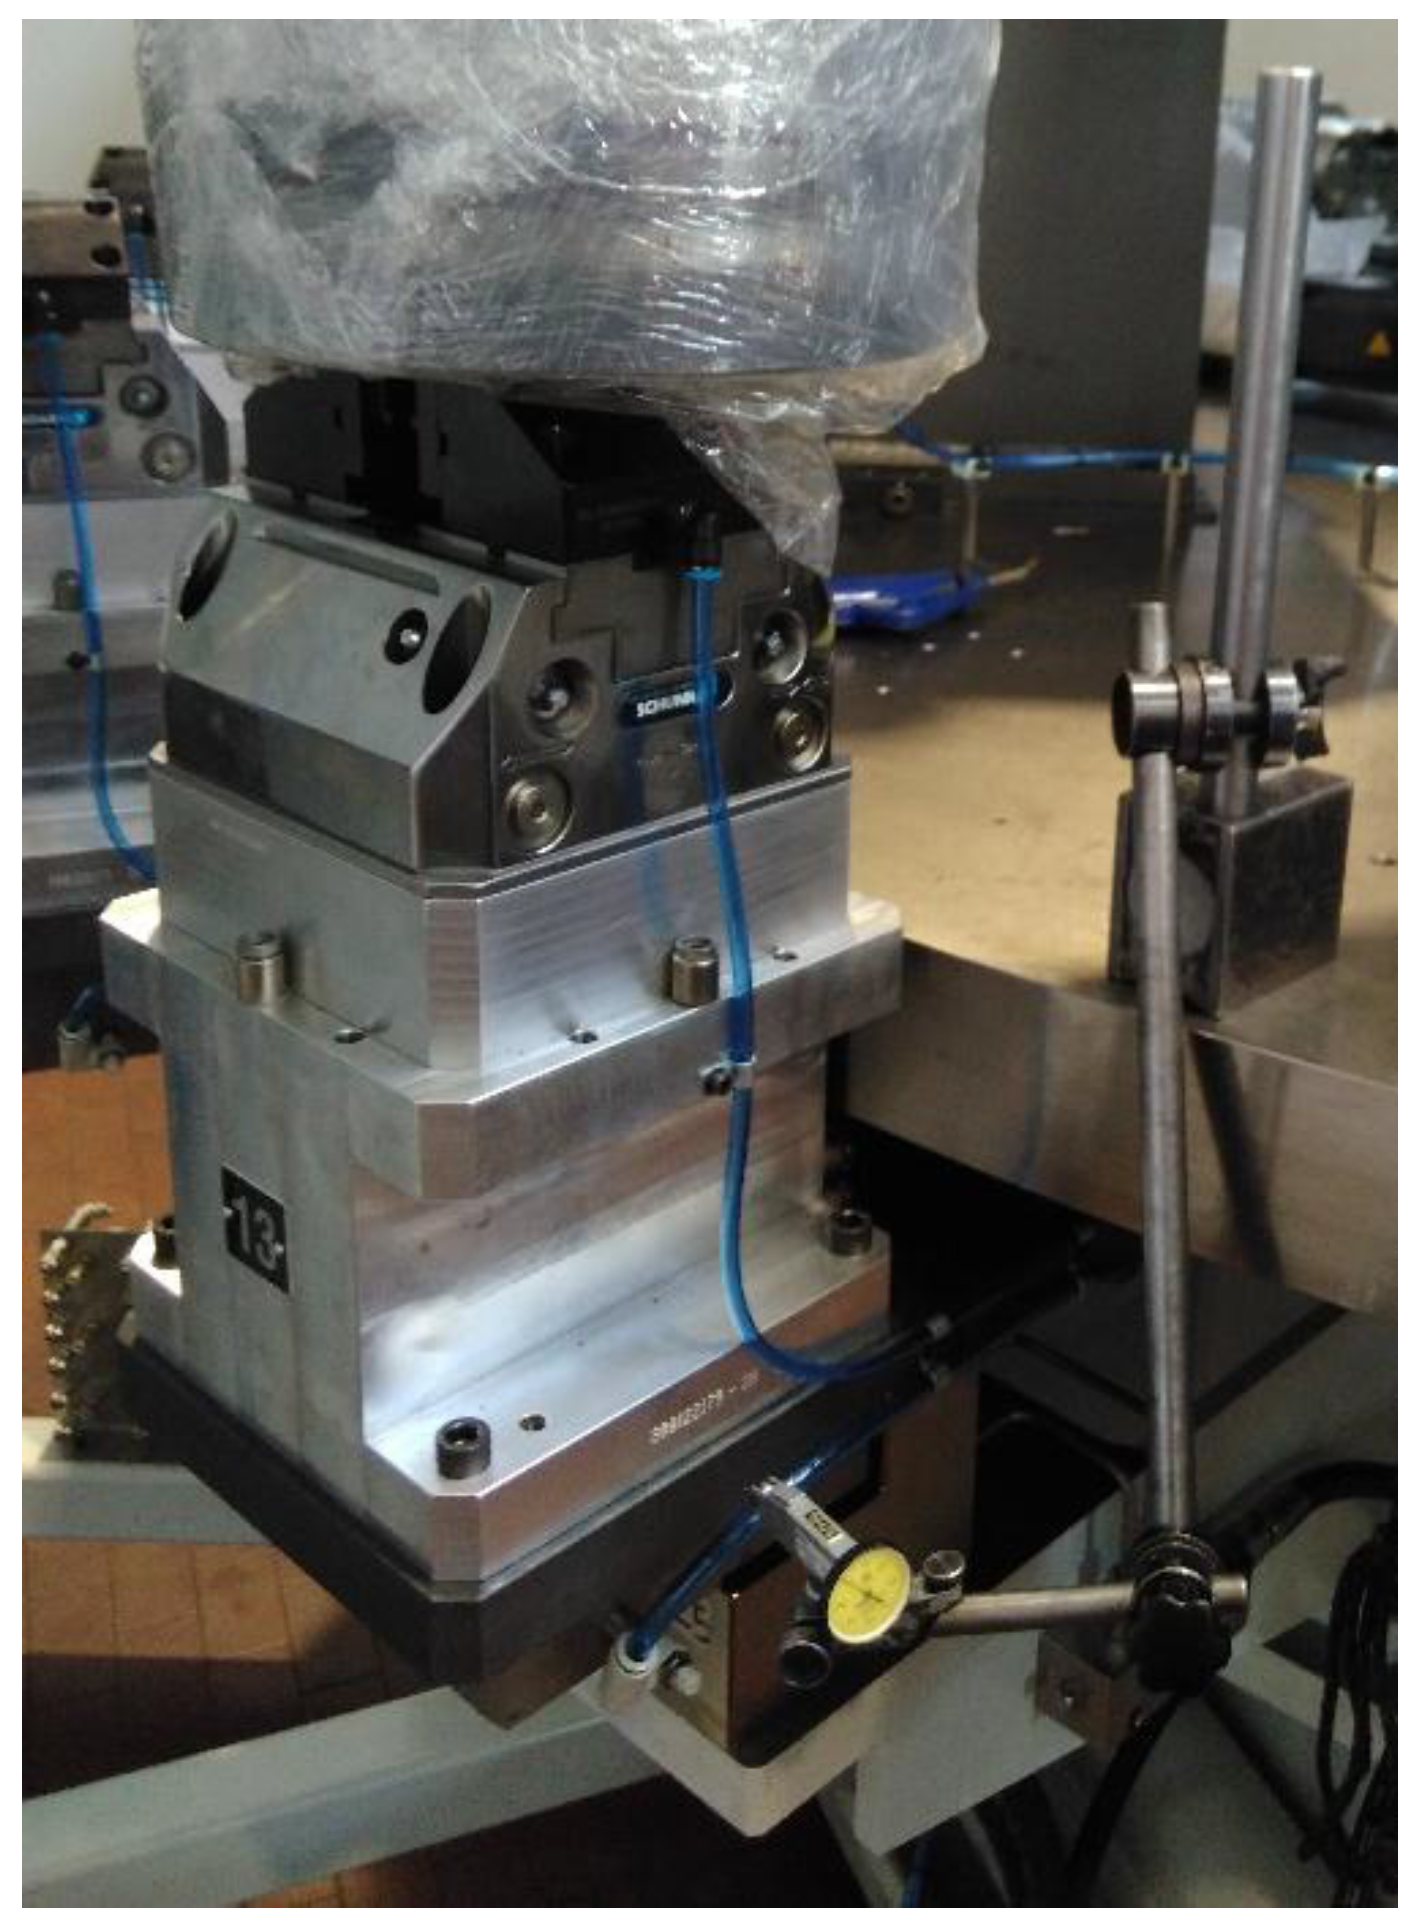
The displacements yielded by the numerical simulation and measured at the same positions of the dial gauges, are shown in
Figure 7 and summarized in
Table 2, along with the percentage error with respect to the experimental ones.
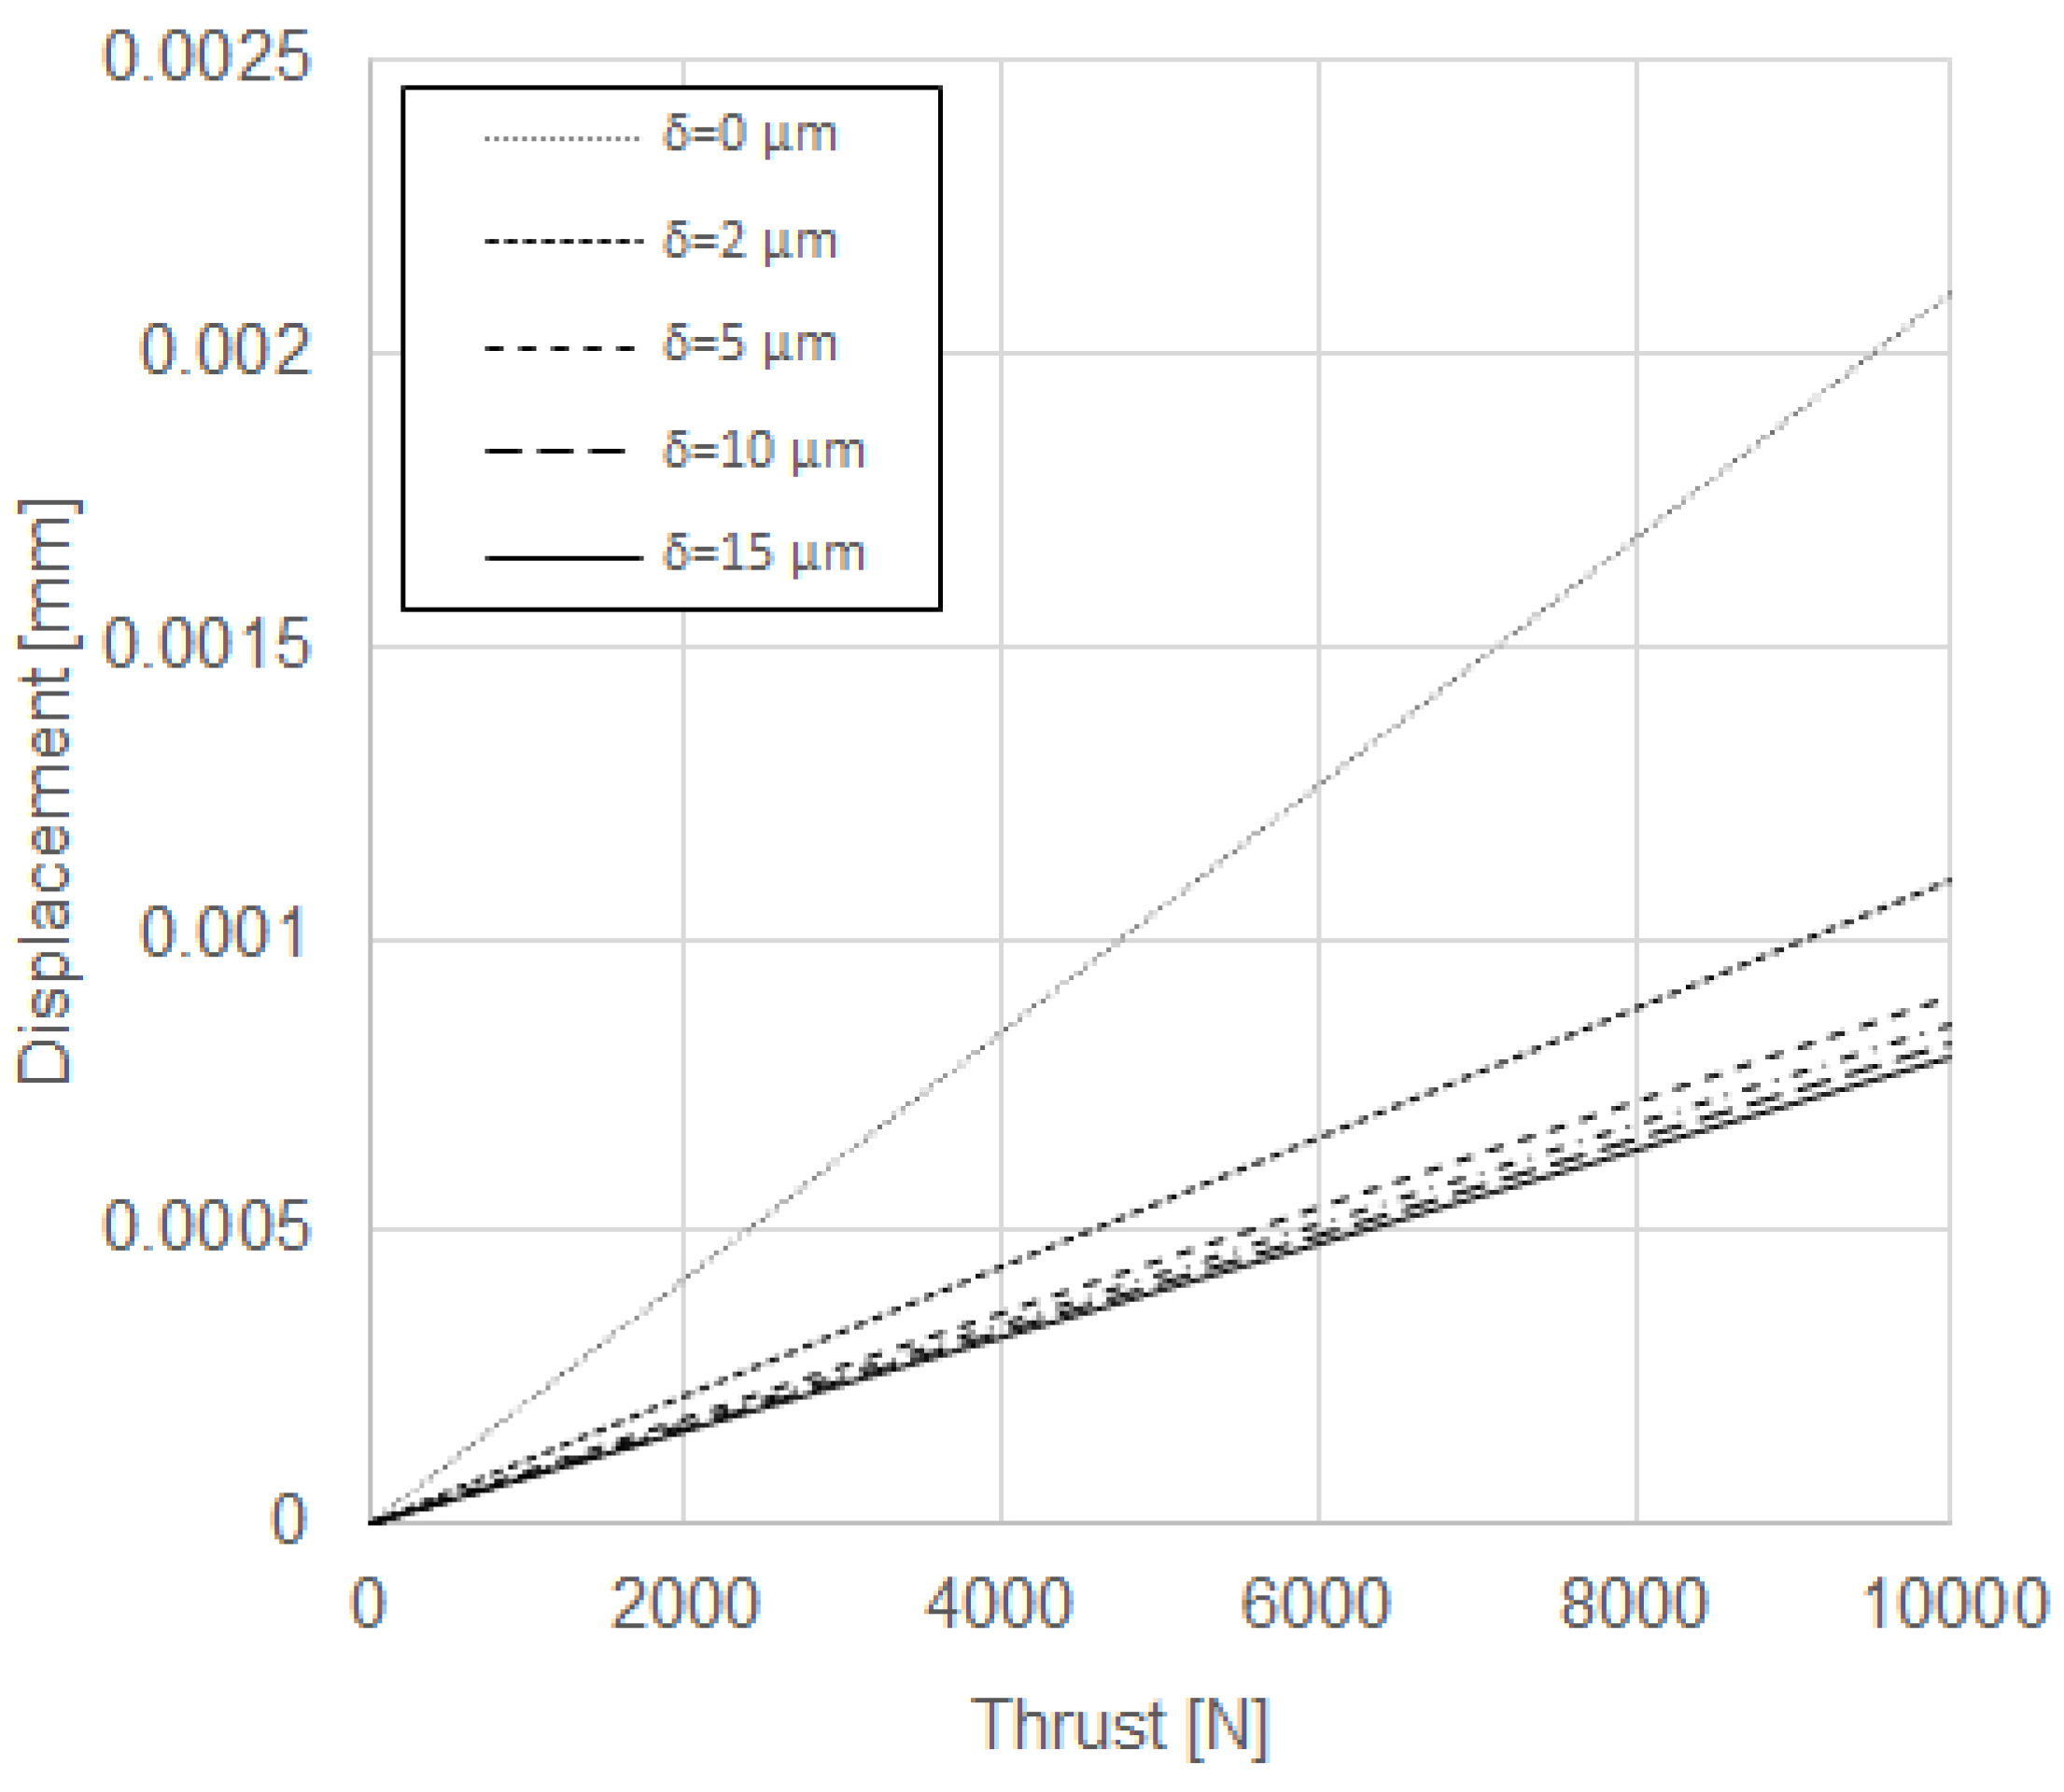
The results reveal that the numerical model, defined according to the basic settings reported above, is stiffer than the actual machine: hence, it has been decided to improve the model, by tuning the key parameters that affect its stiffness. The rotating table is supported by a double-row angular contact roller bearing. In the previous analysis, the bearing has been modeled as a unique ring made of steel: this approximation leads to overestimating its stiffness. Therefore, it has been decided to model the bearing by means of a single ring made of an elastic, isotropic material, whose Young’s modulus has to be determined upfront by the following steps. First, (i) a FE analysis of the ring alone is prepared, by assuming its elastic modulus as a parameter and the ring is constrained, replicating the actual application and loaded by an axial thrust; (ii) the displacement of the force application surface is recorded; (iii) the experimental displacement provided by the bearing manufacturer is read-in. The manufacturer usually provides plots like that shown in
Figure 8, where several curves express the axial displacement of the bearing as a function of the applied thrust load. Each curve is relevant to a value of the assembly preload
δ of the bearing: for the present application,
δ = 15 μm; (iv) the Young’s modulus of the ring is adjusted until the FE calculated displacement matches the experimental axial displacement for given axial thrust.
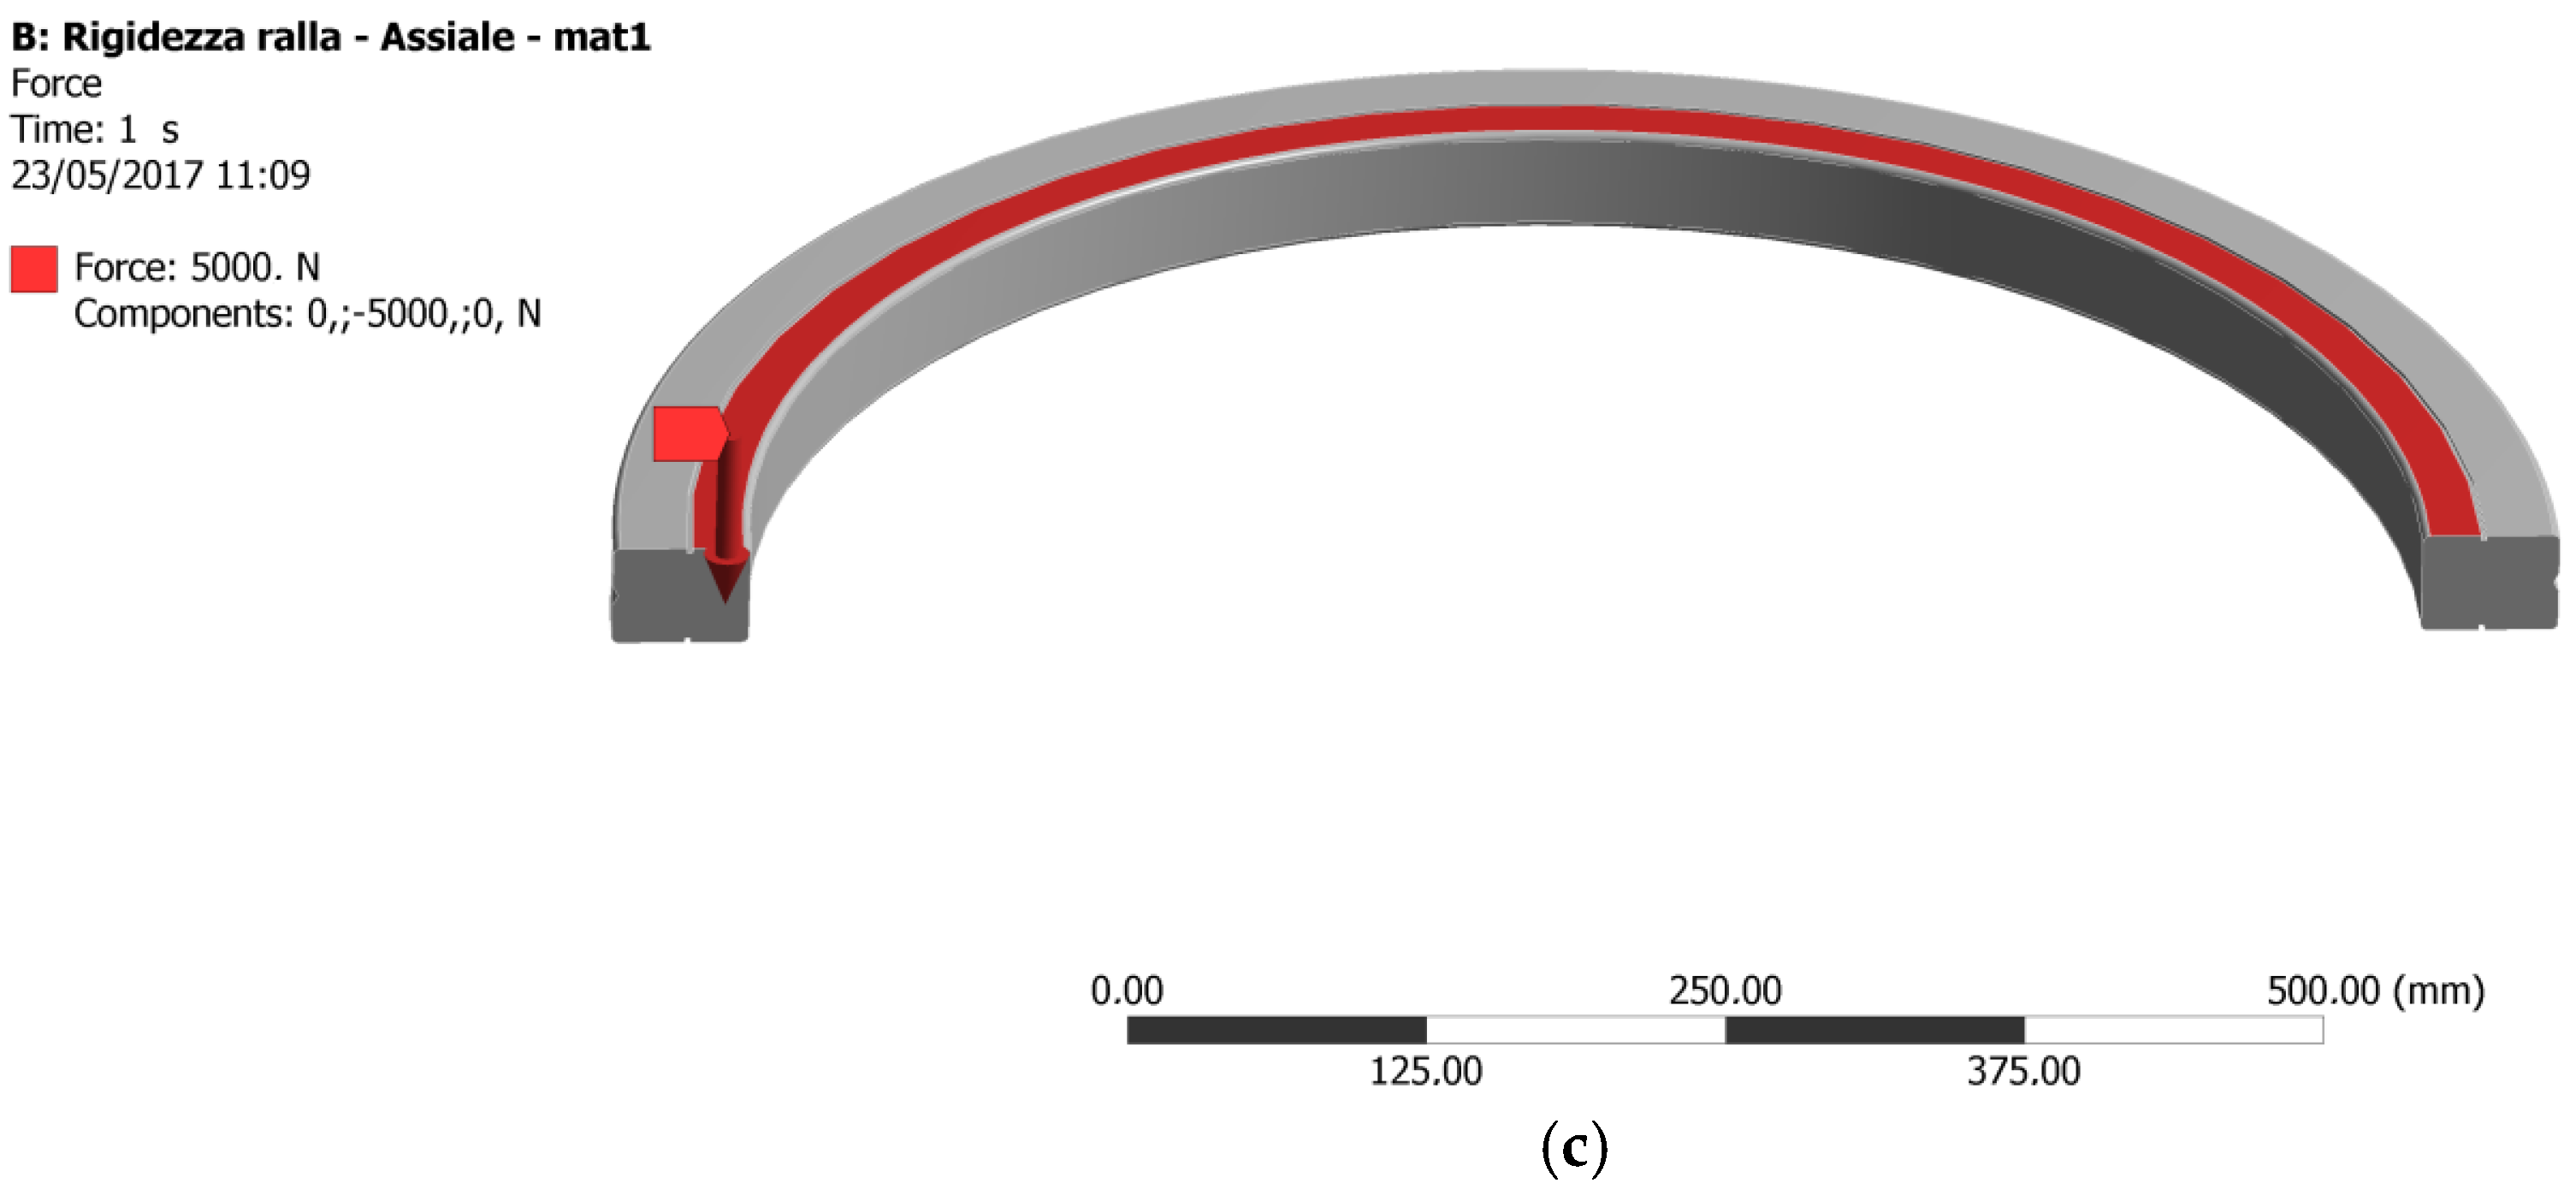
The static structural analysis has been carried out on a half-ring geometry, as shown in
Figure 9a: the ring has been constrained with a fixed support on its lower external surface
Figure 9b; the upper inner surface of the ring has been loaded with a 10 kN load (
Figure 9c).
As explained above, a set of FE analyses have been run varying the input parameter (equivalent Young’s modulus of the ring) until the displacement of the loaded surface equaled 8.5 × 10
−4 mm, which is the value reported in
Figure 8 for a thrust load of 10 kN and a preload of 15 μm. Such a displacement value was reached by setting an equivalent Young’s modulus of
Ering = 39 GPa. Then, a finite element analysis (FEA) of the whole Transfer Machine with nine divisions, including the ring with the above specified
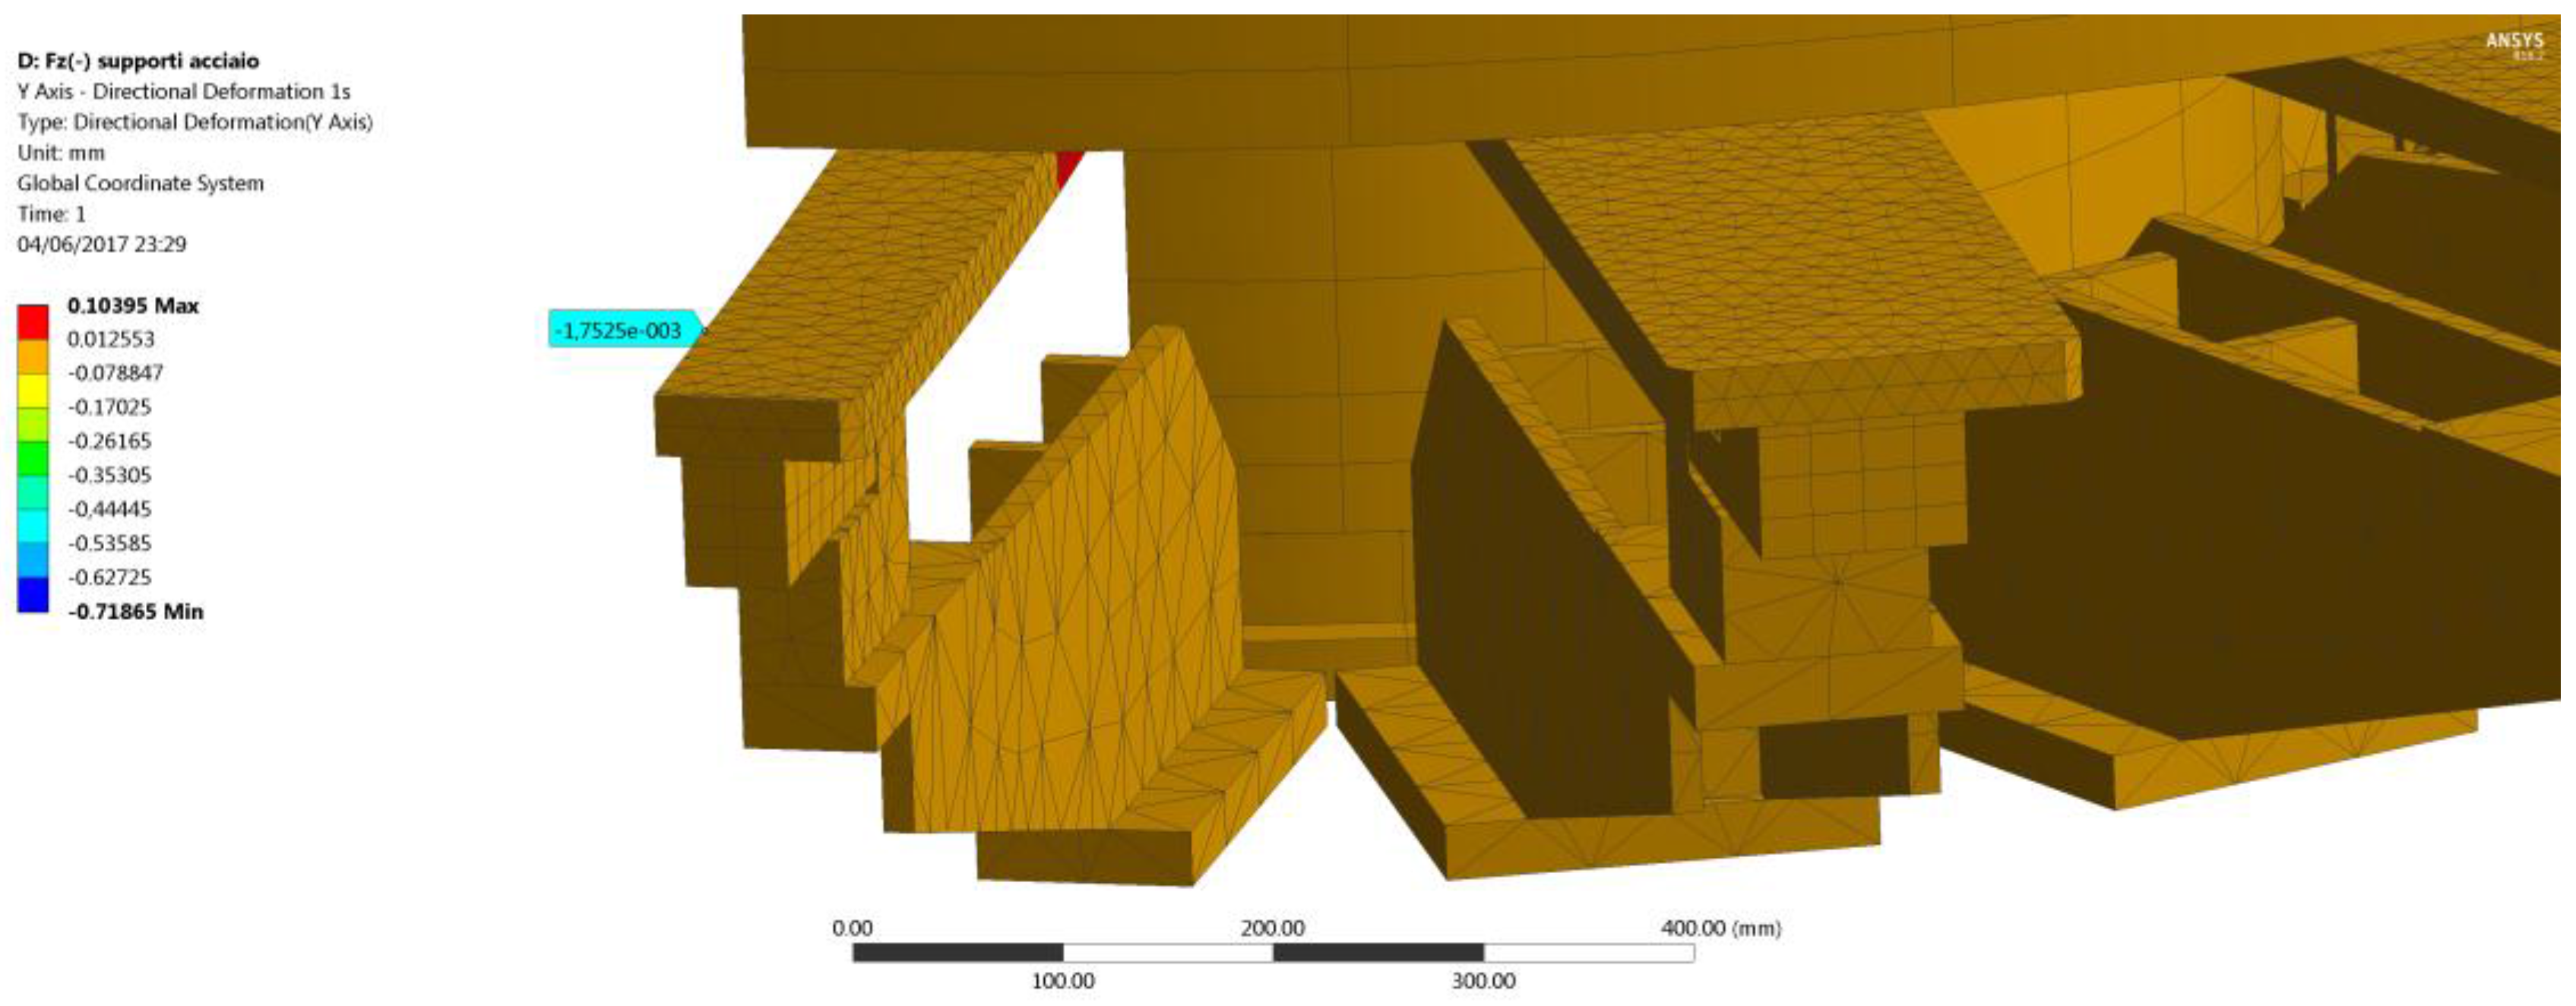
Ering, was run. The displacements at the reference points (
Figure 10) are substantially unvaried with respect to the previous simulation, with differences smaller than 1 μm in terms of displacement. Therefore, another modification had to be made to the numerical model in order to make it more consistent to the actual machine stiffness.
Since a correct estimate of the stiffness of a complex assembly is often related to an accurate modeling of its mechanical joints [
16,
17,
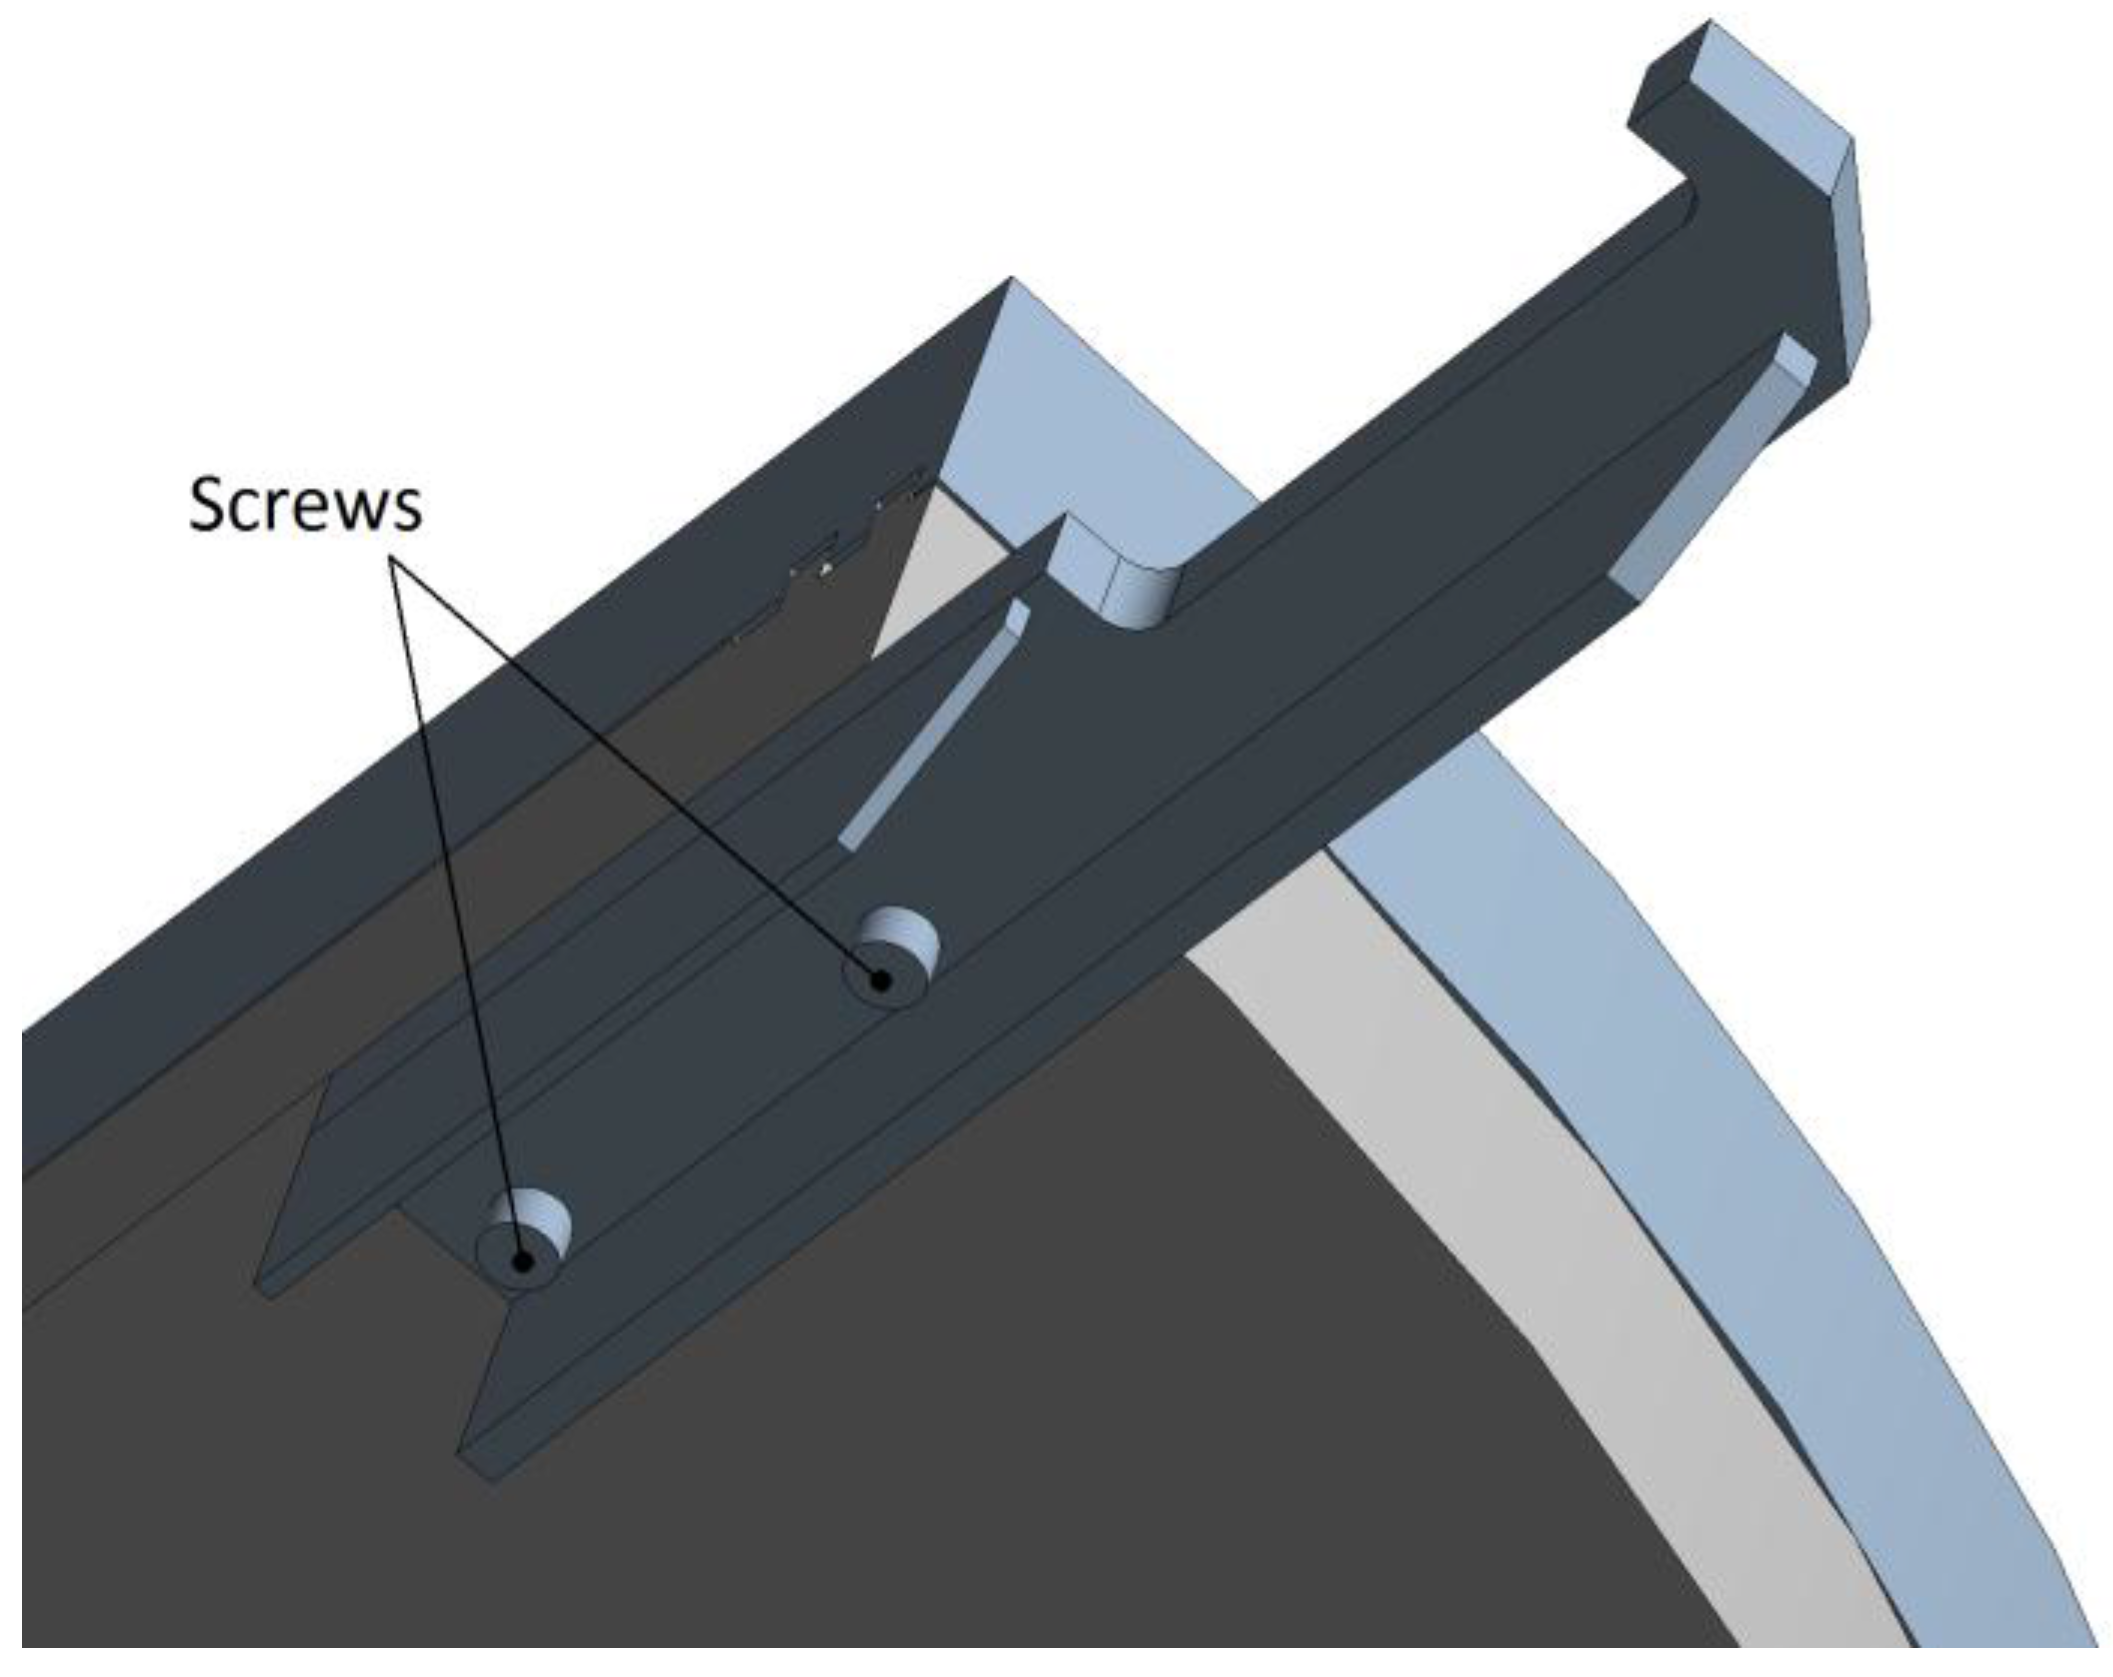
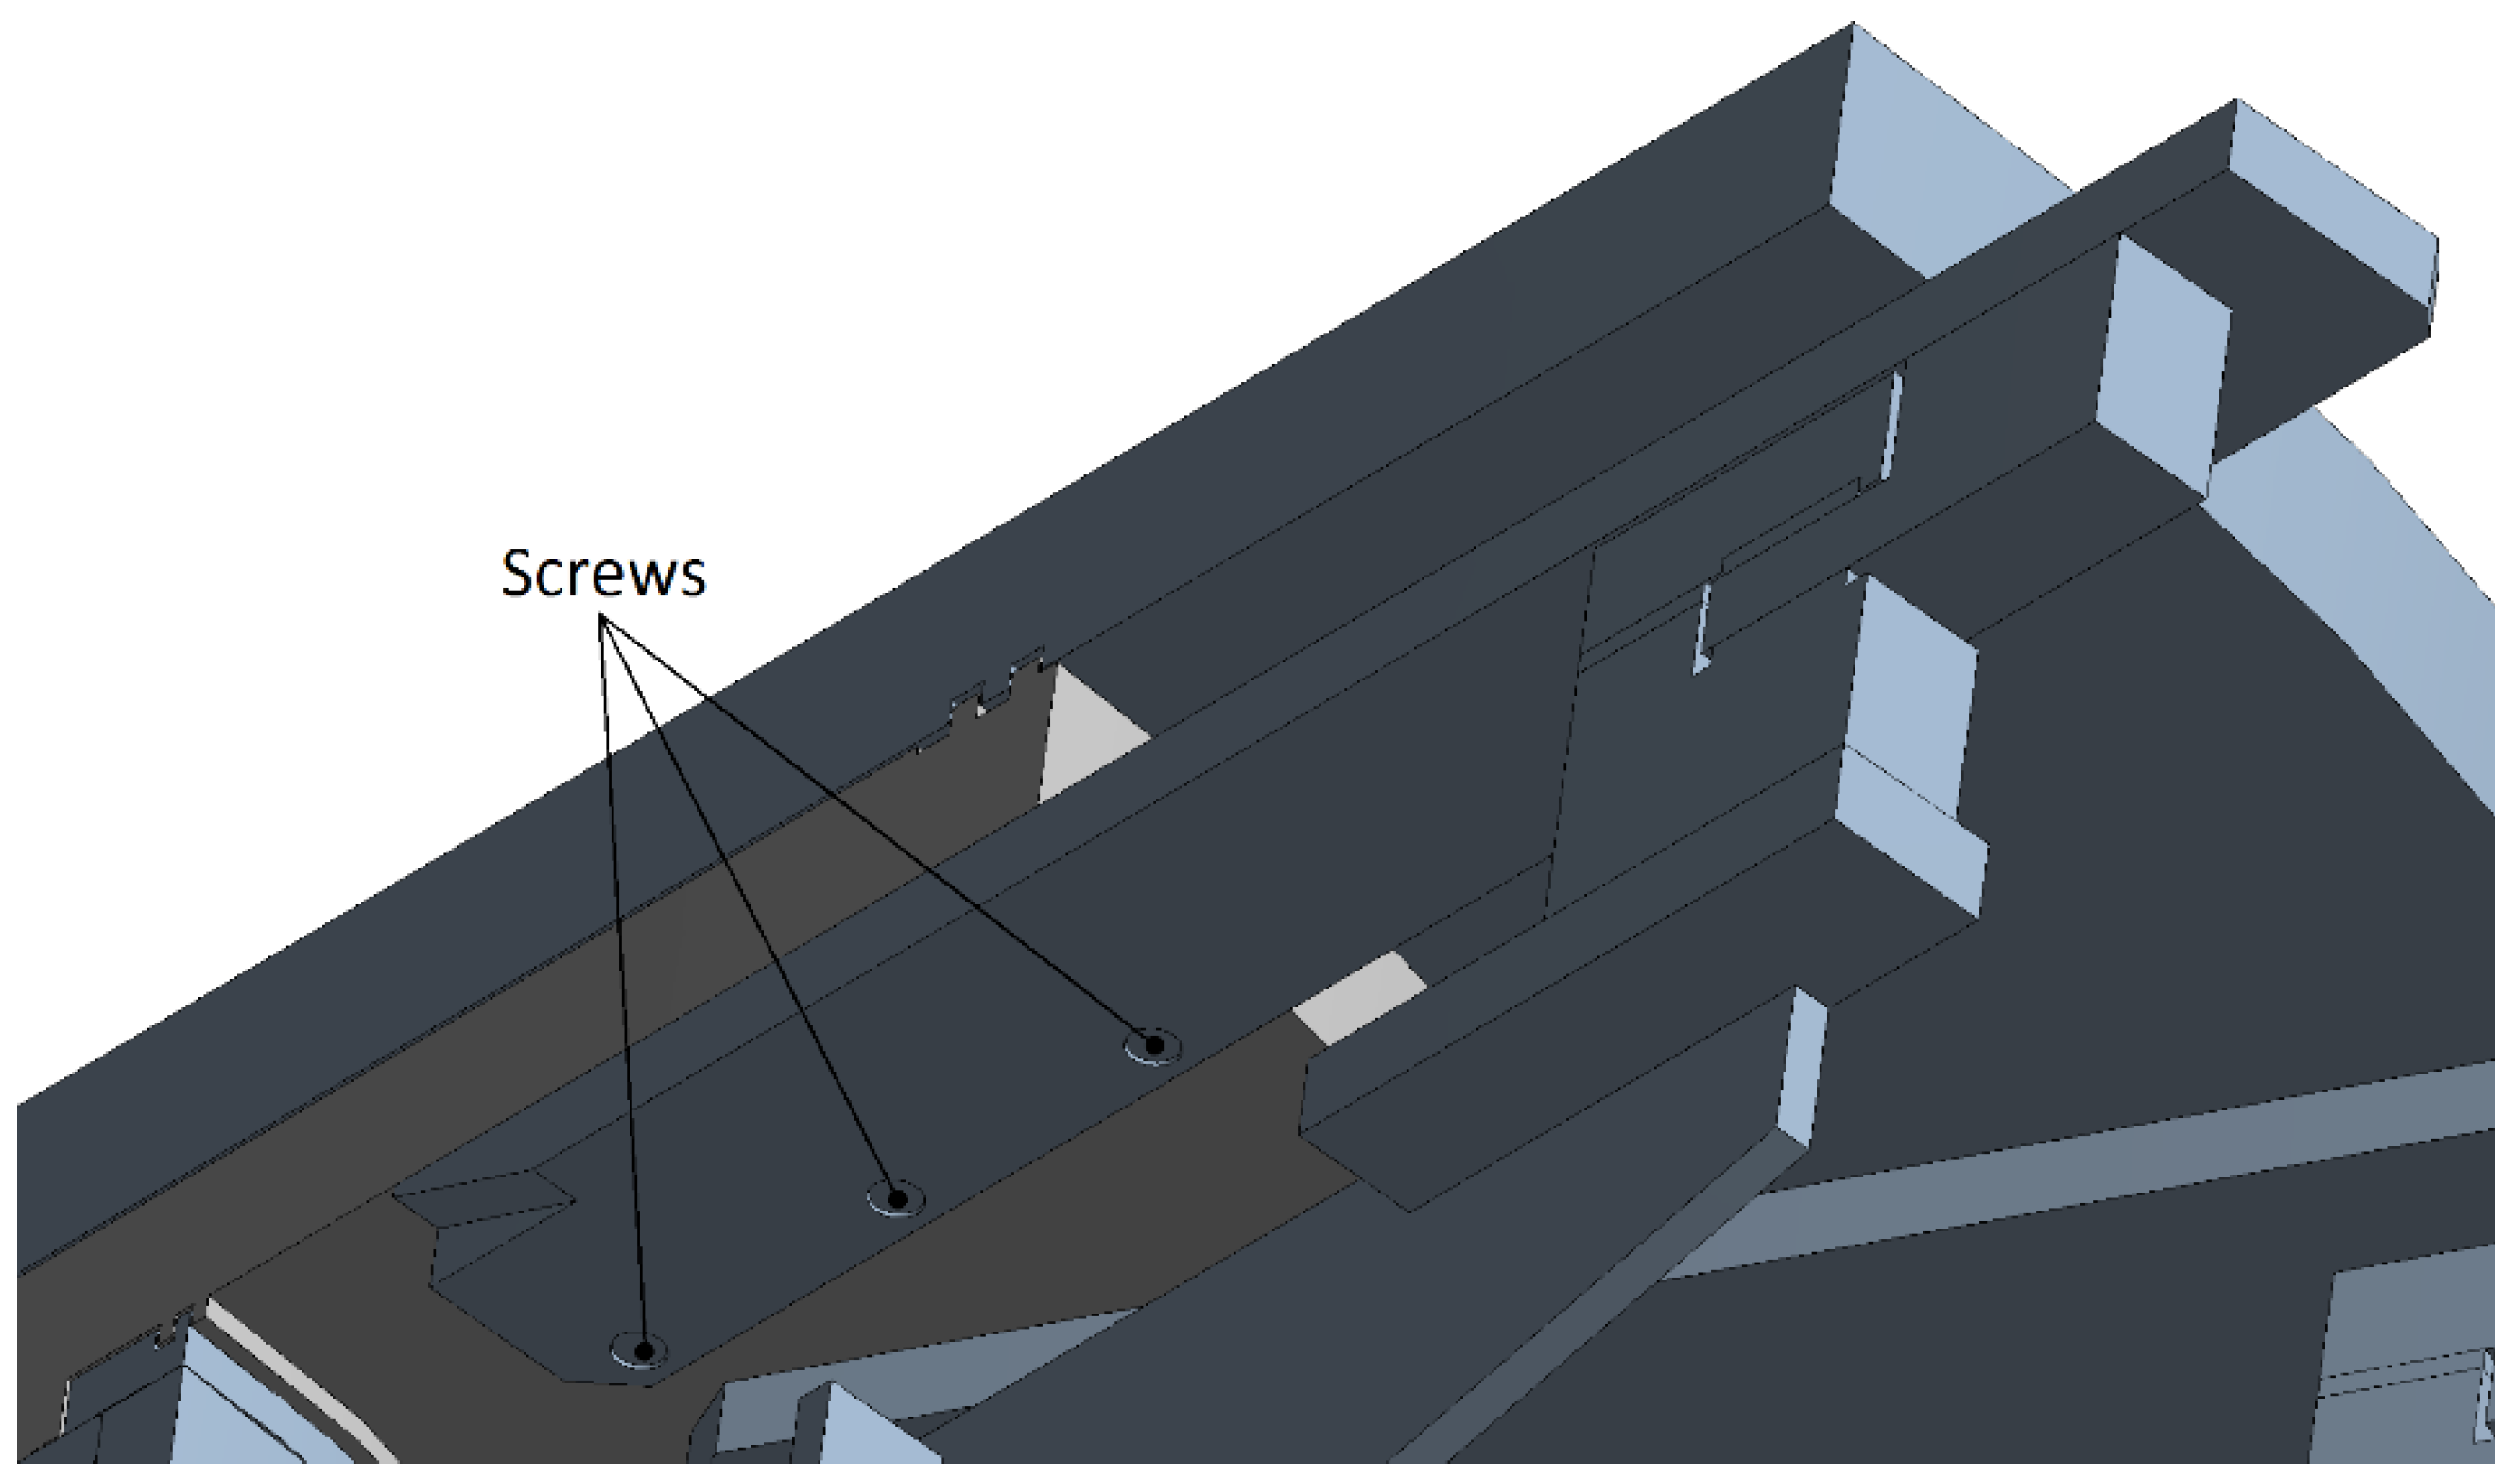
18], the contact conditions between the support and the rotating table have been modified in order to achieve a more accurate FE model. Hence, the bonded contact between the rotary table and the support has been replaced by a set of four M12 12.9 class screws (
Figure 11): this bolt pattern replicates that being actually used on the Transfer Machine with nine divisions. The screws have been modeled as solids, and the axial preload has been imposed by the bolt preload tool available in the Ansys Workbench environment.
The contact at the interface between the support and the rotating table, as well as the one between the underhead of the screws and the support, has been set as frictional, with a friction coefficient
μ = 0.2 [
19]. The contact formulation has been set as pure penalty with a normal stiffness factor controlled by the software (FKN = 1). The terminal portion of the shank and the “threaded” hole on the rotating table have been joined by means of a bonded contact. The analysis has been divided into two steps: at the first step, a preload of
Fi = 70 kN has been assigned to each screw: this preload is calculated, based on a tightening torque
T = 106 Nm and oiled surfaces,
μm = 0.10 [
20,
21,
22,
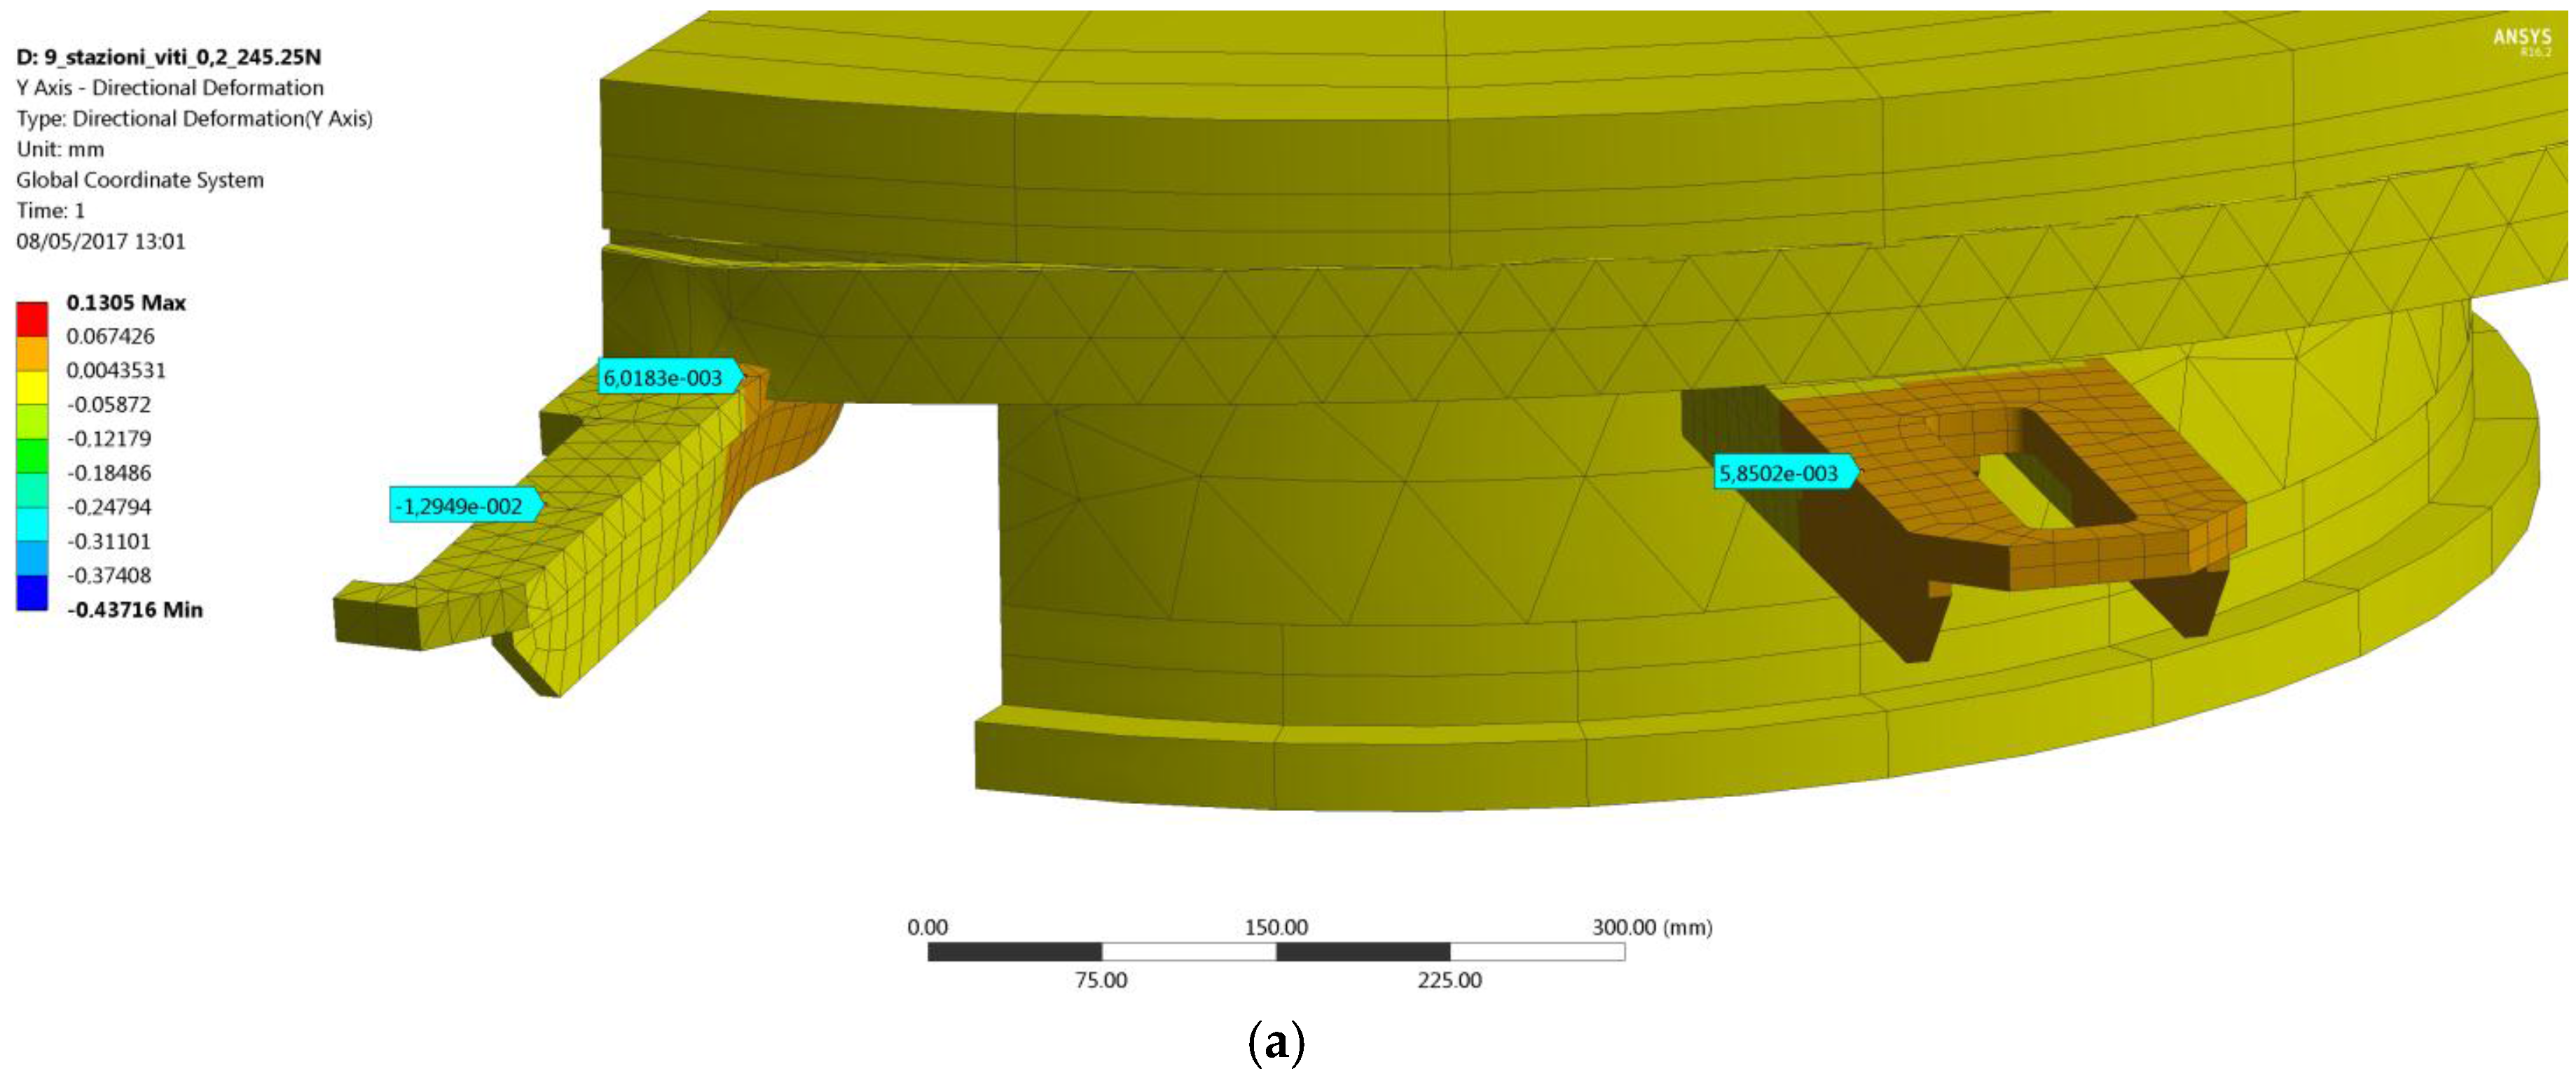
23], as for the company’s assembly specification. The displacements retrieved at this step are shown in
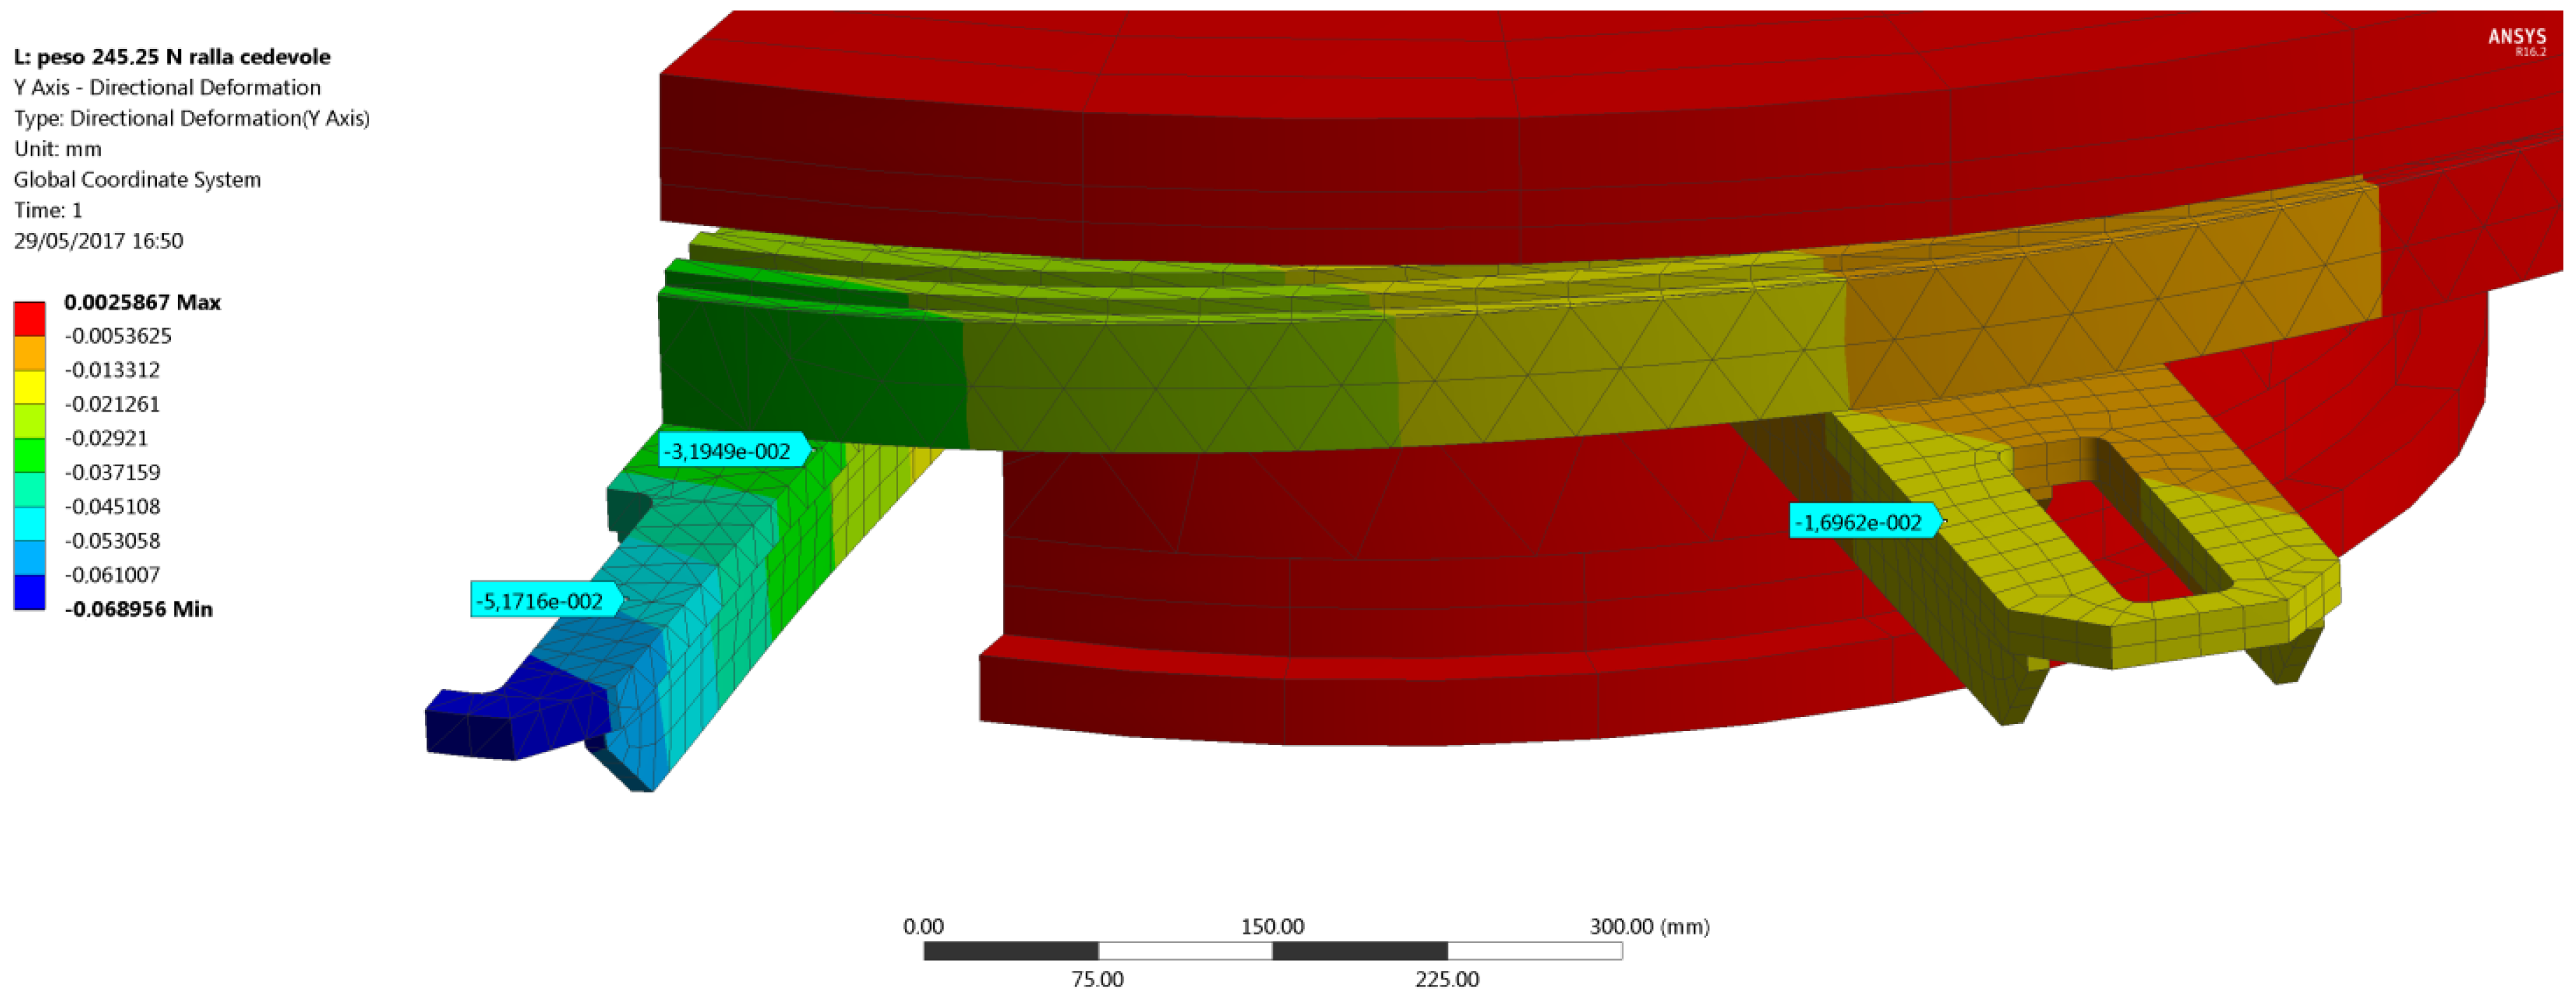
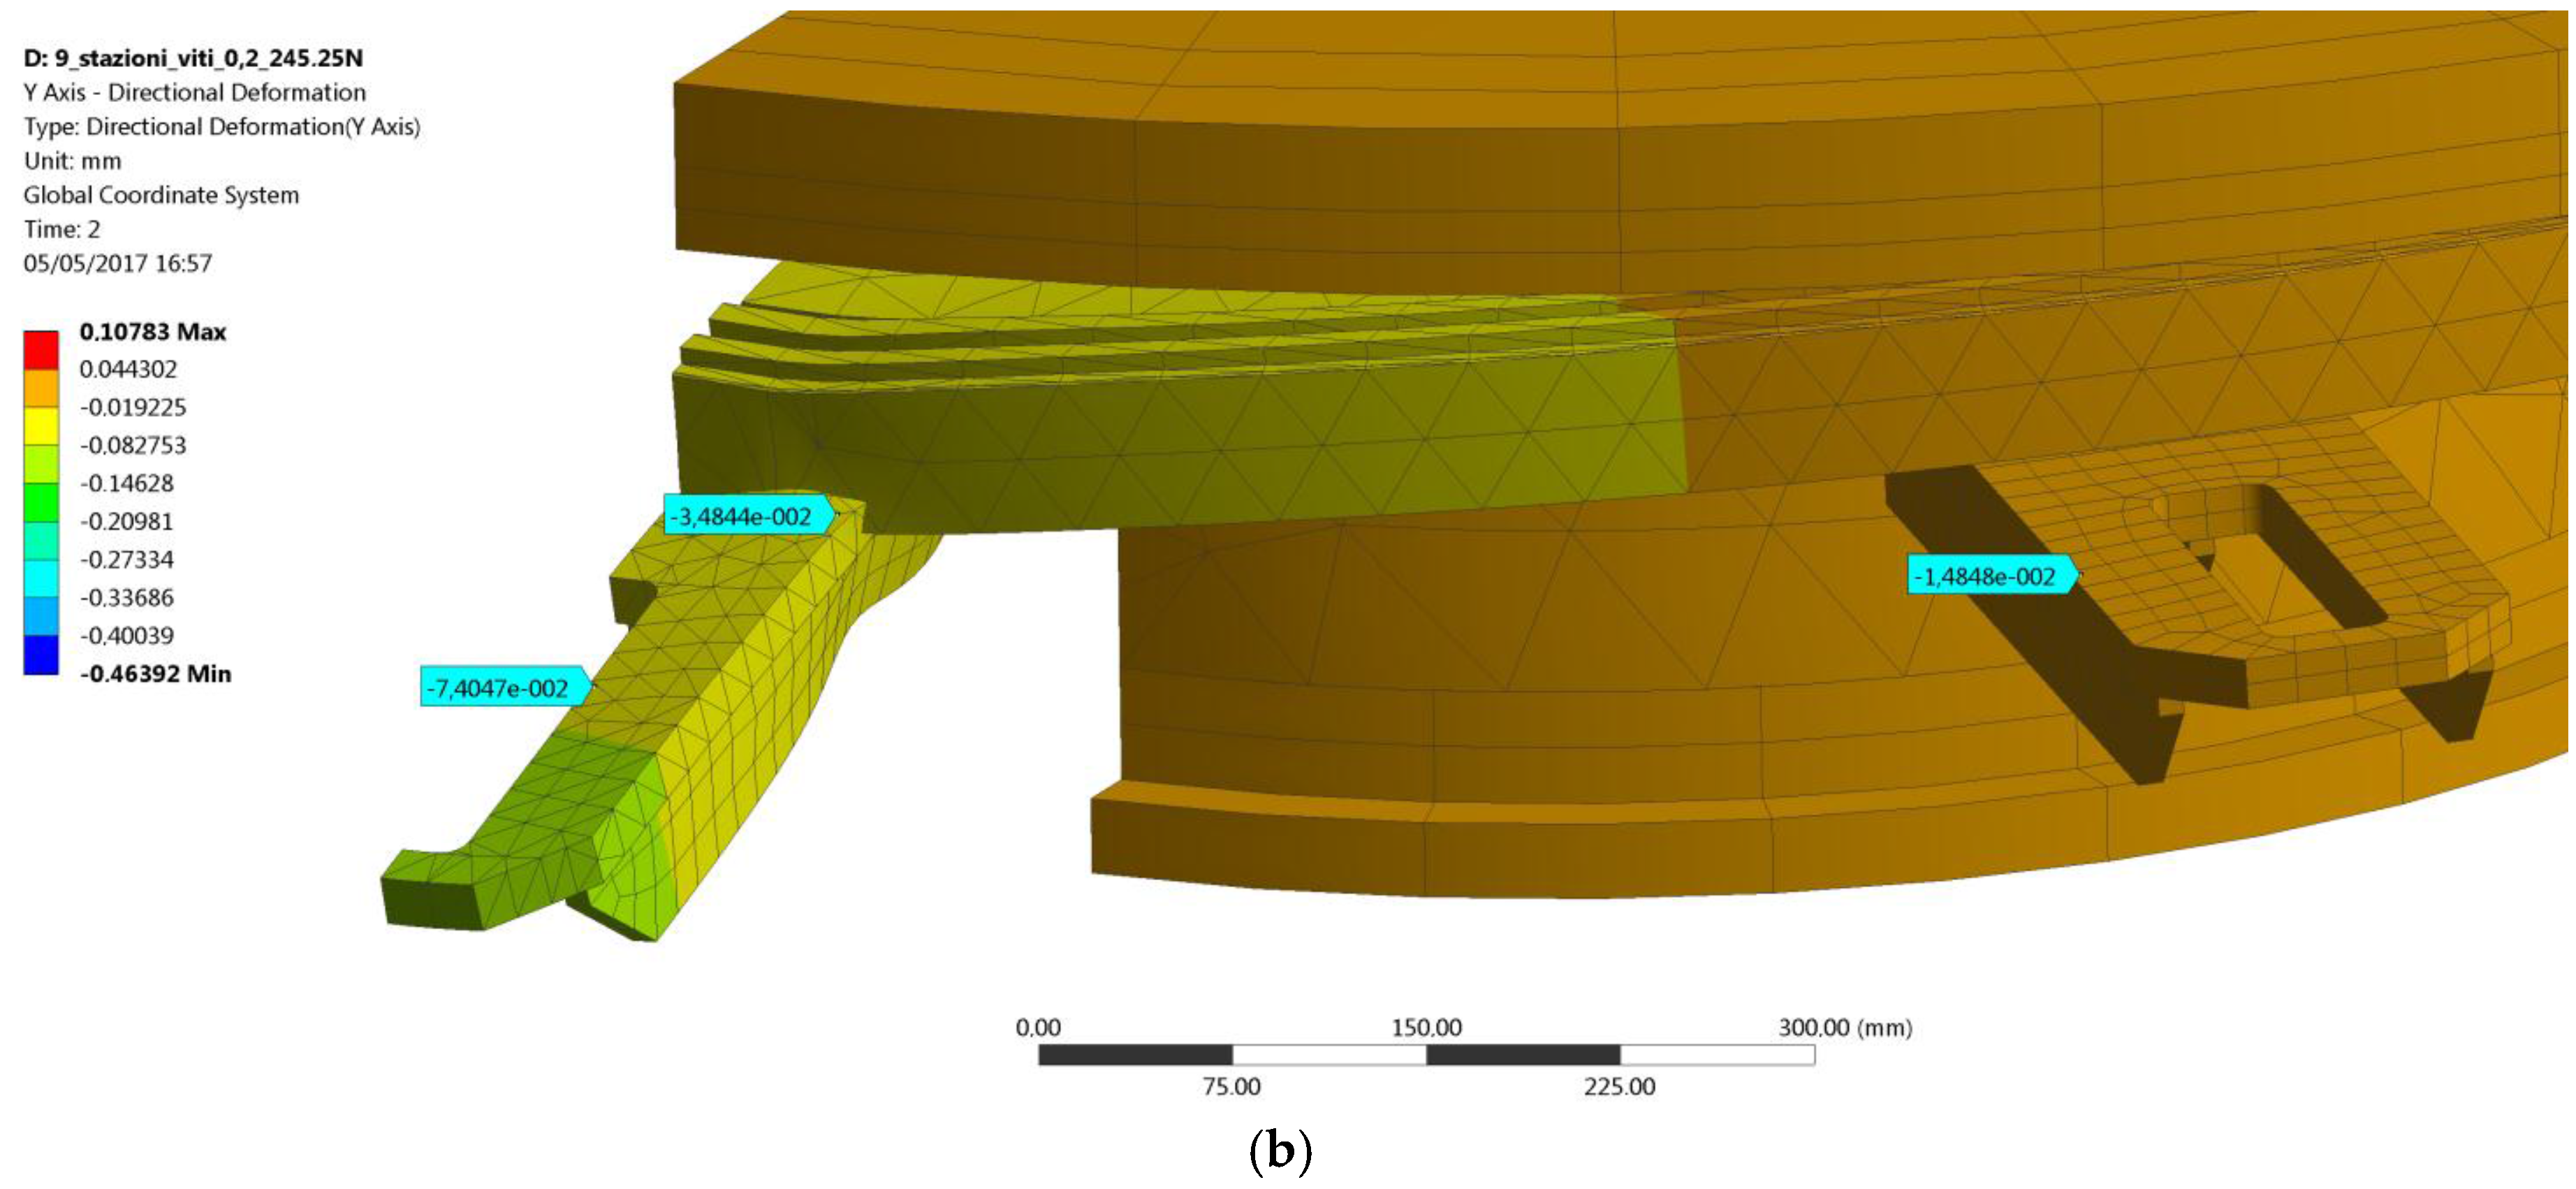
Figure 12a. A vertical force
F = 245.25 N has been added at the second step of the analysis with the bolt preload still acting (lock option set as active in the Ansys WB bolt preload tool). The difference between the displacements recorded at the end of the second step (
Figure 12b) and at the end of the first step gives the displacements due to the effect of the external load only, as explained by Equation (2):
Looking at the data in
Table 3, relevant to the new FE model, the maximum absolute value of the percentage error is 5% and it is normalized with respect to the displacement at position 2, which is not located on the loaded support but on the adjacent one. Conversely, the errors recorded at the loaded support are of a small entity and stay lower than 3%. In light of the results above, the FE model can now be deemed as validated.
