Article

Magnetic Measurements of a Stator Core Under Manufacturing Influences and the Impacts on the Design Process of a Reluctance Synchronous Machine

1
Institute for Power Electronic Systems (ELSYS), Technische Hochschule Nürnberg Georg Simon Ohm, 90489 Nuremberg, Germany
2
Institute of Innovative Drive Technology, Flensburg University of Applied Sciences, Kiel University, 24943 Flensburg, Germany
3
Faculty of Engineering, Kiel University, 24118 Kiel, Germany
4
BEN Buchele Elektromotorenwerke GmbH, 90419 Nuremberg, Germany
5
Institute of Electrical Energy Conversion, University of Stuttgart, 70569 Stuttgart, Germany
*
Author to whom correspondence should be addressed.
Machines 2025, 13(9), 761; https://doi.org/10.3390/machines13090761
Submission received: 30 June 2025 / Revised: 13 August 2025 / Accepted: 21 August 2025 / Published: 25 August 2025
(This article belongs to the Special Issue Advanced Control Strategies for Magnet-Free Synchronous Motors)

Abstract

The magnetic properties of electrical steel sheets, crucial for efficient electrical machine performance, deteriorate through manufacturing processes. This study investigates the impact of different manufacturing steps on magnetization behavior and specific core losses in M270-50A electrical steel, and their influence on the performance of a reluctance synchronous machine (RSM). Magnetic measurements were conducted on three material states: laser-cut strips, assembled stator cores, and press-fitted stator cores. These were integrated into finite element analysis (FEA) models, including an extended two-region stator model that separates yoke and tooth regions to reflect different manufacturing effects. Simulations examined torque characteristics and flux linkage under various loading conditions and were validated using a prototype machine. The findings of magnetic measurements indicate that manufacturing-induced stresses significantly increase magnetization demand and core losses—up to 650% and 53%, respectively. These effects lead to a 4.2% reduction in maximum air gap torque and notable changes in torque characteristic curves and d-axis flux linkage maps. Including realistic magnetic data yielded torque predictions closely aligned with experimental results and reduced discrepancy in core loss simulation by more than 50%. The study’s findings indicate that accounting for manufacturing influences in material characterization enhances modeling accuracy and enables optimized electrical machine designs and control strategies.

1. Introduction

The performance and control of electrical drives rely on electrical steel sheets, valued for their low core losses and high magnetic permeability. Each manufacturing stage gradually degrades these magnetic properties. In the preliminary stage of the production process, cutting the laminations exerts a deleterious influence on the magnetic properties [1,2,3]. The two most commonly used cutting methods in industrial manufacturing and prototype construction are punching and laser cutting. Punching changes the microstructure in the area of the cut edge by introducing local mechanical stresses [1,4,5]. Laser cutting changes the microstructure of the edge zone mainly through heat input, which also leads to local mechanical stresses [5,6].
Axial stacking further reduces magnetic performance. In addition to packaging methods such as interlocking [7,8] and back-lack bonding [9,10], welding is a frequently used method for producing stator stacks. The choice of welding process, along with the number of weld seams, can cause the substantial degradation of the magnetic properties [11,12,13,14,15].
The final manufacturing step for a laminated core typically involves pressing it into a casing for mechanical fastening and torque transmission. This press fit introduces additional mechanical stresses to the stator core, further degrading its magnetic properties [16,17,18,19,20]. Studies in [21] have also shown that ferromagnetic conductive casings can cause additional losses, especially in highly saturated machines. An investigation in [19] found that shrink fitting a permanent magnet motor increased core losses by 30% and reduced maximum permeability by 50%. Preliminary tests in [22] on laser-cut stator laminations pressed into test casings—without axial connection—showed magnetization demand rising by up to 270% at 50 Hz , with specific core losses increasing by up to 42%. Despite these findings, the impact of such manufacturing effects on overall machine performance and controllability remains largely underexplored.
This study demonstrates how magnetic measurements from a manufactured stator core can improve the design and calculation of an electrical machine. Many control concepts rely on flux linkage maps [23,24], yet most data for electrical steel sheets come from manufacturer specifications that ignore manufacturing effects. To address this gap, we perform magnetic measurements on a strip sample, a stator core, and a pressed-in stator core. The test machine is a 4-pole reluctance synchronous machine (RSM) from [25] designed with various magnetic material definitions.
The primary objectives are to calculate flux linkage in the d- and q-axes and air gap torque, and to compare these results with prototype measurements. We also compare calculated and measured core losses at the rated operating point.

2. Experiment Description

The test requires magnetic data from unaffected electrical steel sheets as well as magnetic data after various manufacturing steps. The grade M270-50A is used in the stator of the RSM under investigation. An overview of the electrical steel sheets investigated, categorized by their manufacturing state, is provided in Table 1.
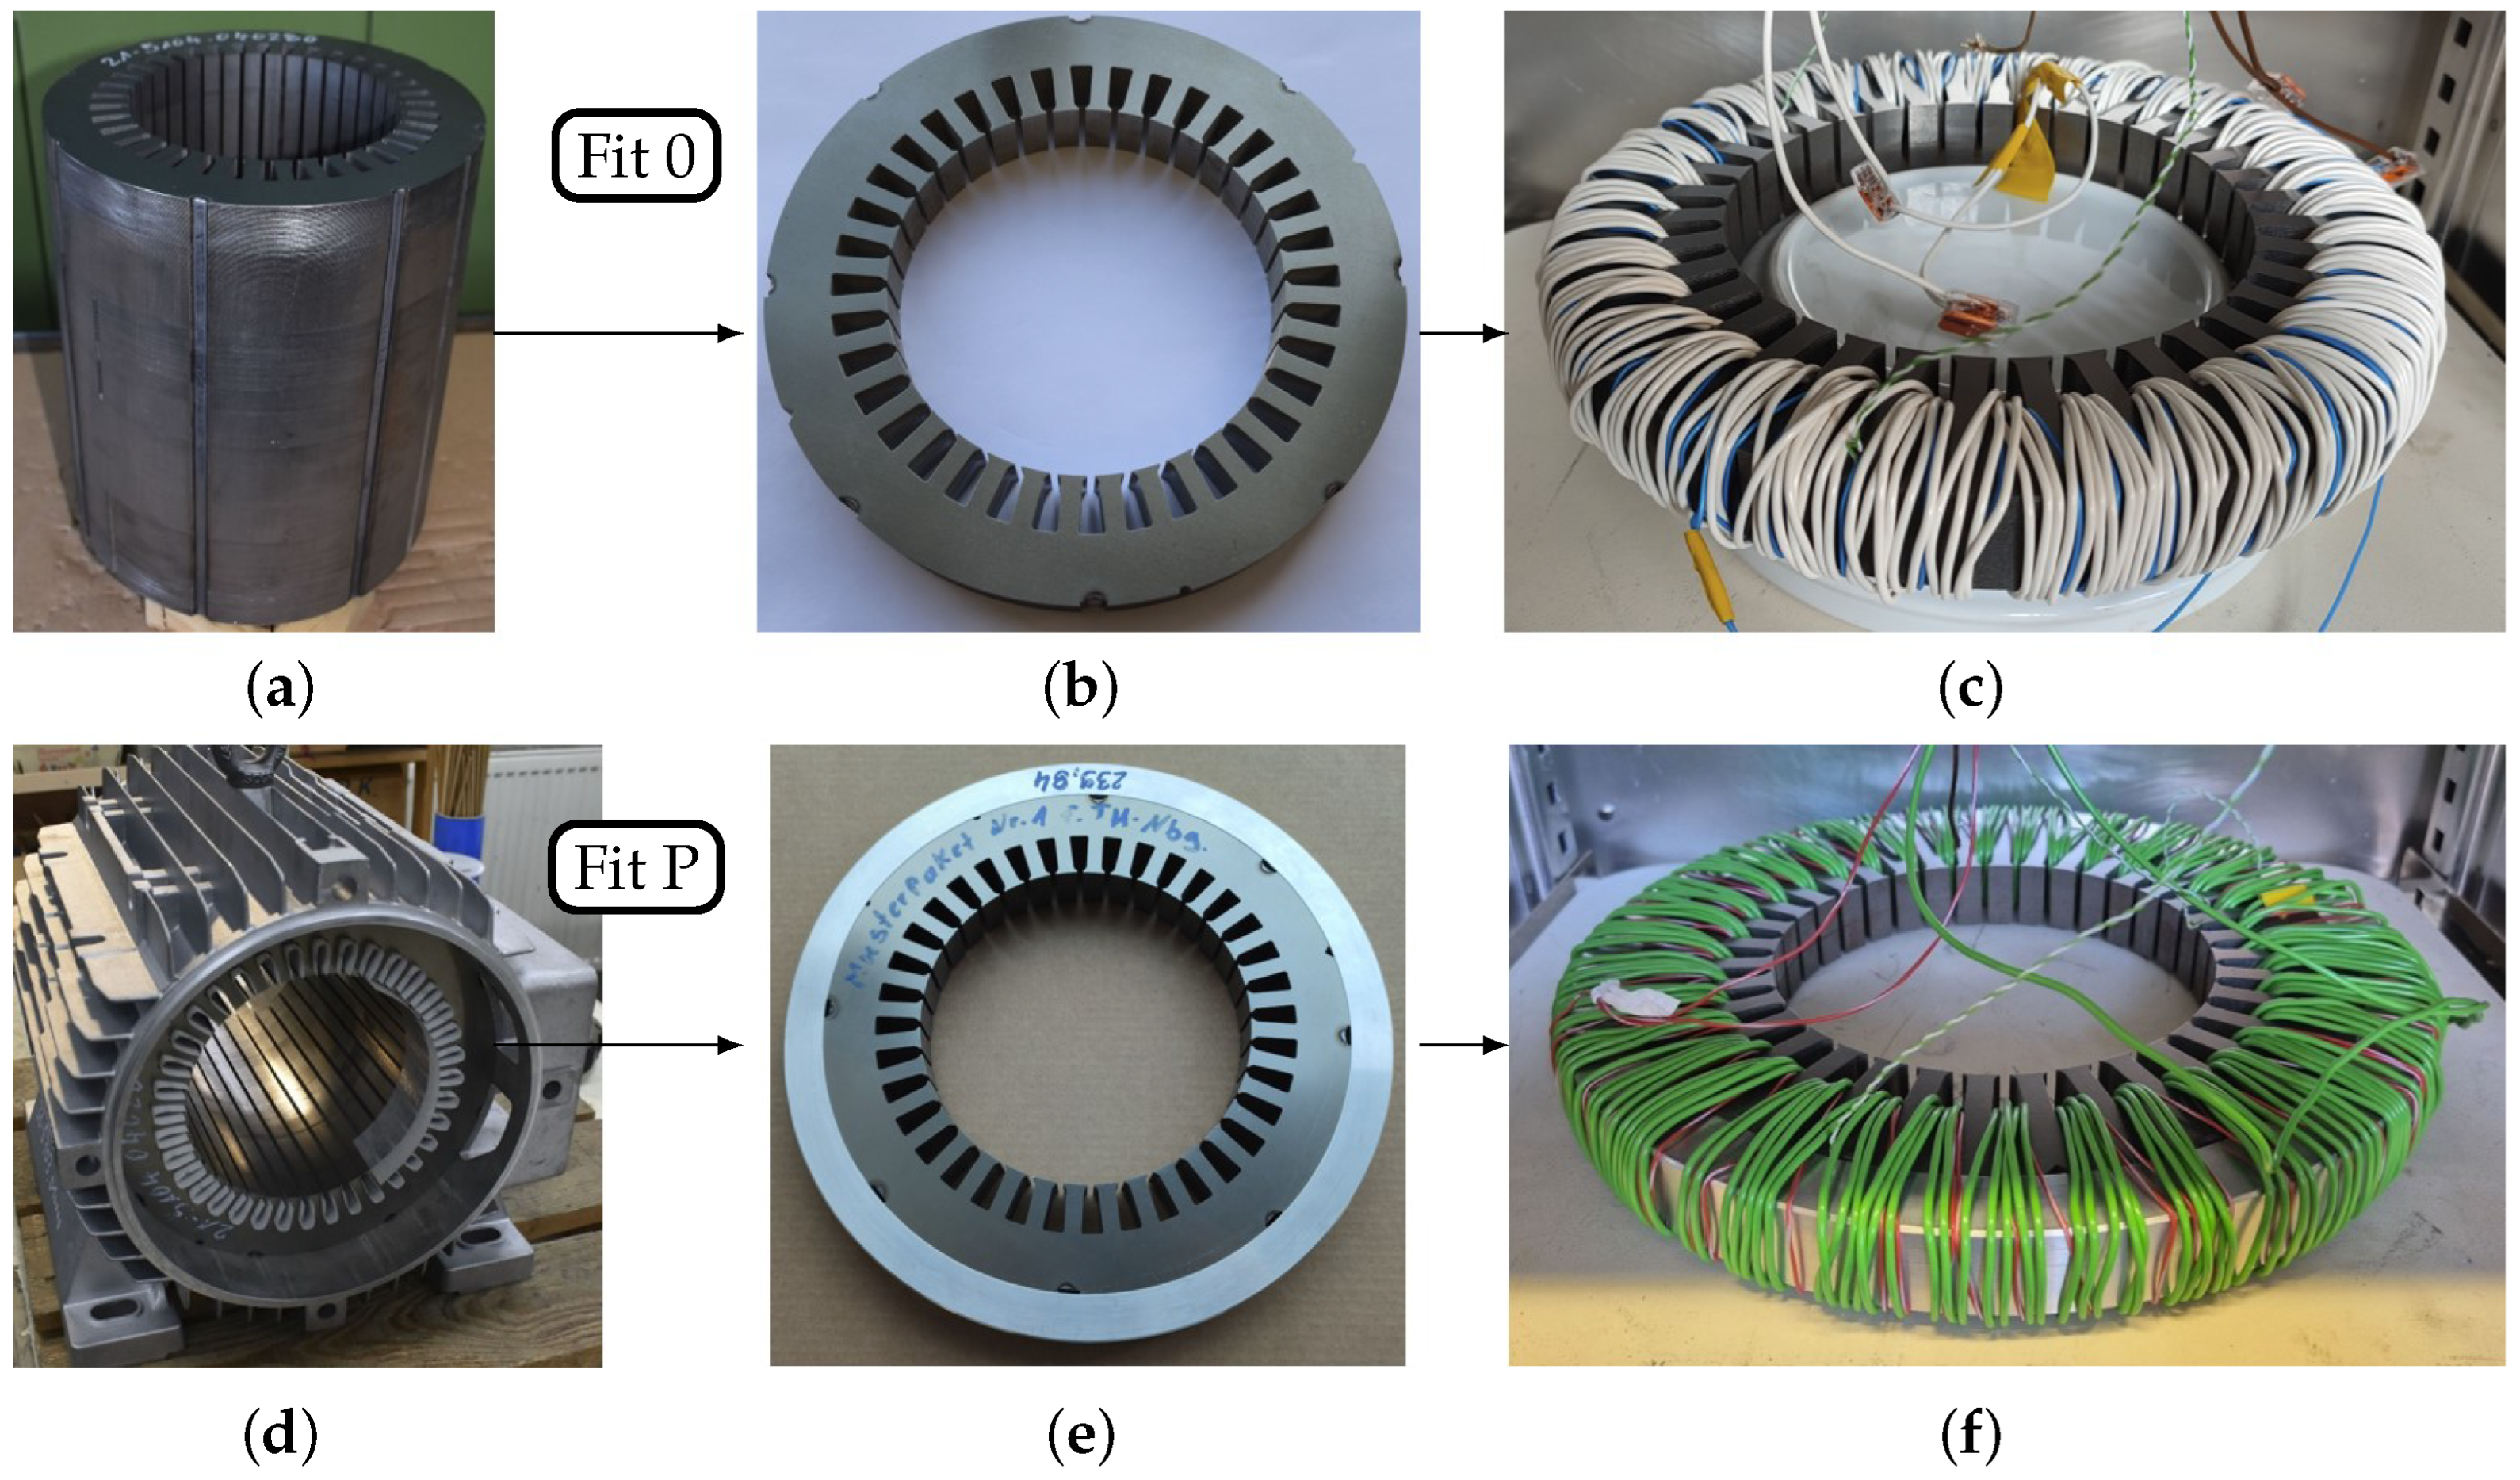
A freely available manufacturer’s data set is used as a reference method and is referred to below as ‘Reference’. As a starting point for the actual electrical steel sheet used, 30 m m wide test strips are laser-cut from M270-50A. Strips that are cut both lengthwise and transversely to the rolling direction are considered in this study. These strips are measured in a test coil built as a 30 m m single strip tester (SST 30 m m ) as described in [26]. This measurement can be equated with the measurement in an Epstein frame [27]. Due to the strip width of 30 mm, a slight but noticeable influence of the cutting process on the magnetic properties must already be expected here [5,26,28,29]. Given the availability of samples of these dimensions from the supplier, which are derived from the material batch used prior to design, and the capacity to measure these samples using standardized measuring coils, this material is selected as the fundamental basis for the design of the stator under investigation. In order to create samples of the stator in Figure 1a that can be handled for magnetic measurement and meet the specifications of IEC 60404 [30,31], 25 m m high stator core stacks (Figure 1b) are produced. The stator laminations have been punched, and the axial packaging is created by welding. The resulting measurement sample is designated Fit 0 and, apart from the axial length, has the same geometric dimensions as the real stator of the prototype machine. Conducting magnetic measurements with the given stator outer and slot base diameters is only possible if the axial stator length is reduced to 25 m m . The stator of the real machine is not suitable for measurement due to its electrical steel sheet mass and the resulting voltage induced per measurement winding. Fit P represents the final measurement sample and consists of the stator ring core (Fit 0) pressed into an aluminum ring with a defined press fit, as illustrated in Figure 1e. The press fit corresponds to the press fit of the prototype machine (Figure 1d).
The following method is used to determine the mechanical stresses in the stator yoke of the pressed-in sample Fit P. Initially, the outer stator radius r s , o of the sample designated as Fit 0 and the inner radius r c , i of the machine casing at 20 ° C are measured. The machine casing is reproduced in a reduced length of 25 m m using aluminum EN AW-6082 press sleeves that are manufactured by turning. The press sleeves have the same inner diameter as the casing of the prototype machine, and, therefore, also the same interference fit. By heating the press sleeve to 120 ° C in an oven, its inner diameter expands to such an extent that the cold stator ring core sample can be inserted. After cooling, this creates a secure interference fit with the same mechanical properties as the prototype machine (Figure 1d). Table 2 shows the analytically calculated geometric properties as well as the maximum mechanical stress occurring in the stator yoke for the operating point of the machine with a steady-state operating temperature of 60 ° C in the casing and stator yoke. The operating temperature was determined from the actual machine measurement on the test bench.

3. Material Properties

Within this section, the commutation curves and specific core loss curves of electrical steel sheet M270-50A under different manufacturing states are shown and briefly discussed. The analysis includes the samples presented in Table 1. The stator stacks in Figure 1c,f are measured according to IEC 60404 [30,31].
A secondary winding is fitted tightly around the stator stacks. This method is employed in the measurement process to detect the induced voltage and, consequently, to detect the magnetic polarization J. A primary winding is attached above the secondary winding for the purpose of applying current. This is employed to set the magnetic field strength H, within in the stator stack yoke. In order to employ this measurement method, a mutual inductance must be utilized for the purpose of air flux compensation. This objective is achieved by utilizing 3D-printed replicas of the stator core and the casing, which are fabricated of PETG. A silver-plated copper strand with a PTFE coating, capable of withstanding temperatures up to 260 ° C , was used as the winding material to measure the test specimens at elevated temperatures. Type K thermocouples are used to record the temperature. During the measurement process, the oven temperature, the winding temperature, and, at two points, the temperature in the stator interference fit are monitored. This is also necessary to detect temperature increases in the interference fit that occur during the measurement. These temperature increases are caused by core losses, and the corresponding temperature settling times must be taken into account. The measurement process is conducted at varying frequencies. In consideration of the machine’s rated point speed of 2300 min 1 , the initial measurement frequency is set to 76.67   Hz . These magnetization curves and specific core losses curves form the material property basis for all simulations shown in Section 6. The frequencies of 50 Hz , 60 Hz , and 100 Hz are also measured for the purpose of comparing the results with the manufacturer’s curves for the electrical steel sheet grade that was used.

3.1. Magnetization Demand

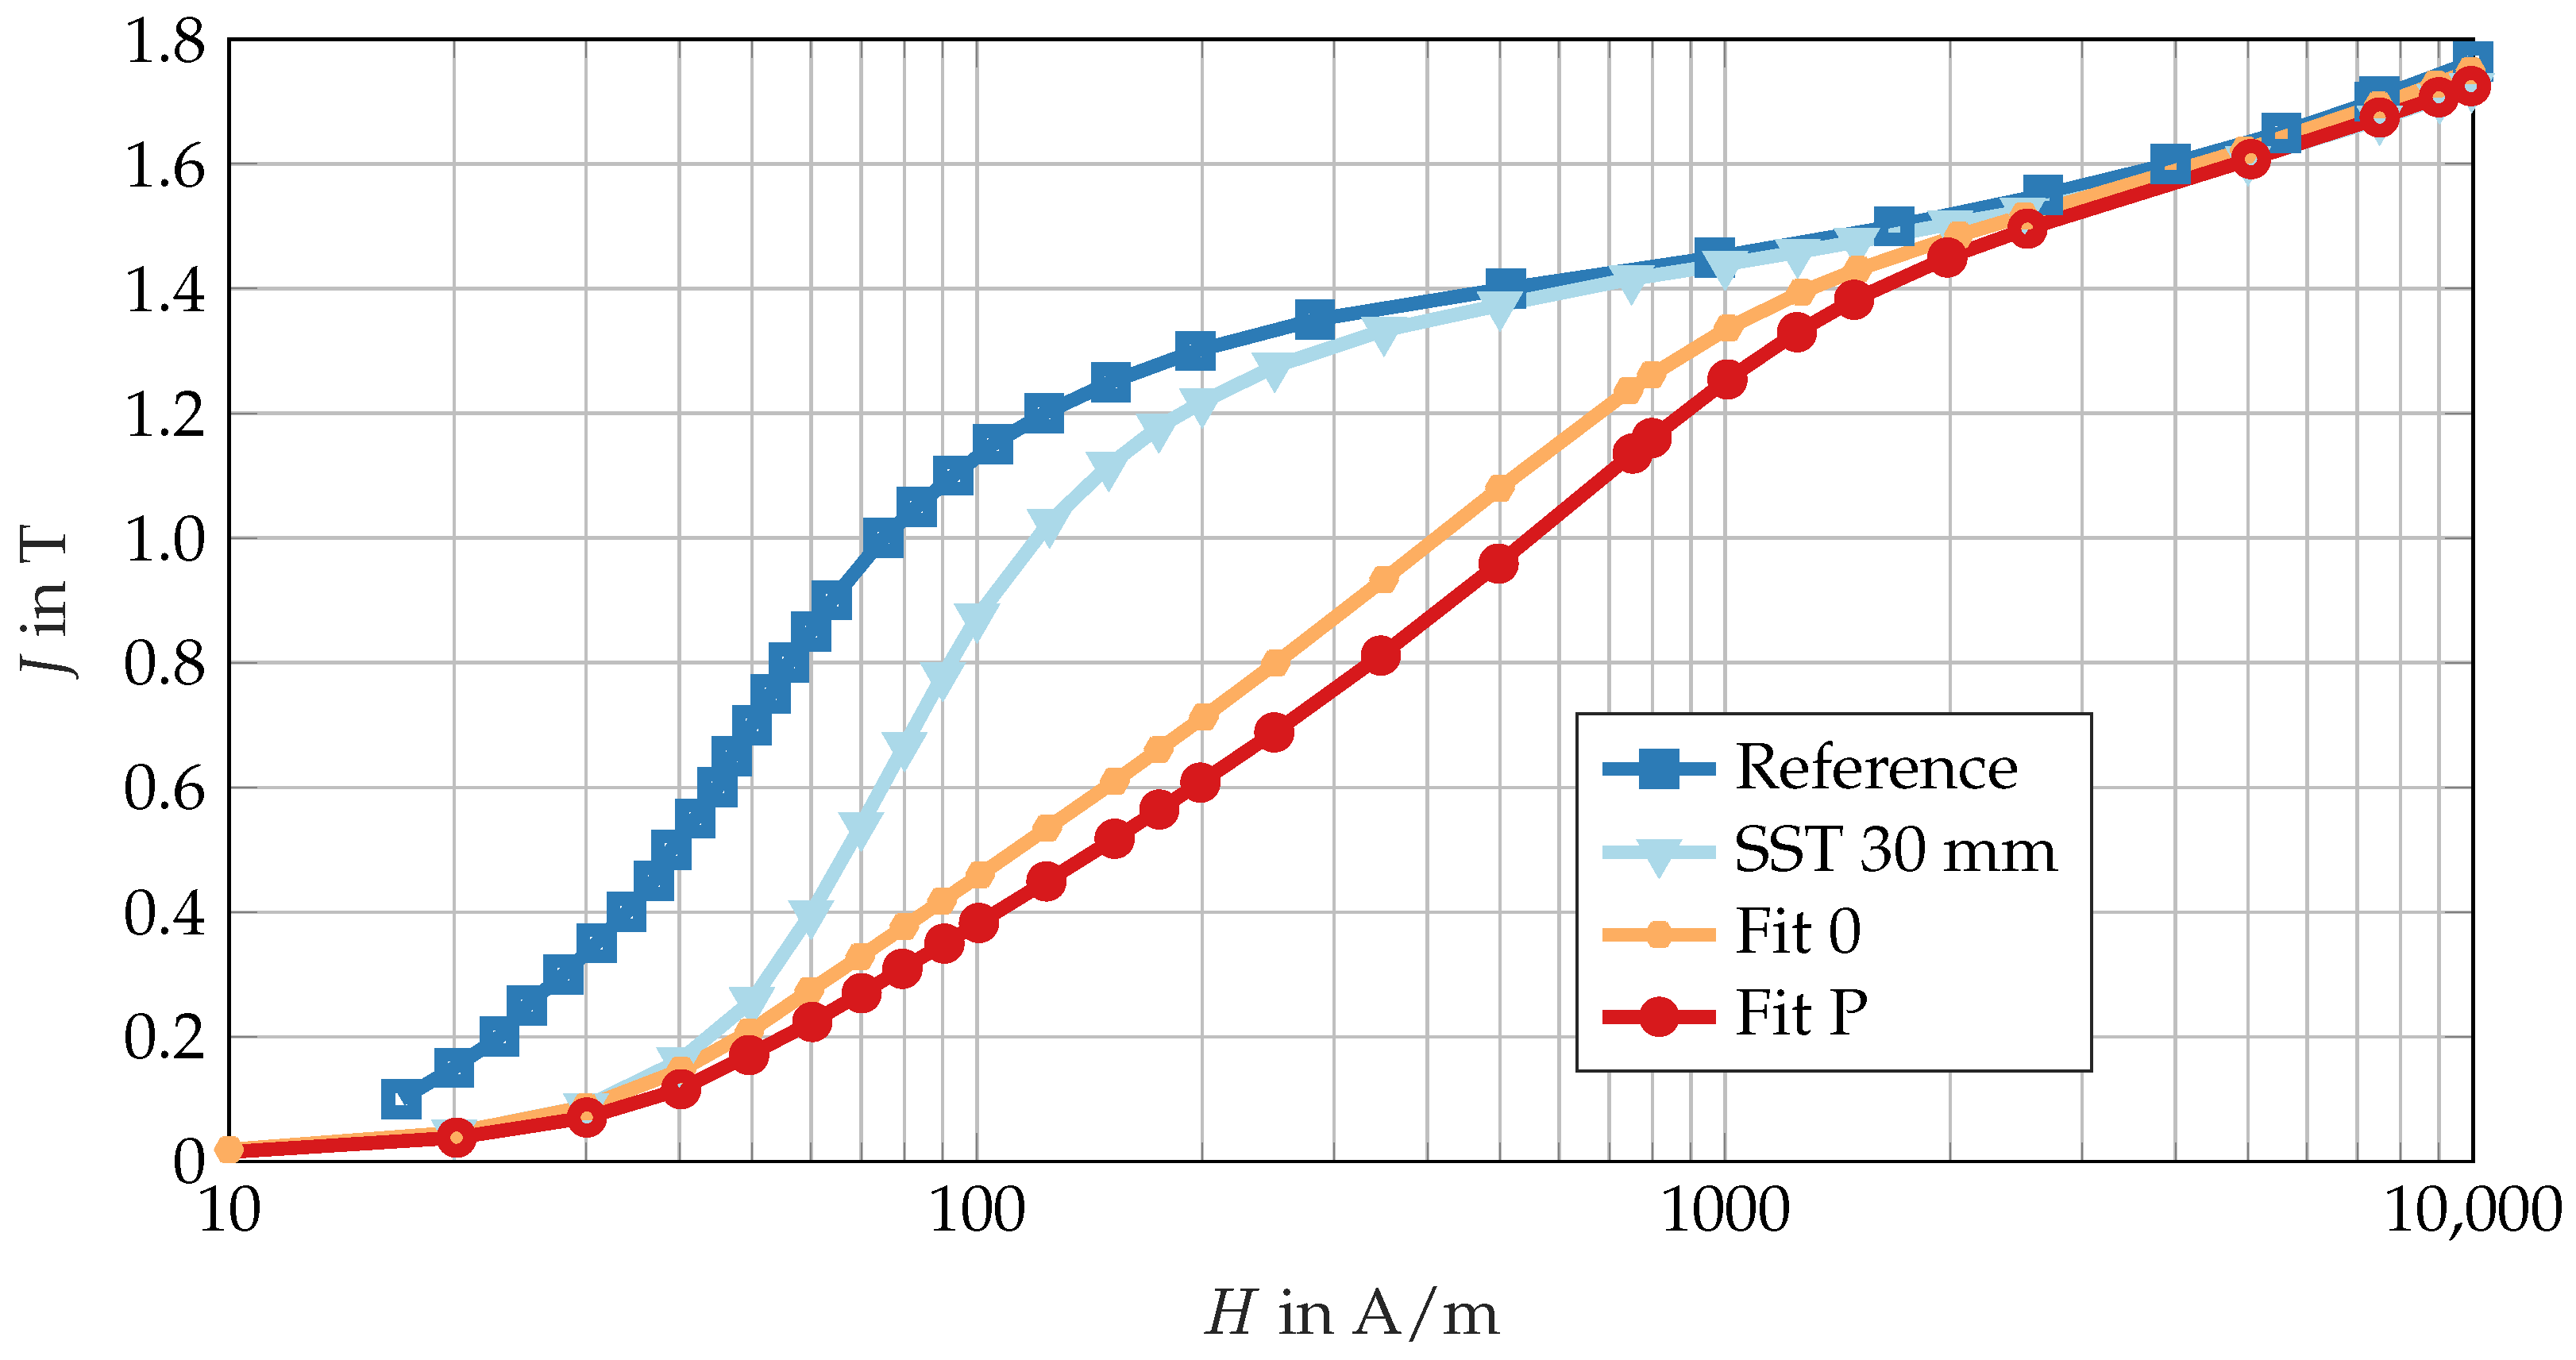
Figure 2 illustrates the 50 Hz commutation curves for M270-50A electrical steel sheet. The data are sourced from the manufacturer’s data sheet (reference) and include the use of a 30 m m strip specimen (SST 30 m m ) and stator specimens (Fit 0 and Fit P). The measurement was conducted up to a magnetic field strength of 10,000 A/m. For low and medium magnetic polarizations up to 1.5   T , an increase in magnetization demand is observed with each processing step. As demonstrated in Figure 3, this relationship becomes evident by observing the relative deviation in magnetic field strength in relation to magnetic polarization. In this case, the ratio of the measurement samples in the processed state is set in relation to the manufacturer’s data set according to (1). Consequently, the magnitude of this magnetic field strength necessary to attain a specific magnetic polarization value increases in proportion to the height of the indicated line.
D H = H i H Ref 1
The maximum deviation in Figure 3 is observed in the polarization range from 0.8   T up to 1.3   T with a peak of 650% at 1.1   T for the Fit P measurement. The results of the Fit 0 study indicate that the maximum excess demand is observed in the same region, with a peak of 480% at 1.15   T . The sample from the SST 30 m m strip measurements still achieves deviation values of up to 60% in this range. The commutation curves of the measurements SST 30 m m , Fit 0 and Fit P at 76.67   Hz are nearly indistinguishable from the 50 Hz measurement. In consideration of the aforementioned factors, the manufacturer’s commutation curve at 50 Hz is employed to ascertain the augmented magnetization demand resulting from the absence of an explicit data set at this particular frequency. The outcomes demonstrate minimal variation (less than 1%) from the 50 Hz results, thereby eliminating the necessity for a separate display. As the magnetic saturation of the electrical steel sheet increases, the deviation of the three investigated manufacturing states approaches zero. This finding is consistent with the conclusions of studies conducted on the manufacturing influences on electrical steel sheets [32,33]. It also allows an extrapolation of the commutation curves according to [34] for higher magnetic field strengths. For further use in finite element analysis, it is imperative to ensure precise mapping of saturated areas in electrical machines. The curves are then prepared for integration in the FEA and converted into B H -curves according to (2).
B = J + μ 0 · H

3.2. Specific Core Losses

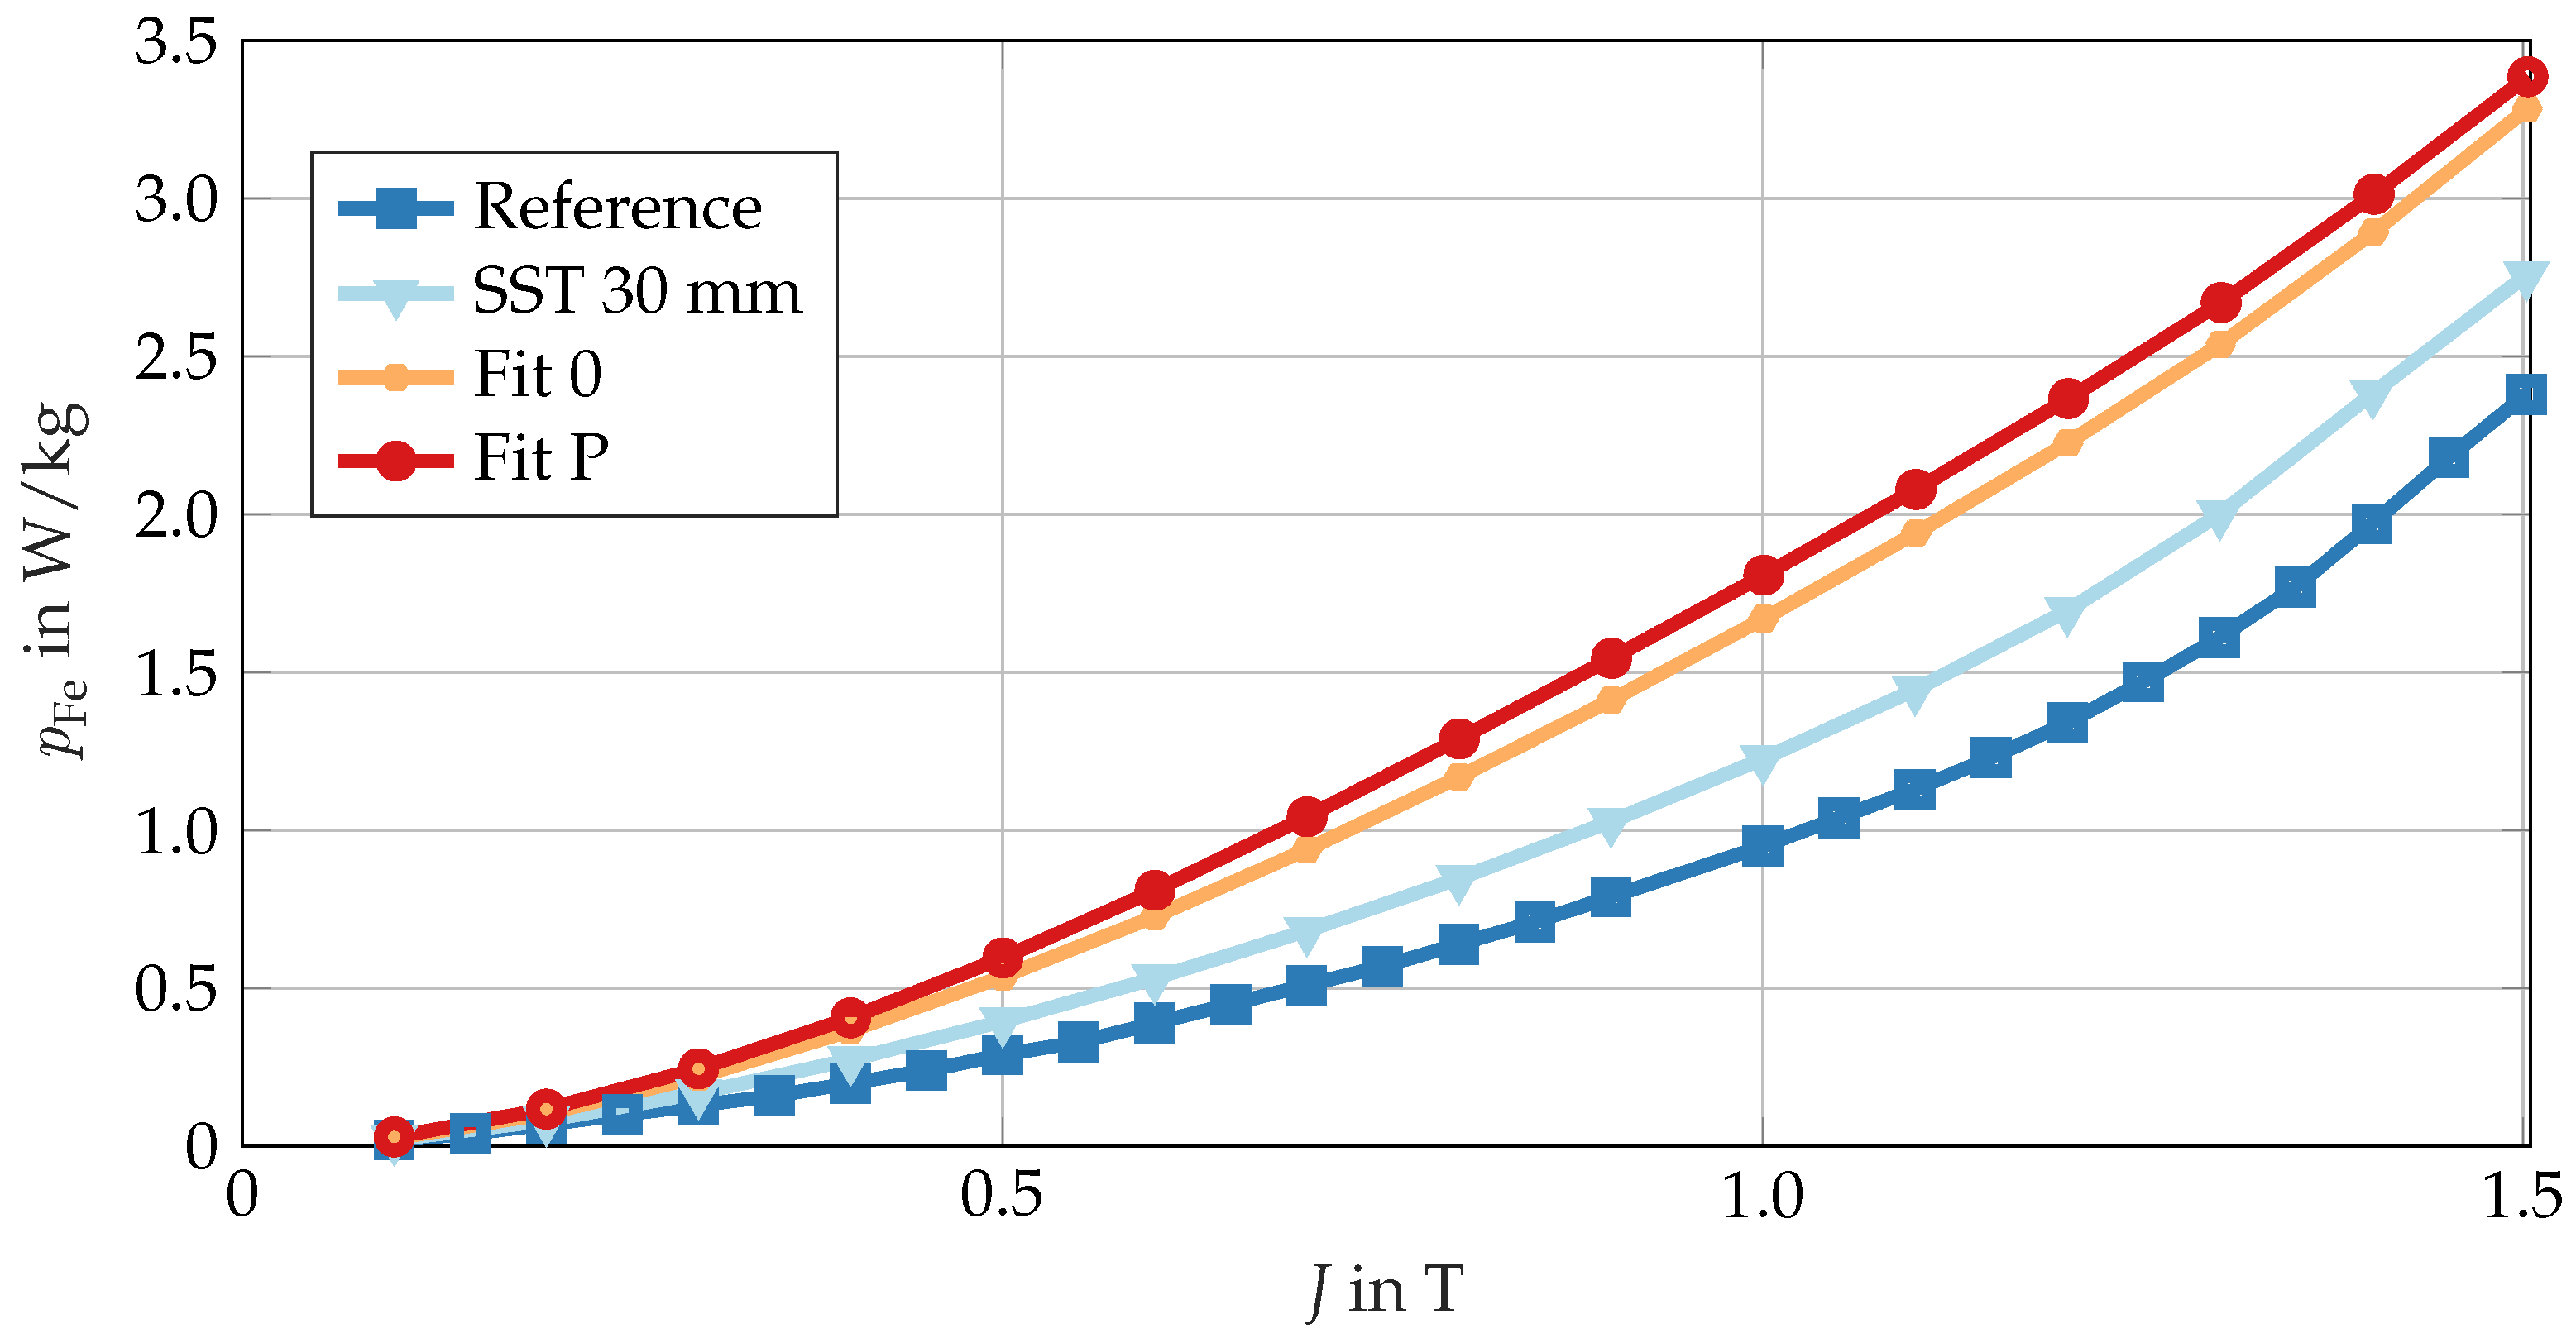
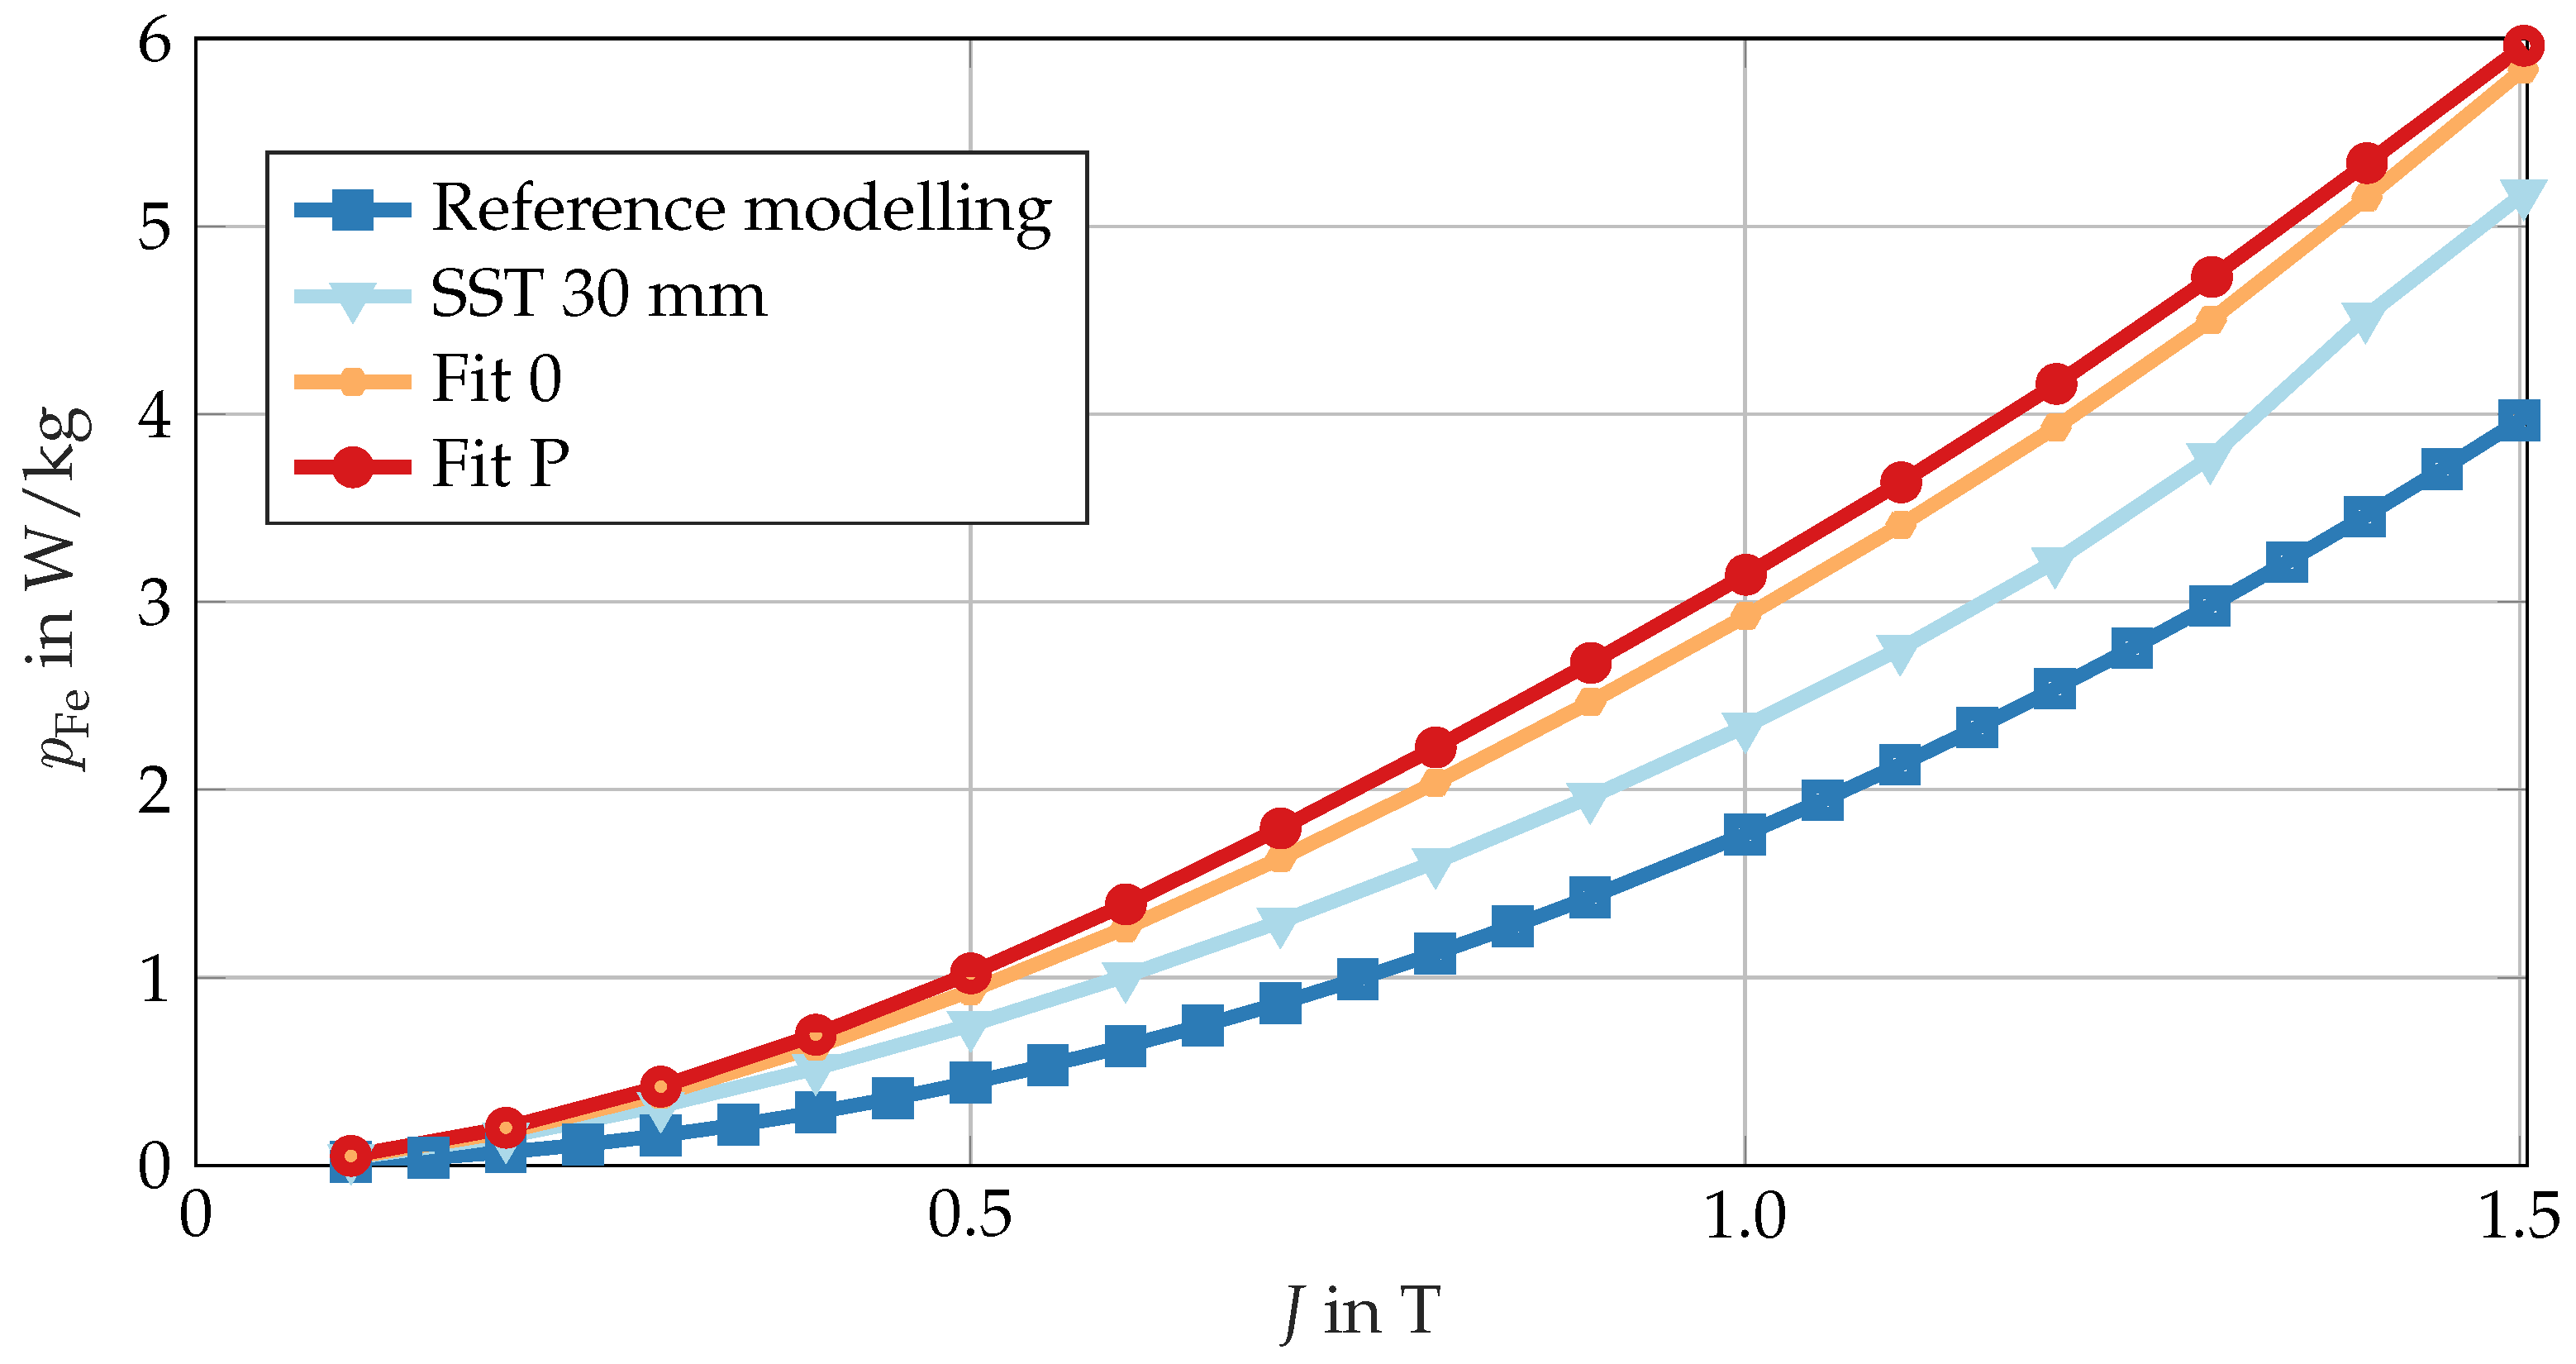
As illustrated in Figure 4, the specific core losses p Fe are depicted as a function of magnetic polarization at 50 Hz for the four investigated electrical steel sheet specimens. Figure 5 indicates a similar outcome at 76.67   Hz . The manufacturer’s characteristic curve, utilized at a frequency of 76.67   Hz , was extrapolated through the application of the Bertotti coefficients determination, in accordance with prevailing practices delineated in Section 4.
It is significant to note that the measurement of the SST 30 m m sample has already demonstrated a substantial increase in core losses. The calculation of the relative deviation of the specific core losses, as outlined in (3), facilitates a quantitative evaluation of the discrepancies.
D p Fe = p Fe i p Fe Ref 1
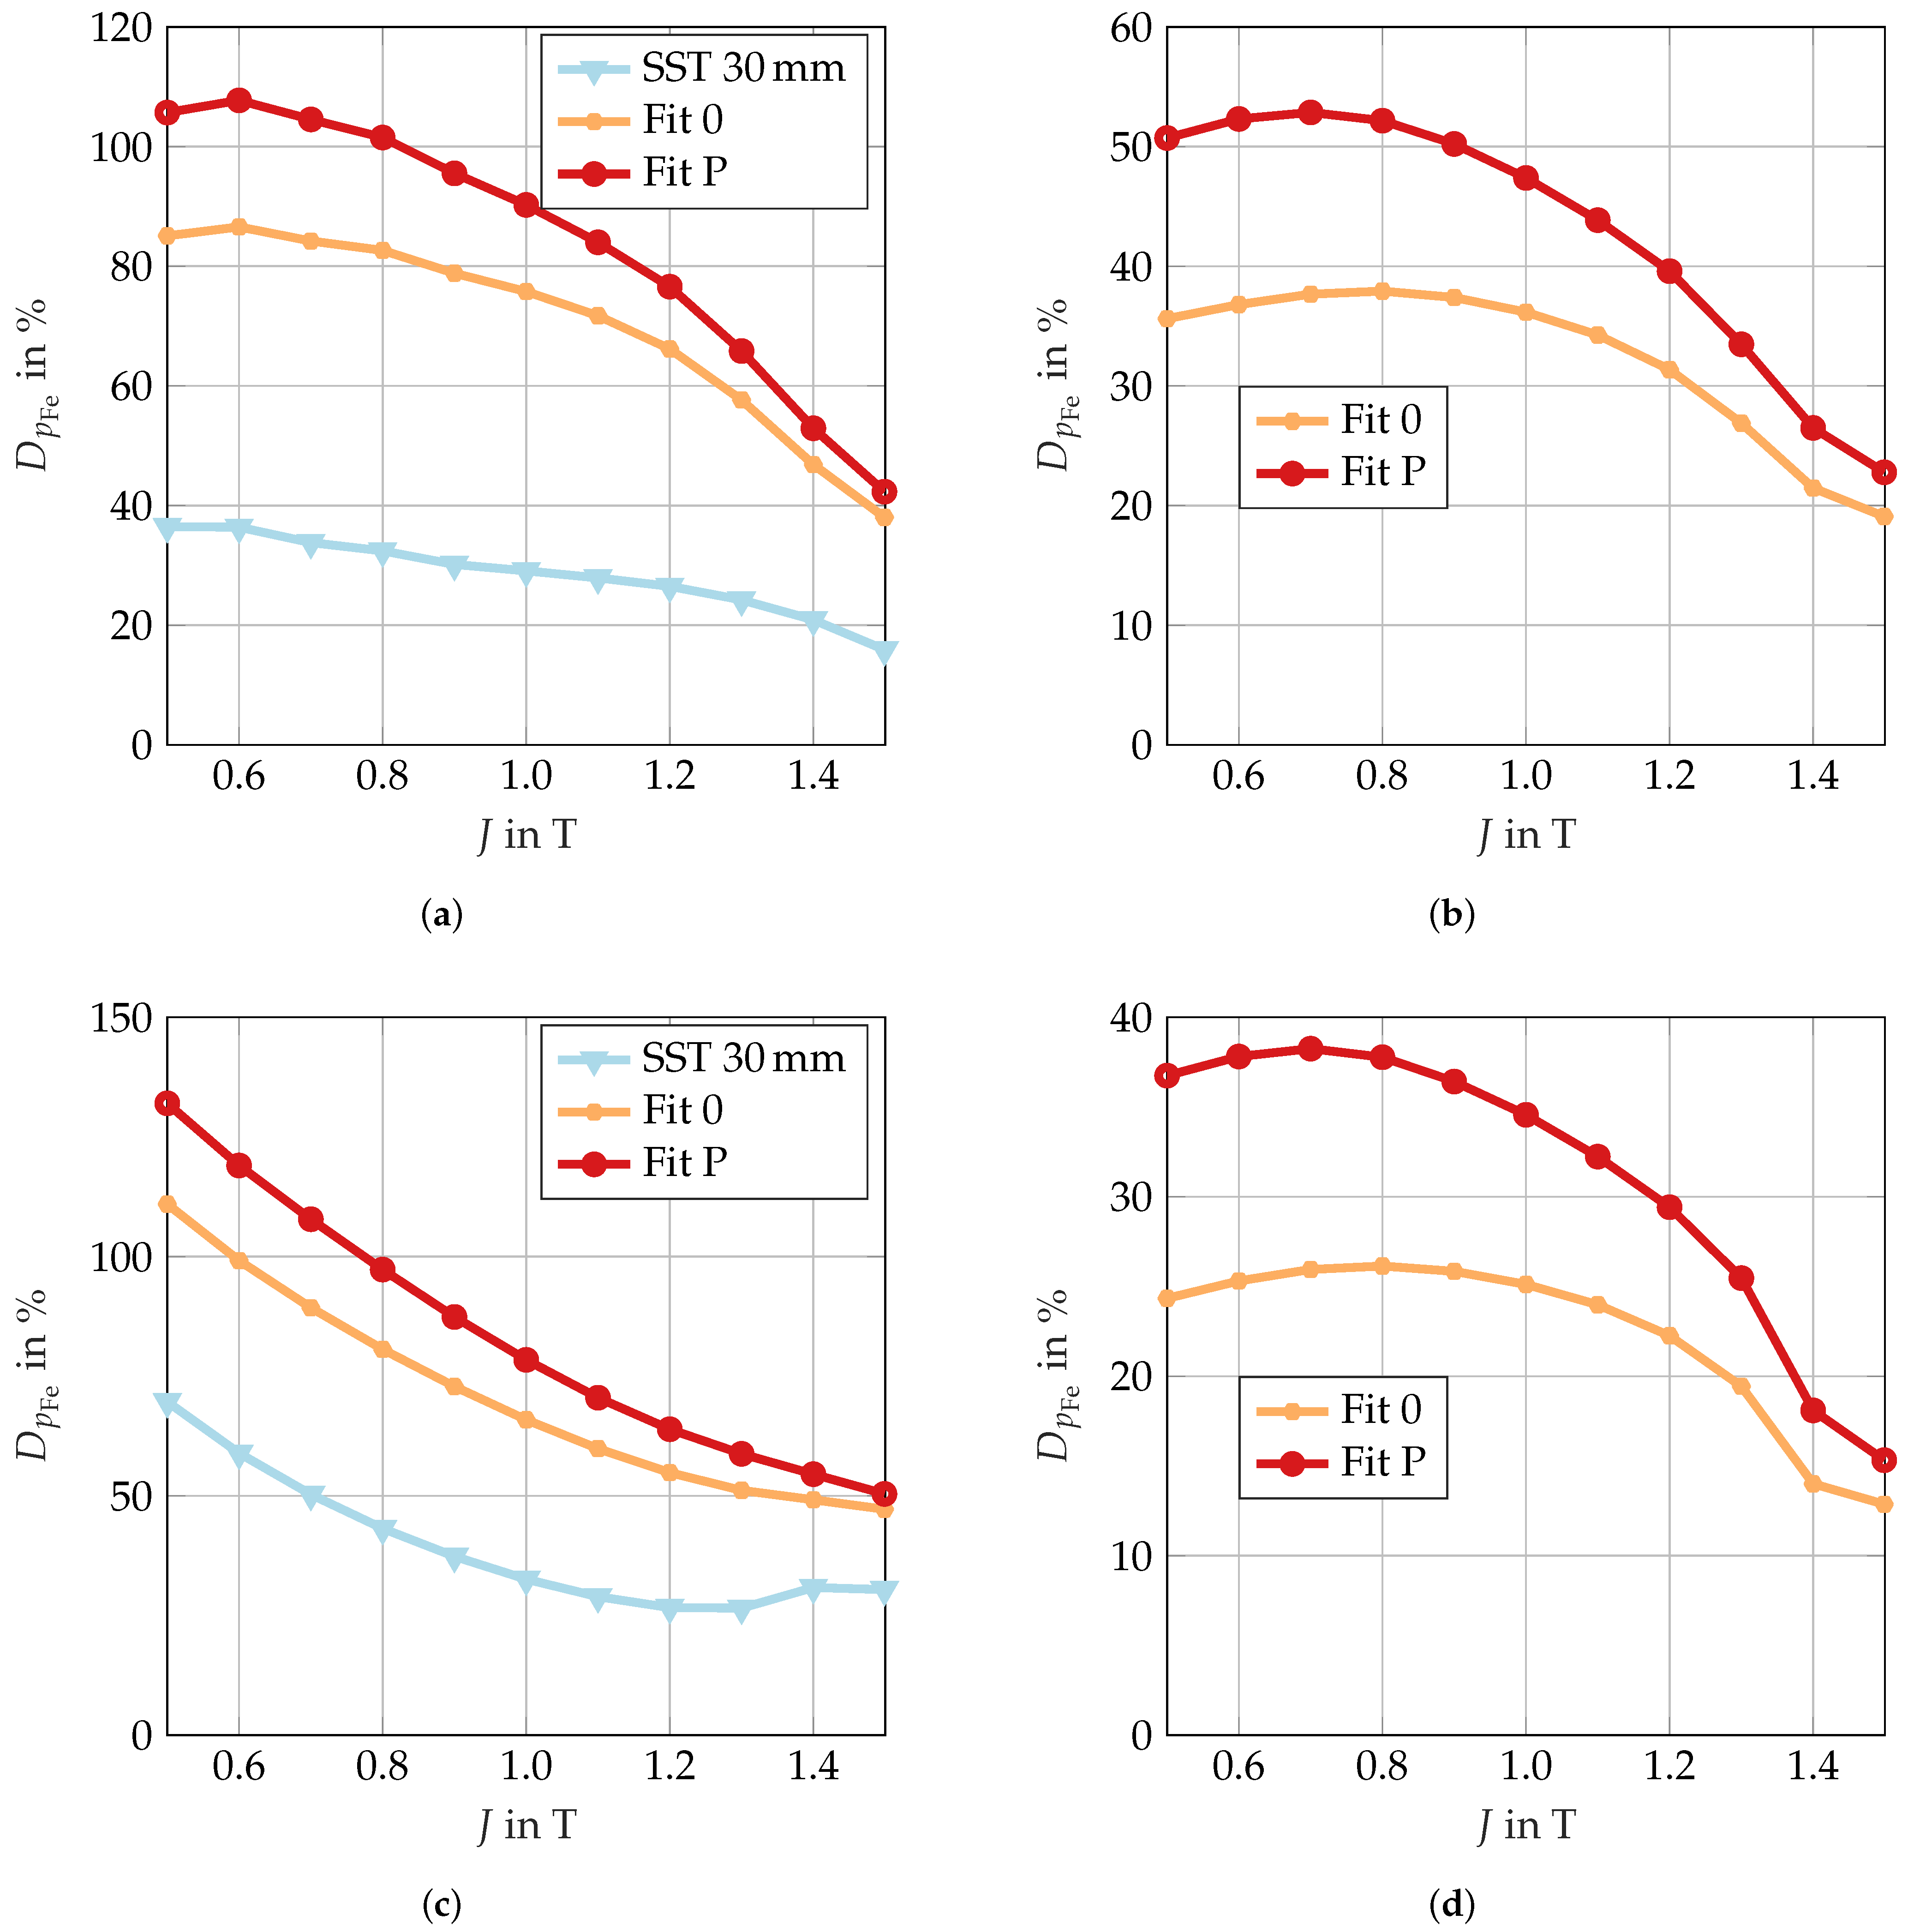
Figure 6 shows the deviations of the core losses over the magnetic polarizations for the three investigated specimens related to the manufacturer dataset in (a) and (c). As illustrated in (b) and (d), the deviations are depicted in relation to the SST 30 m m strip specimen measurement.
As the magnetic polarization increases, the relative increase in specific core losses decreases for all variations. Accordingly, (b) and (d) in Figure 6 should be considered. Local maxima can be observed in the range of approximately 0.7   T . The maximum relative increase in (b) is reached at approximately 0.7   T , with Fit P exhibiting a 53% increase and Fit 0 a 38% increase. The maximum relative increase in (d) is reached at approximately 0.7   T to 0.8   T , with Fit P exhibiting a 38% increase and Fit 0 a 26% increase. Therefore, the relative increase in specific core losses at higher frequencies is less pronounced than at 50 Hz . This finding is consistent with the trends reported in [17,22,35]. These studies examined core losses in electrical steel sheets that were investigated under various compressive stresses. As the degree of polarization increases, a consistent decline in deviation is observed as the polarization progresses towards higher values. The same behavior can also be observed in relation to the manufacturer data presented in Figure 6a,c. By extrapolating the manufacturer data to 77 Hz , the relative increases are lower, but this is due to the mathematical approximation previously described. The subsequent section will address the preparation of the determined specific core loss curves for the FEA.

4. Core Loss Separation

The Bertotti approach [36] is utilized in order to carry out the separation and description of the specific core losses (4).
p Fe ( f , J ) = p h ( f , J ) + p c ( f , J ) + p e ( f , J ) = k h · f · J 2 + k c · f 2 · J 2 + k e · f 1.5 · J 1.5
The Bertotti approach is part of many pieces of electromagnetic finite element analysis (FEA) software for the integration of core losses. The specific core losses denoted by p Fe are further subdivided into three parts: specific hysteresis losses p h , specific eddy current losses p c and specific excess losses p e . All three loss parts are dependent on magnetic polarization and frequency. The specific core loss coefficients k h , k c and k e are determined through the analysis of the respective loss measurements of the electrical steel sheets.
k c = d 2 · π 2 6 · ρ · ρ e
As indicated in the literature [36], the specific eddy current coefficient k c (5) is determined by using the physical parameters thickness d, physical density ρ , and specific electrical resistivity ρ e . Consequently, it is viable to utilize the coefficient parameter set that has been determined at 50 Hz for simulations at higher frequencies. In order to ascertain the eddy current coefficient of sample Fit P, it is necessary to adjust the underlying electrical resistivity to 60 ° C in accordance with the findings reported in [37]. Subsequent to determining k c , the coefficients k h and k e are subsequently derived mathematically, according to the methodology outlined in [26]. The separation with resulting specific core loss parts is shown in Table 3 for the investigated electrical steel sheet specimens at 50 Hz and in Table 4 for the extraction from the 76.67   Hz measurement. The parameters previously mentioned serve as the foundation for the calculation of core losses in the finite element analysis Section 6.
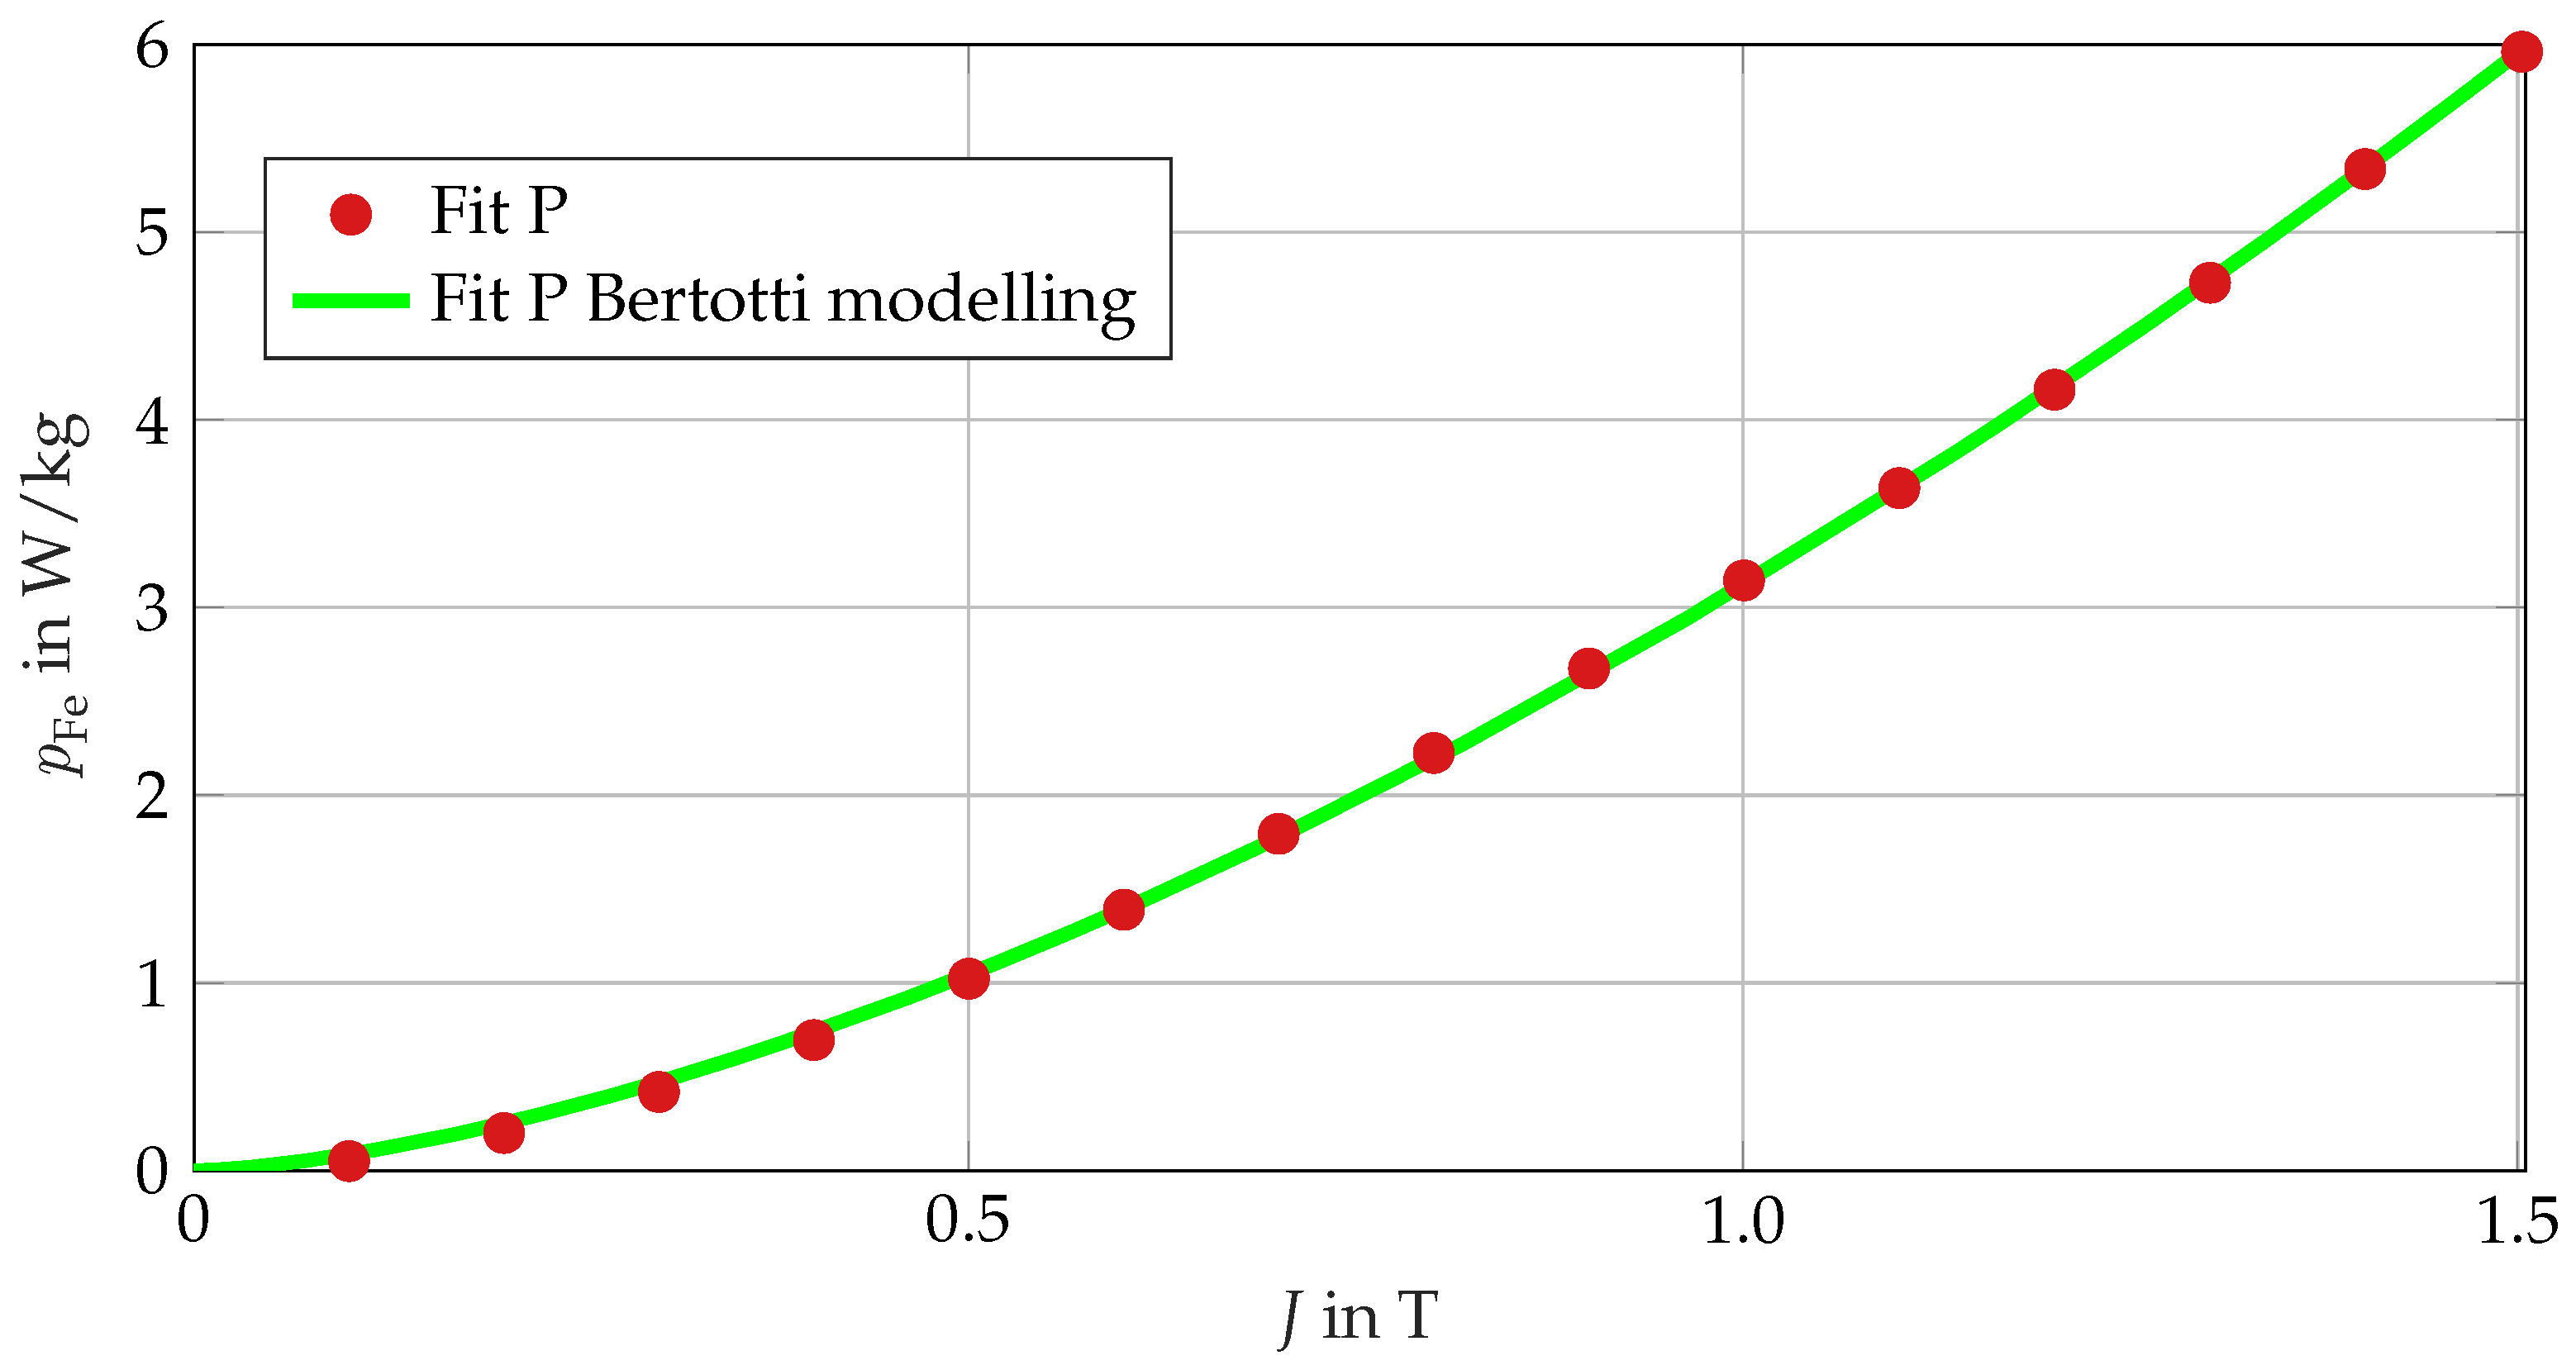
The substantial reduction in the hysteresis component and the pronounced increase in the excess component at Fit 0 and Fit P are particularly notable. This phenomenon can be attributed to the lower gradient of the specific loss curves when mathematically fitting the coefficients. As demonstrated in Figure 7, the utilization of the Bertotti model still enables a very good replication of the specific core loss characteristic curve of Fit P. However, it should be noted that the hysteresis loss and excess loss components determined therein have become devoid of any physical reference. A notable benefit of this approach is its compatibility with a range of pieces of finite element analysis software that support the Bertotti methodology.

5. Machine Under Investigation

This section presents the reluctance synchronous machine designed for this investigation. The design of the machine is based upon an asynchronous induction machine, incorporating a standard IEC 160/4.150 stator core design. An enumeration of important geometric parameters is provided in Table 5.
The data pertaining to rated operating point of the test machine are listed in Table 6.
Figure 8 displays the cross-section of the RSM with the rotor and stator structures used and provides an overview of the designation of individual machine elements.
The next step is to use the machine model for a 2D finite element analysis (2D-FEA).

6. Finite Element Analysis

In order to design and calculate the operating point-dependent air gap torque T δ ( i d , i q ) and the core losses P Fe , it is necessary to consider the flux linkage maps of the d- and q-axis of the RSM. These are calculated in a 2D FEA.
For the purposes of this study, the machine model from Figure 8 has been converted into two 2D FE models. As illustrated in Figure 9a, the model under consideration features a single stator region, which incorporates both the stator yoke and stator teeth. This model is employed in simulations devoid of manufacturing influences. Conversely, the stator is modeled as a two-region system, as depicted in Figure 9b delineates the distinction between the stator yoke region and the stator teeth region. This provides the opportunity to assign different material parameters to the stator to take into account the investigated manufacturing influences.
The following cases, enumerated in Table 7, are to be investigated and presented in order to ascertain their respective influences on the calculation results.
In all cases, an M530-50A electrical steel from a manufacturer’s specification is utilized as rotor material. The rotor does not contribute to core losses at the fundamental frequency, and higher harmonics are outside the scope of this study. In the q-axis, manufacturing influences on magnetization in the rotor’s electrical steel sheet are negligible because the air proportion in the flux barriers and the typically saturated radial webs dominate the path. In the d-axis, an influence due to cut edges may occur. However, no cutting edge-influenced material data for the rotor electrical steel sheet are available for the machine under investigation. Based on these considerations, a uniform electrical steel sheet was selected, removing the rotor as a possible influencing factor. The simulation cases examined are, therefore, only valid for considering the influence of manufacturing on the stator. Case 1 represents the standard approach, which involves defining the one-region model in the stator (Figure 9a) using the manufacturer’s material data. Case 2 delineates the one-region model with the self-measured characteristic curves from the SST measurement of the 30 mm strip specimen. This case demonstrates the availability of electrical steel sheet measurement data for samples that have been magnetically measured without any manufacturing influence. In Case 3, the pressed-in test sample (Fit P) is used in the two-region model (Figure 9b) as the definition of the stator yoke material. Therefore, the real geometry is considered in conjunction with the impact of the actual punching process, axial welding, and the influence of the interference fit at an operating temperature of 60 ° C . The material of the stator teeth is characterized by its definition, as determined by the SST 30 m m measurement, with no additional manufacturing influences. Finally, Case 4 extends the investigation to include the manufacturing influence in the stator teeth through the adaptive use of the Fit 0 characteristic curves in the teeth. This analysis encompasses the impact of the cutting process and the axial packaging. The teeth of the machine had an average width of 7.2   m m . The findings reported in [26] demonstrate the influence of the cut edges in this particular domain on various electrical steel sheets. This observation aligns with the relative deviations observed between Fit 0 and the SST 30 m m strip measurement depicted in Figure 6b. This finding serves to substantiate the utilization of Fit 0 in the stator teeth of Case 4 in this study.
The FEA is conducted in the time domain using a transient solver. Machine symmetry allows quarter-model simulations (Figure 9) with matching symmetry conditions. In the current-fed model, two periods with a step size of 0.13   m s are simulated. This enables a resolution of up to approx. 3.8   k Hz at a supply frequency of 76.67   Hz . The supply currents are ideally sinusoidal, and the stator windings are in a Y-connection. Only the second period is evaluated for magnetic flux linkage, torque, and core losses. The 2D-FE model excludes the winding overhang, and the outer region of the stator is neglected due to the zero vector potential boundary condition at the stator’s outer diameter. In order to calculate the core losses P Fe , it is necessary to determine the time course of the magnetic flux density B ( t ) for each finite element, based on the electrical period. In the second electrical period, the core losses for each time step can be determined according to Bertotti’s core loss model according to (4).
The calculation of the magnetic flux linkages, denoted by Ψ d ( i d , i q ) and Ψ q ( i d , i q ) , is imperative for the determination of the magnetic field. In the given context, it is evident that the d- and q-currents are set at specific value, namely, i d , q = 0   A to i d , q = 80   A . The model is simulated with a constant step size of Δ i d , q = 5   A . It is imperative to acknowledge at this juncture that the currents i d , q referenced in the FEA are equivalent to the magnetization currents i d 0 and i q 0 .
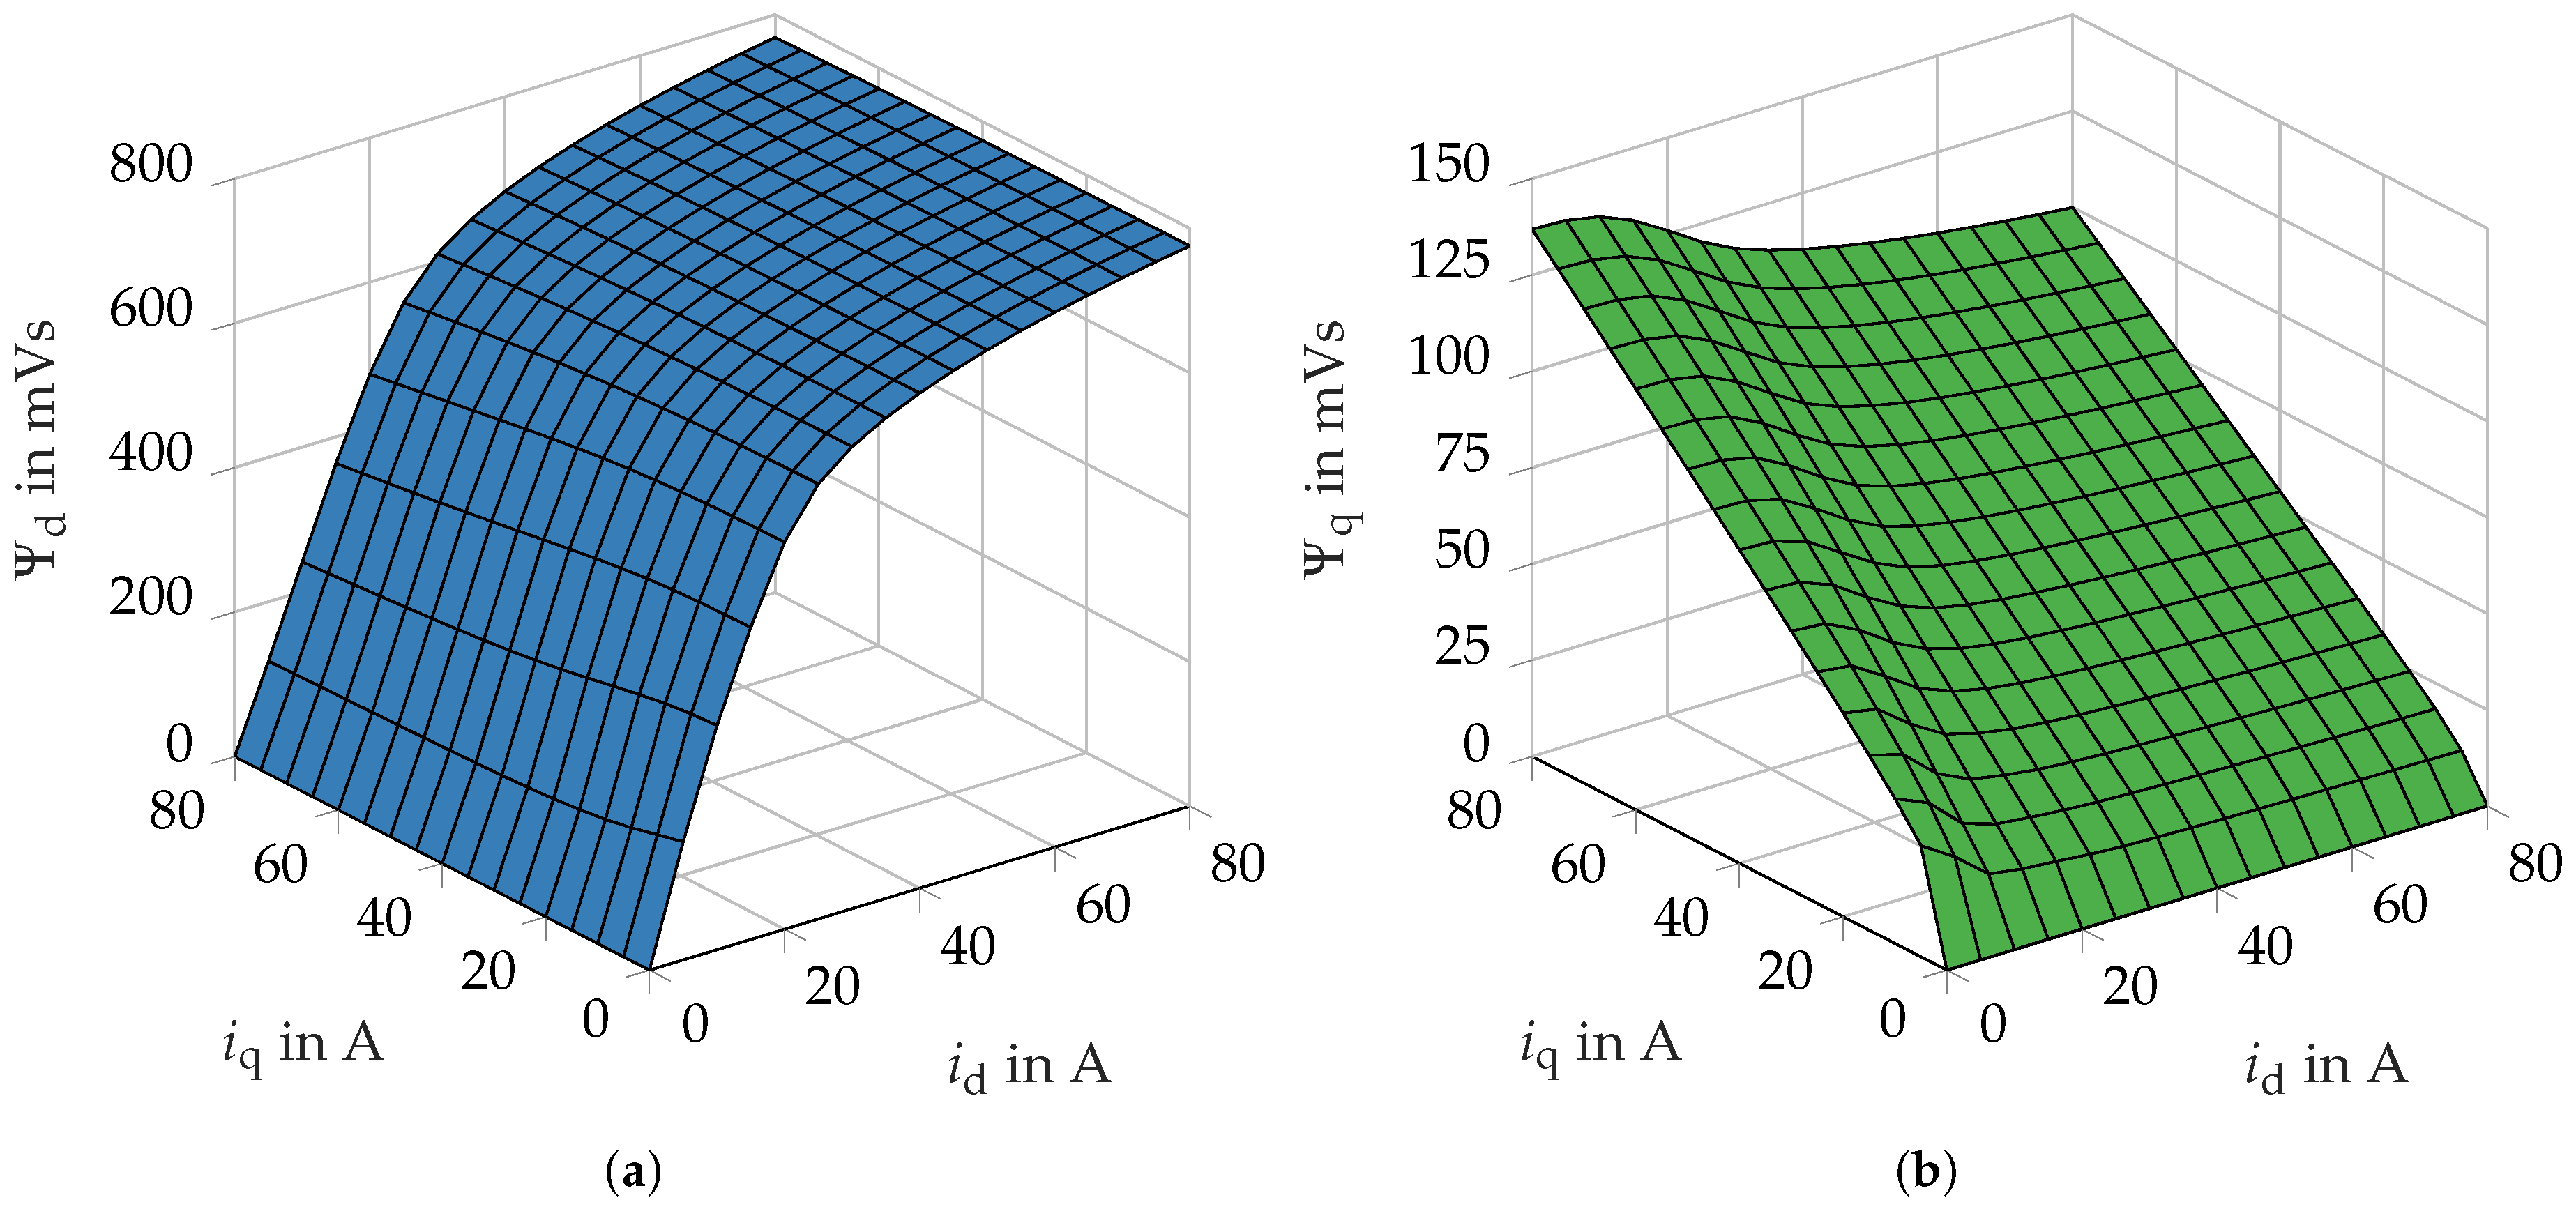
Initially, the Case 1 simulation is executed as a reference point. This case represents a standard scenario in the design and calculation of an electrical machine. The simulation results of the magnetic flux linkage Ψ d ( i d , i q ) and Ψ q ( i d , i q ) for the simulated current range are shown in Figure 10.
The calculation of the average torque of the RSM is possible through the use of the determined flux linkage maps Ψ d ( i d , i q ) and Ψ q ( i d , i q ) as a function of the number of pole pairs p, the number of strands m, and the magnetization currents i d and i q . This calculation is outlined in (6).
T δ ( i d , i q ) = m 2 · p · ( Ψ d ( i d , i q ) · i q Ψ q ( i d , i q ) · i d )
Rather than utilizing magnetization currents i d and i q , it is more appropriate to employ the effective current I and the current angle α i in this context. The following relationships must be considered: (7) and (8).
i d = I · 2 · cos ( α i ) i q = I · 2 · sin ( α i )
T δ ( I , α i ) = m 2 · p · ( Ψ d ( I , α i ) · I · 2 · sin ( α i ) Ψ q ( I , α i ) · I · 2 · cos ( α i ) ) T δ ( I , α i ) = m 2 · p · I · 2 · ( Ψ d ( I , α i ) · sin ( α i ) Ψ q ( I , α i ) · cos ( α i ) )
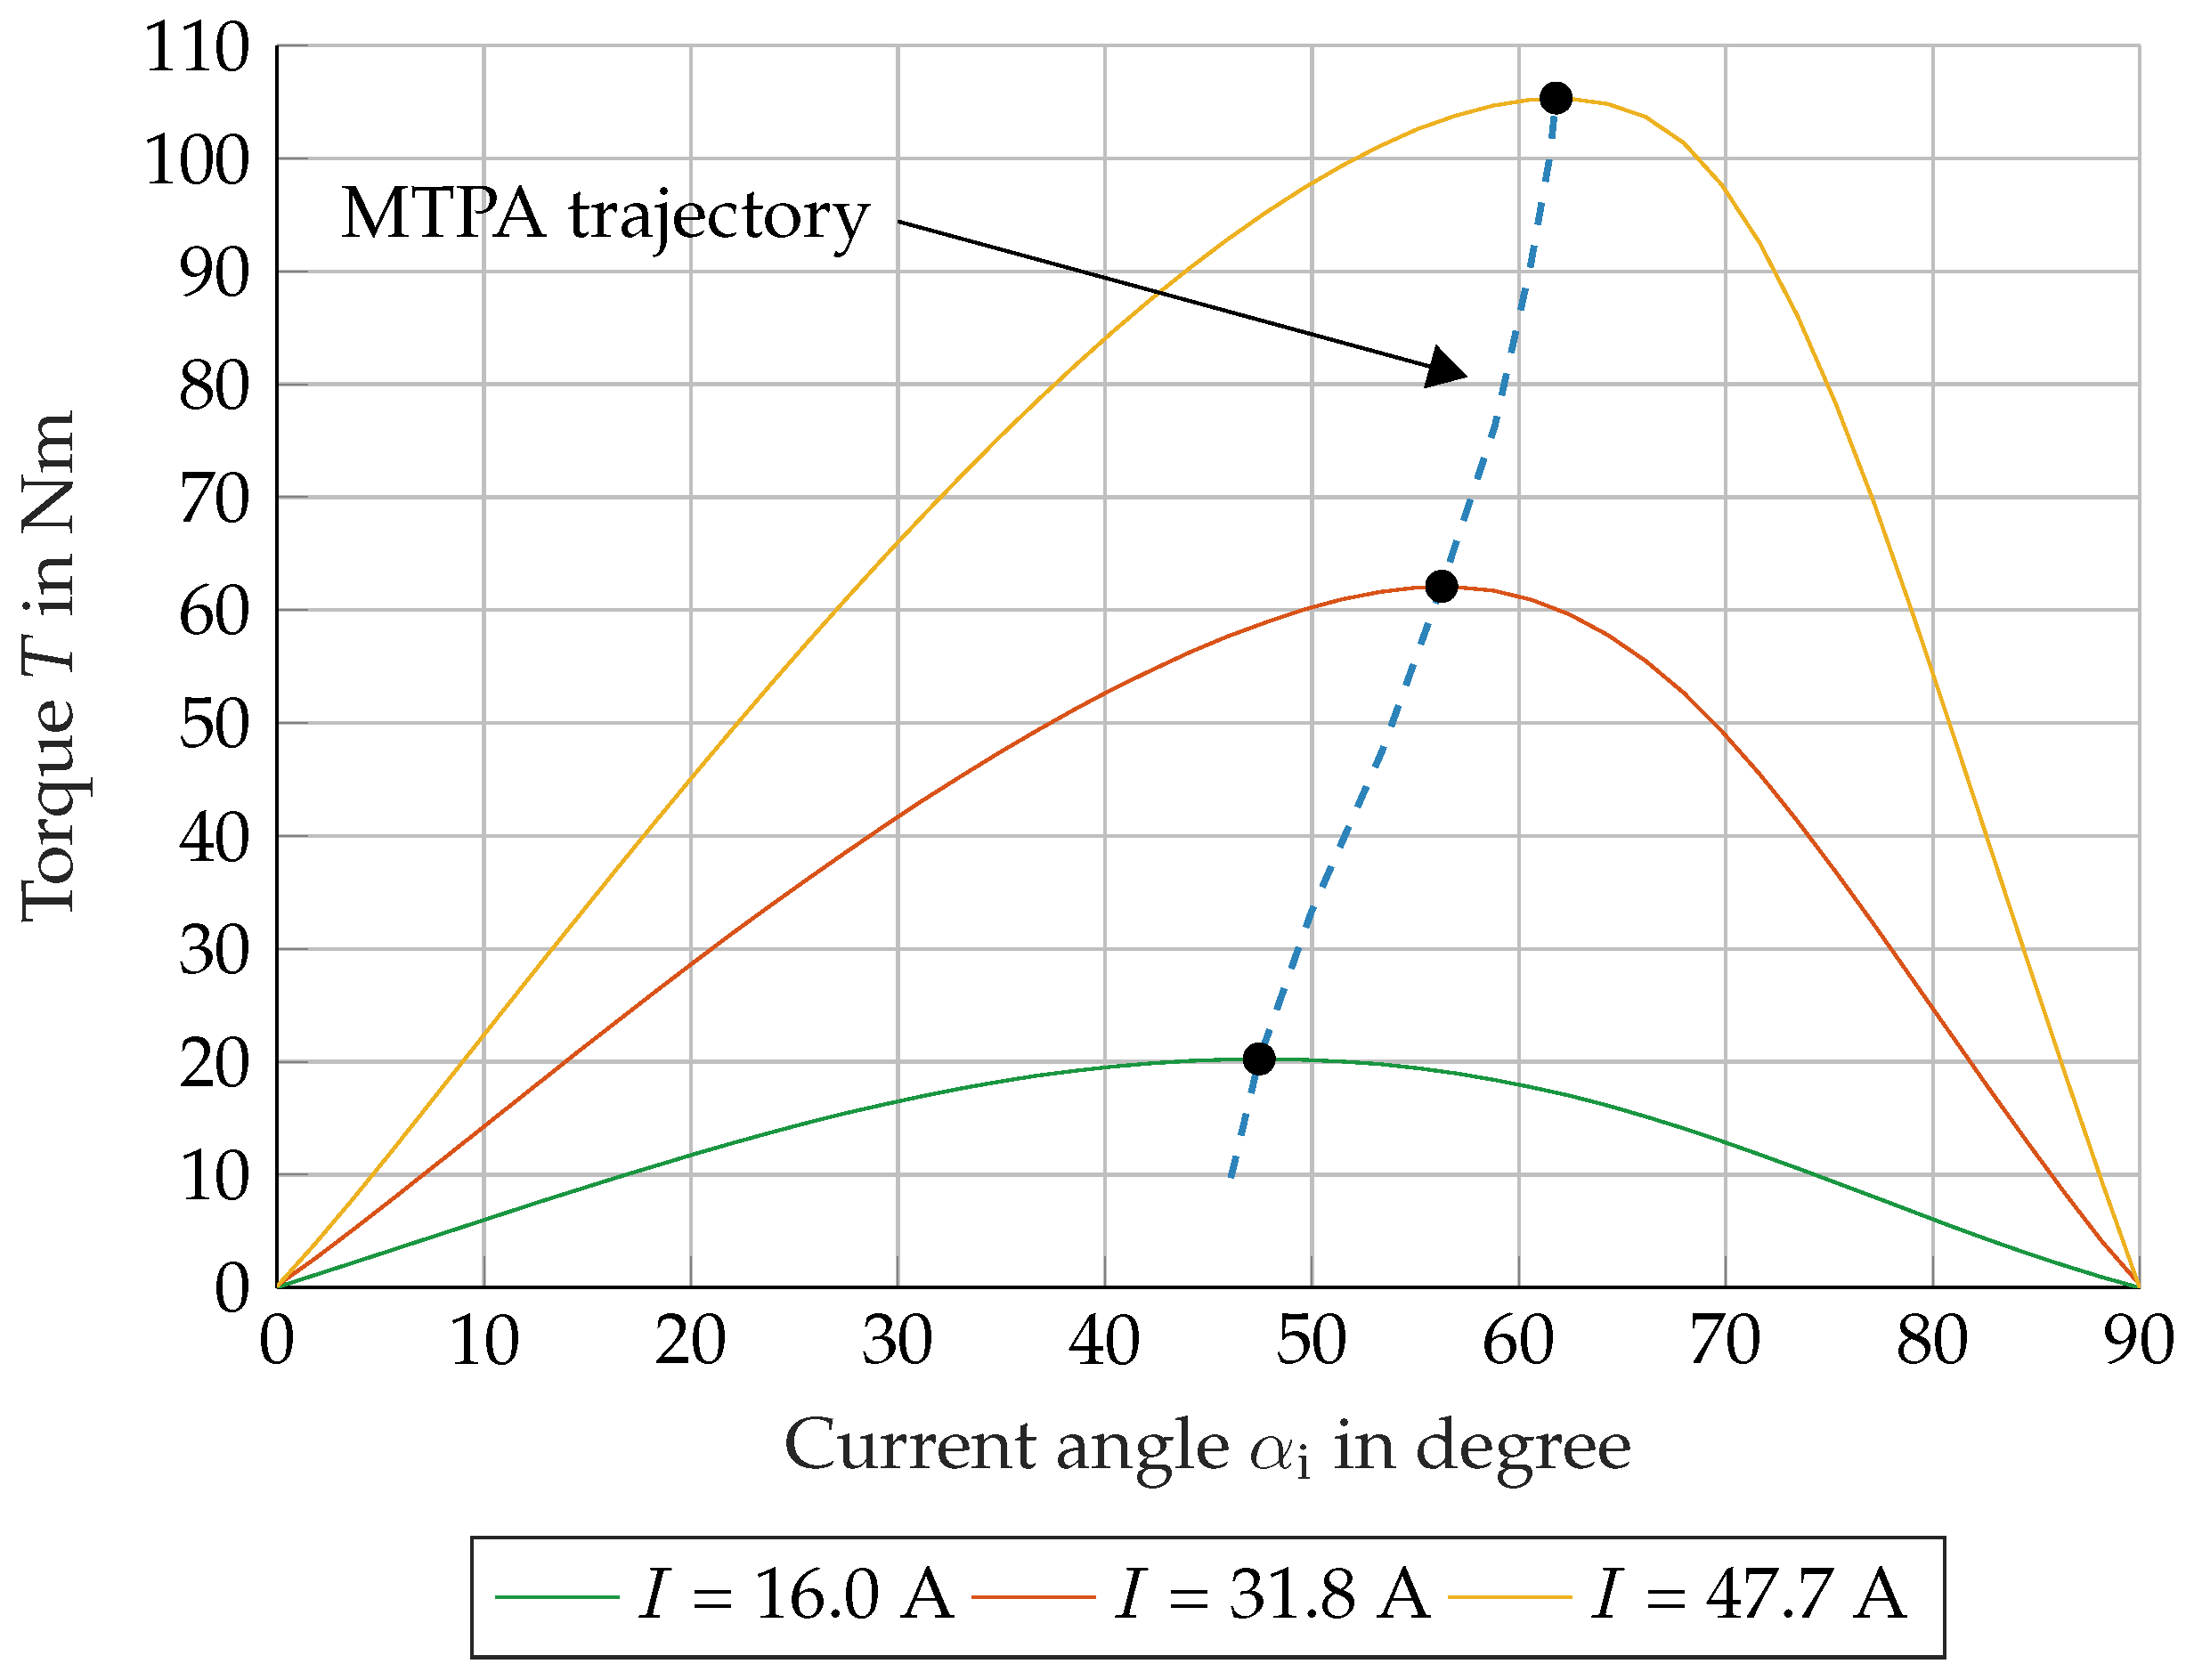
In Figure 11, the calculated air gap torque T δ ( I , α i ) is illustrated over the current angle α i as a function of the set effective phase current I for the exemplary currents I = 16   A , I = 31.8   A , and I = 47.7   A .
As illustrated in Figure 11, with an increase in the effective current I, the current angle α i of the maximum torque also increases. This phenomenon can be attributed to the saturation of the magnetizing rotor axis (d-axis). It has been demonstrated that when the d-axis saturates, the torque can be further increased by a higher q current i q . The maximum is necessary to determine the trajectory for the maximum torque per ampere (MTPA) control method. The torque and the associated current angle depend on the material parameters and, consequently, exert an influence on the calculation result.
The present study will examine Case 1 (C1) to Case 4 (C4) to investigate the manufacturing influences on machine behavior. For this purpose, the various material parameters listed in Table 7 are assigned to the respective regions in the FE model. The flux linkage maps Ψ d ( i d , i q ) , Ψ q ( i d , i q ) and the average air gap torque T δ ( i d , i q ) are calculated. The results of the calculation of the four simulation cases are shown in Figure 12 for comparison.
As illustrated in Figure 12 it can be seen that the manufacturing influence and the pressing of the stator core into the machine casing have a significant influence on the maximum torque (−4.2% at I = 47.7   A ) and the corresponding current angle α i (−3.4% at I = 47.7   A ). The manufacturing process has a negative impact on the magnetization characteristics of the electrical steel sheet. Due to the shift of the commutation curve to higher magnetic polarizations (see Figure 2), a higher phase current is required for the same magnetomotive force F . Additionally, a comparison of the results presented in Figure 12 reveals that the existing mechanical stresses in the stator yoke, resulting from the press-fit process in Case 3 and Case 4, exert a more substantial influence.
The influence of mechanical stresses on the behavior of the simulated machine can be described and compared as follows. The entire magnetic flux linkage of a magnetic pole is spread out across the stator yoke. For a comparison and a physically explanation, the flux linkage of the machine is transformed into the rotor coordinate system Ψ d , q . The magnetic path of the d-axis mainly consists of electrical steel. The q-axis, however, consists mainly of air due to the flux barriers in the rotor. It should be noted that the influence of manufacturing on the rotor is not considered in this work and, therefore, the material of the rotor was not changed. The focus lies in the investigation of the manufacturing influences in the stator core and their influences on the machine performance. For that, the presented simulation results from Case 1 to Case 4 are used for the explanation. To illustrate this, the operating point at maximum torque with a set current of I = 47.7   A is considered as an example. In Table 8 the flux linkages Ψ d , q and the associated absolute inductance L d , q are listed for a comparison.
When the same current is applied to the machine, the magnetization characteristic shifts from Case 1 to Case 4, towards higher magnetic field strengths (Figure 2). This has an effect on the flux linkage Ψ and, thus, on the flux linkages Ψ d , q in the rotor coordinate system. From this, it can be deduced that the d-axis is more dependent on manufacturing influences than the q-axis. Table 8 shows that the flux linkage Ψ d in the d-axis decreases due to the various manufacturing influences taken into account. The poorer magnetization is evident here. Simultaneously, the current angle must be reduced in order to achieve the maximum possible magnetization of the d-axis, due to the increasing demand for magnetic field strengths (Figure 2). Furthermore, the comparison shows that, due to the smaller required current angle, the flux linkage in the q-axis decreases to almost the same extent as the q-current. This means that the q-axis is less susceptible to manufacturing influences because of the dominant linear behavior of air in the flux barriers.
This becomes clear by a comparison of the absolute inductance L d , q at the operating point. L q remains constant across the cases under consideration, whereas L d decreases by 7.5%, comparing Case 4 to Case 1. The average air gap torque T δ also decreases due to the need of reducing the current angle α i for the best possible magnetization of the machine. From (6), it can be seen that poorer magnetization and a simultaneous reduction in the current angle results in a decreasing difference of the term ( Ψ d ( i d , i q ) · i q Ψ q ( i d , i q ) · i d ) . Finally, this effect decreases the generated air gap torque of the RSM by 4.2%, comparing Case 4 to Case 1.
In order to verify the simulated torque values and the magnetic flux linkages Ψ d ( i d , i q ) and Ψ q ( i d , i q ) , the RSM is measured on a motor test bench. The results of this measurement are then compared with those calculated here.

7. Measurements on the Machine Test Bench

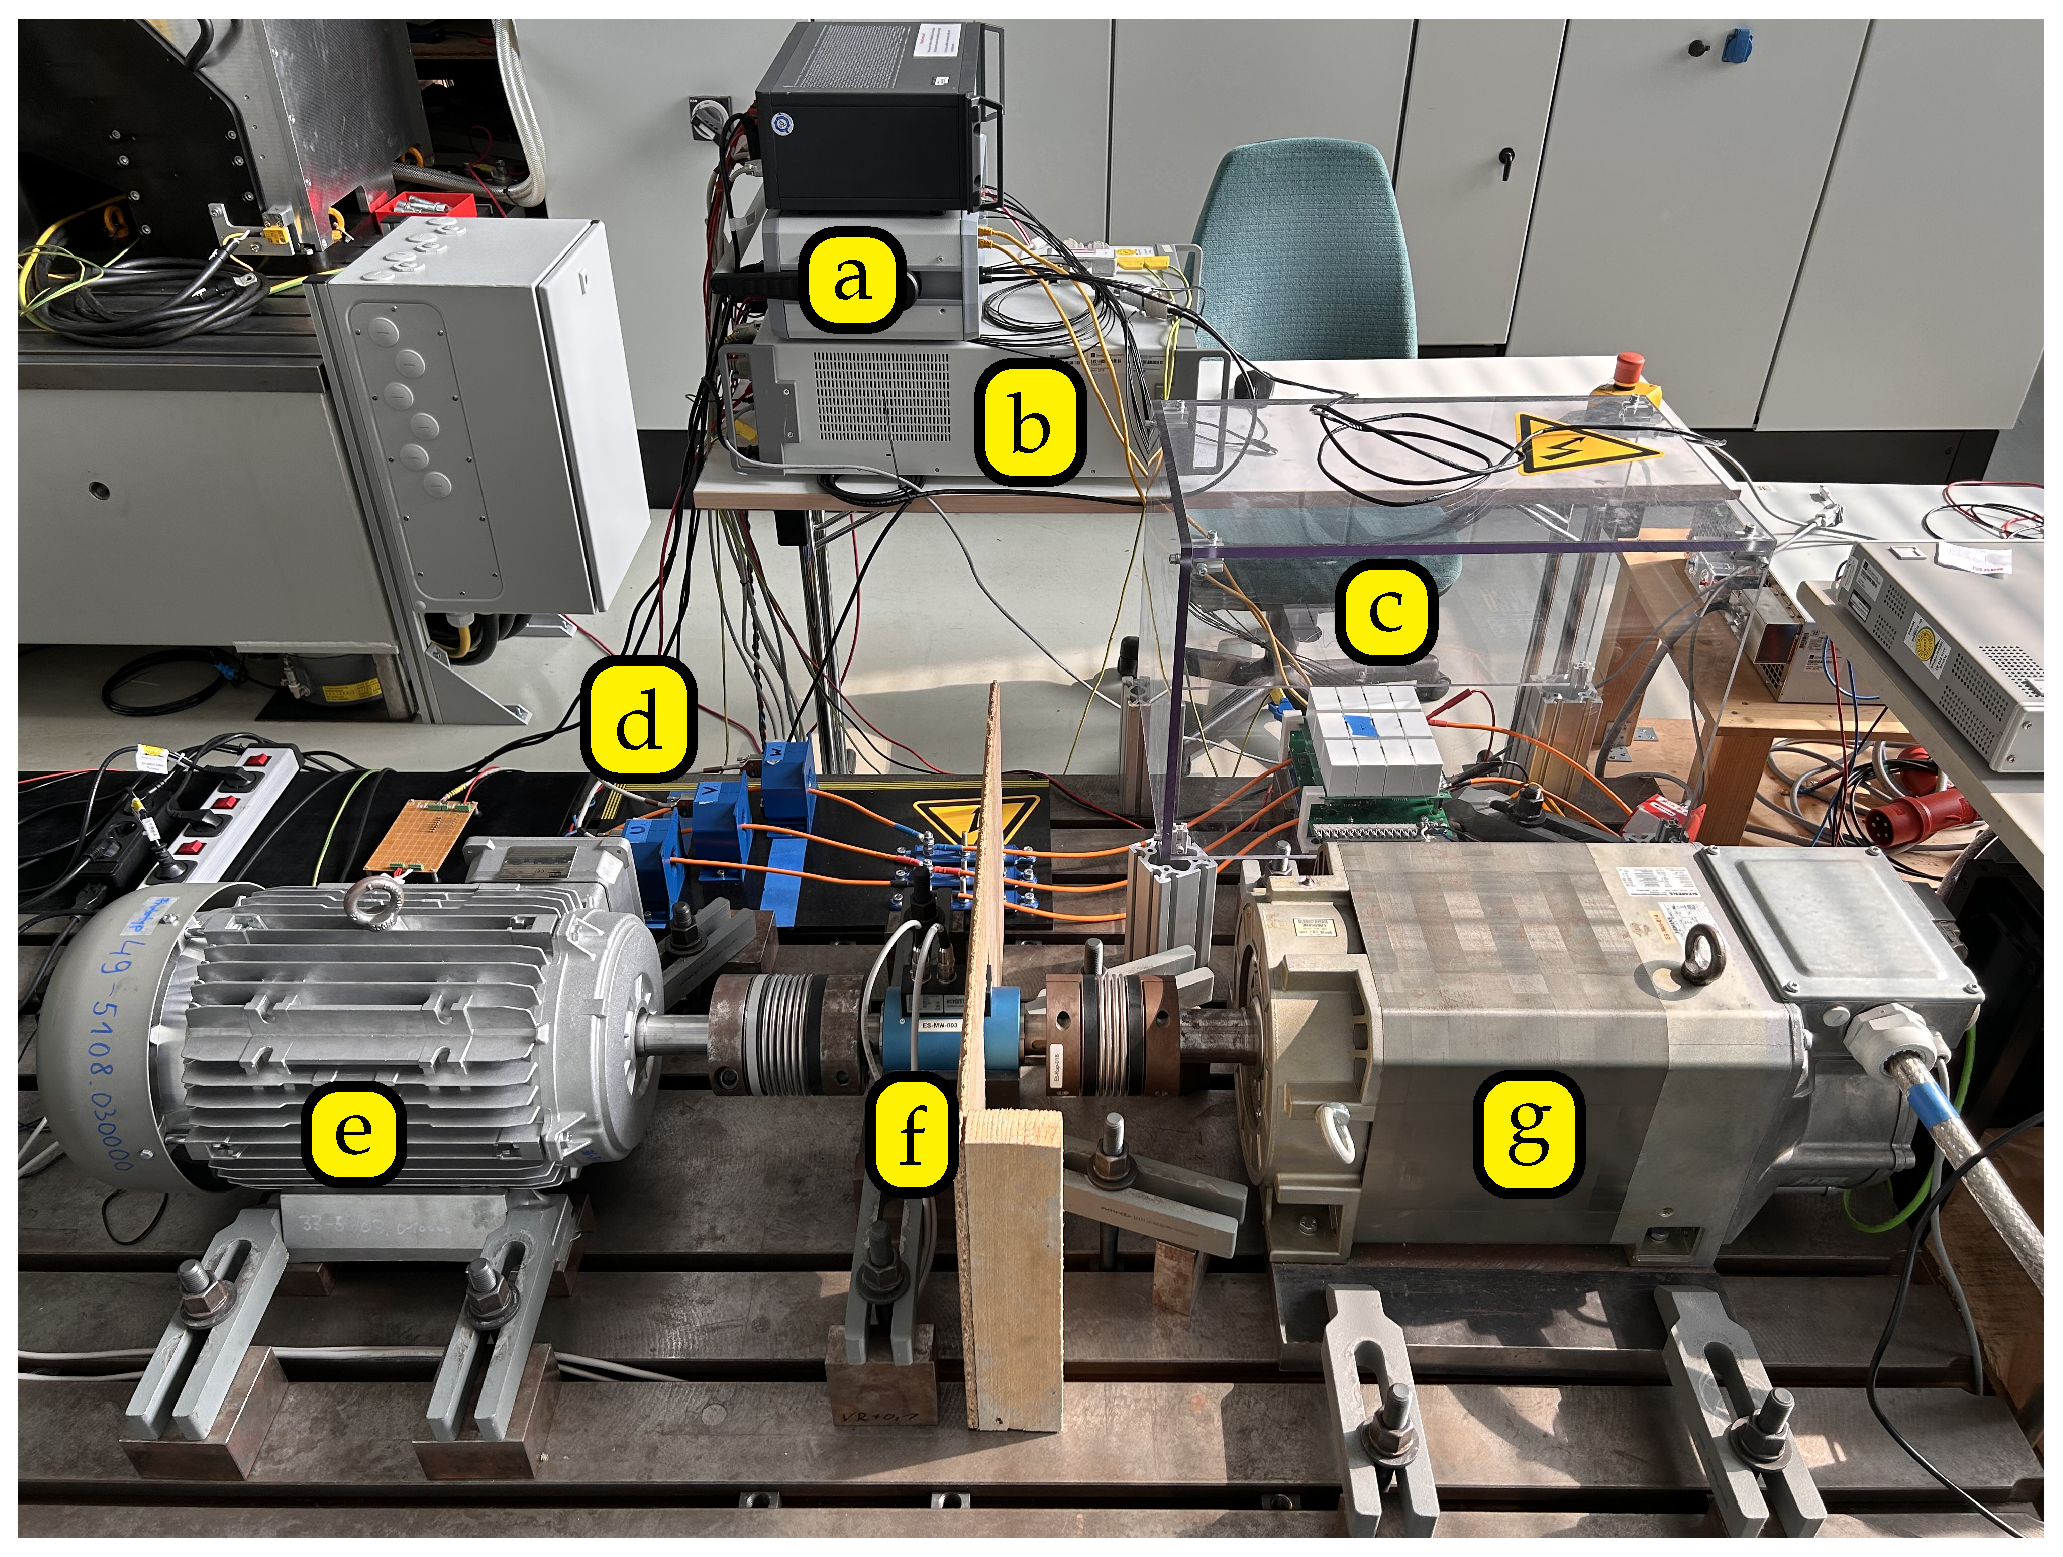
In order to validate the simulation results presented in Section 6, the previously designed RSM is measured on a machine test bench. The machine test bench is illustrated in Figure 13.
As illustrated in Figure 13, the motor test bench is equipped with a prototype of a RSM (e) that is coupled to a load machine (g) via a torque measuring shaft (f). The load machine has a rated power of P mech = 30   k W . The RSM is connected to a frequency inverter (c). The current control and the control of the inverter are both regulated via the UltraZohm (a) [38]. A power analyzer (b) is used for precise power measurement. It measures the three phase voltages U U , U V , and U W as well as the three phase currents I U , I V , and I W in the time domain via current transformers (d). The torque measuring shaft (f) is connected to the power meter to measure the mechanical power ( P mech ) simultaneously.
The load machine has been configured to operate at a speed of n = 100   min 1 . This speed corresponds to an electrical frequency of f el = 3.3   Hz .
Due to the low frequency, the core losses can be neglected when measuring the flux linkage maps. The current angle is set from α i = 0 ° to α i = 90 ° for different current amplitudes, ranging from I ^ = 15.2   A to I ^ = 67.5   A via the current control. The electrical and mechanical measured variables are recorded in the time domain.
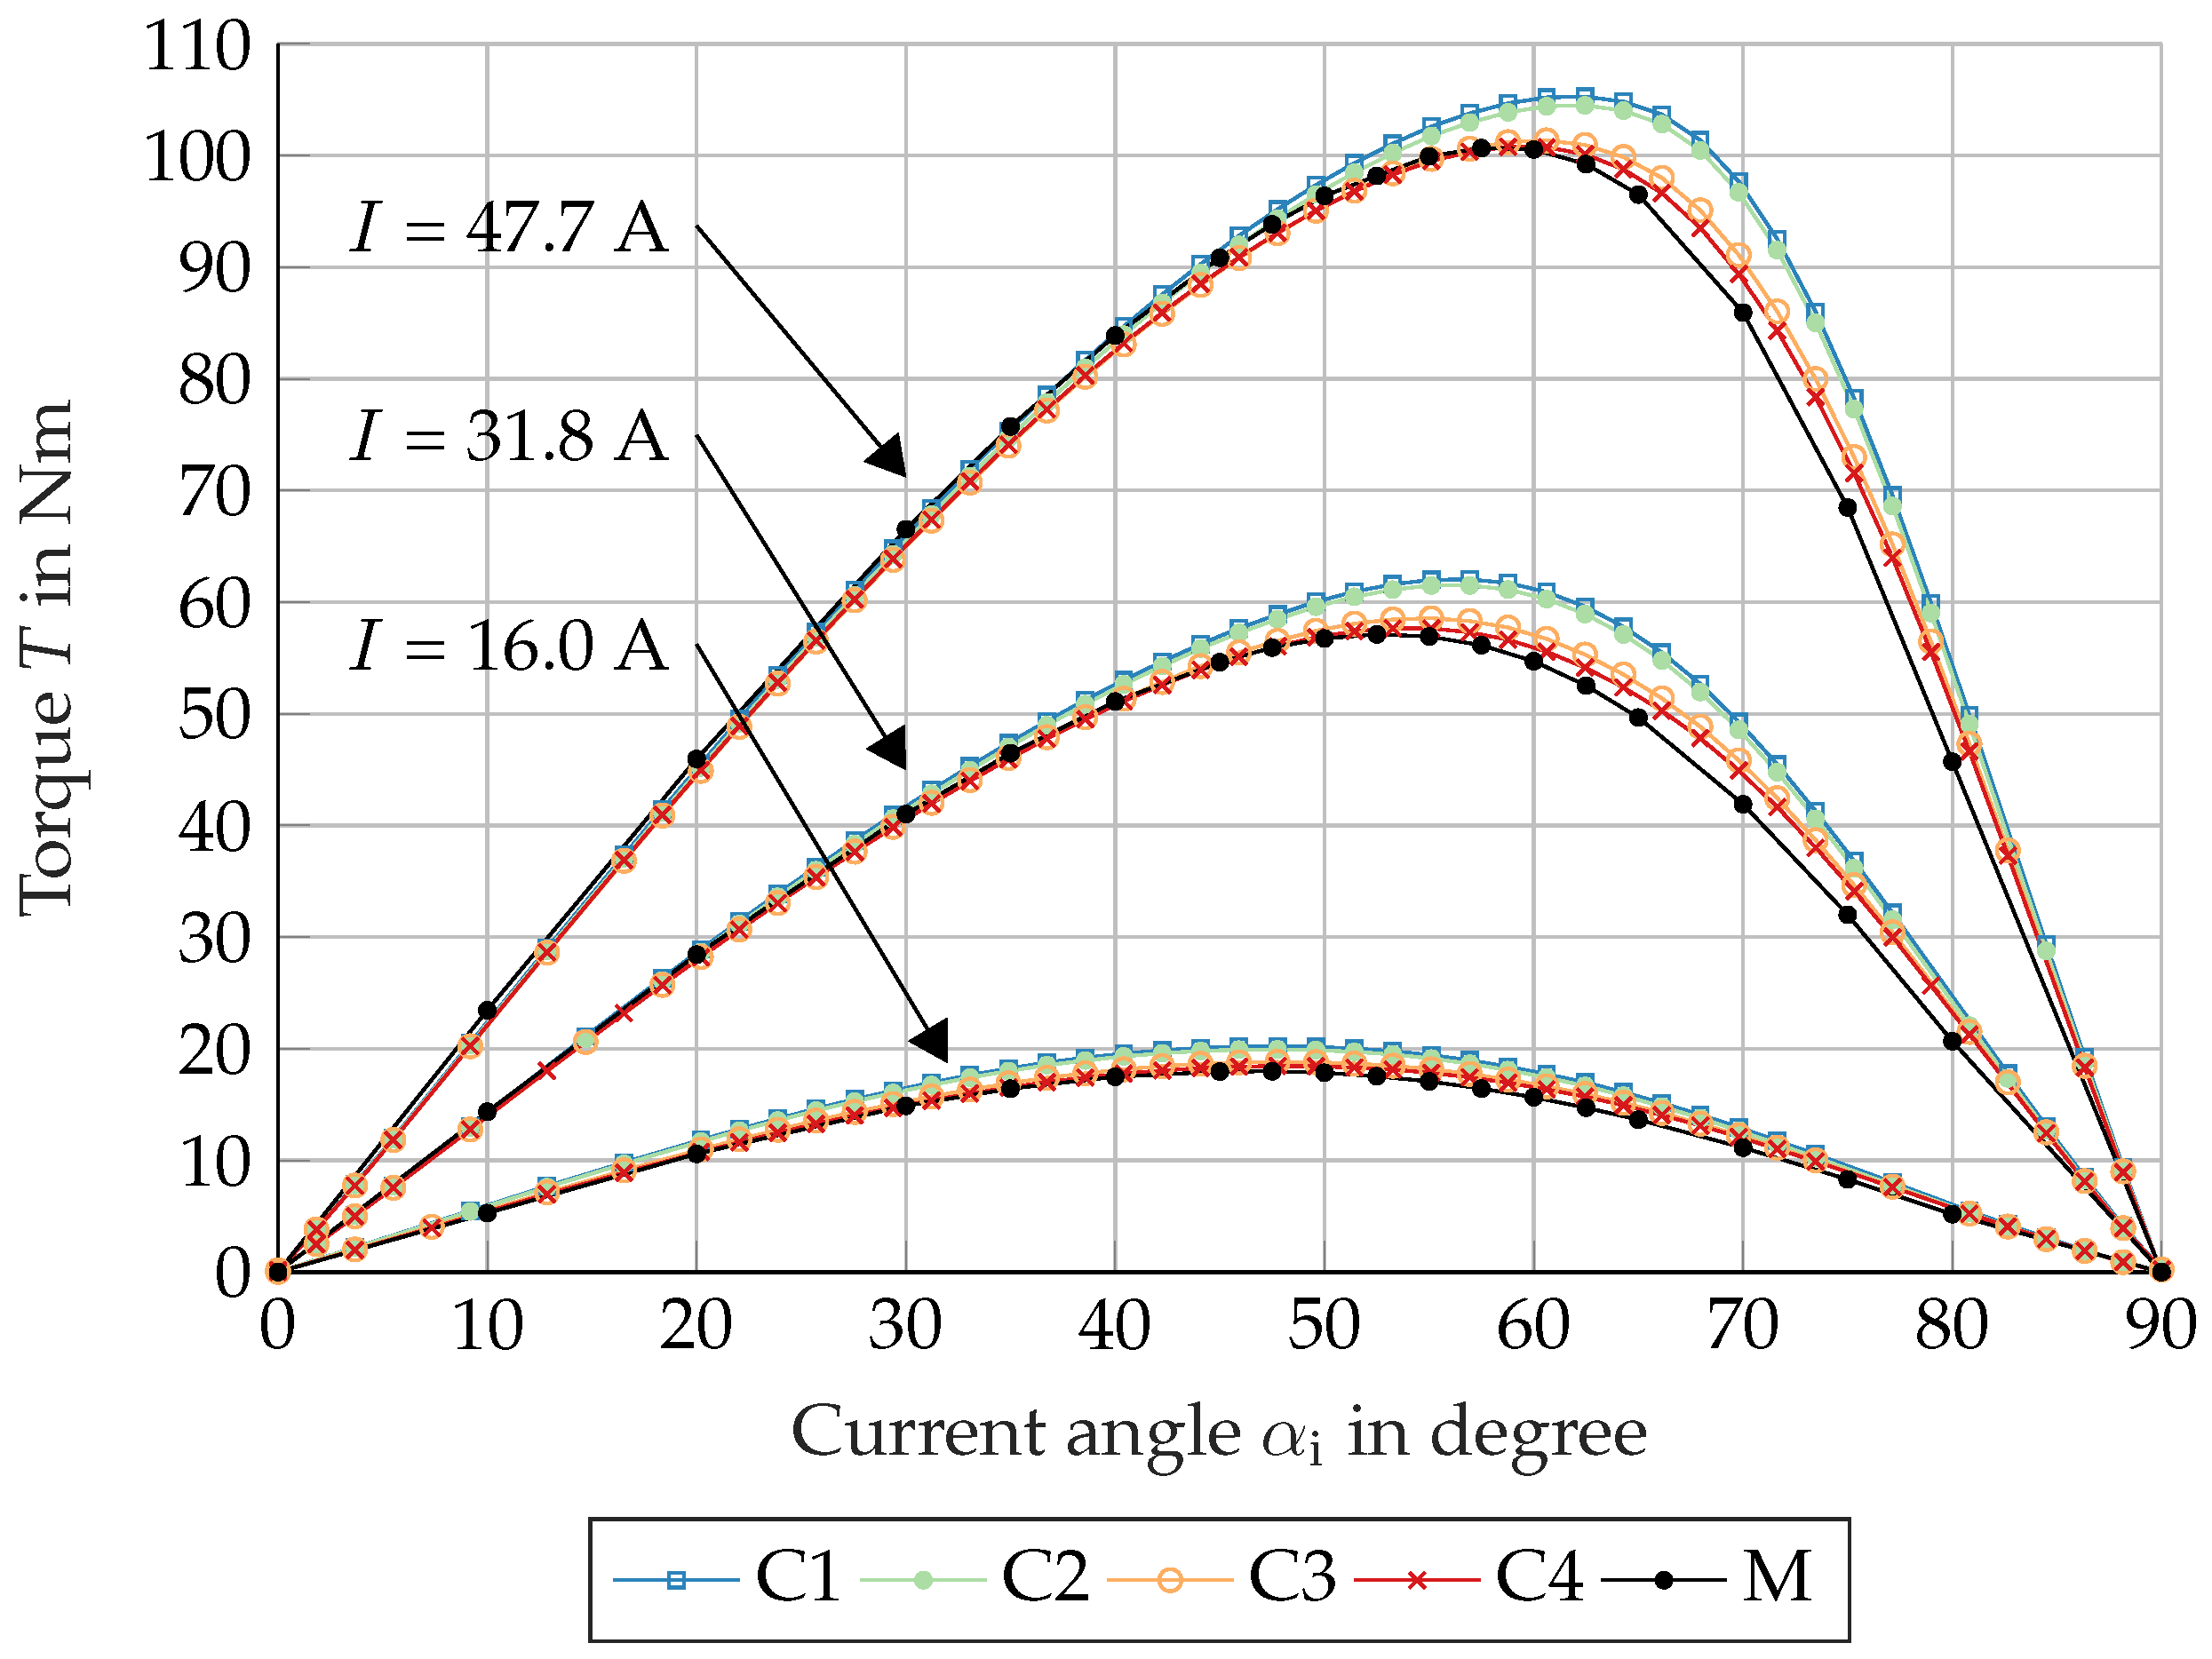
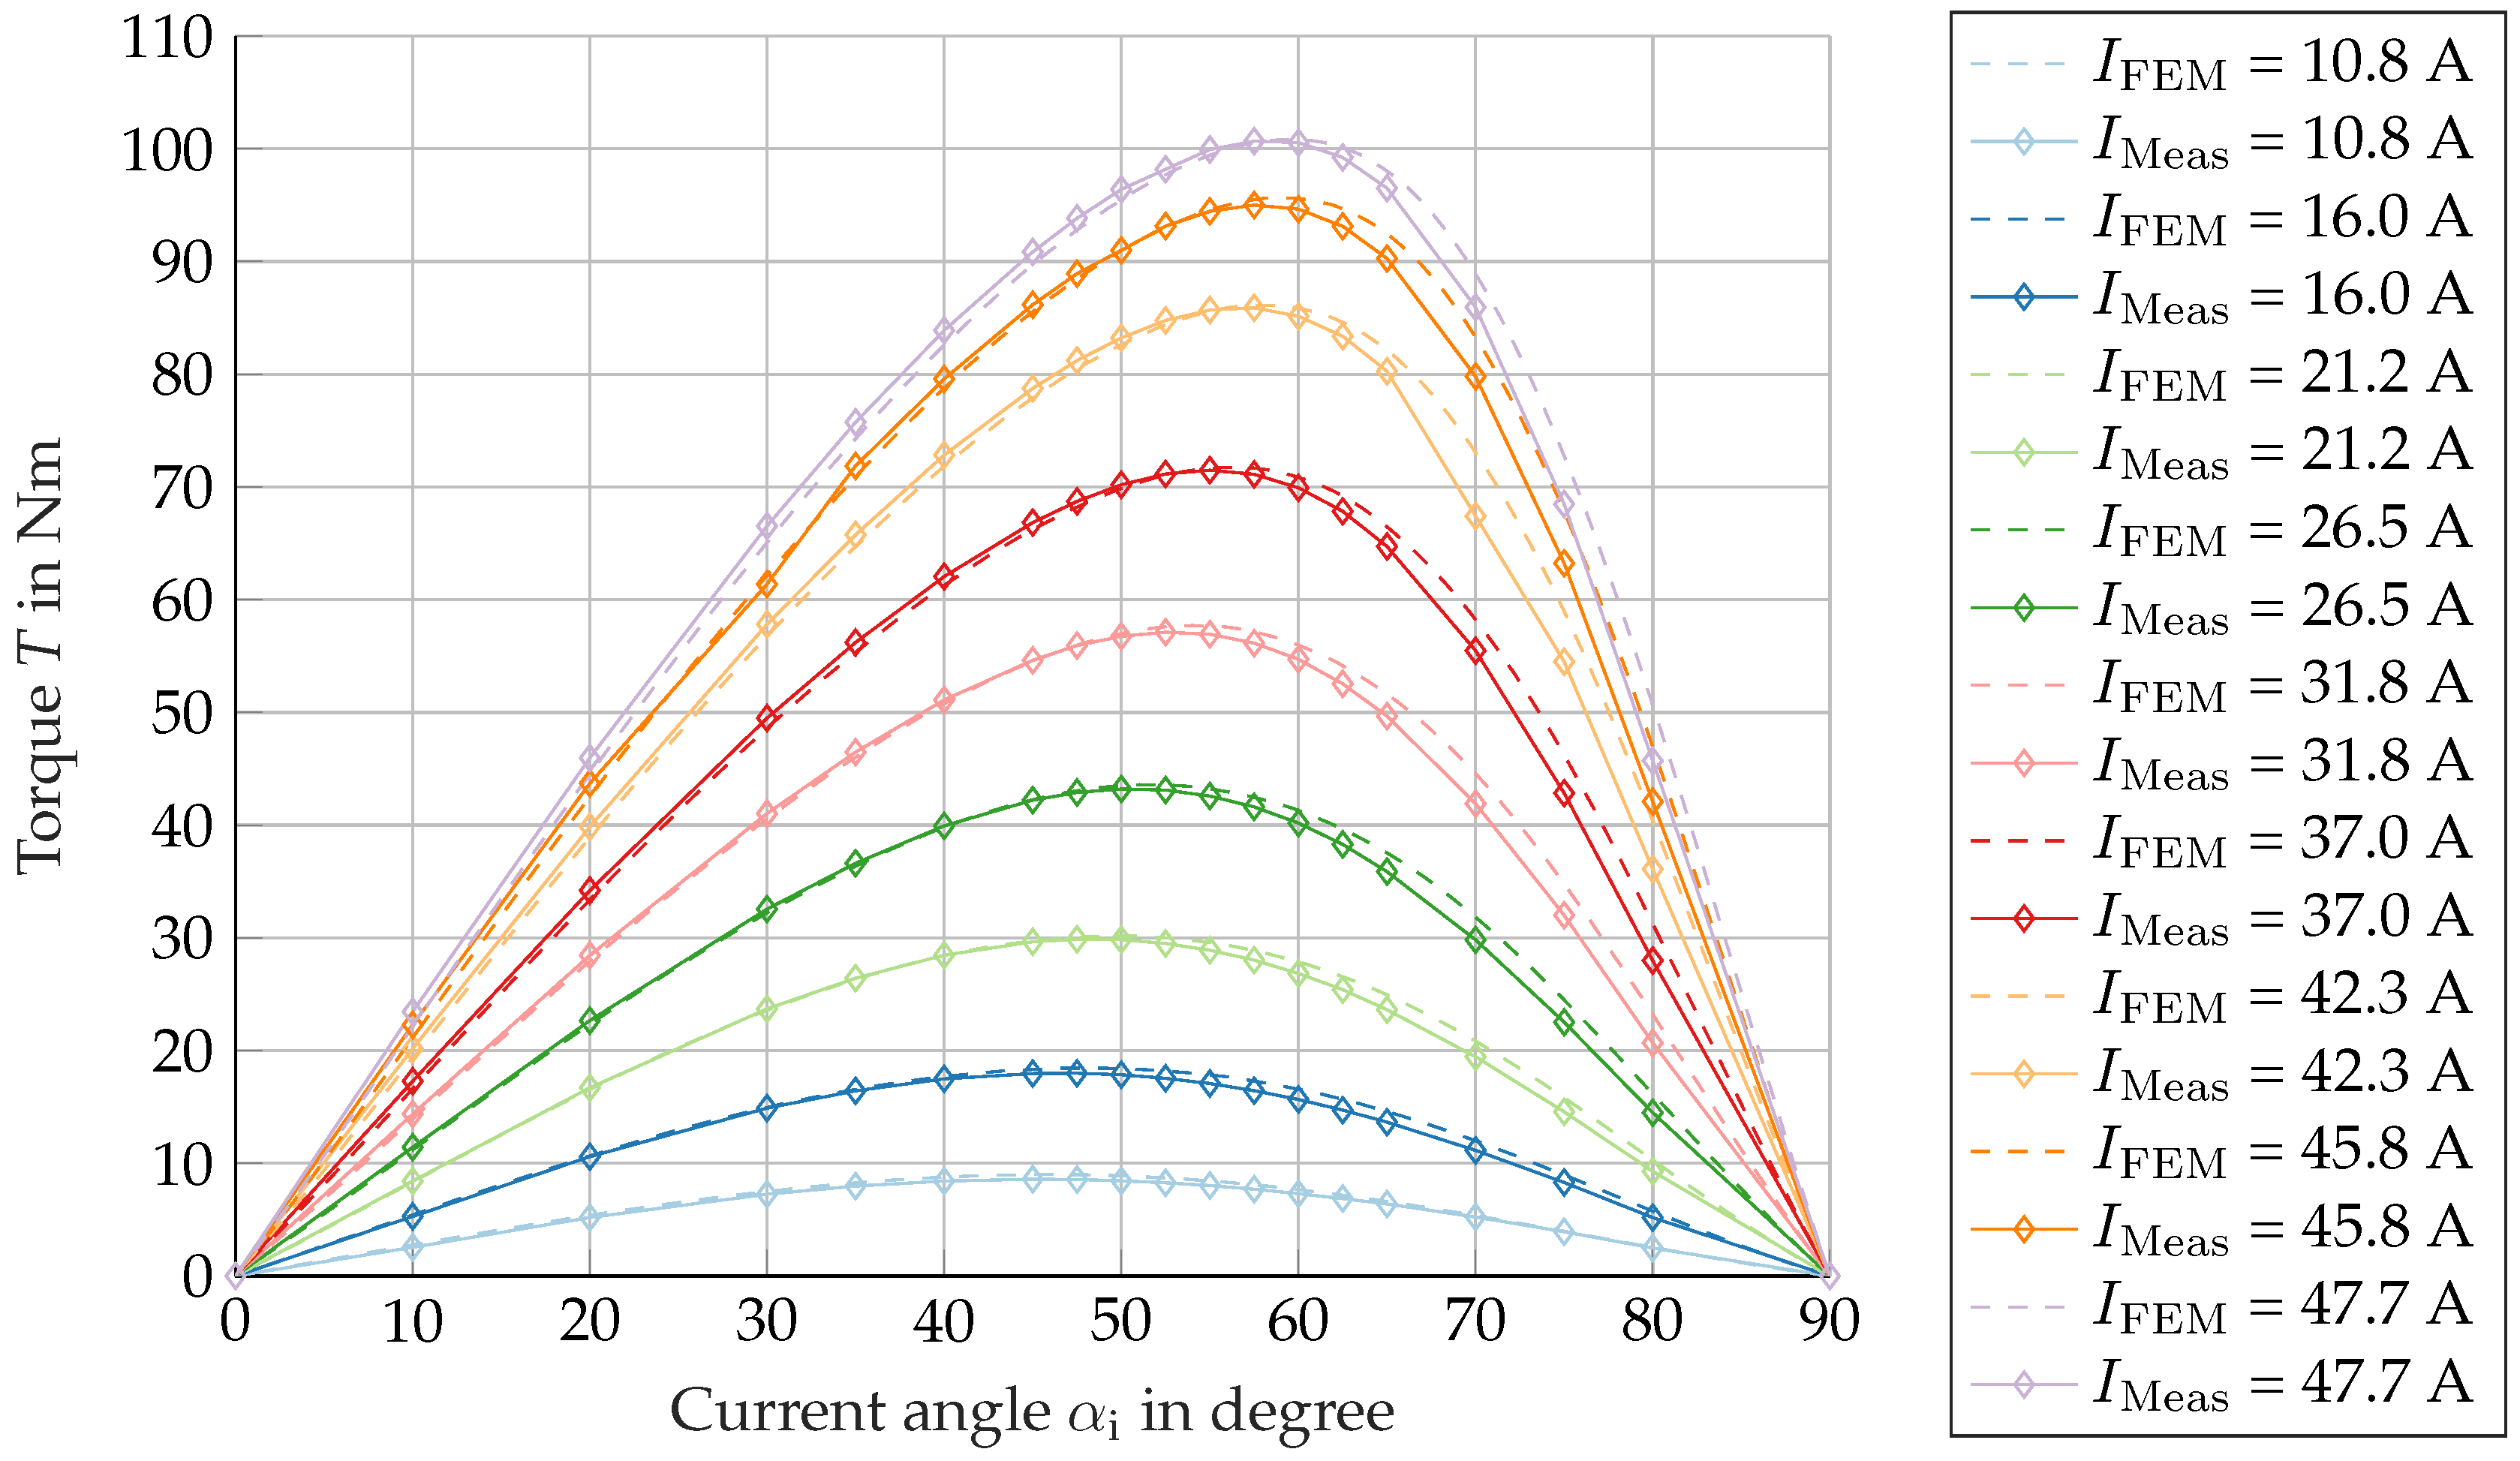
A comparison of the corresponding measurements has been conducted for the example currents I = 16   A , I = 31.8   A , and I = 47.7   A used in Section 6. As illustrated in Figure 14, the average torque is plotted against the current angle and the corresponding currents.
As illustrated in Figure 14, the measurement results demonstrate a strong correlation with the FEA results. When manufacturing influences are taken into account, a significant improvement in the calculation results compared to the measurement results can be achieved. The slight deviations observed in the torque values and the current angle of the descending branch can be ascribed to the fact that the air gap torque is determined in the FEA. In the context of experimental analysis, the shaft torque will be lower than that calculated in the FEA due to friction and ventilation losses.
Case 4 demonstrated the most favorable outcome in comparison to the established measurement. Consequently, this case is employed for the purpose of determining additional current values, which are then used for the validation process. As illustrated in Figure 15, the torque characterization for different current amplitudes is plotted over the current angle in comparison to the FE calculation Case 4.
The torque characteristics of the measured RSM in Figure 15 demonstrate a high degree of consistency across the range of effective currents set.
The influence of production on the calculated torque can be explained in more detail using the flux linkage maps of the d- and q-axis in Figure 16. The slope of the flux linkage in the d-axis (a) is reduced due to the weaker magnetization characteristic from Case 1 to Case 4. The aforementioned phenomenon culminates in a diminution of the flux linkage in the d-axis, particularly within the normally magnetized range. Consequently, this results (according to (8)) in a reduction in the average torque. As illustrated in Figure 16, the simulated flux linkage maps of the d- and q-axes of Cases 1 and 4 are presented in a comparative manner. The following Figure 16c,d offer a visual representation of the percentage deviation between Case 1 and Case 4. The areas of greatest deviation in the d-axis are attributable to the locations of the deviations in Figure 2, in conjunction with the specifications outlined in Table 7. A close examination reveals that the q-axis exhibits minimal variation. This can be explained by the fact that the enclosed air represents the dominant (magnetically linear) component in the q-axis. Due to the flux barriers, the manufacturing process has no significant influence on the magnetization characteristics.
In order to facilitate the analysis of core losses, the rated operating point of the machine according to Table 6 is selected at a speed of 2300 min 1 ( 76.67   Hz ) and a rated power of 23 k W . As illustrated in Table 9, the associated currents i d and i q are displayed, in addition to the results of the core losses for the simulation cases and the test bench measurement.
The discrepancy between the manufacturer’s data (Case 1) and the measured data of the machine is represented by a percentage of −33% for the core losses. As demonstrated in the following cases, the FEA results in deviations of −22%, −19%, and −15%, respectively. This finding suggests that by incorporating the manufacturing-related characteristic material curves, the discrepancy between the simulated core losses and the measured value on the test bench can be mitigated by more than half. A non-negligible portion of the core losses in the machine under investigation is located in the rotor, caused by higher air gap harmonics resulting from stator slots. With regard to these results, it should be noted that manufacturing influences have not yet been taken into account for this part of the core losses from the rotor and are the focus of further work.
8. Conclusions

The outlined ring core measurement method for shortened stator stack samples effectively determines the magnetic characteristics of the electrical steel sheets. The investigation showed that manufacturing causes a significant shift in the commutation curve across the entire polarization range below saturation, with no evident effect in the saturation range. The largest relative increase in magnetic field strength comes from stator core production, particularly punching and axial stacking. Pressing-in also adds a substantial rise in magnetization demand. Magnetic measurements revealed that specific core losses increase notably after manufacturing steps. These losses can be accurately modeled for FEA using the Bertotti approach. Applying a two-region stator model allows the separate integration of different manufacturing effects into the electrical machine design.
Air gap torque versus current angle results show that manufacturing influences in the stator core significantly alter the shape and amplitude of these characteristic curves. Comparing with prototype test bench data reveals that these curves match the measurements more closely as additional manufacturing steps are included. The pressed-in stator stack’s integration into the stator yoke has the largest impact. Flux linkage maps confirm that manufacturing effects are especially strong in the d-axis. These more accurate flux linkage maps and torque–current angle characteristics support the development of optimized control algorithms.
Including manufacturing effects reduced the simulation–measurement discrepancy in rated operating point core losses by more than 50%. Accounting for rotor magnetic property changes offers further potential for optimization. This study demonstrates that using magnetic characteristic curves measured under real manufacturing conditions significantly improves calculation accuracy in electrical machine design, enabling both performance enhancements and more precise control strategies.

Author Contributions

Conceptualization, methodology, validation, formal analysis, investigation, resources, data curation, writing—original draft preparation, visualization: M.R. (Martin Regnet), and M.S.; writing—review and editing, supervision: A.V.P., B.L., M.R. (Michael Reinlein), A.D., J.G., and N.P. All authors have read and agreed to the published version of the manuscript.

Funding

This research was funded by Federal Ministry for Economic Affairs and Energy grant number KK5170401AB0. The APC was funded by Institute ELSYS, Technische Hochschule Nürnberg.

Data Availability Statement

The raw data supporting the conclusions of this article will be made available by the authors on request.

Acknowledgments

During the preparation of this manuscript, the author(s) used DeepL by DeepL SE (Q2 2025) for text editing. The authors have reviewed and edited the output and take full responsibility for the content of this publication.

Conflicts of Interest

The authors declare no conflicts of interest. The funders had no role in the design of the study; in the collection, analyses, or interpretation of data; in the writing of the manuscript; or in the decision to publish the results. Michael Reinlein is from BEN Buchele Elektromotorenwerke GmbH; the company had no role in the design of the study; in the collection, analyses, or interpretation of data; in the writing of the manuscript, or in the decision to publish the results.

Abbreviations

The following abbreviations are used in this manuscript:
RSMReluctance synchronous machine
SSTSingle strip tester
FEAFinite element analysis

References

  1. Bali, M.; Muetze, A. The Degradation Depth of Non-grain Oriented Electrical Steel Sheets of Electric Machines Due to Mechanical and Laser Cutting: A State-of-the-Art Review. IEEE Trans. Ind. Appl. 2019, 55, 366–375. [Google Scholar] [CrossRef]
  2. Dems, M.; Gmyrek, Z.; Komeza, K. The Influence of Cutting Technology on Magnetic Properties of Non-Oriented Electrical Steel—Review State of the Art. Energies 2023, 16, 4299. [Google Scholar] [CrossRef]
  3. Naumoski, H.; Maucher, A.; Vandenbossche, L.; Jacobs, S.; Herr, U.; Chassang, X. Magneto-optical and field-metric evaluation of the punching effect on magnetic properties of electrical steels with varying alloying content and grain size. In Proceedings of the 4th International Electric Drives Production Conference (EDPC), Nuremberg, Germany, 30 September–1 October 2014; pp. 1–9. [Google Scholar] [CrossRef]
  4. Gmyrek, Z.; Cavagnino, A.; Ferraris, L. Estimation of the Magnetic Properties of the Damaged Area Resulting From the Punching Process: Experimental Research and FEM Modeling. IEEE Trans. Ind. Appl. 2013, 49, 2069–2077. [Google Scholar] [CrossRef]
  5. Hofmann, M.; Naumoski, H.; Herr, U.; Herzog, H. Magnetic Properties of Electrical Steel Sheets in Respect of Cutting: Micromagnetic Analysis and Macromagnetic Modeling. IEEE Trans. Magn. 2016, 52, 2000114. [Google Scholar] [CrossRef]
  6. Saleem, A.; Alatawneh, N.; Rahman, T.; Lowther, D.A.; Chromik, R.R. Effects of Laser Cutting on Microstructure and Magnetic Properties of Non-Orientation Electrical Steel Laminations. IEEE Trans. Magn. 2020, 56, 6100609. [Google Scholar] [CrossRef]
  7. Imamori, S.; Steentjes, S.; Hameyer, K. Influence of Interlocking on Magnetic Properties of Electrical Steel Laminations. IEEE Trans. Magn. 2017, 53, 8108704. [Google Scholar] [CrossRef]
  8. Vaschetto, S.; Gmyrek, Z.; Dobler, C.; Bramerdorfer, G.; Cavagnino, A. Experimental Assessment and Modeling of Losses in Interlocked Magnetic Cores. IEEE Trans. Ind. Appl. 2022, 58, 4450–4460. [Google Scholar] [CrossRef]
  9. Mahmouditabar, F.; Baker, N. A Review on the Effect of Electrical Steel Manufacturing Processes on the Performance of Electric Machines. Energies 2023, 16, 7954. [Google Scholar] [CrossRef]
  10. Boubaker, N.; Matt, D.; Enrici, P.; Nierlich, F.; Durand, G. Measurements of Iron Loss in PMSM Stator Cores Based on CoFe and SiFe Lamination Sheets and Stemmed From Different Manufacturing Processes. IEEE Trans. Magn. 2019, 55, 8100309. [Google Scholar] [CrossRef]
  11. Bourchas, K.; Stening, A.; Soulard, J.; Broddefalk, A.; Lindenmo, M.; Dahlén, M.; Gyllensten, F. Quantifying Effects of Cutting and Welding on Magnetic Properties of Electrical Steels. IEEE Trans. Ind. Appl. 2017, 53, 4269–4278. [Google Scholar] [CrossRef]
  12. Daem, A.; Ibrahim, M.N.; Sergeant, P.; Dupré, L. Stress-Dependent Magnetic Equivalent Circuit for Modeling Welding Effects in Electrical Steel Laminations. Machines 2022, 10, 1153. [Google Scholar] [CrossRef]
  13. Krings, A.; Nategh, S.; Wallmark, O.; Soulard, J. Influence of the Welding Process on the Performance of Slotless PM Motors With SiFe and NiFe Stator Laminations. IEEE Trans. Ind. Appl. 2014, 50, 296–306. [Google Scholar] [CrossRef]
  14. Mierczak, L.; Klimczyk, P.; Hennies, D.; Denke, P.; Siebert, S. Influence of Manufacturing Processes on Magnetic Properties of Stator Cores. In Proceedings of the International Conference on Electrical Machines (ICEM), Gothenburg, Sweden, 23–26 August 2020; Volume 1, pp. 901–908. [Google Scholar] [CrossRef]
  15. Schoppa, A.; Schneider, J.; Wuppermann, C.D.; Bakon, T. Influence of welding and sticking of laminations on the magnetic properties of non-oriented electrical steels. J. Magn. Magn. Mater. 2003, 254–255, 367–369. [Google Scholar] [CrossRef]
  16. Bernard, L.; Daniel, L. Effect of Stress on Magnetic Hysteresis Losses in a Switched Reluctance Motor: Application to Stator and Rotor Shrink Fitting. IEEE Trans. Magn. 2015, 51, 7002513. [Google Scholar] [CrossRef]
  17. Fujisaki, K.; Satoh, S. Numerical calculations of electromagnetic fields in silicon steel under mechanical stress. IEEE Trans. Magn. 2004, 40, 1820–1825. [Google Scholar] [CrossRef]
  18. Fujisaki, K.; Hirayama, R.; Kawachi, T.; Satou, S.; Kaidou, C.; Yabumoto, M.; Kubota, T. Motor Core Iron Loss Analysis Evaluating Shrink Fitting and Stamping by Finite-Element Method. IEEE Trans. Magn. 2007, 43, 1950–1954. [Google Scholar] [CrossRef]
  19. Takahashi, N.; Morimoto, H.; Yunoki, Y.; Miyagi, D. Effect of shrink fitting and cutting on iron loss of permanent magnet motor. J. Magn. Magn. Mater. 2008, 320, e925–e928. [Google Scholar] [CrossRef]
  20. Zhu, L.; Fan, B.; Han, X.; Tang, R. Effects of shrink fitting on iron losses of a permanent magnet synchronous motor with an amorphous core. IET Electr. Power Appl. 2022, 16, 996–1003. [Google Scholar] [CrossRef]
  21. Komeza, K.; Dems, M.; Wiak, S.; Libera, R.; Pietrzak, J.; Stando, P.; Tomczyk, K. Influence of the Cast Iron Frame on the Distribution of the Magnetic Field in the Stator Yoke and Additional Power Losses in the Induction Motor. Electronics 2024, 13, 119. [Google Scholar] [CrossRef]
  22. Regnet, M.; Valencia Pérez, A.; Kremser, A.; Dietz, A.; Löhlein, B.; Reinlein, M. Influence of Compressive Stresses on Core Losses and Magnetization Demand of Electrical Steel Sheets and Press Fitted Stator Cores. In Proceedings of the 14th International Electric Drives Production Conference (EDPC), Regensburg, Germany, 26–27 November 2024; pp. 1–8. [Google Scholar] [CrossRef]
  23. Farhan, A.; Abdelrahem, M.; Hackl, C.M.; Kennel, R.; Shaltout, A.; Saleh, A. Advanced Strategy of Speed Predictive Control for Nonlinear Synchronous Reluctance Motors. Machines 2020, 8, 44. [Google Scholar] [CrossRef]
  24. Wendel, S.; Karamanakos, P.; Gebhardt, P.; Dietz, A.; Kennel, R. Flux Linkage-Based Direct Model Predictive Current Control for Synchronous Machines. IEEE Trans. Power Electron. 2021, 36, 14237–14256. [Google Scholar] [CrossRef]
  25. Schmidt, M.; Wilfling, T.; Dietz, A.; Parspour, N. An overview of design and calculation of a synchronous-reluctance machine. In Proceedings of the 13th International Electric Drives Production Conference (EDPC), Regensburg, Germany, 29–30 November 2023; pp. 1–8. [Google Scholar] [CrossRef]
  26. Reinlein, M. Simulation der Eisenverluste und des Magnetisierungsbedarfs unter Berücksichtigung von Fertigungseinflüssen in Induktionsmaschinen, 1st ed.; Kaiserslauterer Beiträge zur Antriebstechnik; Shaker Verlag: Kaiserslautern, Germany, 2018; Volume 13. [Google Scholar] [CrossRef]
  27. IEC 60404-2:1996 + A1:2008; Magnetic Materials—Part 2: Methods of Measurement of the Magnetic Properties of Electrical Steel Strip and Sheet by Means of an Epstein Frame. German Version EN 60404-2:1998 + A1:2008; DIN German Institute for Standardization: Berlin, Germany, 2018.
  28. Dems, M.; Komeza, K.; Gmyrek, Z.; Szulakowski, J. The Effect of Sample’s Dimension and Cutting Technology on Magnetization and Specific Iron Losses of FeSi Laminations. Energies 2022, 15, 2086. [Google Scholar] [CrossRef]
  29. Dems, M.; Komeza, K.; Szulakowski, J. Practical Approximation of Sheet Losses Taking into Account the Guillotine and Laser Cutting Effect. Energies 2023, 16, 2831. [Google Scholar] [CrossRef]
  30. IEC 60404-4:1995 + A1:2000 + A2:2008; Magnetic Materials—Part 4: Methods of Measurement of d.c. Magnetic Properties of Magnetically Soft Materials. German Version EN 60404-4:1997 + A1:2002 + A2:2008; DIN German Institute for Standardization: Berlin, Germany, 2008.
  31. IEC 60404-6:2018 + COR1:2018 + AMD1:2021; Magnetic Materials—Part 6: Methods of Measurement of the Magnetic Properties of Magnetically Soft Metallic and Powder Materials at Frequencies in the Range 20 Hz to 100 kHz by the Use of Ring Specimens. German version EN IEC 60404-6:2018 + AC:2018 + A1:2021; DIN German Institute for Standardization: Berlin, Germany, 2021.
  32. Schoppa, A.; Schneider, J.; Wuppermann, C.D. Influence of the manufacturing process on the magnetic properties of non-oriented electrical steels. J. Magn. Magn. Mater. 2000, 215–216, 74–78. [Google Scholar] [CrossRef]
  33. Weiss, H.A.; Leuning, N.; Steentjes, S.; Hameyer, K.; Andorfer, T.; Jenner, S.; Volk, W. Influence of shear cutting parameters on the electromagnetic properties of non-oriented electrical steel sheets. J. Magn. Magn. Mater. 2017, 421, 250–259. [Google Scholar] [CrossRef]
  34. Bozorth, R.M. Ferromagnetism; IEEE Press: Piscataway, NJ, USA, 1993. [Google Scholar]
  35. Naumoski, H.; Maucher, A.; Herr, U. Investigation of the influence of global stresses and strains on the magnetic properties of electrical steels with varying alloying content and grain size. In Proceedings of the 5th International Electric Drives Production Conference (EDPC), Nuremberg, Germany, 15–16 September 2015; pp. 1–8. [Google Scholar] [CrossRef]
  36. Bertotti, G. General properties of power losses in soft ferromagnetic materials. IEEE Trans. Magn. 1988, 24, 621–630. [Google Scholar] [CrossRef]
  37. Regnet, M.; Schäufele, T.; Dietz, A.; Löhlein, B. Temperature influence on core losses and magnetization demand of electrical steel sheets using adapted Epstein frame and ring probe. In Proceedings of the 13th International Electric Drives Production Conference (EDPC), Regensburg, Germany, 29–30 November 2023; pp. 1–7. [Google Scholar] [CrossRef]
  38. UltraZohm—Open Source Control Platform. Available online: https://ultrazohm.com/ (accessed on 30 June 2025).
Figure 1. Overview of stator samples: (a) Real machine stator prototype. (b) Stator stack 25  m m (Fit 0). (c) Fit 0 under measurement. (d) Real machine stator prototype within casing. (e) Stator stack 25  m m within aluminum ring. (f) Fit P under measurement.
Machines 13 00761 g001
Figure 2. Commutation curves for investigated manufacturing conditions of M270-50A at 50  Hz .
Machines 13 00761 g002
Figure 3. Deviation commutation curves for investigated manufacturing conditions of M270-50A at 50  Hz .
Machines 13 00761 g003
Figure 4. Specific core loss curves for investigated manufacturing conditions of M270-50A at 50  Hz .
Machines 13 00761 g004
Figure 5. Specific core loss curves for investigated manufacturing conditions of M270-50A at 76.67   Hz .
Machines 13 00761 g005
Figure 6. Deviation specific core loss curves for investigated manufacturing conditions. (a) 50  Hz , respect to reference. (b) 50  Hz , respect to SST 30  m m . (c) 76.67   Hz , respect to reference. (d) 76.67   Hz , respect to SST 30  m m .
Machines 13 00761 g006
Figure 7. Specific core losses Fit P at 76.67 Hz; measurement against Bertotti modeling.
Machines 13 00761 g007
Figure 8. Simplified 2D model of the cross-section of the reluctance synchronous machine.
Machines 13 00761 g008
Figure 9. (a) One-region model in stator. (b) Two-region model in stator.
Machines 13 00761 g009
Figure 10. Flux linkage of the one-region stator model in Case 1. (a) d-axis Ψ d . (b) q-axis Ψ q .
Machines 13 00761 g010
Figure 11. Calculated air gap torque T δ of the one-region stator model in Case 1.
Machines 13 00761 g011
Figure 12. Calculated air gap torque T δ of the simulation Case 1 to Case 4.
Machines 13 00761 g012
Figure 13. Motor test bench. (a) Real-time computing platform UltraZohm [38]. (b) Power analyzer. (c) Voltage source inverter. (d) Current transformer. (e) Reluctance synchronous machine. (f) Torque shaft. (g) Load machine.
Machines 13 00761 g013
Figure 14. Comparison of measured torque T with the previously calculated torque T δ from the FEA.
Machines 13 00761 g014
Figure 15. Comparison of measured torque T with the previously calculated torque T δ from the FEA (Case 4).
Machines 13 00761 g015
Figure 16. Comparison between Case 1 and Case 4. (a) Flux linkage d-axis Ψ d . (b) Flux linkage q-axis Ψ q . (c) Percentage deviation Ψ d . (d) Percentage deviation Ψ q .
Machines 13 00761 g016
Table 1. Material dataset M270-50A.
NameMaterial Condition
ReferenceManufacturer data
SST 30  m m Strip specimen 30  m m (laser cut)
Fit 0Stator core (punched and welded)
Fit PStator core with casing (punched, welded and pressed-in)
Table 2. Press fit specifications Fit P.
SpecificationSymbolFit P Value
Temperature ϑ 60   ° C
Interference δ 63.3   μ m
Max. normal stress σ i 9.85   M Pa
Casing outer radius r c , o 139.132   m m
Casing inner radius r c , i 120.026   m m
Stator outer radius r s , o 120.057   m m
Stator inner radius r s , i 95.806   m m
Stator yoke width w s , y 24.251   m m
Table 3. Specific core losses separation, extracted at 50  Hz and normalized to 1.5   T and 50  Hz .
Name p h in W/kg p c in W/kg p e in W/kg
Reference1.8630.4720
SST 30  m m 1.3650.5100.778
Fit 00.5290.5102.201
Fit P00.4912.876
Table 4. Specific core losses separation, extracted at 76.67   Hz and normalized to 1.5   T and 50  Hz .
Name p h in W/kg p c in W/kg p e in W/kg
Reference *1.8630.4720
SST 30  m m 1.4370.5100.830
Fit 00.6760.5101.841
Fit P0.0380.4912.475
* 50 Hz dataset.
Table 5. Machine parameters of the reluctance synchronous machine.
ParameterSymbolValue
Stator outer diameter D s , o 240   m m
Stator inner diameter D s , i 150   m m
Rotor outer diameter D r , o 149.3   m m
Rotor inner diameter D r , i 55   m m
Air gap δ 0.35   m m
Slot height h Q 20.7   m m
Stack length l geo 280   m m
Average stator tooth width w s , t , avg 7.2   m m
Number of slotsQ36
Number of slots per pole and strandq3
Number of pole pairsp2
Number of machine strandsm3
Wiring of the stator windingY
Electrical sheetM270-50A
Number of flux barriers n fb 4
Table 6. Rated machine parameters of the reluctance synchronous machine.
ParameterSymbolValue
Rated phase current I ph 46.5   A
Rated phase voltage U ph 230   V
Rated speed n rated 2300   min 1
Rated frequency f rated 76.67   Hz
Rated torque T rated 95.5   N m
Rated mechanical power P m , rated 23   k W
Table 7. Simulation cases named after Section 2 Table 1.
Simulation CaseMaterial Stator YokeMaterial Stator TeethMaterial Rotor
Case 1: ReferenceReferenceReferenceM530-50A *
Case 2: SST 30  m m SST 30  m m SST 30  m m M530-50A *
Case 3: Fit P-SST 30  m m Fit PSST 30  m m M530-50A *
Case 4: Fit P-Fit 0Fit PFit 0M530-50A *
* Manufacturer data.
Table 8. FEA simulation results of maximum torque at maximum current.
I in A α i in ° Ψ d in mVs Ψ q in mVs L d in mH L q in mH
Case 1 47.7 61.8 635.4 87.1 19.9 1.47
Case 2 47.7 61.9 630.2 87.6 19.9 1.47
Case 3 47.7 60.3 624.0 86.2 18.7 1.47
Case 4 47.7 59.7 625.5 85.6 18.4 1.47
Table 9. Comparison of rated operating point.
i d in A i q in A P Fe in W
Case 1 38.6 53.2 517
Case 2 38.6 53.2 604
Case 3 38.6 53.2 627
Case 4 38.6 53.2 660
Measurement 38.6 53.2 774
Disclaimer/Publisher’s Note: The statements, opinions and data contained in all publications are solely those of the individual author(s) and contributor(s) and not of MDPI and/or the editor(s). MDPI and/or the editor(s) disclaim responsibility for any injury to people or property resulting from any ideas, methods, instructions or products referred to in the content.