Article

Numerical Study of the Effect of Unsteady Aerodynamic Forces on the Fatigue Load of Yawed Wind Turbines

1
State Key Laboratory of Disaster Reduction in Civil Engineering, Tongji University, Shanghai 200092, China
2
Southern Marine Science and Engineering Guangdong Laboratory (Zhuhai), School of Ocean Engineering and Technology, Sun Yat-sen University, Zhuhai 519082, China
*
Author to whom correspondence should be addressed.
Machines 2025, 13(7), 607; https://doi.org/10.3390/machines13070607
Submission received: 6 June 2025 / Revised: 4 July 2025 / Accepted: 14 July 2025 / Published: 15 July 2025
(This article belongs to the Special Issue Aerodynamic Analysis of Wind Turbine Blades)

Abstract

The intentional yaw offset of wind turbines has shown potential to redirect wakes, enhancing overall plant power production, but it may increase fatigue loading on turbine components. This study analyzed fatigue loads on the NREL 5 MW reference wind turbine under varying yaw offsets using blade element momentum theory, dynamic blade element momentum, and the converging Lagrange filaments vortex method, all implemented in OpenFAST. Simulations employed yaw angles from −40° to 40°, with turbulent inflow generated by TurbSim, an OpenFAST tool for realistic wind conditions. Fatigue loads were calculated according to IEC 61400-1 design load case 1.2 standards, using thirty simulations per yaw angle across five wind speed bins. Damage equivalent load was evaluated via rainflow counting, Miner’s rule, and Goodman correction. Results showed that the free vortex method, by modeling unsteady aerodynamic forces, yielded distinct differences in damage equivalent load compared to the blade element method in yawed conditions. The free vortex method predicted lower damage equivalent load for the low-speed shaft bending moment at negative yaw offsets, attributed to its improved handling of unsteady effects that reduce load variations. Conversely, for yaw offsets above 20°, the free vortex method indicated higher damage equivalent for low-speed shaft torque, reflecting its accurate capture of dynamic inflow and unsteady loading. These findings highlight the critical role of unsteady aerodynamics in fatigue load predictions and demonstrate the free vortex method’s value within OpenFAST for realistic damage equivalent load estimates in yawed turbines. The results emphasize the need to incorporate unsteady aerodynamic models like the free vortex method to accurately assess yaw offset impacts on wind turbine component fatigue.

1. Introduction

Wind energy has emerged as a pivotal element in the shift towards sustainable and renewable energy sources, playing a crucial role in reducing carbon emissions. As the deployment of wind energy increases, it becomes essential to improve the performance and lifespan of wind turbines that operate in wind farms [1]. Optimizing farm-level control strategies such as intentional yaw offset can mitigate these effects, enhancing turbine efficiency and longevity [2]. However, the phenomenon of yaw offset, where the rotor plane is not perfectly aligned to the wind direction, can induce complex aerodynamic and structural loads, potentially leading to fatigue damage over time.
The numerical study of the fatigue load of yawed wind turbines underscores the critical role of yaw offset in fatigue loading and overall turbine performance. Wind shear in turbulent wind fields sets an optimal yaw direction to minimize blade loads. Yawing reduces shaft torque slightly by lowering power, cutting rotor torque fluctuations, while positive yaw misalignment decreases the tower base moment due to reduced thrust, showing how yaw adjustments mitigate loads [3]. These emphasize the importance of optimizing yaw strategies to enhance power capture without excessively increasing fatigue loads. Yaw offset redistributes aerodynamic loads, especially in downstream turbines, improving power output through wake steering, but also introducing nonlinear variations in power and root flapwise bending moments [4]. As the yaw offset increases under above-rated wind speeds for a wind turbine, the low-frequency resonant effect of the wind-induced aeroelastic response becomes significant. This effect arises because the predominant frequency of the wind loads closely aligns with the natural frequency of the blades [5]. Depending on the yaw direction, blade bending either increases or decreases in the upstream turbine, while other loads experience smaller variations. However, the downstream turbine experiences smaller variations in other loads but sees an increase in blade load, drivetrain torsion, and lateral tower base moment due to the shift from full to partial wake overlap [6,7,8]. Thus, the wake diversion-induced loads on the turbine structure and its aerodynamic response necessitate a thorough understanding of structural resonance.
The aerodynamic loads on structural components, along with dynamic stall and dynamic inflow models, accurately capture blade flapwise and edgewise loads. Branlard et al. [9] demonstrated the significance of dynamic inflow models for precise aerodynamic and modal analysis, emphasizing the importance of capturing aerodynamic response. Wake effects [10,11,12,13] lead to a wind velocity deficit and increased turbulence, significantly elevating fatigue loads on downstream turbines. The fatigue loads on turbine blades and towers increase with rising wind velocity and turbulence intensity. J. Sun et al. [10] observed a linear relationship between turbulence intensity and fatigue loads, underscoring the impact of these factors on structural durability. Moreover, the fatigue load of a tower base deviated across different yaw angles demonstrates the substantial influence of yaw on the operating longevity of wind turbines under wake conditions.
To accurately estimate aerodynamic loads on turbine blades, a precise calculation method that accounts for air compressibility is crucial. Zalkind and Pao, 2016, employed BEM (blade element momentum) theory, implemented within the aero-servo-elastic dynamics solver OpenFAST [10,14,15], to simulate an onshore NREL 5 MW wind turbine [16] and compute fatigue loads. These loads included the combined tower base moment (fore–aft and side-to-side), blade root out-of-plane (OOP) moment, low-speed shaft (LSS) torque, and LSS bending moment. Their analysis of wind shear within turbulent wind fields indicated that yawing the turbine in the positive direction optimally reduced blade loads. The combined tower base moment and shaft torque depicted a slight decrease in all directions, attributed to reduced rotor thrust. The BEM method, characterized by low computational cost and seamless integration with aeroelastic codes, is widely adopted for calculating blade loads [16,17,18]. It has also been extensively applied in fatigue assessments [17] and wake [18] effect analysis.
For several aerodynamic forces in AeroDyn [19], which contains BEM and dynamic BEM (DBEM) to calculate the effects of wind turbine wakes, built-in OpenFAST has been employed to analyze fatigue loads on wind turbine components. The BEM theory provides a straightforward approach by combining blade element and momentum theories to model aerodynamic forces. These assumptions, particularly neglect of dynamic inflow effects and wake dynamics, limit its accuracy in capturing real-world complexities, especially under yawed flow conditions. To address the limitations of BEM, several corrections have been proposed, such as those accounting for dynamic stall phenomena or the development of DBEM. These corrections account for the effects occurring on time scales of the order of the time for the relative time required for wind at the blade to transverse the blade chord [20]. Bangga et al., 2020, observed that vortex build-up and shedding near the leading edge of the airfoil influence aerodynamic loads, with vortex components contributing to tangential forces and formulation of the pitch moment coefficient being associated with trailing edge flow separation [21].To address these limitations, the DBEM theory extends BEM by incorporating unsteady aerodynamics and dynamic inflow effects, offering a more refined understanding of transient loads on turbine blades. Despite its improvements, DBEM still falls short in representing the three-dimensional and time-dependent nature of wind flow around yawed turbines [17,18,19].
These studies collectively emphasize the critical role of aerodynamic load modeling in enhancing the structural integrity and operational lifespan of wind turbines. However, challenges remain in fully capturing complex phenomena such as accurate aerodynamic loads for flexible, non-straight blade geometries (built in curvature or sweep), turbine tilt, dynamic stall, wake-induced turbulence, and yaw-dependent load variations [22,23,24]. Such scenarios necessitate higher-fidelity aerodynamic models such as computational fluid dynamics (CFD) methods. However, their high computational cost limits the number of simulations that can be feasibly performed. In contrast, free vortex methods, such as the lifting-line aerodynamics framework OLAF, offer a less computationally expensive alternative to CFD while still capturing similarly complex physics. The OLAF vortex method [25] incorporated in to AeroDyn as alternative to the BEM, a more advanced computational approach, captures complex wake dynamics and aerodynamic interactions in yawed conditions, allowing detailed simulations of vortex dynamics and their impact on structural components.
Several gaps exist in the literature on wind turbine fatigue loads and yaw offset control, which this study aimed to address. These gaps include, primarily, (1) the underutilization of the OLAF method to capture complex wake dynamics under yawed conditions and (2) the lack of comparative analysis among representative rotor aerodynamic force models like BEM, DBEM, and OLAF. The detailed component-specific fatigue load data are often neglected, with the focus instead on overall turbine performance. We aimed to fill these gaps by evaluating and comparing DELs of turbine components using BEM, DBEM, and OLAF for the onshore NREL 5 MW wind turbine model operating under different inflow cases and yaw offsets, as shown in Figure 1.
This paper is organized as follows. Section 2 describes the wind turbine model set-ups, the flow field inputs used in this study, and the aerodynamic force modeling theory. Section 3 focuses on computing and comparing the DELs among different aerodynamic force models. Finally, Section 4 summarizes the conclusions of the study.

2. Methodology

In this section, numerical simulation of fatigue load for the NREL 5 MW reference wind turbine model was conducted by an open-source wind turbine simulation tool, OpenFAST-v3.4.0 developed by NREL, Golden, CO, USA. The inflow wind was generated with stochastic full-filled, turbulent-wind simulator, TurbSim v2.00.00 developed by NREL, Golden, CO, USA [26]. Three aerodynamic models, including BEM, DBEM, and free vortex method OLAF were utilized to characterize the aerodynamic load acting on blades. The aggregated short-term fatigue damage was computed according to DLC 1.2 of the IEC 61400-1 standards [27]. Yaw offset was utilized as the key variable parameter in the simulations, with each aerodynamic model case generating time-series load data processed through rainflow counting. Subsequently, fatigue loads for critical wind turbine components were calculated based on Miner’s rule, as shown in Figure 1.

2.1. NREL 5 MW Wind Turbine Model

The onshore NREL 5 MW reference wind turbine [16], a standard utility-scale model, was selected for this study. This three-bladed, upwind turbine features a land-based steel tower with a hub height of 90 m and rotor diameter of 126 m. The tower has a base diameter of 6 m with a wall thickness of 0.027 m, tapering to a top diameter of 3.87 m with a wall thickness of 0.019 m. The masses of the steel tower, nacelle, and rotor are 347.5 tons, 240 tons, and 110 tons, respectively. Each blade comprises airfoil sections of varying sizes along its radius, with the blade root consisting of one layer of gelcoat and 58 layers of Triax, and the material properties of these components are detailed in [28]. The properties of the blade and tower used in the fatigue load calculations are presented in Table 1. The turbine operates at cut-in, rated, and cut-out wind speeds of 3 m/s, 11.4 m/s, and 25 m/s, respectively. In terms of yaw direction, positive yaw angles are defined as clockwise when viewed from top, while negative yaw angles are counterclockwise. In this study, yaw angles ranging from −40° to 40° were investigated, with intervals of 5° for the BEM and DBEM methods and 10° for OLAF method. Detailed information on the operational conditions is summarized in Table 2.
For the NREL 5 MW wind turbine, two controllers are implemented within the ServoDyn system: a generator torque controller and a full-span rotor-collective blade-pitch controller. These control systems are designed to operate independently, targeting below-rated and above-rated wind speed ranges, respectively. The torque controller is activated to maximize wind energy capture when the mean wind speed at hub height is below the designed rated wind speed. Conversely, the pitch controller is engaged to maintain rated power output when the wind speed exceeds the rated speed. Additionally, initial conditions, such as pitch angle and rotor speed, were set in accordance with the study by Jonkman et al. [16] to ensure numerical stability.

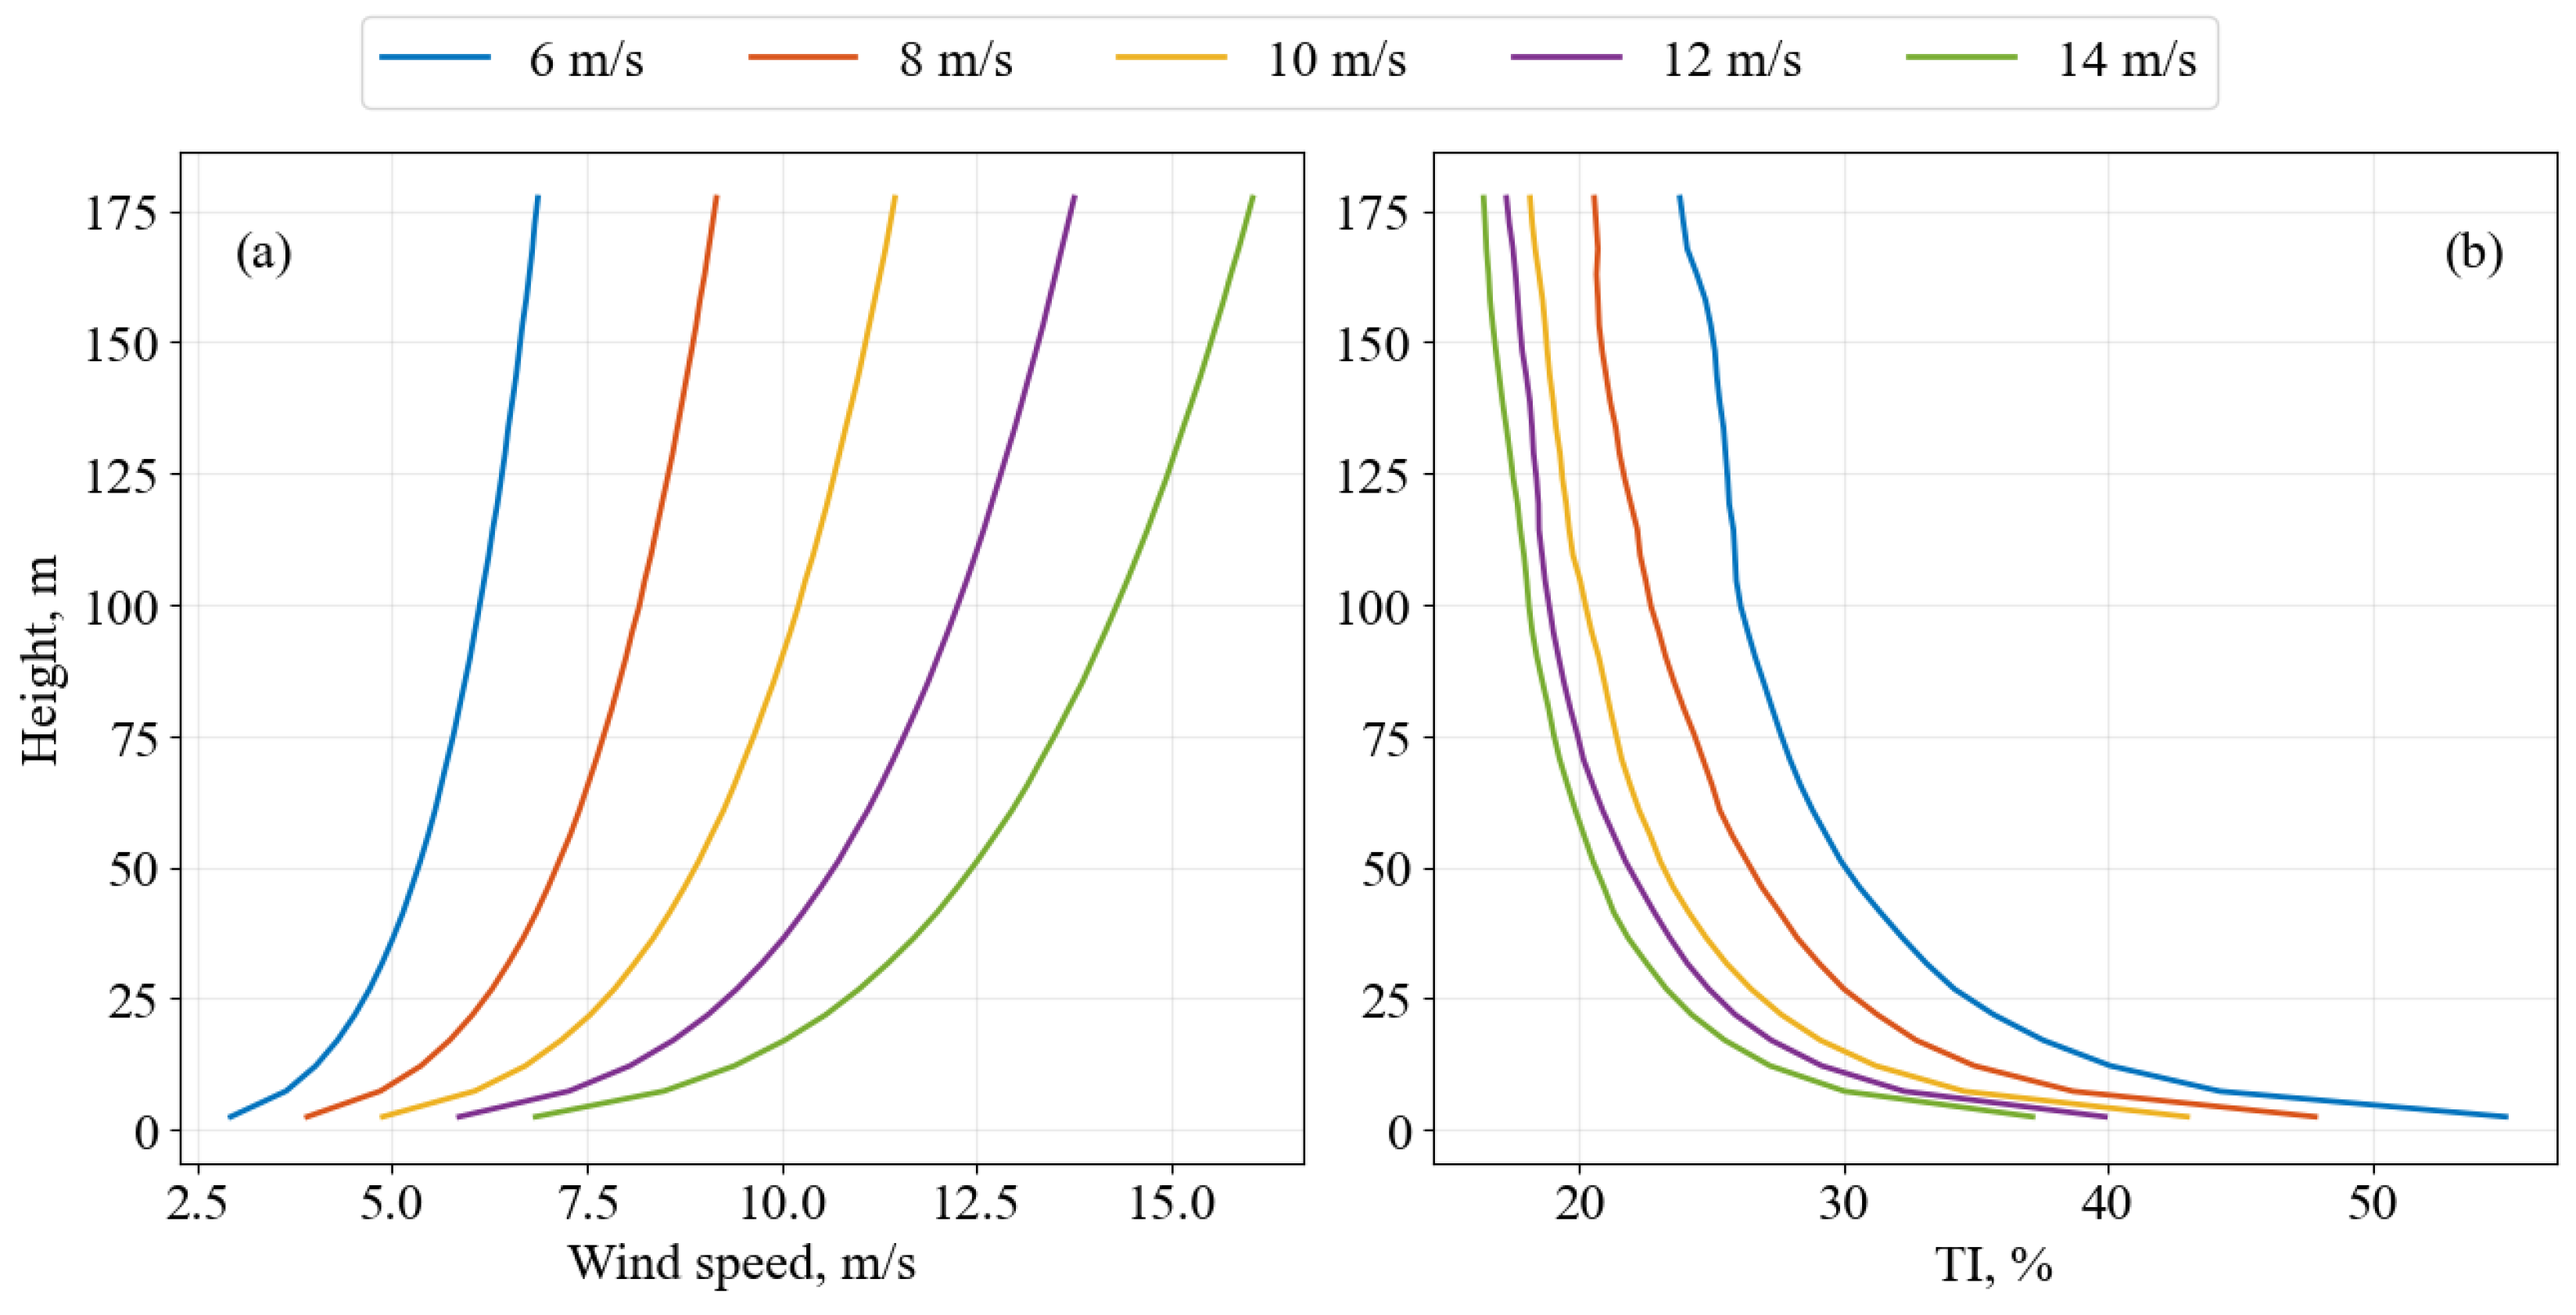
2.2. Wind Field Modeling

To compute fatigue loads for the 5 MW NREL wind turbine under yaw offsets, full-field turbulent inflow wind conditions were generated using TurbSim v2.00.00. The stochastic wind inflow, with a minimum grid size of chord length, are characterized by power law wind profiles, the Kaimal model, and normal turbulence model (Class A turbulence). The power law wind profile is defined as follows:
U ( z ) = U h u b ( z z h u b ) α
where z is the vertical height required to calculate the wind speed, z h u b   is the hub height, U h u b   is the wind speed at hub height, and α is the shear flow exponent, which is set to 0.2. Wind fields were generated in increments of 2 m/s for mean hub-height wind speeds ranging from 6 m/s to 14 m/s. The detailed parameters for wind inflow generation are listed in Table 2, and the generated wind profiles and turbulence intensity profiles under different hub-height wind speeds are plotted in Figure 2.

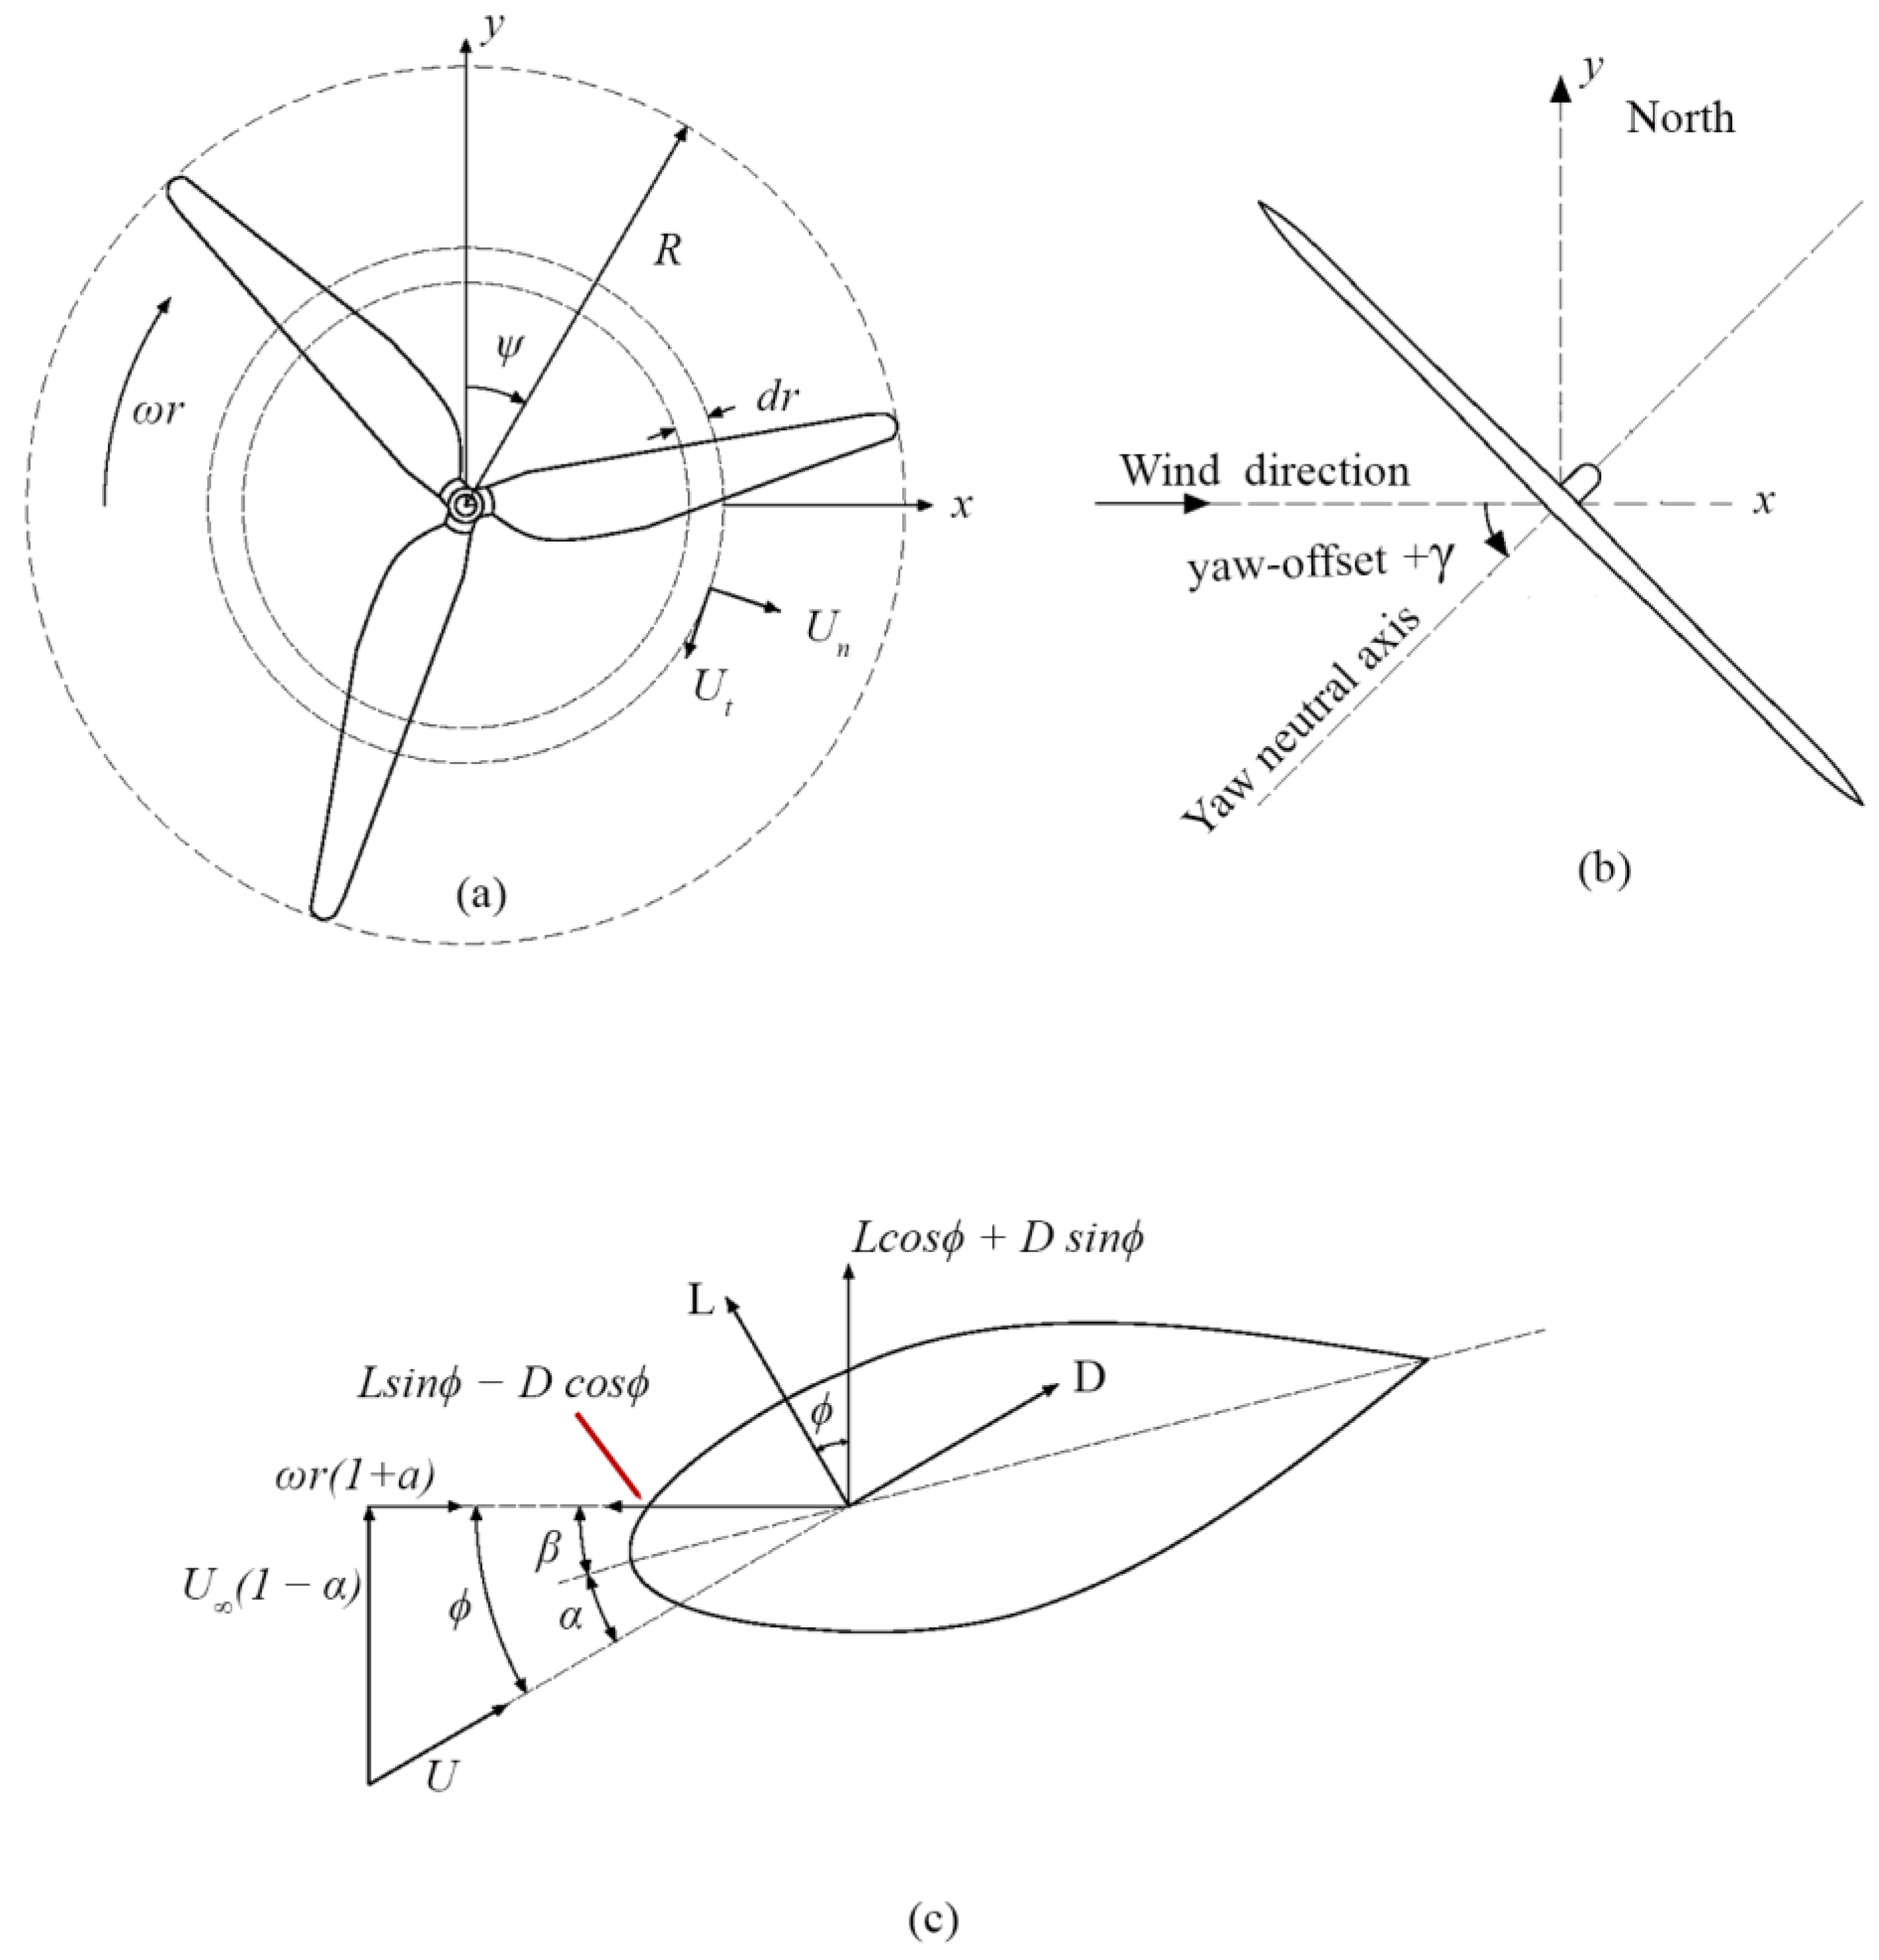
2.3. Aerodynamic Force Modeling

The acting aerodynamic lift (L) and drag forces (D), shown in Figure 3c on the span-wise elements of the wind turbine blades, are responsible for changes in axial and angular momentum rotation of the blade. The azimuth angle of the rotor is denoted by ψ and shown in Figure 3a. The applied forces on these blade elements cause a pressure drop on the downwind side of the rotor because the axial momentum of the inflow passes through the swept area, contributing to aerodynamic lift and drag forces [14] as shown in Figure 3.

2.3.1. Blade Element Momentum (BEM) Theory

The fundamental assumption of BEM [14] theory is that the force on blade element is solely responsible for the change in axial momentum of the air passing through the swept area of the rotor, as shown in Figure 3a. This implies no radial interaction between the flows in adjacent annuli, which is only strictly accurate if the axial flow induction factor is uniform across the radius. The axial momentum of the blade element of the annuli depends on the radius   R , chord   c , attack angle   α , pitch angle β , and induction factor a —shown in Figure 3c. The mean inflow wind speed is the resultant of U ( 1 a ) and ω r ( 1 + a ) , which induce axial thrust of the rotor. The drag and lift force of the blade element depends on the inflow wind speed, the length of chord, the coefficient of drag C d , and lift C l along the length of the blade d r , as shown in Equations (2) and (3). The Leishman and Beddoes model was employed to account for the dynamic stall effect considering local velocity and aerodynamic force.
L = 1 2 ρ U 2 c C l d r
D = 1 2 ρ U 2 c C d d r

2.3.2. Dynamic Blade Element Momentum (DBEM) Theory

The simulation for dynamic inflow model of the baseline based on a discrete-time implementation of unsteady model found in aeroelastic code [9]. Using the DBEM [29] theory, we employed time-dependent τ 1 for unsteady inflow model. The representation of τ 1 and τ 2 is provided in Equation (4):
τ 1 = 1.1 1 1.3   m i n ( a ¯ ,       0.5 ) R U ¯ 0 ,   τ 2 = [ 0.39 0.26 ( r R ) 2 ] τ 1
where R is the rotor radius, a ¯   is the average axial induction over the rotor, U ¯ 0 is the average wind speed over the rotor, and r is the radial position shown in Figure 3a.
W i n + τ 1 W ˙ i n = W q s + k τ 1 W ˙ q s   a n d   W i n t = W + τ 2 W ˙ i n
where W is the actual induction at the rotor of desired radial positon of the blade, W q s is the quasi-steady induction, W i n is for coupling the quasi-steady and the actual induction, and (·) represents the time derivative. The coupling constant k is the value between 0 and 1.

2.3.3. Converging Lagrange Filaments (OLAF) Vortex Methods

OLAF [25] methods model the evolution of vorticity ( Γ ) in the wake of a wind turbine blade, using the vorticity equation. To simplify this complex process, vorticity is projected onto discrete vortex filaments, and the convection and diffusion steps are treated separately (shown in Equation (6). Regularization is required to ensure smooth approximations during discretization. The forces exerted by the blades are also expressed in vorticity terms, with bound vorticity (BV) related to the lift force modeled using a lifting-line (LL) formulation. The OLAF was computed using a discretized finite number of panels, creating a four-sided vortex ring. The sides of the panels assumed coincided with the lifting line (LL) (quarter of the chord length from the leading edge) and trailing edge of the blade, as shown in Figure 4.
d ω d t = ω t + ( u · ) ω = ( ω · ) u + ν Δ ω
where ω is the vorticity, u is the velocity, and ν is the viscosity.

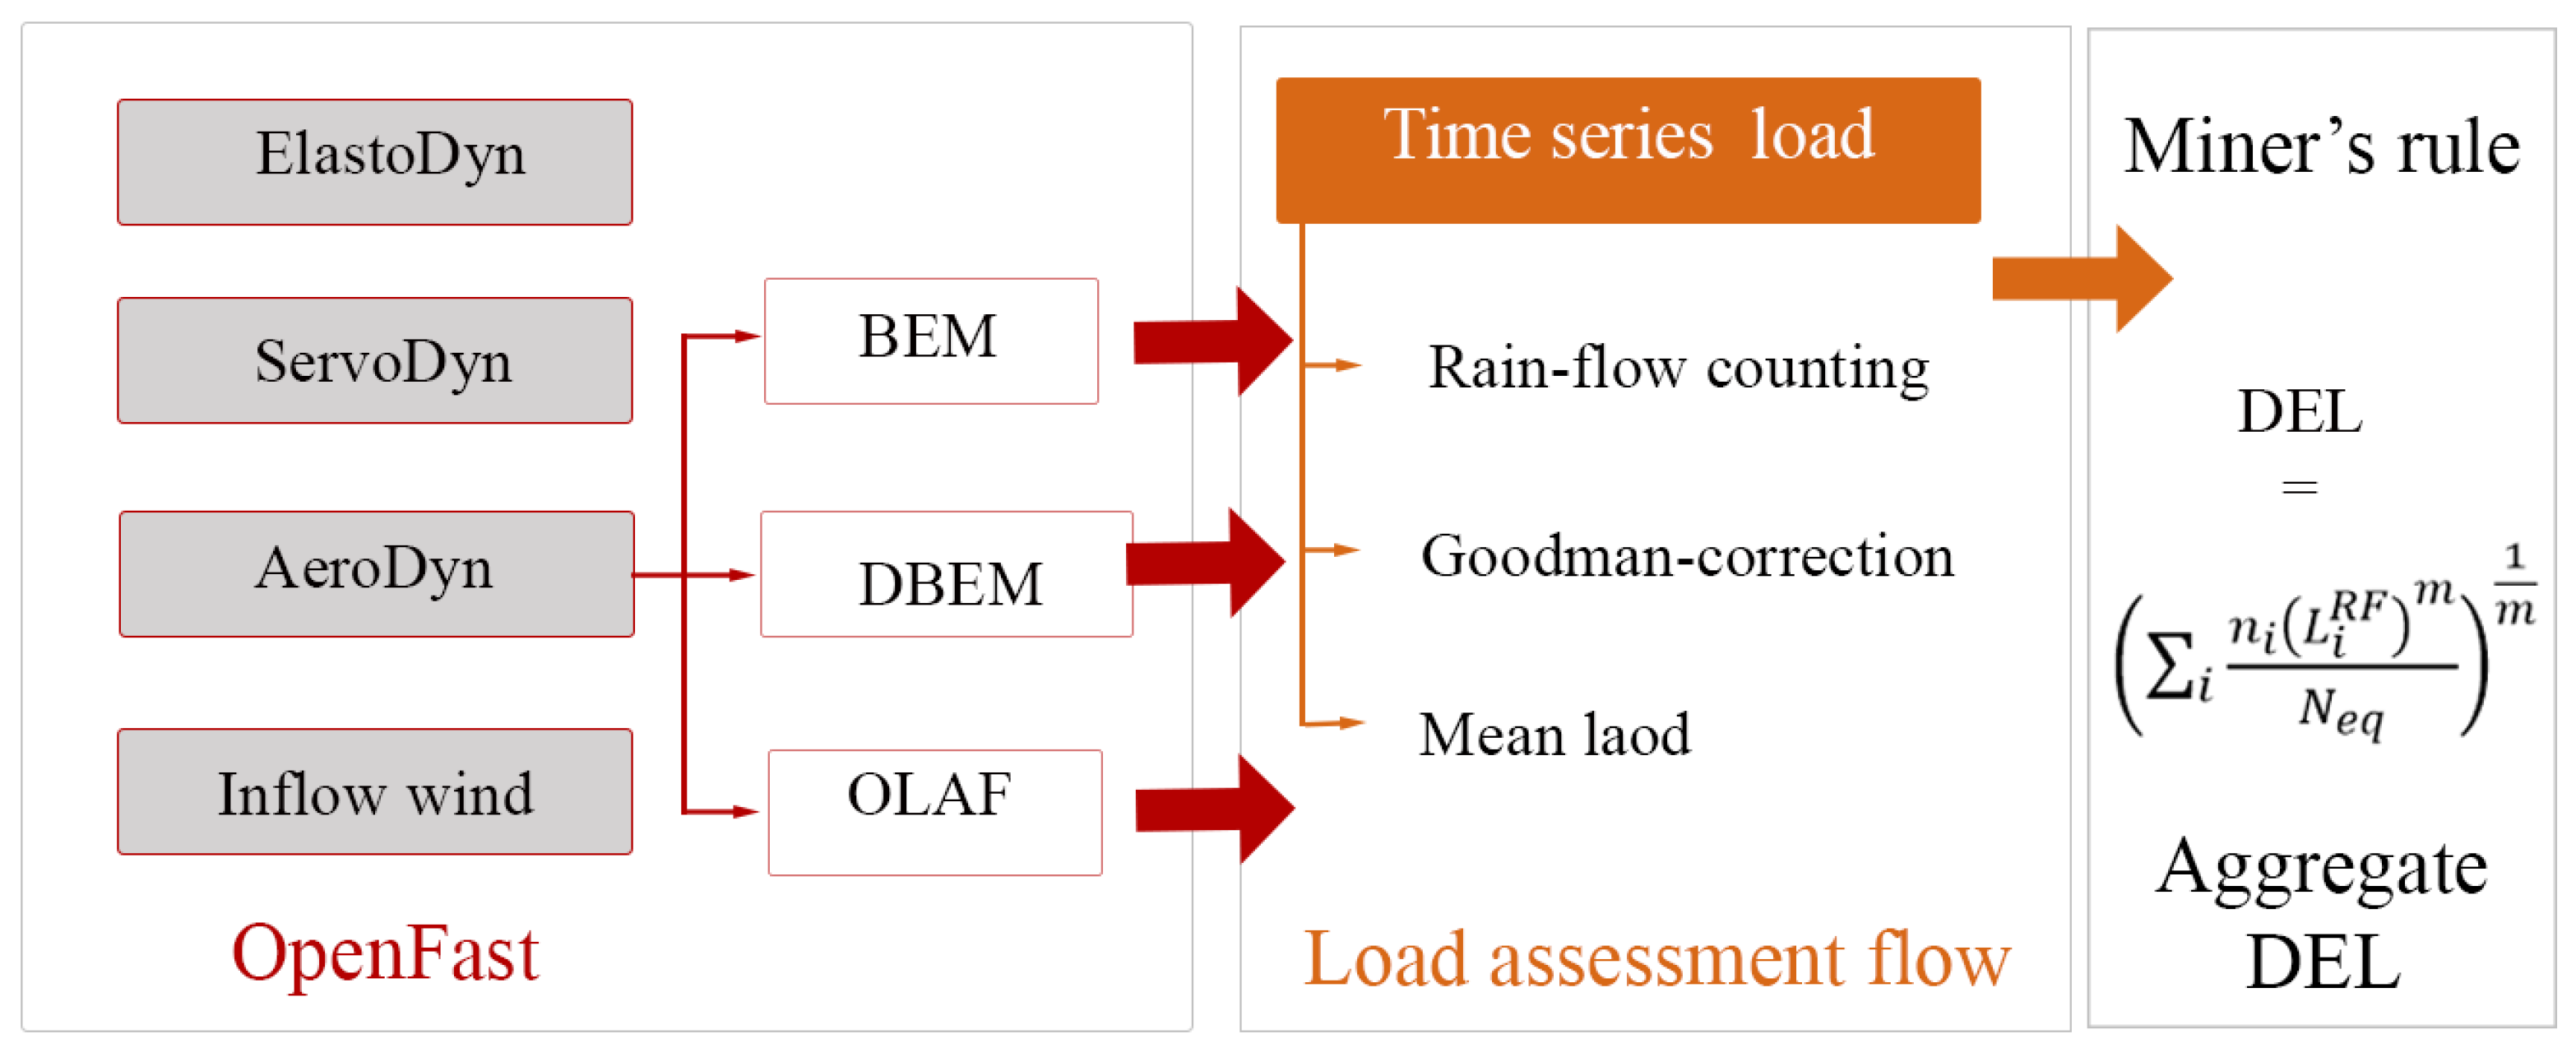
2.4. Fatigue Load Calculation

OpenFAST, an open-source computer-aided engineering tool for horizontal-axis turbine modeling developed by NREL, is utilized in this study. This tool integrates multiple solvers, such as aero-servo-elastic, to provide the aeroelastic response of wind turbines [30]. The fatigue load is computed according to Design Load Case (DLC) 1.2 of the IEC 61400 standards [27]. DLC 1.2 requires six different seeds of 10 min wind fields, each simulated for 600 s [31]. A total of 800 s of simulation is performed for each wind seed. To avoid wind turbine initialization effects, the initial 200 s of simulation results are discarded. For calculating the fatigue load at a single yaw-offset angle, we first determined the ultimate load for each yaw angle using all five wind speed bins, each consisting of six different wind speeds, and simulated results using the NREL-developed MATLAB R2022b tool Mextreme v1.01.00a-gjh [32]. Subsequently, to compute the fatigue load for a single yaw-offset angle case, we utilized the results from the thirty simulations (five wind speed bins, each with six wind seeds), employing the NREL MATLAB tool Mlife v1.01.00a-gjh [33].
The accumulated fatigue damage from fluctuating loads over the wind turbine design life were considered, and these fluctuating loads were decomposed into individual cycles by pairing local minima with local maxima in the time series using rainflow counting. Each cycle was characterized by its mean load and range. Damage was assumed to accumulate linearly with each cycle according to Miner’s rule (Palmgren and Miner) [33].
D = i n i N i ( L i R F )
where N i denotes the number of cycles to failure, n i is the cycle count, and L i R F is the cycle’s load range about a fixed load-mean value. The relationship between load range and cycles to failure (S-N curve) is modeled by:
N i = ( L u l t | L M F | ( 1 2 L i R F ) ) m
where L u l t is the ultimate design load of the component, L M F is the fixed load-mean, and m is Whöler exponent of the component under consideration.
The fatigue cycle over fixed load-mean and the load ranges were corrected at each cycle about a fixed mean load computed via the Goodman correction, as shown in the following equation:
L i R F = L i R ( L u l t | L M F | L u l t | L i M | )
where L i R is the i th   cycle load range about a load mean of   L i M , L i M F is the fixed mean load from load time series, and L i M is the mean load for cycle i . The L u l t is the ultimate load approximated by 4.5 × L m a x , where L m a x is the maximum load of thirty simulations of a particular yaw-offset case [33].
D E L = ( i n i ( L i R F ) m N e q ) 1 m
where   n i is the damage count for cycle i ,   N e q is the equivalent cycle count, m is the slope of the S N curve (where m = 3   for steel and m = 10 for composite), and L i R F is the Goodman-corrected load range computed from Equation (9). Subsequently, the load cycle over the 20-year design life was computed based on a Weibull distribution, with a shape parameter of 2 and a scale parameter of 10. The components of the wind turbine affected by the loads, such as the tower, blades, and low-speed shaft—which require maintenance—were considered for evaluation, as shown in Table 3.

3. Numerical Validation

To validate the numerical method for aerodynamic load modeling, the MEXICO (Model Experiments In Controlled Conditions) experiment [34] is utilized for comparison. This experiment was conducted at the large-scale low-speed facility (LLF) of the German–Dutch wind tunnels (DNWs), with a 9.5 m × 9.5 m open test section. The wind turbine, with three blades and a diameter of 4.5 m, was tested in the clockwise rotational orientation from an upstream perspective, with a constant rotational speed of 424.5 rpm and a pitch angle of −2.3 degrees. The aerodynamic response of the turbine blade due to the inflow wind condition was collected using sensors implanted within the turbine blades. The turbine blade consisted of three different airfoils, DU91-W2-250 from 20% to 45%, RISØ-A1-21 from 55% to 65%, and NACA 64-418 from 70% to 100%. Several researchers utilized the experimental data as a baseline to validate modeling approaches. In the present study, the computational fluid dynamics (CFD) results of lift and drag coefficients conducted by Yang et al. [35] are utilized for the abovementioned airfoils.
The MEXICO wind turbine model was simulated under steady uniform inflow, with wind speed of 15 m/s, by the BEM and OLAF methods, respectively. The turbine blade consists of three types of airfoils, and for transitional airfoils, the aerodynamic coefficients were extracted from the average of the polar curves of the adjacent airfoils. To capture the discrepancies between the OLAF and BEM methods and to emphasize the effects of BEM computation at the blade tip, no changes were made to the two-dimensional polar curves in this study. The simulation aimed to validate the spanwise distribution of the normal force ( F n ) and tangential force ( F t ) per unit length, as well as the DEL of the turbine blade OOP bending moment, against the MEXICO experimental data [36]. The fatigue assessment specifically focused on the evaluation of blade root moments, based on the resulting moment distributions, as detailed in Section 2.1.
Normal forces on a wind turbine blade, as illustrated in Figure 5a, demonstrate strong concordance between computational simulations and experimental measurements. A detailed comparison of the normal force predictions from the OLAF and BEM methods reveals that the BEM approach exhibits reduced accuracy in the outer blade span (80–100% of the blade length) despite accurate predictions in the inner blade regions. This discrepancy is likely attributable to the complex three-dimensional flow characteristics over the blade airfoils in the tip region. Conversely, the OLAF method tends to align closely with experimental data at all span regions, indicating superior performance in capturing aerodynamic behavior across the blade span.
Figure 5b illustrates the tangential force distribution along a wind turbine blade, exhibiting a general trend comparable to that of the normal force distribution. The BEM method yields results that reasonably approximate experimental measurements from the inner to mid-span regions of the blade. In contrast, significant deviations are observed at the blade tip span (80–100% of the blade length), where BEM predictions diverge markedly from experimental data, primarily due to vortex shedding effects. This indicates that the BEM method becomes increasingly inaccurate at high wind speeds, driven by pronounced flow degradation near the blade tip. However, the OLAF simulation tends to overestimate tangential loads in the blade tip region, attributed to the high sensitivity of its calculations in the tangential direction. Nevertheless, OLAF predictions demonstrate relatively higher accuracy compared to the BEM method across the blade span.
Figure 5c presents the simulated DEL of the flapwise blade root moment under different yaw-offset angles compared against experimental data from the MEXICO project. For the BEM method, the DEL increases linearly with increasing yaw offset, over-predicting beyond a yaw angle of 20° and experiencing a minimum fatigue load at zero yaw offset due to symmetrical aerodynamic loading across the rotor-swept area. In contrast, the DEL predicted by the OLAF method demonstrates better agreement with experimental results as yaw offset increases. These findings highlight OLAF’s superior capability to accurately predict the aerodynamic response and associated blade loads compared to the BEM method.
Figure 5d presents the normalized root mean square error (NRMSE) values, indicating the prediction accuracy of the OLAF and BEM models relative to the MEXICO experimental results. The bar chart illustrates the aerodynamic forces ( F t and F n ) and the DEL of the blade root flapwise moment prediction errors for the OLAF and BEM models. We calculated the mean root square error (MRSE) of the MEXICO turbine experimental and simulation results for F t ,   F n , and the DEL of the blade root flapwise moment. After computing the MRSE, we normalized each load with the respective mean experimental parameter load. The OLAF method demonstrates lower prediction errors across all selected parameters compared to the BEM model.

4. Results and Discussion

In this section, the fatigue damage experienced by critical components of the onshore NREL 5 MW wind turbine model is investigated, specifically the blade root OOP bending moment, LSS torque, LSS bending moment, and resultant tower base bending moments. Fatigue damage is calculated based on aggregated short-term DELs resulting from aerodynamic loads induced by turbine operational wind speeds. These loads are evaluated across wind speed bins with a width of 2 m/s, ranging from 6 m/s to 14 m/s, as detailed in Section 2.2.

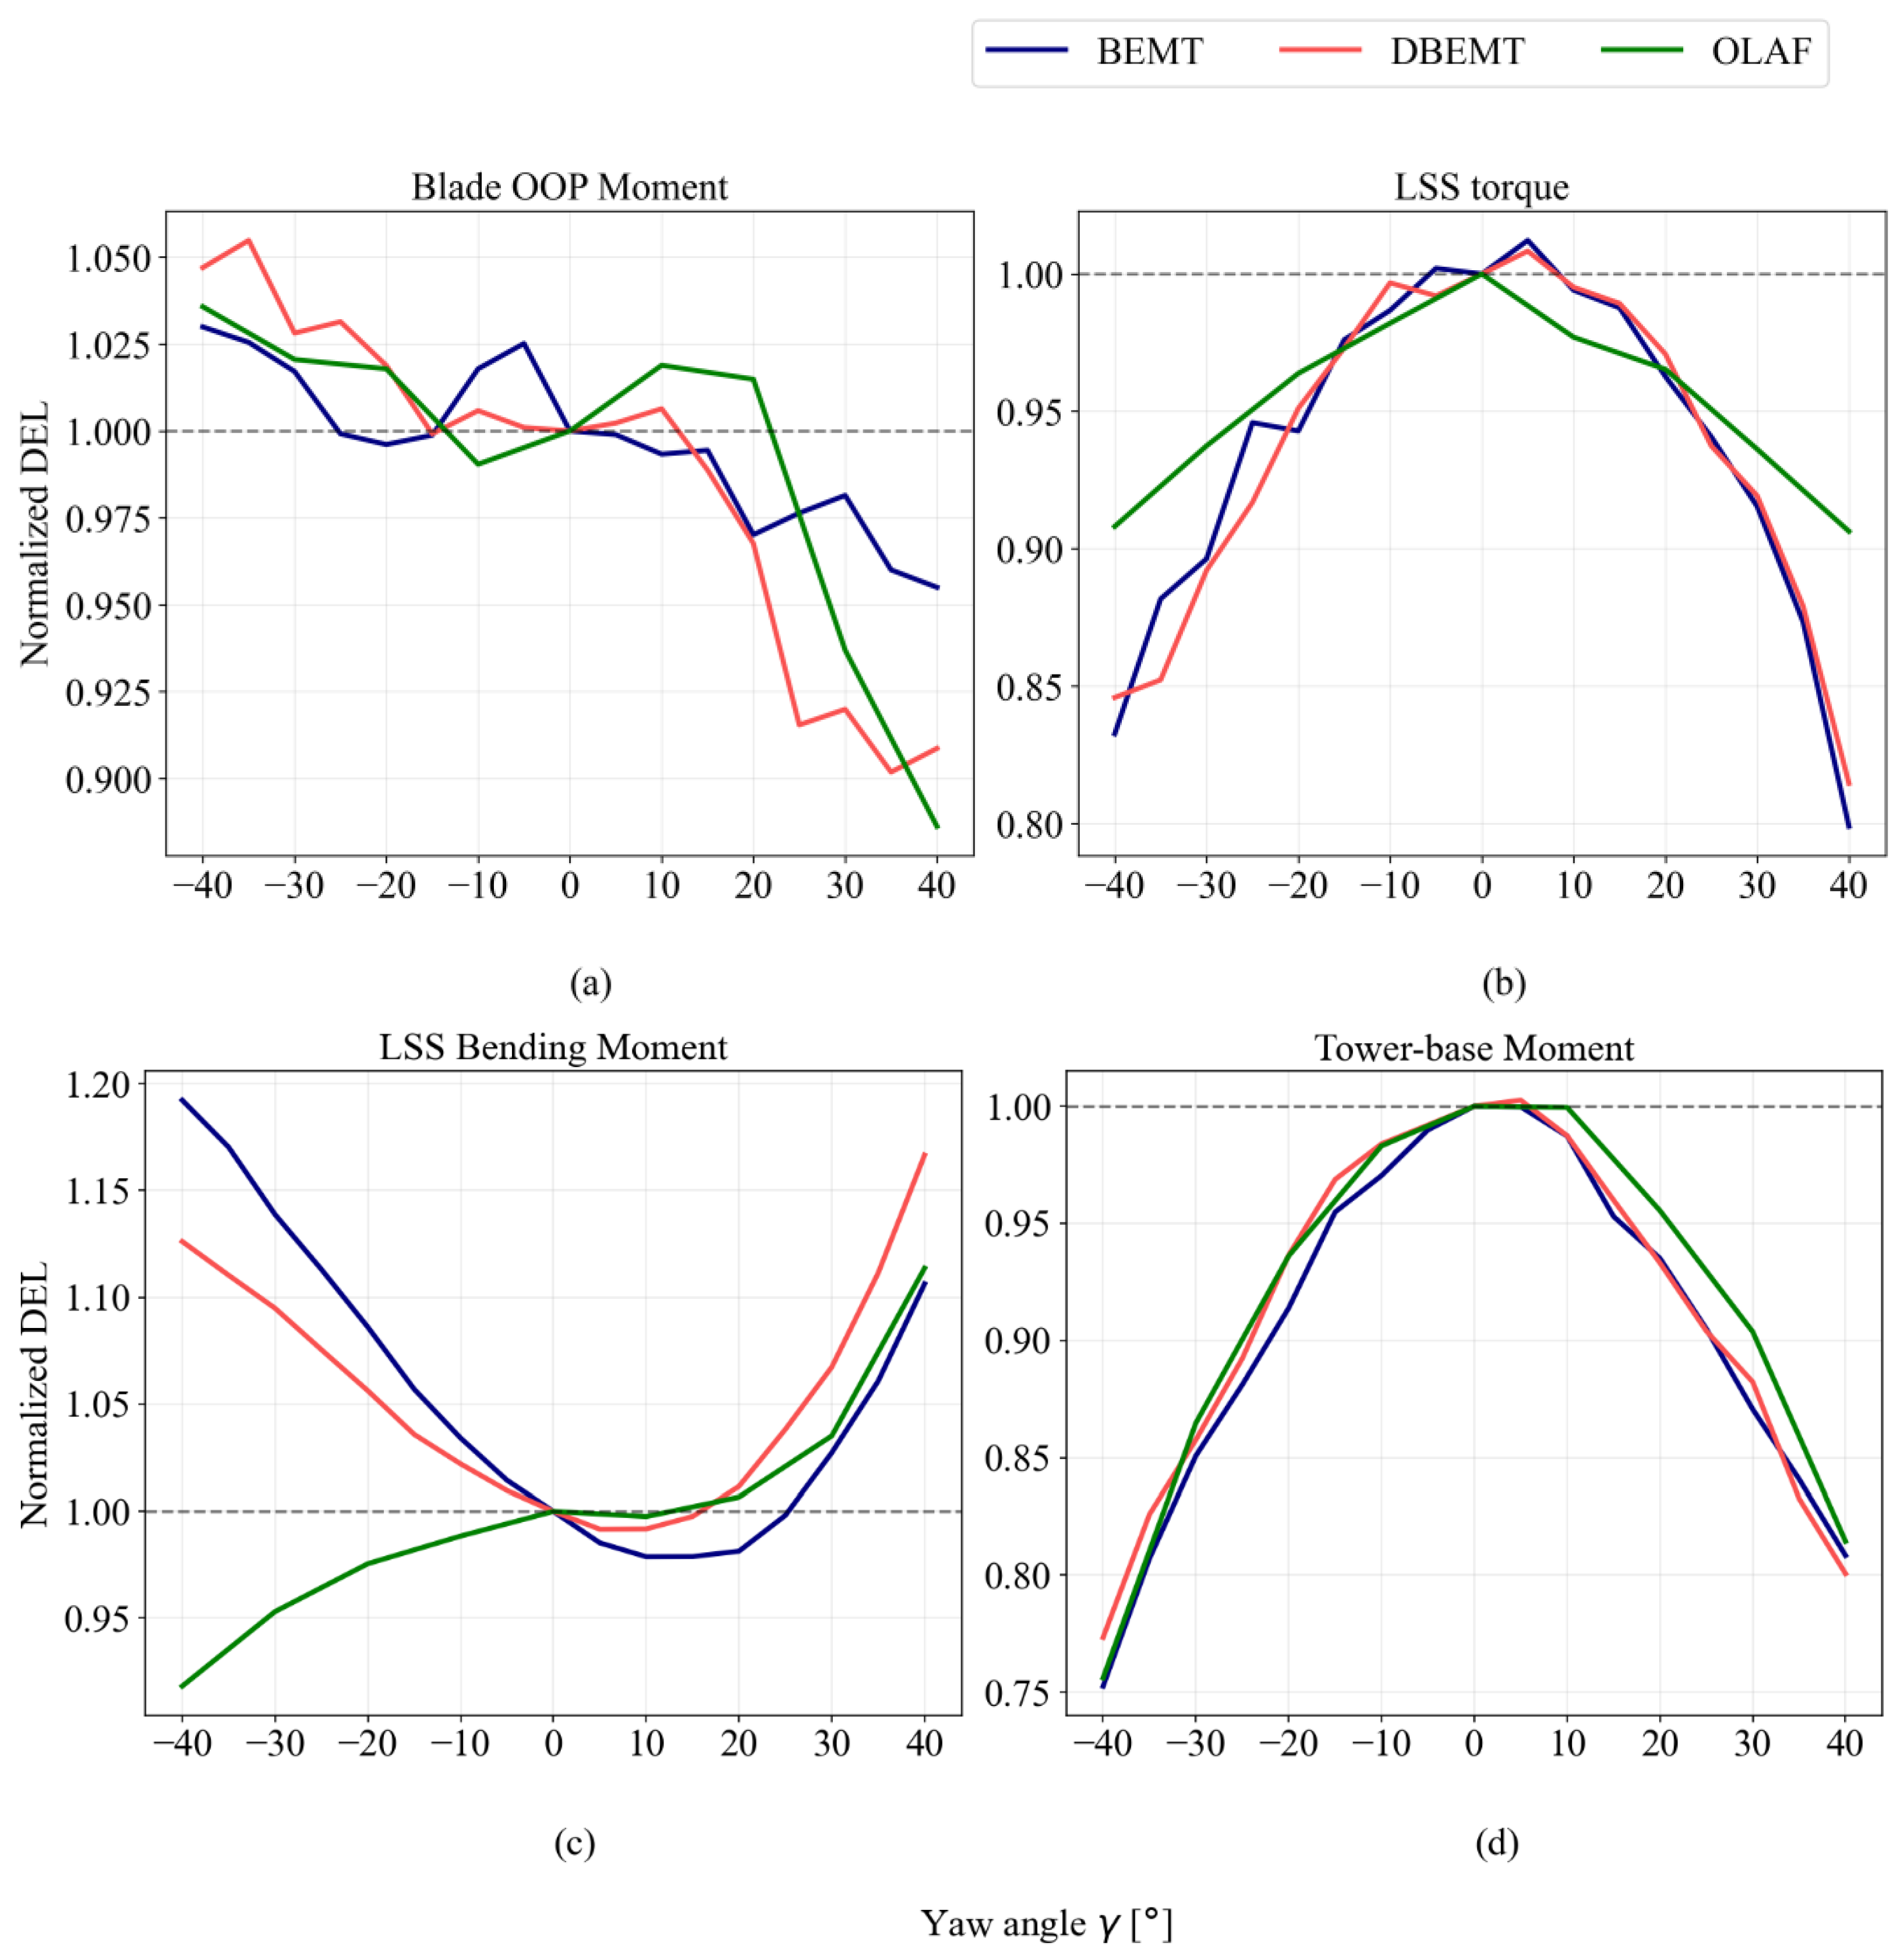
4.1. Fatigue Loading Comparison

Figure 6 shows the simulated DEL under different yaw-offset angles, where the results of BEM, DBEM, and OLAF are plotted by blue, red, and green lines, respectively. Generally, in all three simulated cases, the fatigue load increased for negative yaw offset (with the maximum DEL at γ = −40°) and decreased for positive yaw offset (with the minimum DEL at γ = 40°). The OLAF case, while following a similar trend, showed an increase in DEL from a yaw angle of −10° to 10°. This change is attributed to the increase in the cross-flow velocity in the swept area of the rotor. The fatigue load for DBEM and OLAF simulations at yaw angles above 20° were lower compared to the BEM case.
The illustration in Figure 6b shows the DEL of the LSS torque for BEM, DBEM, and OLAF cases, and the DEL of the LSS torque is influenced by the generator torque control. Due to the yaw offset causing lower inflow to the rotor, the fatigue load decreases for both positive and negative yaw angles. The turbine operates in control region 3 for wind speeds of 12 m/s and 14 m/s, which could lead to higher angular acceleration. For yaw angles γ > ±10° (refer to Figure 6b), the wind turbine operates in control region 2 1 2 , and for below-rated wind speeds, it operates in control region 1 1 2 . These conditions result in a decrease in the DEL of the LSS torque as the yaw angle increases in both positive and negative directions.
The LSS bending moment in Figure 6c indicates that applying a yaw offset increased the DEL as the yaw offset increased for both BEM and DBEM cases. The minimum DEL is observed within a yaw offset range of 0 25 ° for BEM and 0 15 ° for DBEM. The OLAF case shows a similar trend, with DEL increasing as the positive yaw offset rises from 0° to 40°. However, for negative yaw offsets (0° to −40°), the pattern differs due to the following. The power spectra depict the LSS bending moment for yaw offsets ranging from 40 °   to   40 ° in   10 ° intervals, as shown in Figure 7, Figure 8, Figure 9, Figure 10 and Figure 11. The peaks, beginning from lower frequencies of the LSS bending moment, correspond to the higher-order harmonic of the rotor rotational frequencies (1P, 2P, 3P, etc.). We selected representative wind speeds for below-rated (8 m/s) and above-rated (12 m/s) conditions to illustrate the change in cross-flow tangential velocity across the wind turbine rotor annular area.
The amplitudes of these harmonic rotor frequencies increase at yaw angles and decrease as the frequency magnitude rises. The prominence of the nP peak suggests that the highest load cycle amplitudes result from asymmetric blade loading. The amplitude of harmonic rotor frequencies for negative yaw angles is lower than for positive yaw angles, with the amplitude difference increasing as the yaw angle rises, as shown in Figure 7, Figure 8, Figure 9, Figure 10 and Figure 11. The fact that the amplitude corresponding to positive yaw angles is the largest indicates that the greatest load cycle amplitudes result from the higher cross-flow tangential velocity. In addition, for a yawed wind turbine, the relative tangential velocity increases in the upper half (above hub height) of the rotor-swept area and decreases in the lower half. Conversely, a negative yaw angle reverses the cross-flow velocity, causing the relative velocity to rise in the lower half and fall in the upper half of the rotor area (as evidenced in [37]). This variation affects the wake flow on the trailing edge of the airfoil, which OLAF primarily depends on. The tangential velocity of shear inflow is greater above the hub, favoring turbines yawed in the positive direction where tangential velocity increases.
The LSS bending moment DEL for the OLAF case decreases as the yaw offset changes from 0 ° to 40 ° . For similar reasons, the resultant tower base moment (RTM), shown in Figure 6d, decreases for negative yaw offsets and increases for positive yaw offsets due to a decrease in thrust force induced by the relative tangential velocity component. The DEL decreases in a similar trend for both positive and negative yaw offsets, with higher fatigue loads observed at a yaw offset range of 0 5 ° for BEM and DBEM and 0 10 ° for the OLAF case. The author believes that the discrepancy with the reference result (FAST7) [3] is due to the version difference in the aeroelastic code, as OpenFast8 was used in our case.

4.2. Power Spectral Analysis of Loading
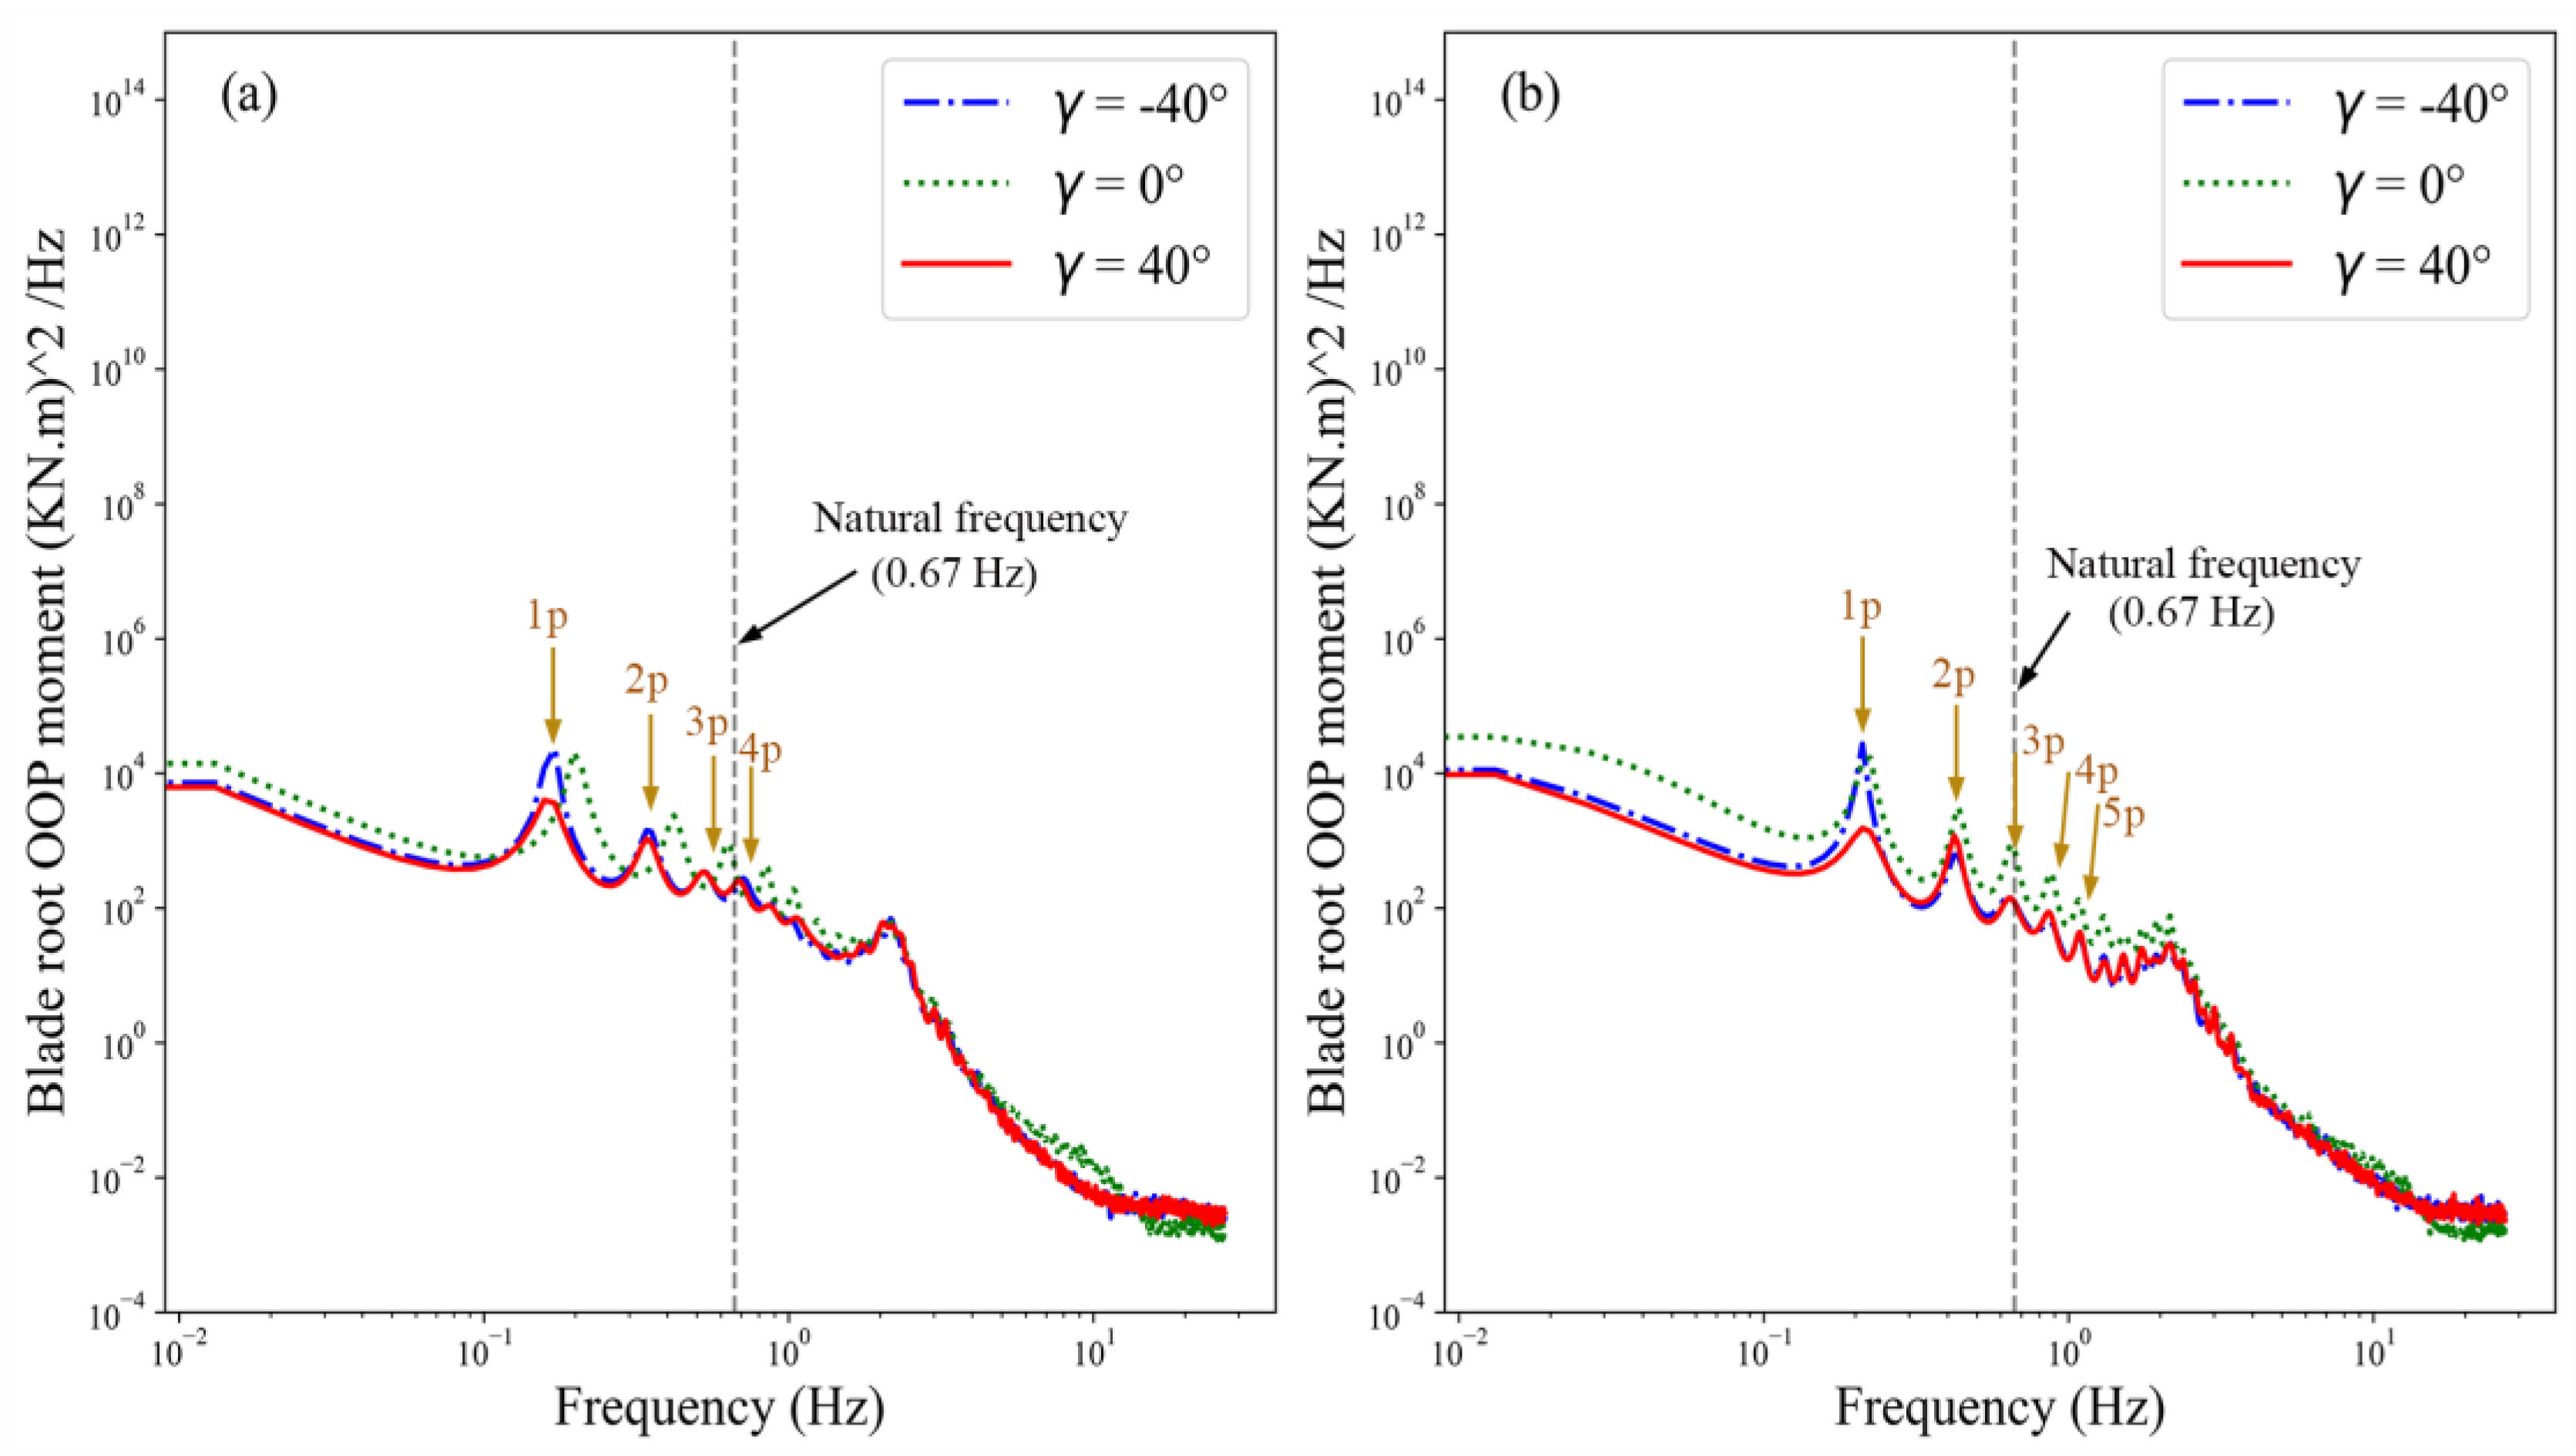
The power spectral density (PSD) functions of the turbine component load simulated by the OLAF method were calculated using the fast Fourier transform (FFT) applied to a 60 min time series. For clarity, we selected the power spectra of wind turbine operation at below-rated and above-rated wind speeds (8 m/s and 12 m/s, respectively) to illustrate the load on critical wind turbine components (blade root, low-speed shaft, and tower base), as shown in Figure 7, Figure 8, Figure 9, Figure 10 and Figure 11 in this section.

4.2.1. Blade Root

Figure 7 shows the PSD of the blade OOP bending moment for a representative turbine under below-rated (8 m/s) and above-rated (12 m/s) turbulent wind speeds. The magnitude of the harmonic frequency components is dominated by the 1Pfrequencies (0.15 Hz at 8 m/s and 0.19 Hz at 12 m/s), followed by 2P (0.3 Hz, 0.38 Hz), 3P (0.45 Hz, 0.57 Hz), 4P (0.6 Hz, 1.15 Hz), and so on, as shown in Figure 7a,b. For the below-rated wind speed case, the harmonic frequencies at yaw angles of 40 ° and + 40 ° shift to the left due to the reduced rotor speed. However, for the above-rated wind speed case, the harmonic frequencies remain unchanged, since the rotor speed is constant when wind speed is above-rated. It is noteworthy that positive yaw misalignment significantly reduces the magnitude of the 1P harmonic frequency component, thereby reducing the DEL of the blade OOP bending moment, as shown in Figure 6a. The first-order natural frequency for the 8 m/s turbulent wind speed case is relatively low. In the 12 m/s case, it aligns with the 3P frequency, which may contribute to an increase in the fatigue damage of the blade. The asymmetry in blade loads, induced by shear flow and variations in cross-flow velocity across the rotor-swept area, increases with positive yaw offsets and decreases with negative yaw offsets (refer to [38] for further details). Similarly, the fatigue load on the blade root increased as the yaw offset increased counterclockwise from the upwind direction.
Figure 7. The PSD of blade root out-of-plane moment simulated by OLAF method. (a) Wind speed of 8 m/s; (b) wind speed of 12 m/s.
Machines 13 00607 g007

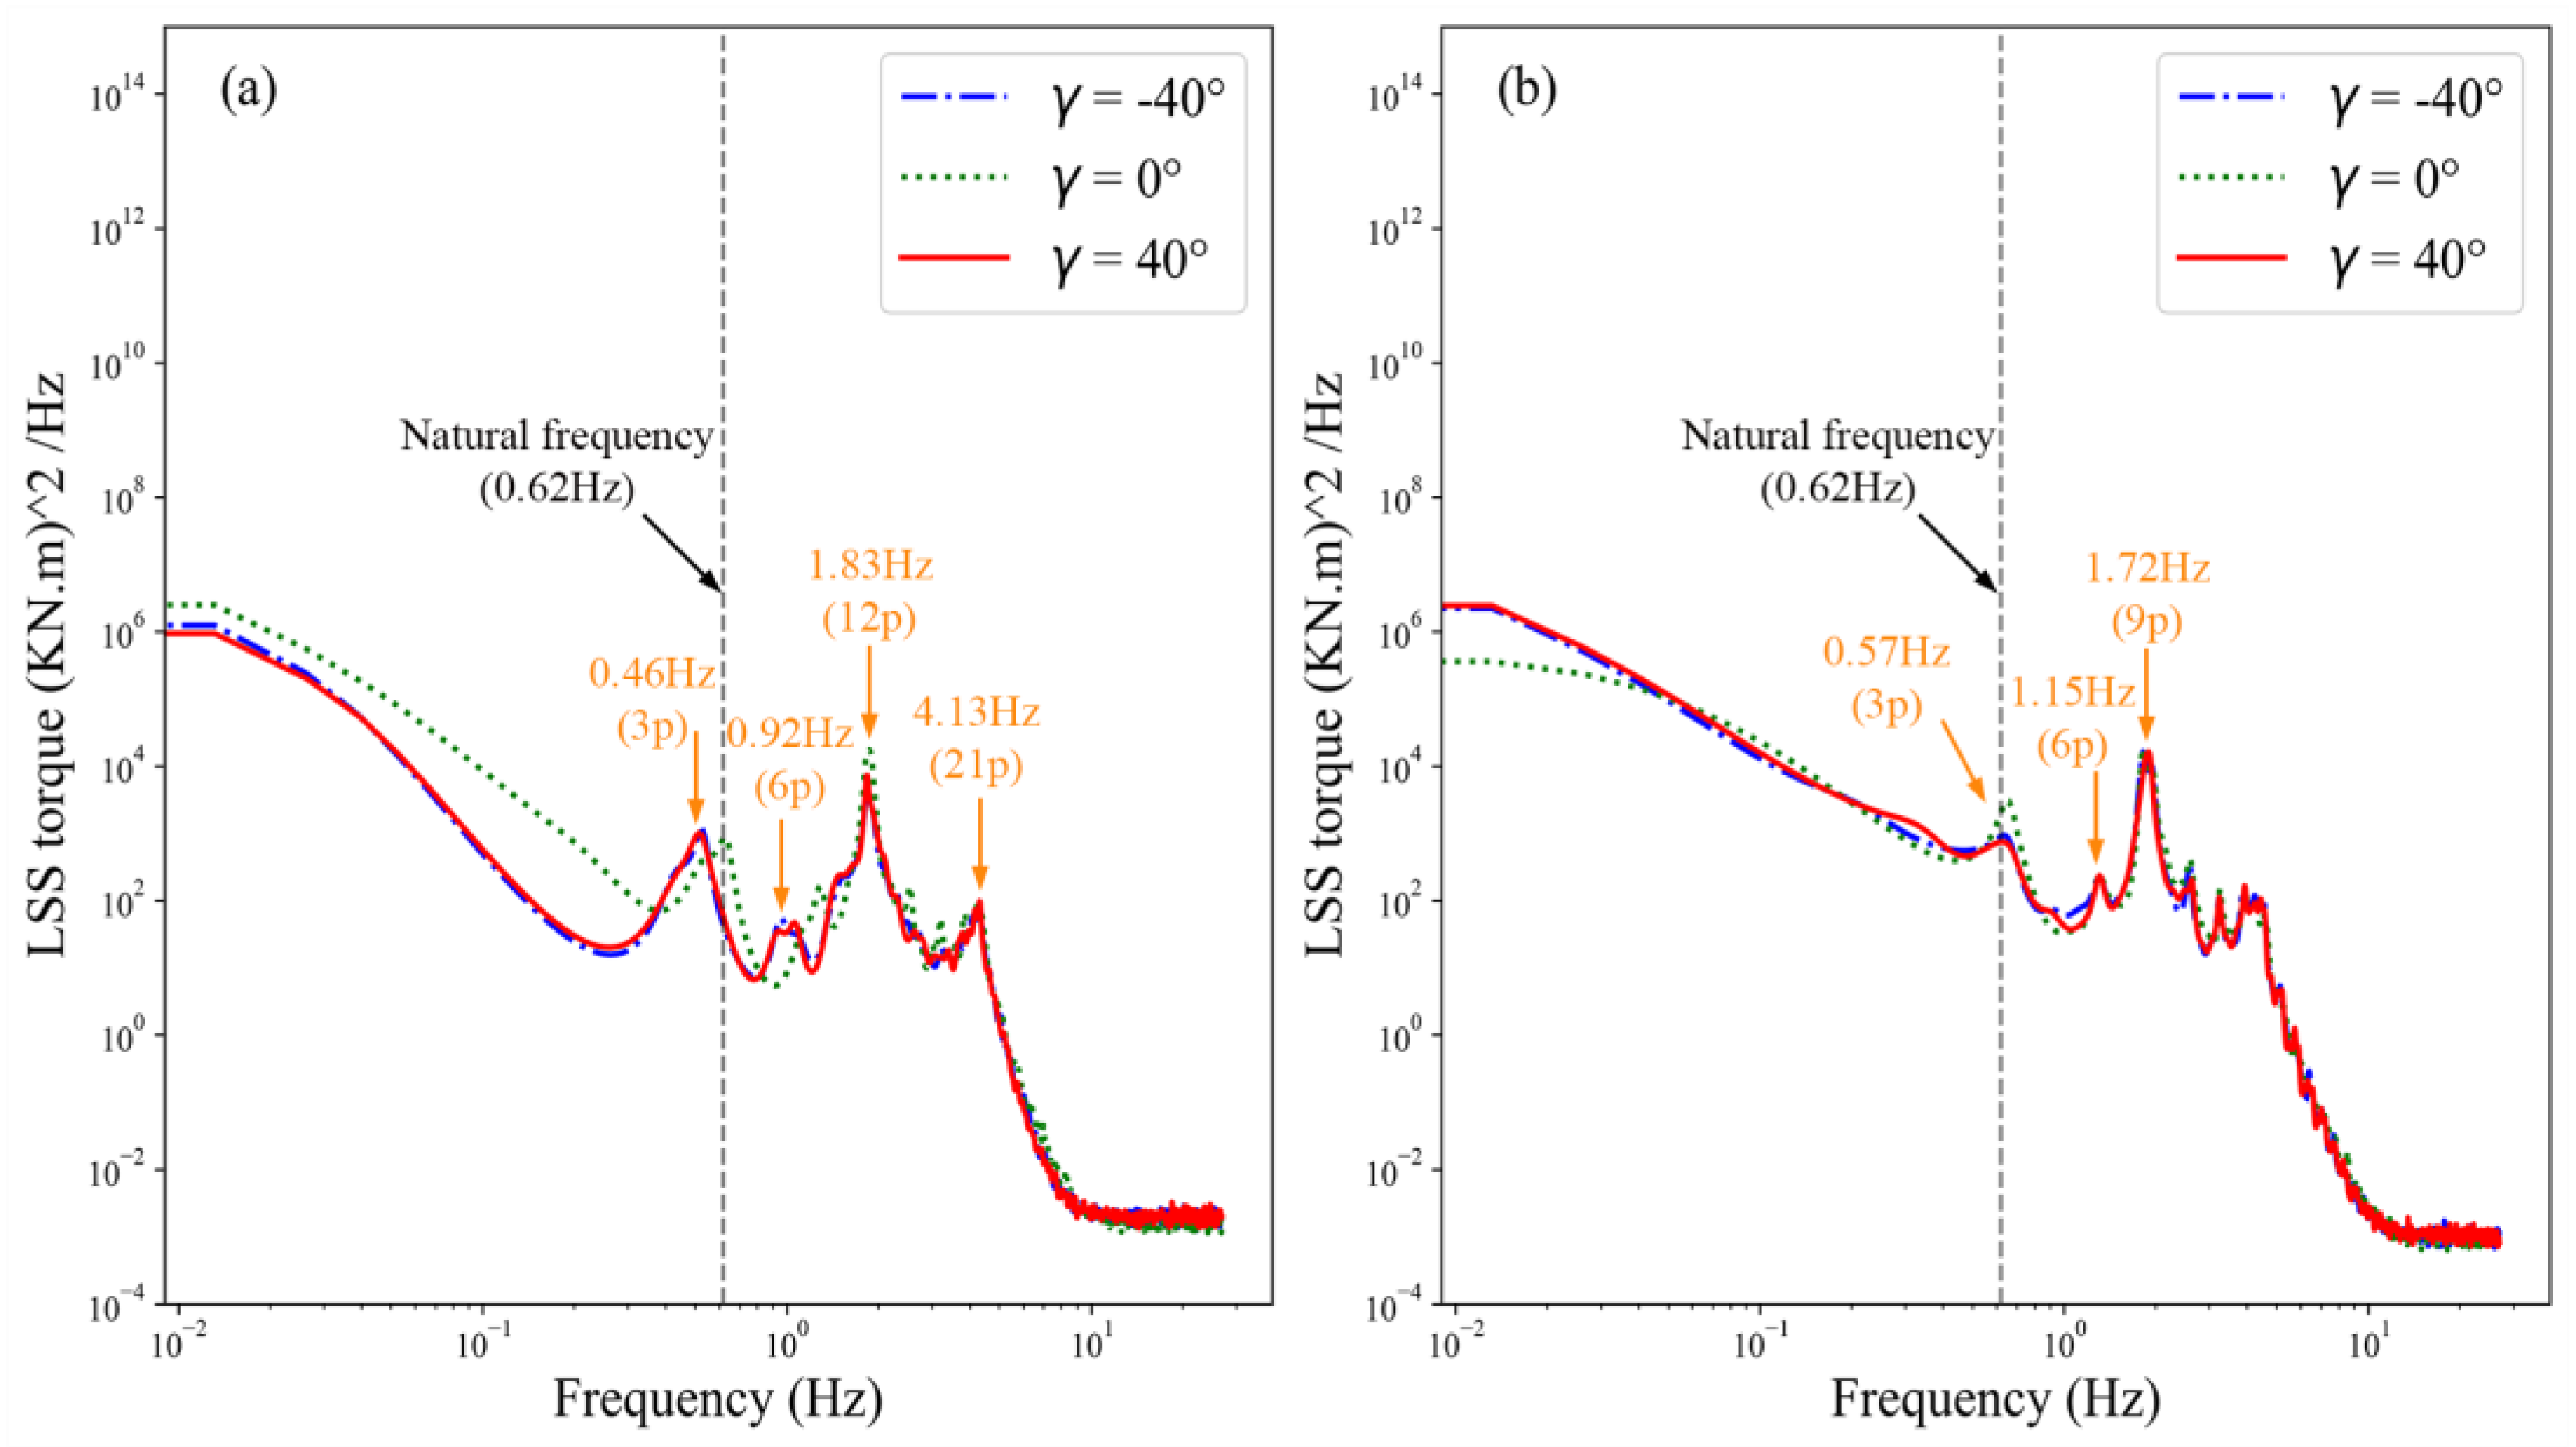
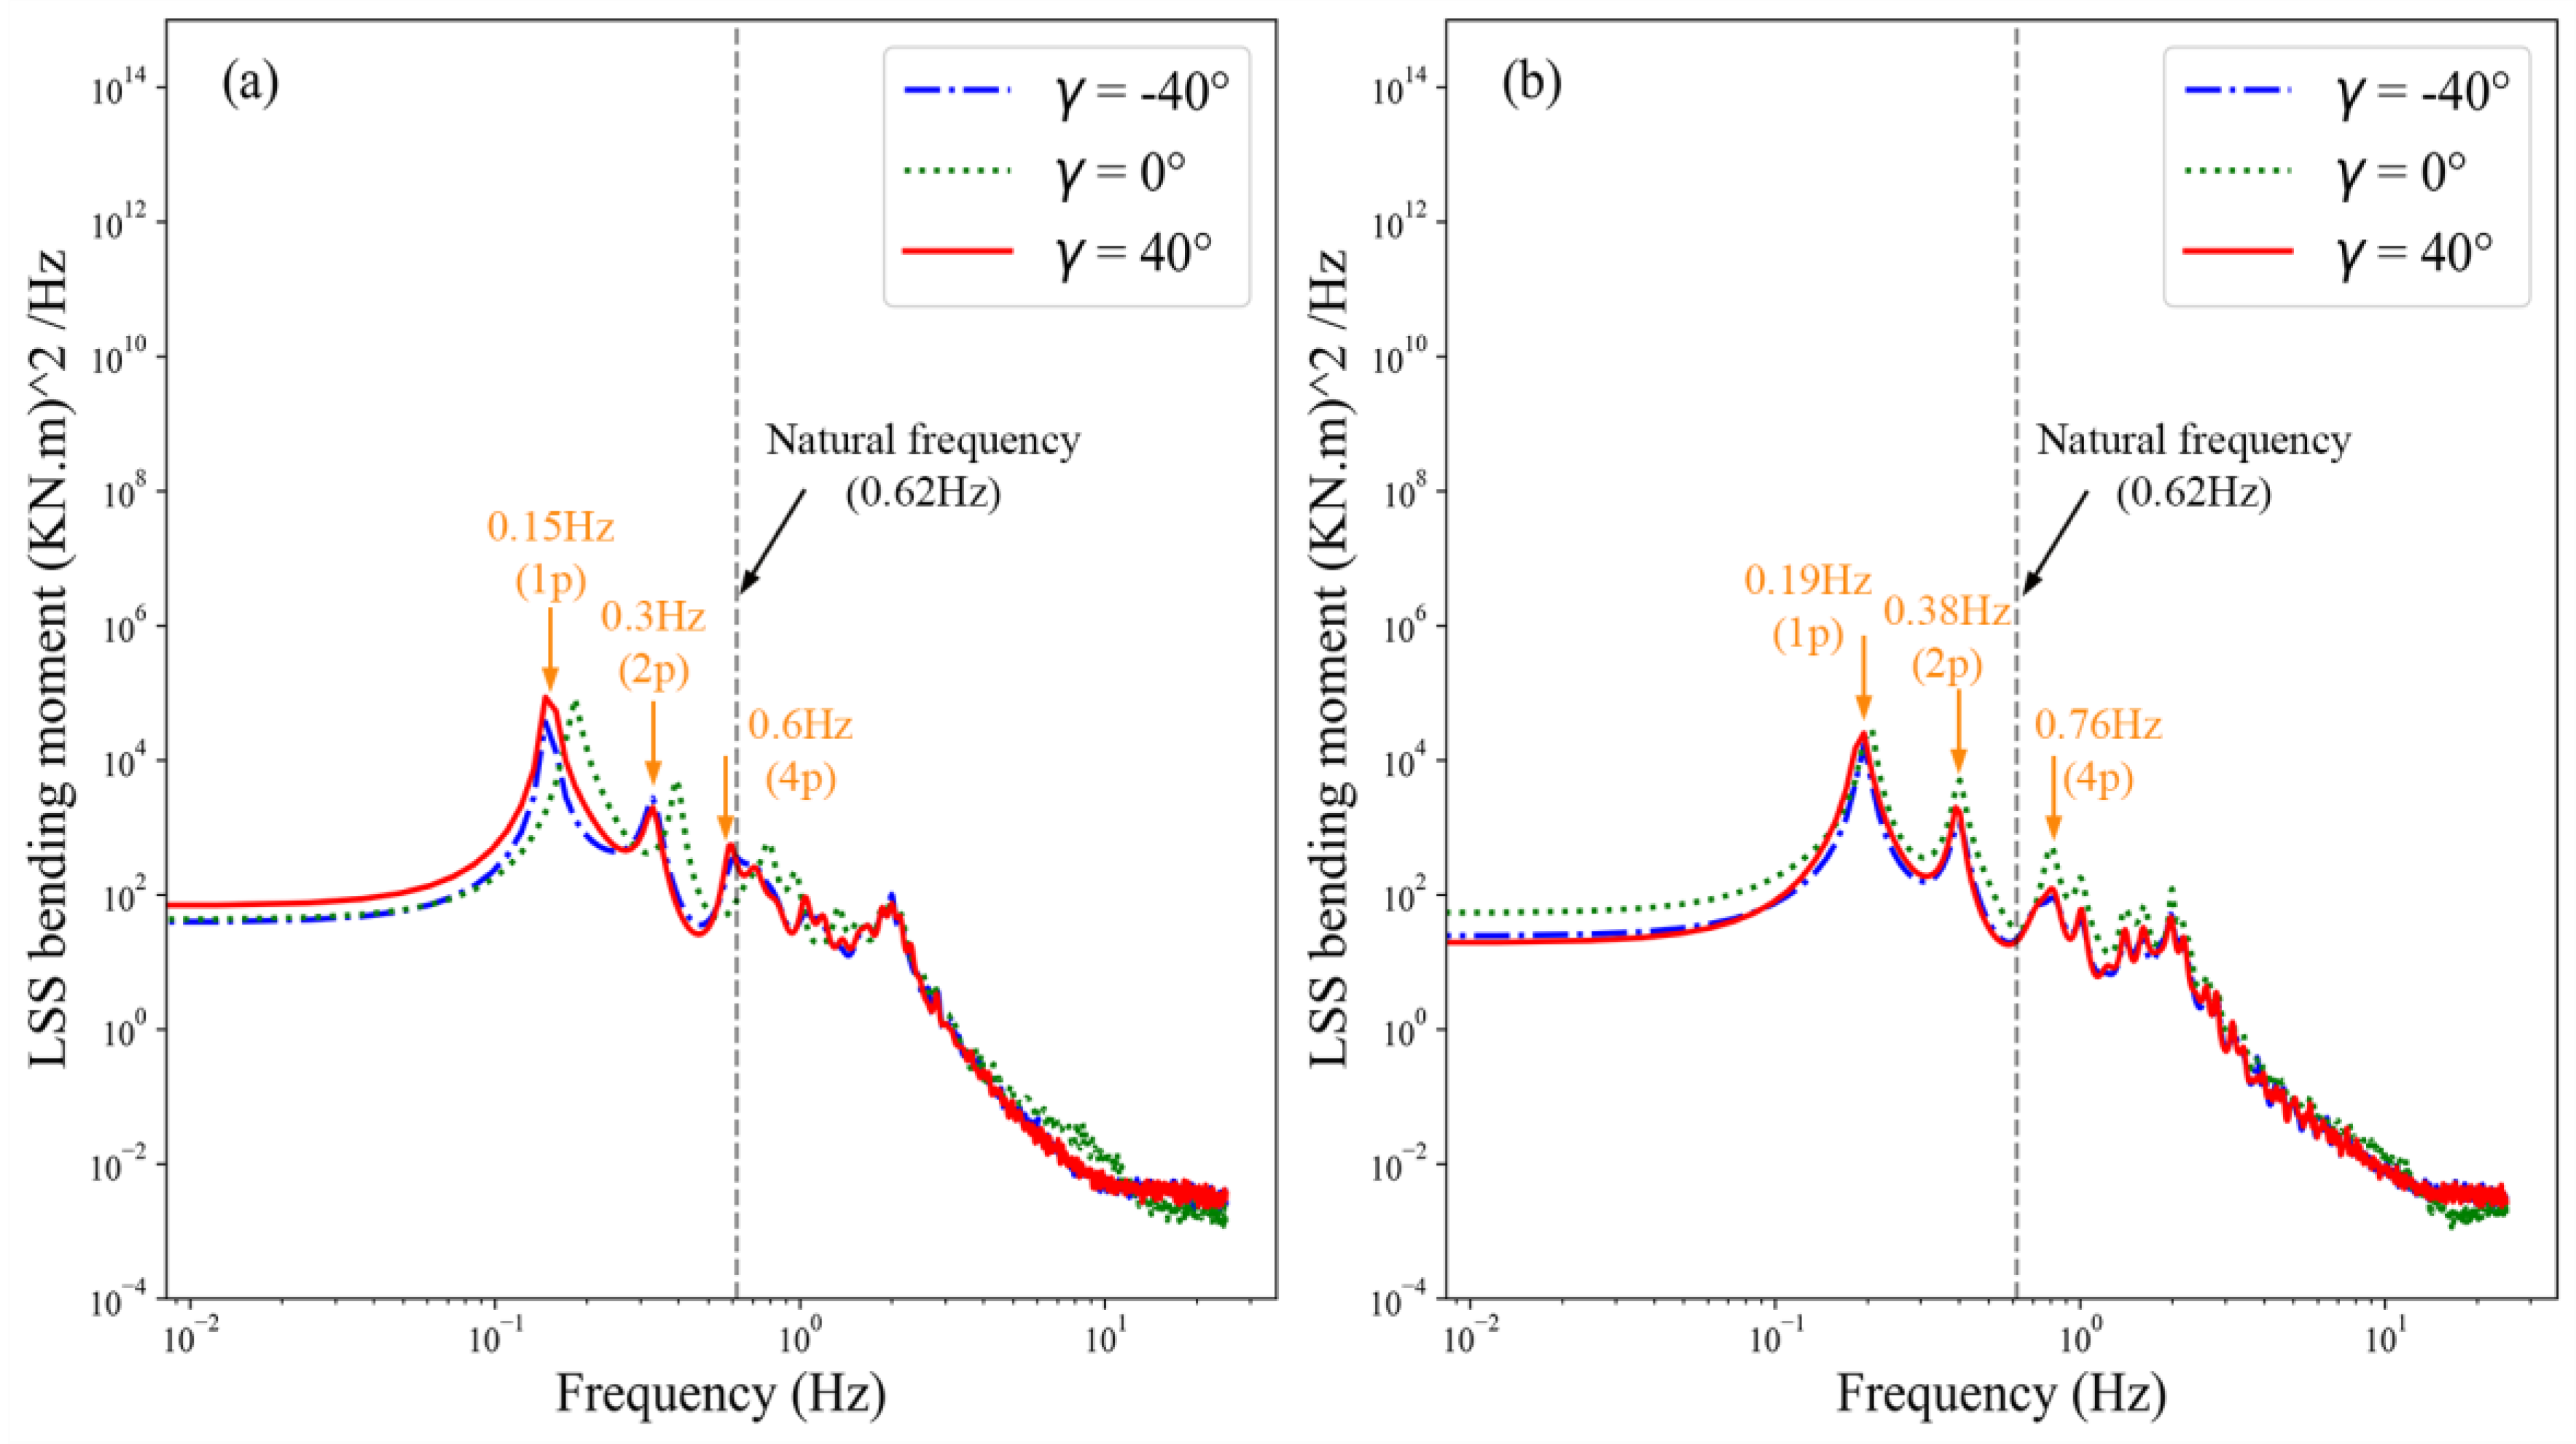
4.2.2. Low-Speed Shaft
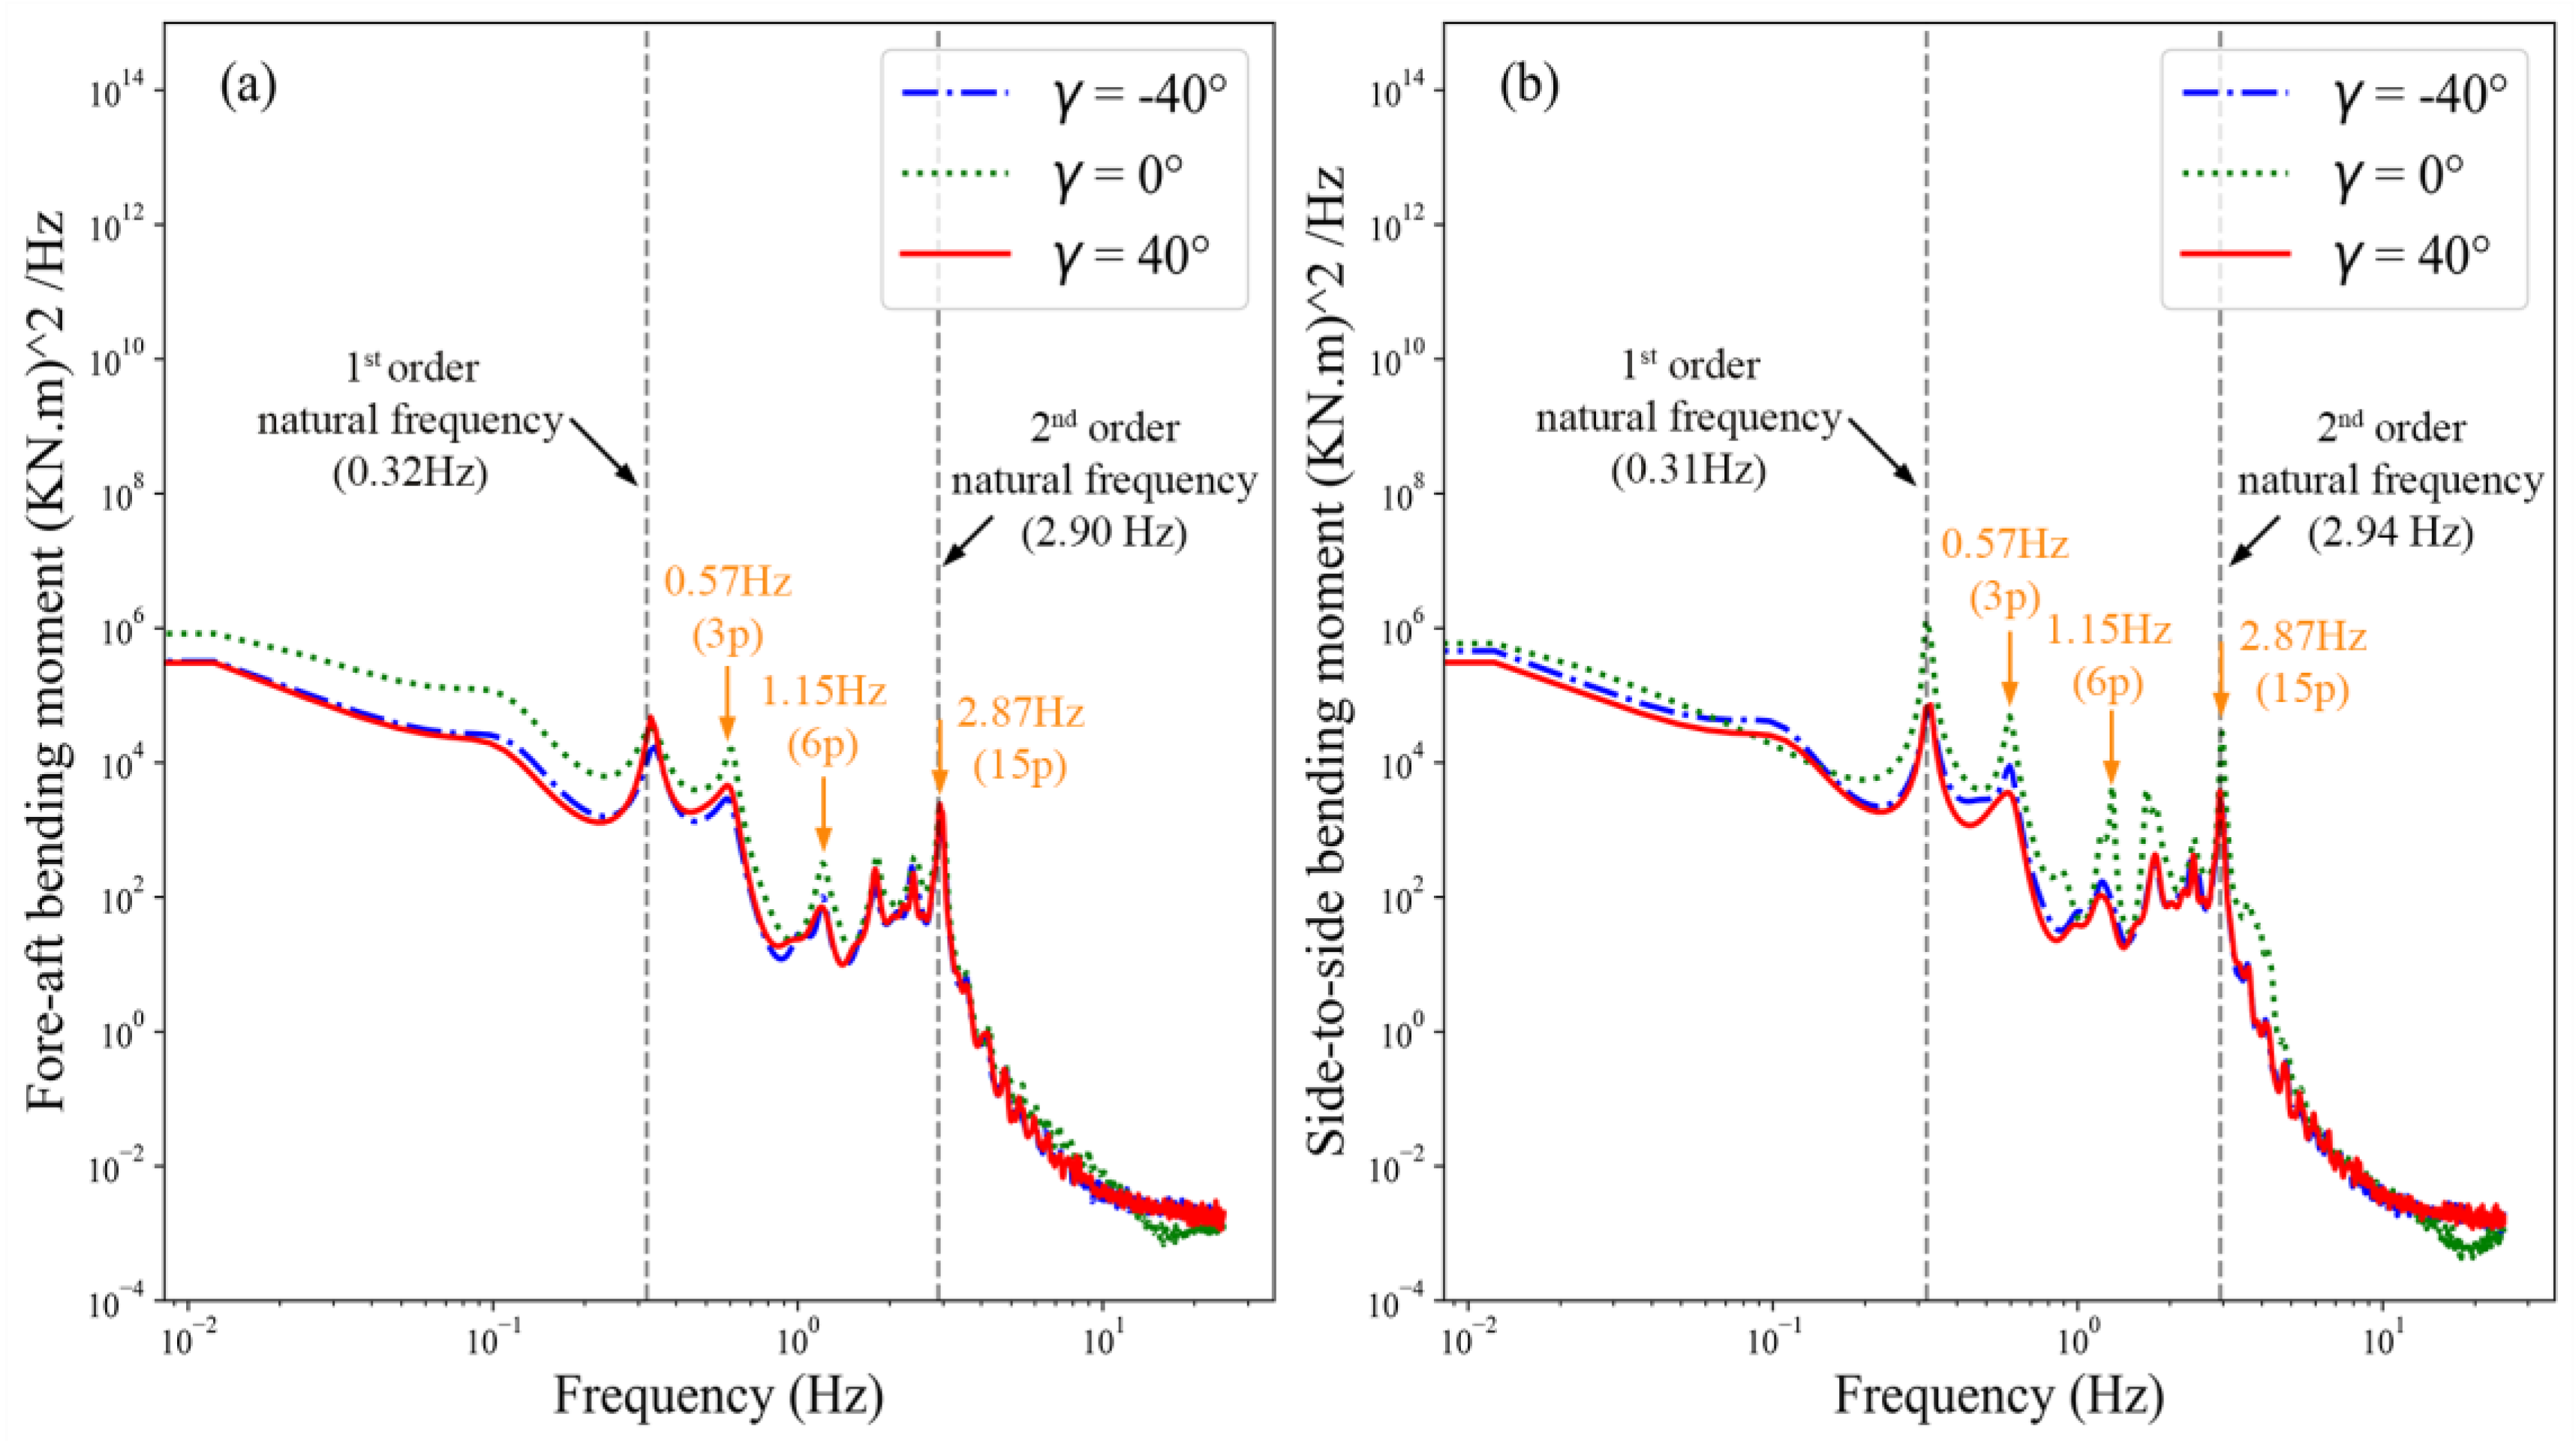
The low-speed shaft transmits the rotational motion of the rotor to the gearbox, with its rotational motion directly related to that of the rotor. The NREL 5 MW wind turbine model control system is configured for torque control when the wind speed is below the rated wind speed and for pitch control when the wind speed exceeds the rated wind speed. Figure 8 depicts the PSD of LSS torque at three yaw angles—γ = −40°, 0°, and 40° under turbulent wind speeds of 8 m/s and 12 m/s. The dominant harmonic frequency appears at 12P (1.83 Hz), followed by 3P, 21P, and 6P for the 8 m/s wind speed case. For the 12 m/s case, the largest magnitude occurs at 9P (1.72 Hz), with additional resonances at 3P and 6P. At 8 m/s, the first-order natural frequency aligns with the 3P harmonic only at γ = 0°, where 3P coincides with the natural frequency of 0.62 Hz. At 12 m/s, this alignment occurs for all three yaw angles, and yaw misalignment reduces the harmonic frequency power spectra of the LSS torque compared to γ = 0 ° , contributing to reduced fatigue damage, as shown in Figure 6b.
Figure 8. The PSD of low-speed shaft torque simulated by OLAF method. (a) Wind speed of 8 m/s; (b) wind speed of 12 m/s.
Machines 13 00607 g008
The PSDs’ LSS moments are characterized by the magnitude peaking at the 1P harmonic and decreasing in the order of 2P and 4P for both below-rated (8 m/s) and above-rated (12 m/s) wind speeds, as shown in Figure 9a,b. In the case of below-rated wind speed, the 1p harmonic frequency due to yaw misalignment is reduced as a result of decreased rotor speed. However, it remains relatively unchanged at above-rated wind speed. The power spectral magnitude under negative yaw misalignment is lower for both below- and above-rated cases, indicating that negative yaw misalignment contributes to reduced fatigue damage, as illustrated in Figure 6c. The first-order natural frequency (0.62 Hz) aligns with the 4P harmonic frequency at 8 m/s wind speed, thereby increasing the fatigue damage of the LSS moment. However, at 12 m/s wind speed, the first-order natural frequency does not align with any of the harmonic frequencies.
Figure 9. The PSD of low-speed shaft bending moment simulated by OLAF method. (a) Wind speed of 8 m/s; (b) wind speed of 12 m/s.
Machines 13 00607 g009

4.2.3. Tower Base

Figure 10 and Figure 11 present the simulated results for the PSD of the tower base fore–aft and side-to-side bending moments for below-rated and above-rated wind speeds, respectively. As shown in Figure 10a,b, at a below-rated wind speed of 8 m/s, the tower shows dominant first-order natural frequencies at 0.32 Hz (fore-aft) and 0.31 Hz (side -to-side). The proximity of the first-order natural frequency to the 3P harmonic frequency widens the range of frequency peaks. In addition, harmonic components are present, including 3P (0.46 Hz), 6P (0.92 Hz), 12P (1.83 Hz), and 21p (3.21 Hz), in both the fore-aft and side-to-side tower base responses. The magnitude of the power spectra decreases with increasing harmonic frequency (e.g., 3P, 6P) and then rises again at higher harmonic components (12P and 21P) for both bending directions. For the fore-aft bending moment, the first-order natural frequency magnitude is increased when the turbine is yawed, while it is significantly decreased by the yaw misalignment for the side-to-side direction. This reduction in the magnitude of the first-order natural frequency and harmonic components in the side-to-side direction can explain why yaw misalignment reduces the resultant tower base fatigue damage, as shown in Figure 6d.
Figure 10. The OLAF case tower base: (a) fore-aft and (b) side-to-side bending moment at wind speed of 8 m/s.
Machines 13 00607 g010
Figure 11. The PSD of tower base: (a) fore-aft and (b) side-to-side bending moment simulated by OLAF at wind speed of 12 m/s.
Machines 13 00607 g011
Figure 11 compares the PSD of time responses of tower base fore-aft and side-to-side bending moments at a mean wind speed of 12 m/s. Similarly, the dominant first-order natural frequencies are observed at 0.32 Hz (fore-aft) and 0.31 Hz (side-to-side). The power spectra of harmonic components, such as 3P (0.57 Hz) and 6P (1.15 Hz), initially decrease but then gradually rise, reaching a maximum near the second-mode tower natural frequency at 15P (2.87 Hz), as shown in Figure 11a,b. Yaw misalignment clearly reduces the spectral peaks of the first-order natural frequency and harmonic components, particularly in the side-to-side bending moment of the tower base. In the case of the fore -aft direction, although the magnitude of the first-order natural frequency does not decrease, yaw misalignment reduces the magnitude of the harmonic components, thereby lowering the resultant tower base fatigue damage, as shown in Figure 6d.

5. Conclusions

The onshore NREL 5 MW reference wind turbine was analyzed under various yaw-offset conditions using BEM, DBEM, and OLAF methods to investigate the effects of the unsteady aerodynamic forces on fatigue loads. The results called attention to the significant influence of yaw offsets on the DEL of wind turbine components, emphasizing the advantages of the OLAF method compared to traditional BEM and DBEM approaches. By incorporating unsteady aerodynamic forces, OLAF demonstrated reduced DEL for blades’ root OOP bending moments, LSS bending moments, and the resultant tower base fore–aft and side-to-side moments. This improvement is attributed to OLAF’s ability to better capture the effects of dynamic inflow and wake flow interactions. Conversely, OLAF showed higher DEL for LSS torque under sustained yaw offsets while experiencing relatively lower fatigue loads within a yaw angle range of -20° to 20°. This is primarily due to its enhanced modeling of increased aerodynamic rotor thrust under unsteady conditions, which are less accurately represented by BEM and DBEM. Unlike traditional methods, OLAF provided more realistic DEL predictions for sustained yaw offsets, where dynamic load variations are critical. These findings underscore OLAF’s capability to better model unsteady aerodynamic forces and their impact on fatigue loads, offering improved accuracy in fatigue load assessments and valuable understanding into rotor and structural performance under yawed conditions. The study delved into the importance of considering unsteady aerodynamic force in the fatigue load evaluation of yawed wind turbines.

Author Contributions

D.H.H.: writing—original draft, writing—review and editing, software, formal analysis, investigation, and visualization. G.-W.Q.: methodology, writing—review and editing, supervision, investigation, and validation. X.-Y.Z.: conceptualization, supervision, and validation. W.W.: conceptualization, supervision, and validation. All authors have read and agreed to the published version of the manuscript.

Funding

This research was supported by the Guangdong Basic and Applied Basic Research Foundation (No. 2024A1515010547, No. 2024B1515250004), the Innovation Group Project of Southern Marine Science and Engineering Guangdong Laboratory (Zhuhai) (No. 311023014). The authors express their deepest gratitude to the concerned parties for their assistance during this study.

Data Availability Statement

The original contributions presented in this study are included in the article. Further inquiries can be directed to the corresponding author(s).

Acknowledgments

The author gratefully acknowledges the support of the Shanghai Government Scholarship. Special thanks are extended to Wei Wang (supervisor), Xuan-Yi Zhou (vice supervisor), and Guo-Wei Qian (vice supervisor) for their active guidance, valuable advice on research methodologies, and multiple reviews that significantly contributed to the completion of this work.

Conflicts of Interest

The authors declare no conflicts of interest.

Abbreviations

The following abbreviations are used in this manuscript:
αShear exponent
BEMBlade element momentum theory
BVBound vorticity
DDrag force
DBEMDynamic blade element momentum theory
DELDamage equivalent load
DLCDesign load case
F n Normal force
F t Tangential force
ΓVorticity
LLift force
LELeading edge
LLLifting line
LSSLow-speed shaft
LSSBMLow-speed shaft bending moment
MEXICOModel experiments in controlled conditions
NRELNational Renewable Energy Laboratory
OLAFConverging Lagrange filaments
OOPOut of plane
ψ Azimuth angle
τ Torque
TBBMTower base bending moment
TETrailing edge
TITurbulence intensity
U ( z ) Wind speed at arbitrary height
U h u b Hub-height wind speed
zVertical height
z h u b Hub height

References

  1. Bromm, M.; Rott, A.; Beck, H.; Vollmer, L.; Steinfeld, G.; Kühn, M. Field investigation on the influence of yaw misalignment on the propagation of wind turbine wakes. Wind Energy 2018, 21, 1011–1028. [Google Scholar] [CrossRef]
  2. Fleming, P.A.; Ning, A.; Gebraad, P.M.; Dykes, K. Wind plant system engineering through optimization of layout and yaw control. Wind Energy 2013, 19, 329–344. [Google Scholar] [CrossRef]
  3. Zalkind, D.S.; Pao, L.Y. The fatigue loading effects of yaw control for wind plants. In Proceedings of the American Control Conference, Boston, MA, USA, 6–8 July 2016; pp. 537–542. [Google Scholar] [CrossRef]
  4. Han, W.; Kim, H.; Son, E.; Lee, S. Assessment of yaw-control effects on wind turbine-wake interaction: A coupled unsteady vortex lattice method and curled wake model analysis. J. Wind Eng. Ind. Aerodyn. 2023, 242, 105559. [Google Scholar] [CrossRef]
  5. Ke, S.; Wang, T.; Ge, Y.; Wang, H. Wind-induced fatigue of large HAWT coupled tower–blade structures considering aeroelastic and yaw effects. Struct. Des. Tall Spec. Build. 2018, 27, e1467. [Google Scholar] [CrossRef]
  6. Fleming, P.; Gebraad, P.M.; Lee, S.; van Wingerden, J.W.; Johnson, K.; Churchfield, M.; Michalakes, J.; Spalart, P.; Moriarty, P. Simulation comparison of wake mitigation control strategies for a two-turbine case. Wind Energy 2015, 18, 2135–2143. [Google Scholar] [CrossRef]
  7. Kragh, K.A.; Hansen, M.H. Load alleviation of wind turbines by yaw misalignment. Wind Energy 2013, 17, 971–982. [Google Scholar] [CrossRef]
  8. Gebraad, P.M.; Teeuwisse, F.W.; Van Wingerden, J.W.; Fleming, P.A.; Ruben, S.D.; Marden, J.R.; Pao, L.Y. Wind plant power optimization through yaw controlusing a parametric model for wake effects—A CFD simulation study. Wind Energy 2013, 19, 95–114. [Google Scholar] [CrossRef]
  9. Branlard, E.; Jonkman, B.; Pirrung, G.R.; Dixon, K.; Jonkman, J. Dynamic inflow and unsteady aerodynamics models for modal and stability analyses in OpenFAST. J. Phys. Conf. Ser. 2022, 2265, 032044. [Google Scholar] [CrossRef]
  10. Sun, J.; Chen, Z.; Yu, H.; Gao, S.; Wang, B.; Ying, Y.; Sun, Y.; Qian, P.; Zhang, D.; Si, Y. Quantitative evaluation of yaw-misalignment and aerodynamic wake induced fatigue loads of offshore Wind turbines. Renew. Energy 2022, 199, 71–86. [Google Scholar] [CrossRef]
  11. Zhao, Q.; Sheng, C.; Afjeh, A. Computational Aerodynamic Analysis of Offshore Upwind and Downwind Turbines. J. Aerodyn. 2014, 2014, 860637. [Google Scholar] [CrossRef]
  12. Lu, F.; Long, K.; Geng, R.; Chen, Y.; Saeed, A.; Zhang, J.; Tao, T. A quantitative approach for evaluating fatigue damage under wake effects and yaw control for offshore wind turbines. Sustain. Energy Technol. Assess. 2024, 66, 103824. [Google Scholar] [CrossRef]
  13. Zhang, J.; Zuo, H.; Zhu, S.; Yang, J.; Lu, L. Fatigue degradation of wind turbines considering dynamic wake meandering effects. Eng. Struct. 2024, 300, 117132. [Google Scholar] [CrossRef]
  14. Burton, T.; Jenkins, N.; Sharpe, D.; Bossanyi, E. The performance curves. In Wind Energy Handbook; John Wiley & Sons: Hoboken, NJ, USA, 2011; Available online: https://library.uniteddiversity.coop/Energy/Wind/Wind_Energy_Handbook.pdf (accessed on 14 June 2025).
  15. Mahmuddin, F. Rotor Blade Performance Analysis with Blade Element Momentum Theory. Energy Procedia 2017, 105, 1123–1129. [Google Scholar] [CrossRef]
  16. Jonkman, J.; Butterfield, S.; Musial, W.; Scott, G. Definition of a 5-MW Reference Wind Turbine for Offshore System Development; National Renewable Energy Laboratory (NREL): Golden, CO, USA, 2009; pp. 1–75. [Google Scholar]
  17. Liu, X.; Lu, C.; Liang, S.; Godbole, A.; Chen, Y. Vibration-induced aerodynamic loads on large horizontal axis wind turbine blades. Appl. Energy 2017, 185, 1109–1119. [Google Scholar] [CrossRef]
  18. Liu, X.; Lu, C.; Liang, S.; Godbole, A.; Chen, Y. Improved dynamic stall prediction of wind turbine airfoils. Energy Procedia 2019, 158, 1021–1026. [Google Scholar] [CrossRef]
  19. Moriarty, P.J.; Hansen, A.C. AeroDyn Theory Manual. Annu. Rev. Fluid Mech. 1983, 15, 223–239. Available online: https://docs.nrel.gov/docs/fy05osti/36881.pdf (accessed on 14 June 2025).
  20. Hansen, M.H.; Gaunaa, M.; Aagaard Madsen, H. A Beddoes-Leishman Type Dynamic Stall Model in State-Space and Indicial Formulations. Denmark. Forskningscenter Risoe. Risoe-R No. 1354(EN). 2004. Available online: https://backend.orbit.dtu.dk/ws/portalfiles/portal/7711084/ris_r_1354.pdf (accessed on 14 June 2025).
  21. Bangga, G.; Lutz, T.; Arnold, M. An improved second-order dynamic stall model for wind turbine airfoils. Wind Energy Sci. 2020, 5, 1037–1058. [Google Scholar] [CrossRef]
  22. Qian, G.W.; Ishihara, T. A new analytical wake model for yawed wind turbines. Energies 2018, 11, 665. [Google Scholar] [CrossRef]
  23. He, R.; Yang, H.; Sun, S.; Lu, L.; Sun, H.; Gao, X. A machine learning-based fatigue loads and power prediction method for wind turbines under yaw control. Appl. Energy 2022, 326, 120013. [Google Scholar] [CrossRef]
  24. Zhou, L.; Shen, X.; Ma, L.; Chen, J.; Ouyang, H.; Du, Z. Unsteady aerodynamics of the floating offshore wind turbine due to the trailing vortex induction and airfoil dynamic stall. Energy 2024, 304, 19–22. [Google Scholar] [CrossRef]
  25. Shaler, K.; Branlard, E.; Platt, A. OLAF User’s Guide and Theory Manual; National Renewable Energy Laboratory: Golden, CO, USA, 2020; pp. 1–26. [Google Scholar]
  26. Jason. Jonkman TurbSim User’s Guide v2. October 2014; pp. 1–28. Available online: https://www.nrel.gov/wind/nwtc/turbsim (accessed on 14 June 2025).
  27. Commision, I.E. Consolidated Version Version; 2014. Available online: https://webstore.iec.ch/en/publication/3587 (accessed on 13 July 2025).
  28. Resor, B.R. Definition of a 5 MW/61.5 m Wind Turbine Blade Reference Model; SAND2013-2569; Sandia Report; Sandia National Laboratories: Albuquerque, NM, USA, 2013; Volume 2013, p. 50. [Google Scholar]
  29. Branlard, E. Wind Turbine Aerodynamics and Vorticity-Based Methods; Springer: Cham, Switzerland, 2017. [Google Scholar] [CrossRef]
  30. Jonkman, J.M.; Buhl, M.L., Jr. FAST User’ s Guide; National Renewable Energy Laboratory: Golden, CO, USA, 2005. [Google Scholar]
  31. TS EN 61400-1; Rüzgar Türbinleri-Bölüm 1: Tasarım Kuralları. No. 112. TSE: Ankara, Turkey, 2006.
  32. Hayman, G.J. MExtemes Manual Version 1. 00; National Renewable Energy Laboratory: Golden, CO, USA, 2015; p. 7. [Google Scholar]
  33. Hayman, G.J. MLife Theory Manual; National Renewable Energy Laboratory: Golden, CO, USA, 2012; p. 12. [Google Scholar]
  34. Schepers, J.G.; Snel, H. Model Experiments in Controlled Conditions—Final Report; ECN Rep. ECN-E-07-042; Energy Research Centre of the Netherlands (ECN): Petten, The Netherlands, 2008; p. 54. [Google Scholar]
  35. Yang, H.; Shen, W.; Xu, H.; Hong, Z.; Liu, C. Prediction of the wind turbine performance by using BEM with airfoil data extracted from CFD. Renew. Energy 2014, 70, 107–115. [Google Scholar] [CrossRef]
  36. Boorsma, K. Analysis of Field Measurements and Aerodynamic Predictions. 2012. [Google Scholar]
  37. Ciri, U.; Rotea, M.A.; Leonardi, S. Effect of the turbine scale on yaw control. Wind Energy 2018, 21, 1395–1405. [Google Scholar] [CrossRef]
  38. Churchfield, M.J.; Lee, S.; Michalakes, J.; Moriarty, P.J. A numerical study of the effects of atmospheric and wake turbulence on wind turbine dynamics. J. Turbul. 2012, 13, N14. [Google Scholar] [CrossRef]
Figure 1. Fatigue load assessment workflow for wind turbine.
Machines 13 00607 g001
Figure 2. The inflow wind characteristics of (a) wind profile and (b) turbulence intensity profiles.
Machines 13 00607 g002
Figure 3. Illustration of blade aerodynamics: (a) blade element annular ring; (b) yaw offset orientation; (c) blade element velocities and forces.
Machines 13 00607 g003
Figure 4. Illustration of vortex shed. (a) Cross-sectional view defining leading edge, trailing edge, lifting line, bound vorticity (BV), and emitted vorticity (EV). (b) Circulation of vorticity segments between panels and geometrical quantities for lifting-line panel.
Machines 13 00607 g004
Figure 5. Comparison of blade span load distribution. (a) Normal force; (b) tangential force; (c) flapwise blade root fatigue DEL; (d) NRMSE of simulated result to experimental data.
Machines 13 00607 g005
Figure 6. Damage equivalent load as a function of yaw misalignment for the 5 MW NREL: (a) OOP blade moment; (b) LSS torque; (c) LSS bending moment; (d) resultant tower moment.
Machines 13 00607 g006
Table 1. Properties of the blade and tower sections.
ComponentsMaterialOuter
Diameter
(m)
Wall
Thickness
(m)
Section Area
(m2)
Moment of Inertia
(m4)
Young’s Modulus
−x (Gpa)
Young’s Modulus
−y (GPa)
Shear
Modulus
(GPa)
Ultimate Strength
(GPa)
Tower base [16]Steel S3556.0000.0350.6582.92521021080.80.56
Blade root [28]Gelcoat3.5420.0550.5980.9093.44-1.38-
Triax 27.713.657.200.70
Table 2. The wind inflow and operational condition of simulations.
NameValue
Turbulence modelIECKAI
Wind speed6 m/s, 8 m/s, 10 m/s 12 m/s, and 14 m/s
Turbulence intensityCategory A
Wind profile typePower law
Turbulence modelNormal turbulence model
Shear exponent0.2
Yaw angle 0 ° , ± 5 ° , ± 10 ° , ± 15 ° , ± 20 ° , ± 25 ° , ± 30 ° , ± 35 ° ,   and ± 40 °
Table 3. Explanation of presented loads.
NameExplanation
OOP blade momentOut-of-plane blade moment
LSS torqueLow-speed shaft torque
LSS bending MomentLow-speed shaft bending moment
Resultant tower momentThe resultant (RTM) of fore–aft ( M y ) and side-to-side ( M x ) tower base bending moment
Disclaimer/Publisher’s Note: The statements, opinions and data contained in all publications are solely those of the individual author(s) and contributor(s) and not of MDPI and/or the editor(s). MDPI and/or the editor(s) disclaim responsibility for any injury to people or property resulting from any ideas, methods, instructions or products referred to in the content.

