Article

Aeroelastic Study of Downwind and Upwind Configurations Under Different Power Levels of Wind Turbines

1
School of Electrical Energy and Power Engineering, Yangzhou University, Yangzhou 225127, China
2
ETSIAE-School of Aeronautical and Space Engineering, Universidad Politécnica de Madrid, 28040 Madrid, Spain
3
Beijing Goldwind Science & Creation Windpower Equipment Co., Ltd., Beijing 100176, China
*
Author to whom correspondence should be addressed.
Machines 2025, 13(7), 599; https://doi.org/10.3390/machines13070599
Submission received: 31 March 2025 / Revised: 4 July 2025 / Accepted: 7 July 2025 / Published: 11 July 2025

Abstract

Downwind wind turbines offer potential for reduced blade loads and lighter designs, yet systematic aeroelastic comparisons against upwind configurations remain limited, especially for multi-megawatt scales. This study conducts comprehensive OpenFAST simulations of the IEA 15 MW reference turbine in both configurations, contextualized against smaller turbines (2.1, 5, and 10 MW). Scaling trends reveal that, with the increase in turbine size, the disadvantage of the downwind turbine (higher flapwise and edgewise fatigue load) is gradually disappearing and even becomes an advantage. However, downwind configurations amplify tower base loads significantly. These results highlight scalable benefits for blade loads but underscore critical trade-offs requiring tower reinforcement. Optimizing rotor-nacelle mass distribution emerges as a key pathway to mitigate tower penalties while leveraging blade-load alleviation for larger downwind turbines.

1. Introduction

Wind energy, as a crucial renewable energy source, exhibits dual developmental trends: a continuous increase in wind turbine installations, coupled with a significant upscaling of wind turbine size. Driven by offshore expansion, turbine capacity is projected to reach 20 MW with rotor diameters of 170–240 m. A vast majority of the commercially used wind turbines belong to the upwind configuration type, meaning that the rotor is upstream of the tower. However, for these upwind configurations, the blade mass escalates cubically or sub-cubically with its length, creating cascading demands for reinforced towers, transmission systems, and foundations, posing new challenges in further reducing the cost of energy [1]. Current mass-reduction strategies face triple constraints: high-strength materials like carbon fiber reinforced materials are cost-limited, while conventional structural optimization [2] offers incremental improvements but fails to fundamentally alter the cubic growth paradigm. Additionally, it is found that the maximum tip displacement or rigidity of the blade constrains the further reduction in blade mass, which implies the significance of larger tip-tower clearance. Measures or designs, such as coned, tilted, and pre-bending rotor concepts, lead to a larger tip-tower clearance and have been widely utilized in the wind industry.
In recent years, the downwind configuration for wind turbines has been reconsidered, especially in the novel load-aligned designs [3,4,5]. The downwind load-aligned concept, exemplified by morphing or pre-coned rotors, seeks to minimize flapwise bending moments by aligning centrifugal, gravitational, and thrust forces along the blade axis. It is found that aligning the resultant force along the blade spanwise direction theoretically reduces cantilever loads to primarily tensile stresses, enabling lighter blades with mass reductions up to 33% compared to conventional upwind counterparts [4,6]. Additionally, as a downwind configuration, it can also increase the tip-tower clearance through wind-induced blade deflection. Due to the lack of application examples of downwind wind turbines, most of the research focuses on theoretical and numerical simulations. To this end, Noyes et al. [5] investigated a downwind rotor configuration incorporating load-aligned coning under critical conditions to achieve moment reduction. A comparative analysis of a 13.2 MW two-bladed downwind system (15° coning) versus conventional SNL100-02 three-bladed upwind turbines demonstrates a 19.0% reduced blade equivalent fatigue loading and 27.4% mass savings in Class IIB winds. Ichter et al. demonstrated that a 13.2 MW downwind morphing rotor achieved significant mass savings while maintaining equivalent annual energy output to conventional designs [7].
Only a few experiments have been performed on large downwind wind turbines. A 20% scaled model (SUMR-D) of the above-mentioned 13.2 MW two-bladed downwind rotor was designed using geometric and aeroelastic scaling principles, focusing on operational flapwise deflections, rotational frequencies, and structural properties. The scaled blade successfully replicated the nondimensional flapwise deflections and dynamics of the full-scale rotor, despite some deviations in mass and stiffness due to safety constraints [8]. The 20% scaled rotor was tested in horizontal parked conditions with data collected on unsteady flapwise bending moments and tip deflections. The experimental data showed that the rotor could withstand extreme loads in parked conditions. The OpenFAST predictions were reasonably accurate, demonstrating the potential of subscale testing to validate full-scale turbine designs. The study also highlighted the importance of considering extreme conditions in turbine design [9]. Operational field tests on that 20% scaled rotor were conducted at the NWTC (National Wind Technology Center), where the rotor was subjected to high wind speeds and turbulence. The study validated the use of subscale testing for extreme-scale turbine designs and demonstrated the effectiveness of the scaling method [10].
While downwind configurations inherently alleviate tower-strike concerns by orienting blade deflection away from the support structure, their aerodynamic and aeroelastic behaviors introduce distinct complexities. Such configurations face unresolved challenges, including unsteady aeroelastic interactions, fatigue from tower shadow effects, and the mechanical complexity of morphing mechanisms. The tower shadow effect—a periodic velocity deficit encountered by blades traversing the tower wake—exacerbates fatigue loads in downwind turbines. Field tests by Simpson et al. [11] on SUMR-D rotor revealed that the tower shadow increased short-term damage from equivalent loads by less than 10% under steady conditions, and turbulence-dominated environments showed a minimal relative impact. Conversely, upwind turbines avoid this phenomenon but face escalating mass penalties and stiffness requirements as blade lengths exceed 100 m. Recent comparative studies, such as those by Zalkind et al. [12], highlighted that two-bladed downwind designs may reduce peak loads by 10% per 5° of coning angle, yet the main bearing peak load rises by 280% due to gravitational overhang. These trade-offs underscore the need for systematic comparisons of aeroelastic performance between configurations.
Current literature focuses predominantly on isolated structural or aerodynamic optimizations, with limited integration of dynamic aeroelastic responses across operational wind regimes. For example, Noyes et al. [4] analytically quantified load alignment benefits for a 13.2 MW turbine but omitted turbulent inflow effects. Phadnis et al. (2024) [13] emphasized individual pitch control (IPC) for fatigue mitigation in downwind rotors only under the operational design load case (DLC 1.2). Kaminski et al. [10] conducted a field test for the downwind and coned SUMR-D rotor to investigate moments and deflections of the flexible blade, but did not contrast them against upwind equivalents. This gap impedes holistic insights into configuration-dependent aeroelastic stability, particularly for large-scale turbines operating in extreme environments.
This study addresses these limitations by systematically comparing the aeroelastic characteristics of the upwind and downwind configurations under different wind conditions, with special focus on the load at the blade root, the load at the bottom of the tower, and the displacement of the blades. The paper will be organized as follows: Firstly, a brief introduction of the method and wind turbine model is presented in Section 2. Then, the computational details, including the description of the wind turbine model, setting details of wind conditions, and the comparison of upwind and downwind configurations, are given. Results and discussions about the comparisons and analyses are presented in Section 3. Finally, the conclusions are drawn in Section 4.

2. Numerical Method and Wind Turbine Model

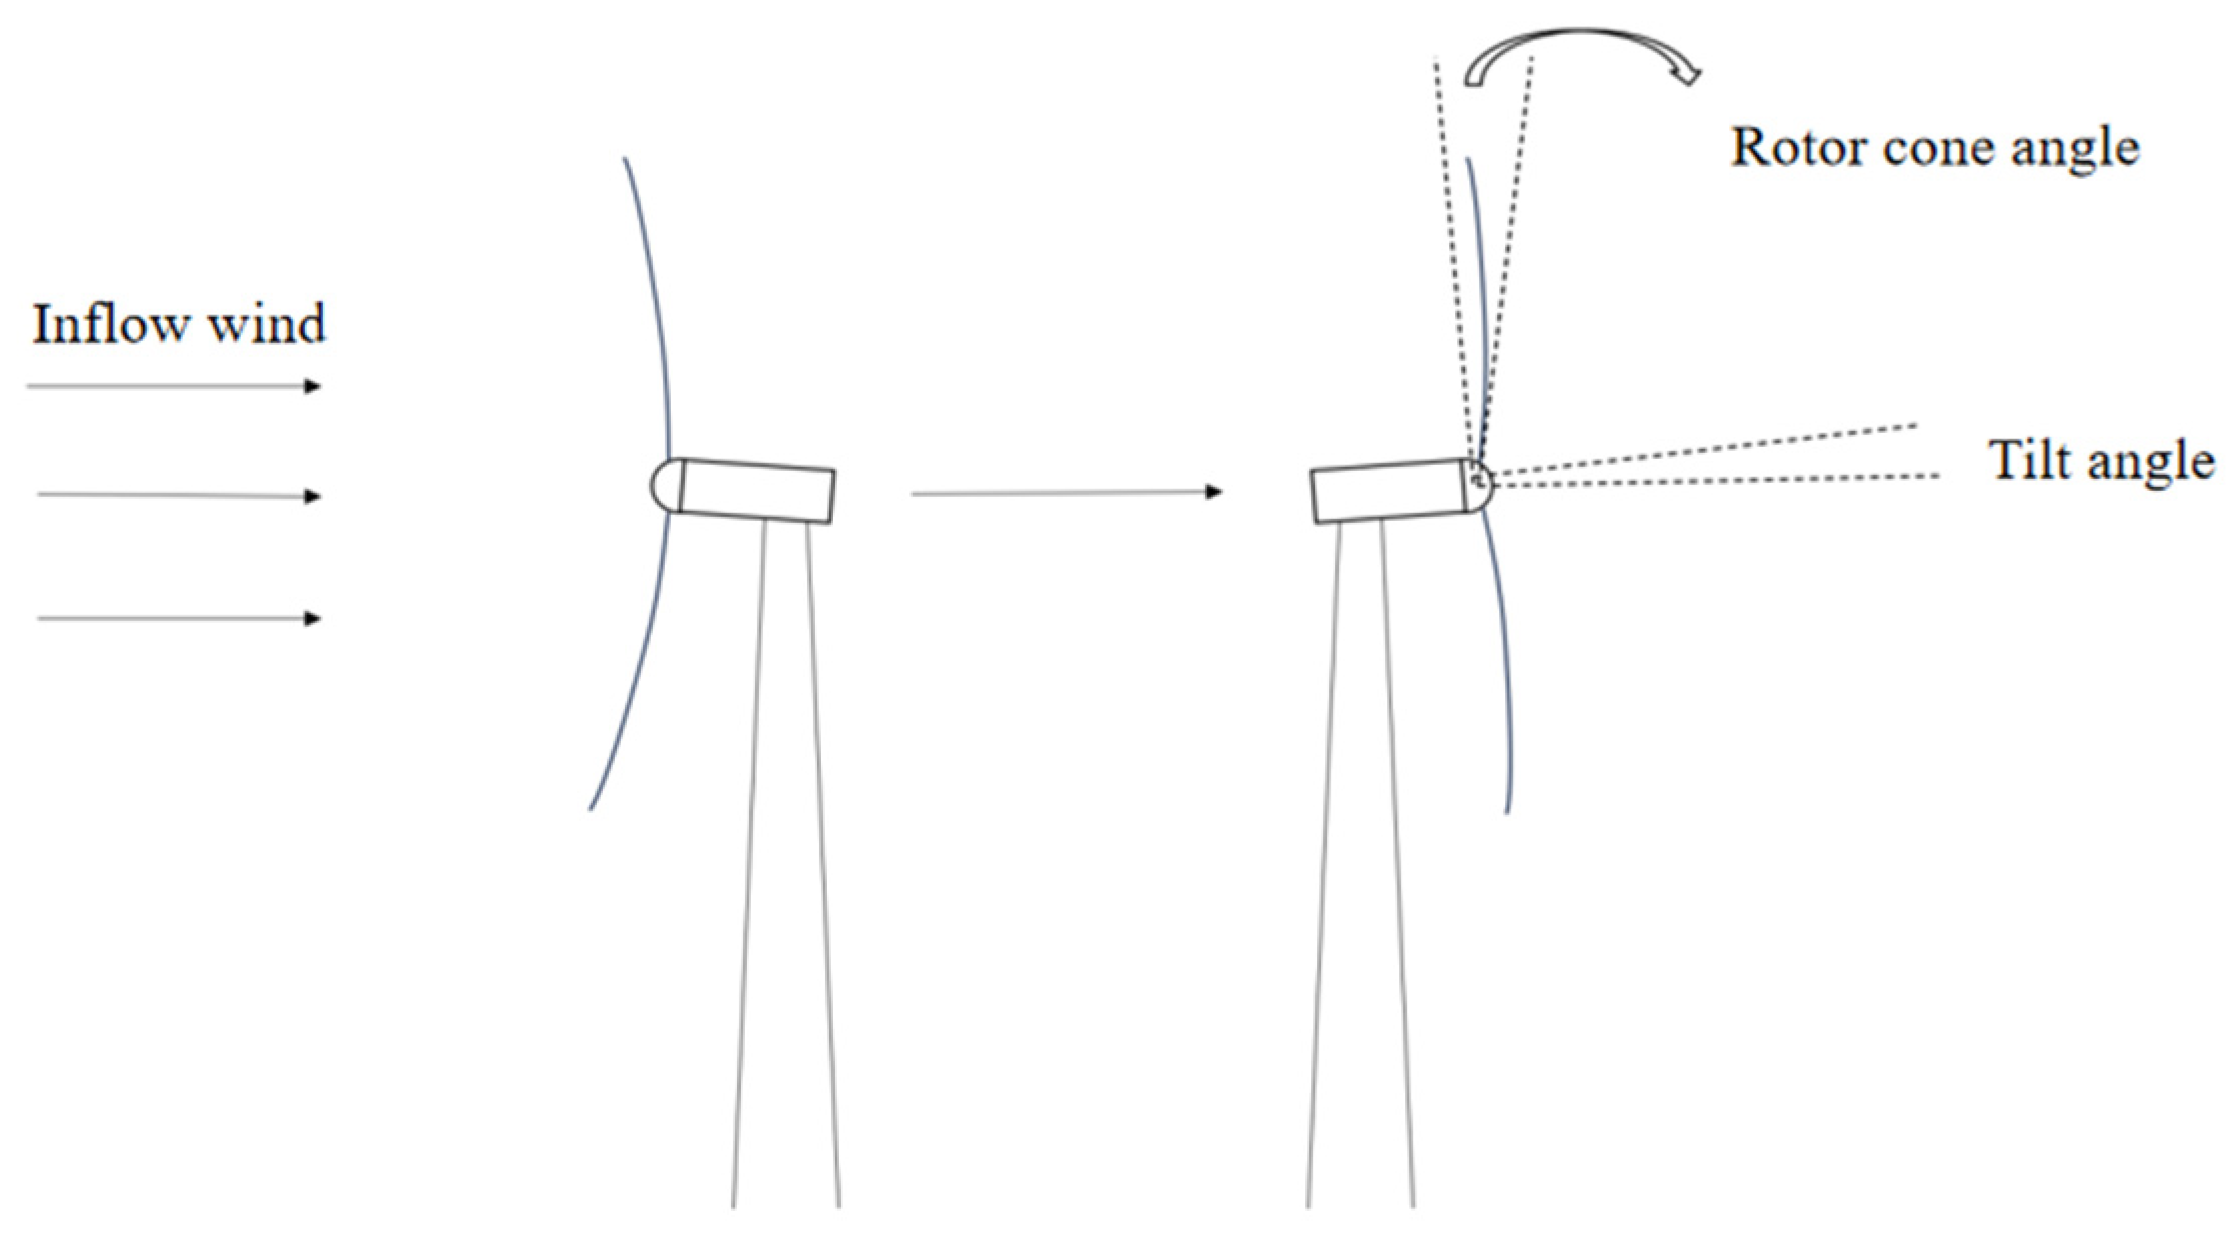
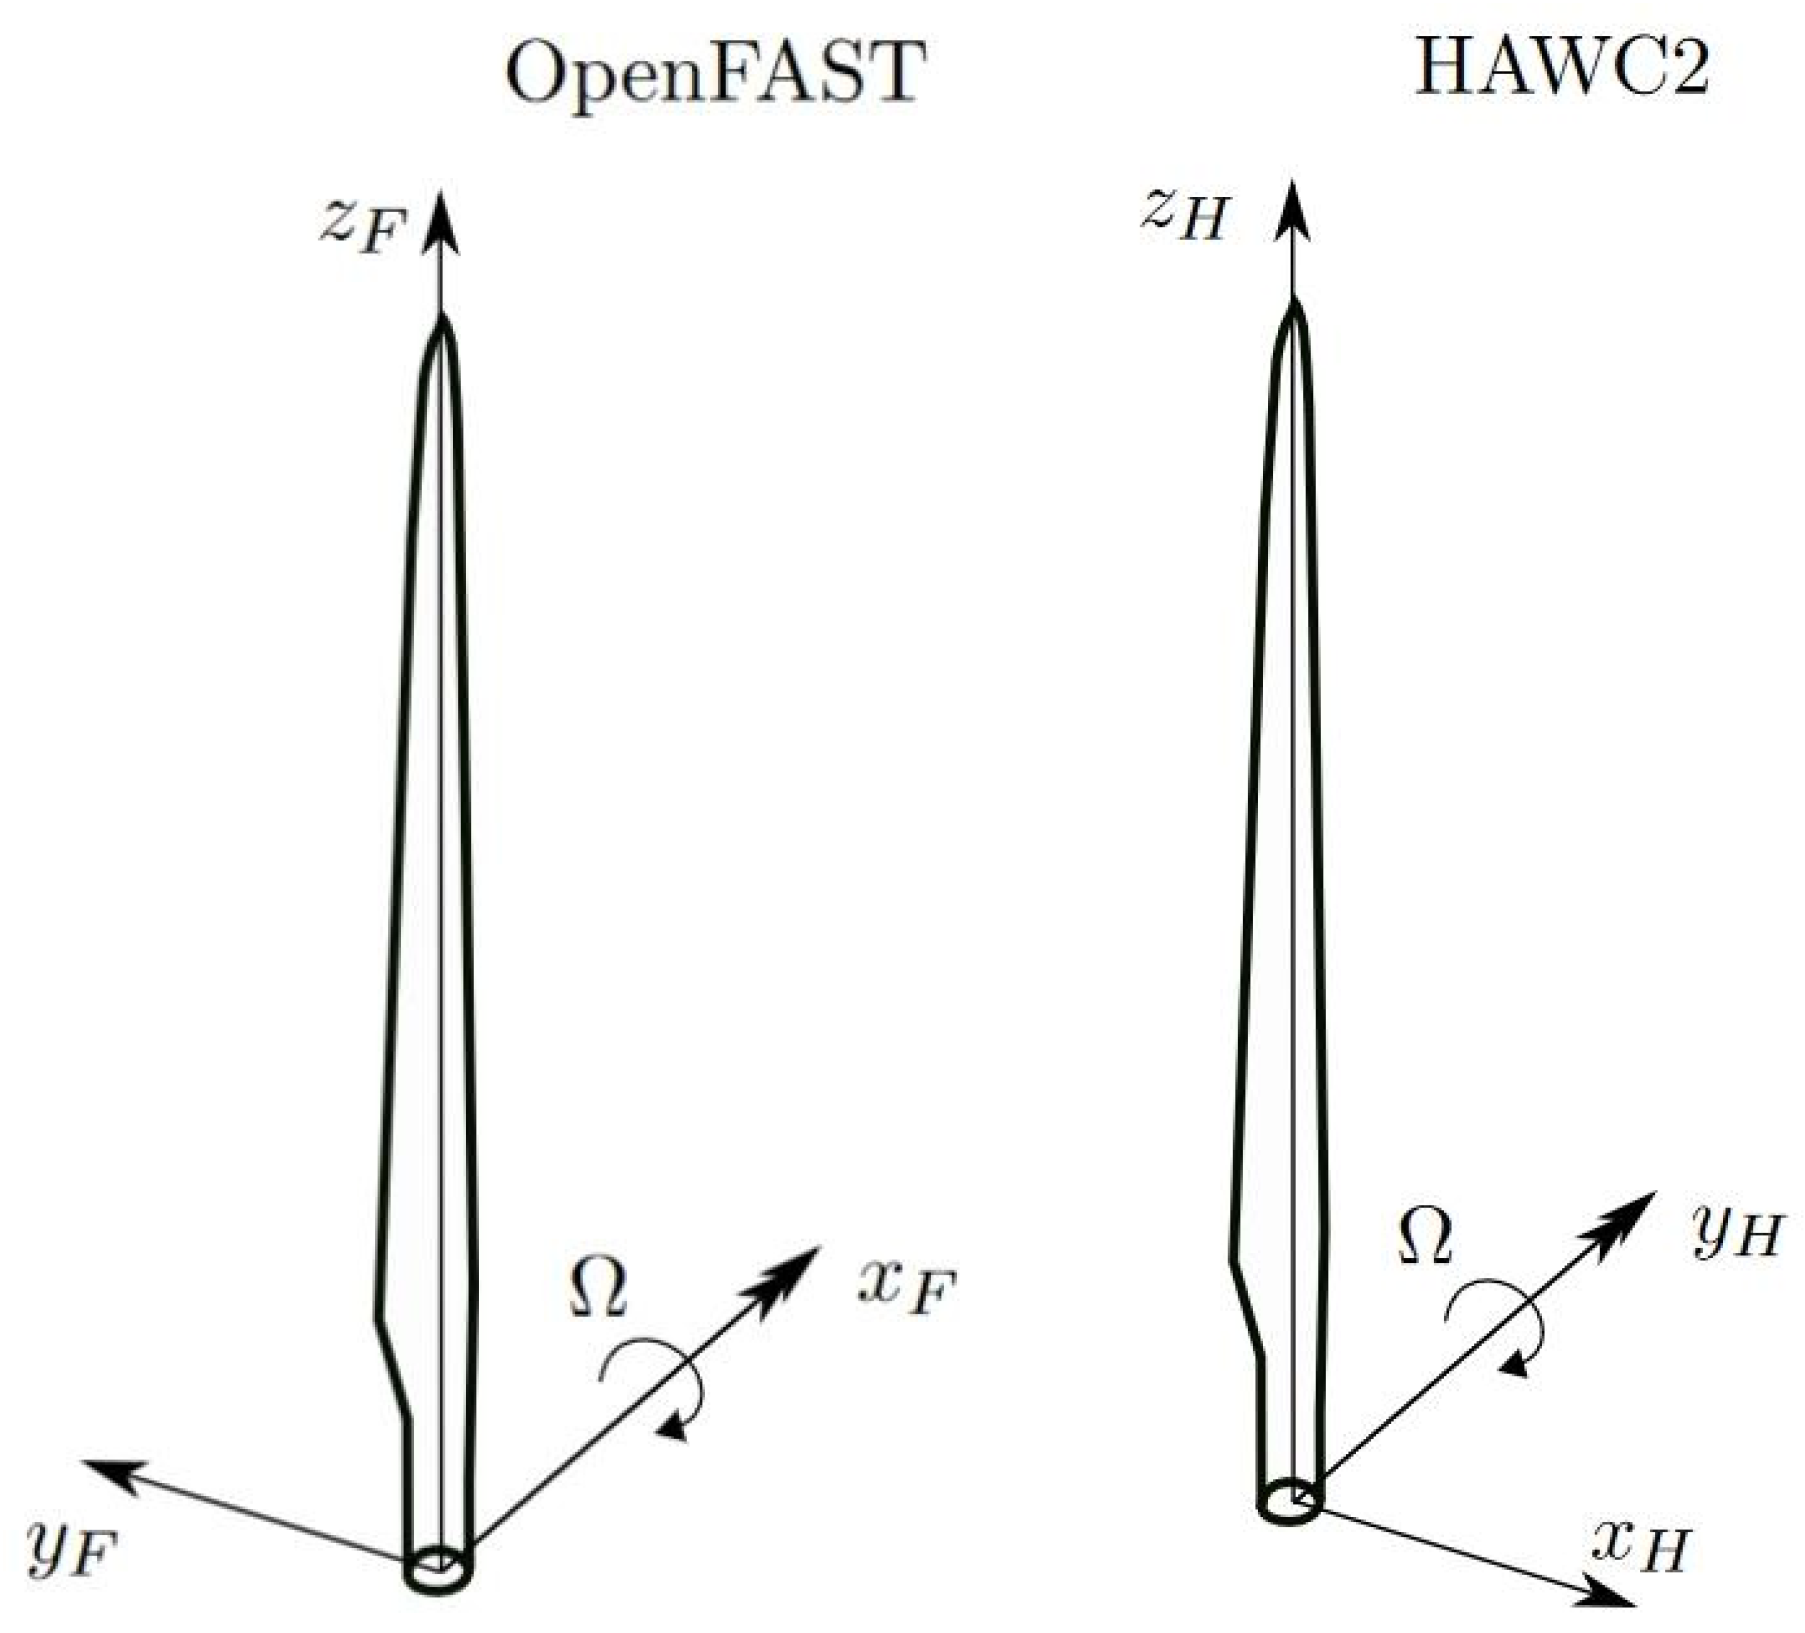
2.1. Numerical Method

In this paper, the multi-physics, multi-fidelity tool OpenFAST [14] is utilized for simulating the coupled dynamic response of wind turbines. OpenFAST is a framework that couples computational modules for aerodynamics, hydrodynamics (for offshore structures), control, and electrical system (servo) dynamics, and structural dynamics to enable coupled nonlinear aero-hydro-servo-elastic simulation in the time domain. In this paper, the aerodynamic response of the wind turbine rotor was modeled by a BEM-based (blade element momentum) aerodynamic model, AeroDyn [15]. The elastic response of the turbine was modeled by combining the modal-based ElastoDyn beam model for the tower and the GEBT-based (geometrically exact beam theory) BeamDyn model [16] for the blades. The nonlinear governing equations of motion for a geometrically exact beam are expressed as:
d h d t F = F 1 d g d t + d u ˜ d t h M + x ˜ 0 + u ˜ T F = M 1
where: h and g represent the linear momentum and angular momentum in the inertial coordinate system, respectively; F and M denote the resultant force and moment acting on the beam cross-section; F1 and M1 correspond to the distributed force and moment along the beam; u is the one-dimensional displacement of a point on the reference axis; x0 indicates the initial position vector of a point on the reference axis. The operator denotes the positional derivative along the beam axis. The notation ˜ represents the antisymmetric tensor associated with a given column array. The superscript T signifies the transpose operation.
The linearized governing equations in Equation (1) are expressed in the form of the following:
M ¯ a ¯ + G ¯ v ¯ + K ¯ q ¯ = F e l ¯ F e x t ¯
where: M ¯ is the elemental mass matrix, G is the elemental gyroscopic matrix (damping/dynamic coupling terms), K is the stiffness matrix; a , v , q are the increments of acceleration vector, velocity vector, and displacement vector, respectively; F e l is the increment of externally applied loads, F e x t is the increment of internal element forces. There are six degrees of freedom (DOFs) at each node: three displacement components and three rotation components.
OpenFAST can analyze a range of wind turbine configurations, including two-bladed or three-bladed horizontal-axis rotors, pitch-regulated or stall-regulated systems, rigid or teetering hubs, upwind or downwind rotors, and lattice or tubular towers. The wind turbine can be modeled on land or offshore on fixed-bottom or floating substructures.

2.2. Wind Turbine Model

This paper mainly uses the IEA Wind 15 MW reference wind turbine (RWT) [17,18] as the study model, which was jointly developed by the National Renewable Energy Laboratory (NREL) of the United States and the Technical University of Denmark (DTU). The main structural parameters of this wind turbine model are shown in Table 1 below. The FFA-W3 series of airfoils, with a relative thickness from 21.1% to 36%, was used for blade design. An airfoil with a relative thickness of 50% is inserted in the transition region from the blade root to the FFA-W3 airfoils. The transition from the cylindrical blade root to the 50% thickness airfoil occurs in the region between 2% and 15% of the relative blade span, with the maximum chord length being 5.77 m. The basic parameters of the wind turbine blade are listed in Table 2. The adopted internal structure (design) and material properties of the blade can be found in the official documents for the IEA 15 MW wind turbine. For more information, please refer to [17,18].
The downwind wind turbine is derived from the reference upwind wind turbine by modifying the cone angle and tilt angle, as shown in Figure 1: The rotor cone angle is changed from −4° to 4° (coned blade tips moves away from the tower), and the tilt angle is changed from −6° to 6°. In addition, the orientation settings related to the nacelle and blades have also been modified in OpenFAST. In the following text, the reference upwind wind turbine is named as Ref_up, and the reference downwind wind turbine is named as Ref_down.

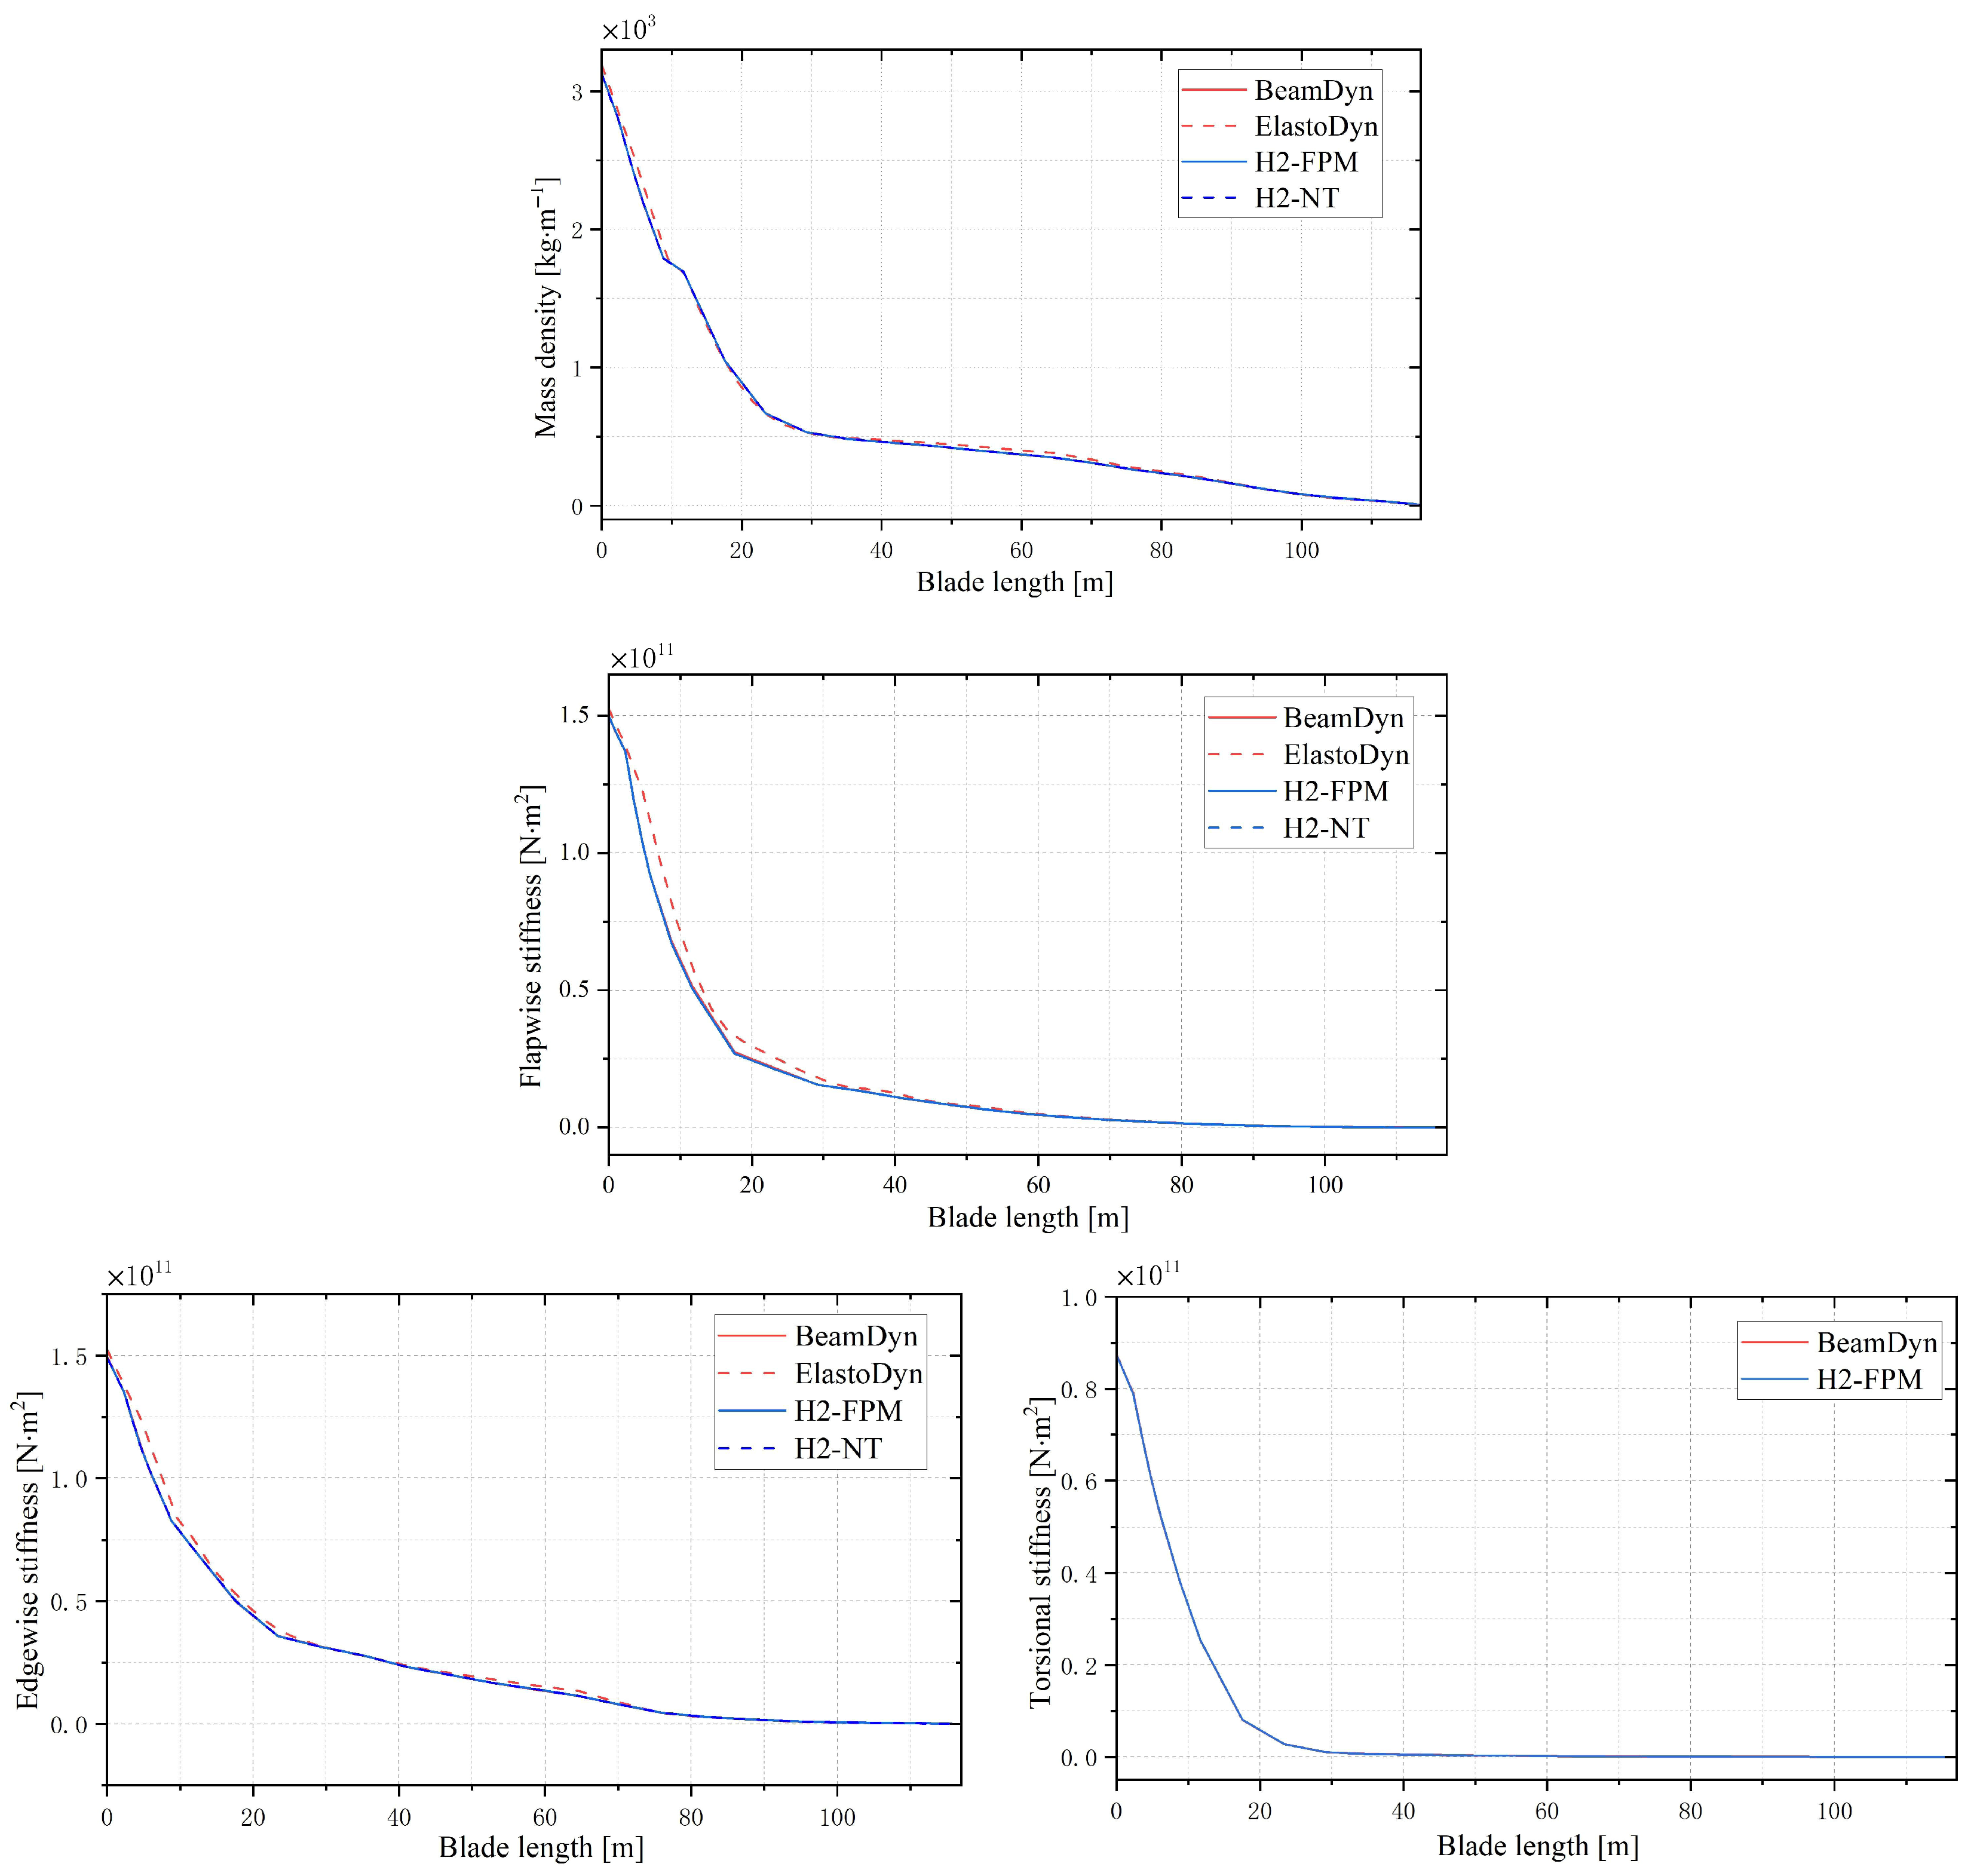
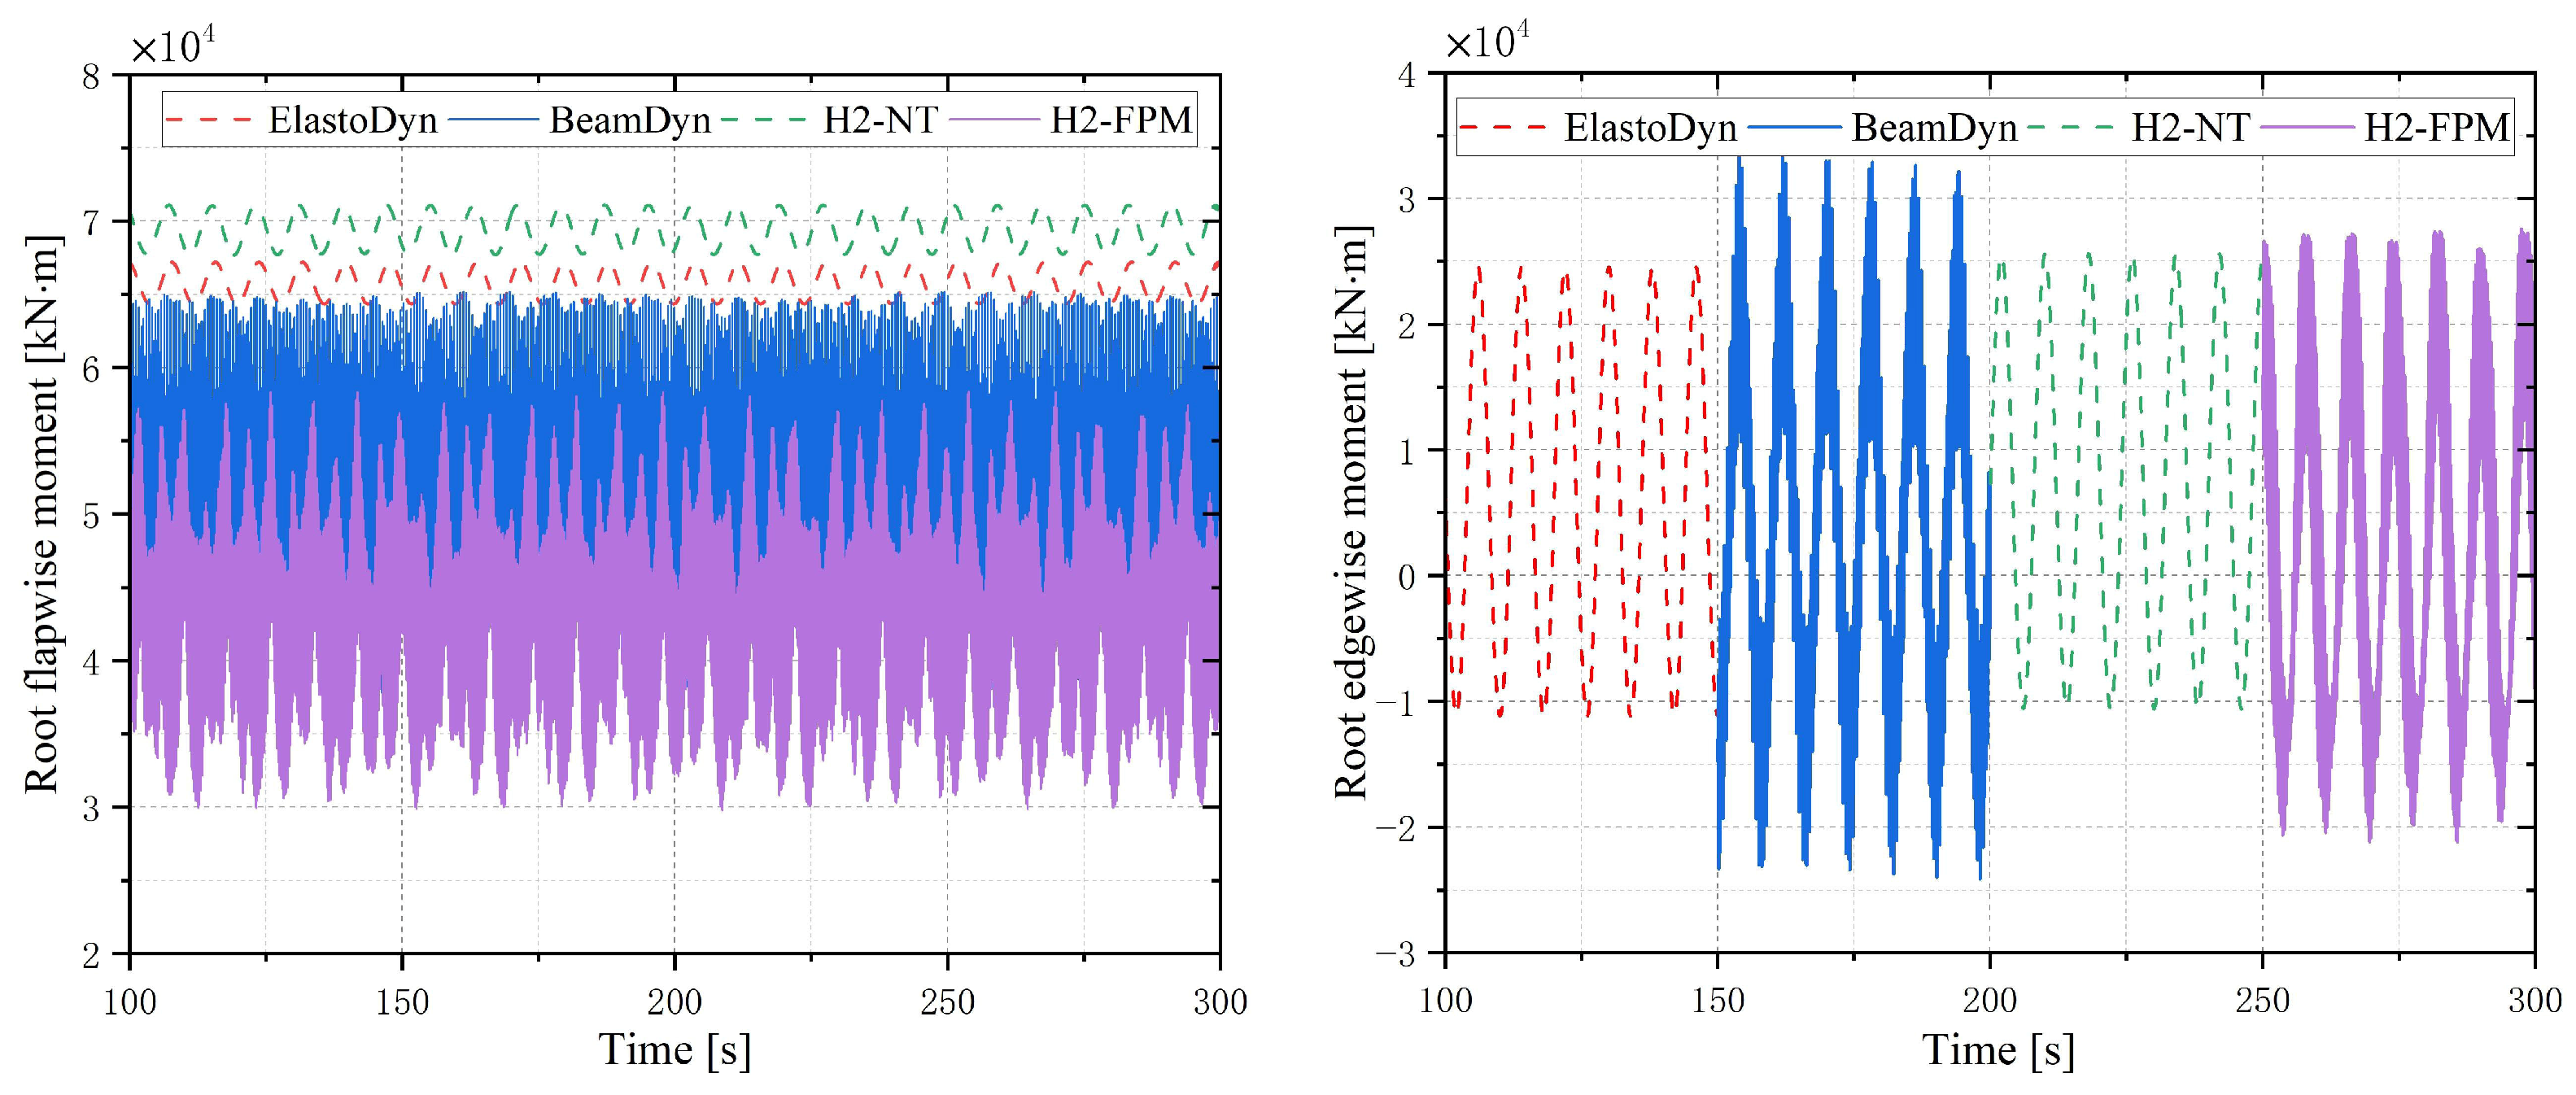
2.3. Validation of Aeroelastic Computations

As the wind turbine aeroelastic test is expensive to conduct, there is limited validation of OpenFAST against test data. Only in recent years, some references can be found [8,9,10,19]. Aerodynamic and elastic data of the tested wind turbine are not available. It is hard to validate the OpenFAST model against these published test data. Therefore, it is common to validate the aeroelastic code against other numerical methods. In this section, we will compare the aeroelastic results of the well-known IEA Wind 15 MW wind turbine obtained from OpenFAST and another well-known code, HAWC2 [20], to verify the accuracy of aeroelastic computations. To simplify calculations, hydrodynamic effects and monopile flexibility are excluded in subsequent analyses to simulate onshore wind turbine operating conditions. Furthermore, due to differences in control strategies between HAWC2 and OpenFAST, aeroelastic calculations in this section omit control models. For comparisons under identical control models, readers may refer to Jennifer Rinker’s research [20]. The IEA Wind 15 MW turbine models for both OpenFAST and HAWC2 are available on GitHub [18].
Regarding aerodynamic settings, both OpenFAST and HAWC2 employ a BEM-based method along with empirical models resembling Prandtl tip loss correction. HAWC2 utilizes Timoshenko beam theory to model blade bending and torsional deformations, though torsion can be deactivated by setting torsional stiffness to infinity. Additionally, HAWC2 supports full 6 × 6 stiffness matrix input to simulate bending–torsion coupling effects. However, discrepancies may exist in the 6 × 6 matrix construction between the two software programs due to differences in reference axes, coordinate systems, and modeling assumptions. The coordinate system comparison for blades between OpenFAST and HAWC2 is illustrated in Figure 2. For consistency, all parameters and calculation results in subsequent discussions adopt the OpenFAST coordinate system. We will use four different models to analyse the blade dynamics of the IEA 15 MW wind turbine. Two are well-known BeamDyn and ElastoDyn models in OpenFAST. The other two belong to the HAWC2 code, which are H2-FPM (model using a full 6 × 6 stiffness matrix) and H2-NT (model with torsional stiffness amplified by a factor of 107 to disable blade torsion). Figure 3 compares structural parameters of four blade models, including mass density, flapwise stiffness, edgewise stiffness, and torsional stiffness. The figure shows that all model parameters align closely except for minor discrepancies in the ElastoDyn parameters.
Transient aeroelastic simulations were conducted at a wind speed of 10.87 m/s (no wind shear), where the turbine reaches its rated power. The blade pitch angle was set to 0°, with a fixed rotor speed of 7.5 rpm. The tower was modeled as rigid, and tower shadow effects, tip loss, and hub loss were neglected. Comparisons of the calculated time-varying root bending moments are shown in Figure 4. It is found that the BeamDyn model (used in the rest of this paper) and H2-FPM have similar predictions. However, the lower-accuracy and modal-based ElastoDyn model of OpenFAST performs like the H2-NT model, as they both neglect blade torsion. It is clear that they have a small vibration amplitude compared to BeamDyn and H2-FPM. This suggests limitations of ElastoDyn and H2-NT for predicting equivalent fatigue loads on the blades. Therefore, the BeamDyn model is chosen to simulate the blade dynamics in OpenFAST for the rest of this paper.

3. Results and Discussion

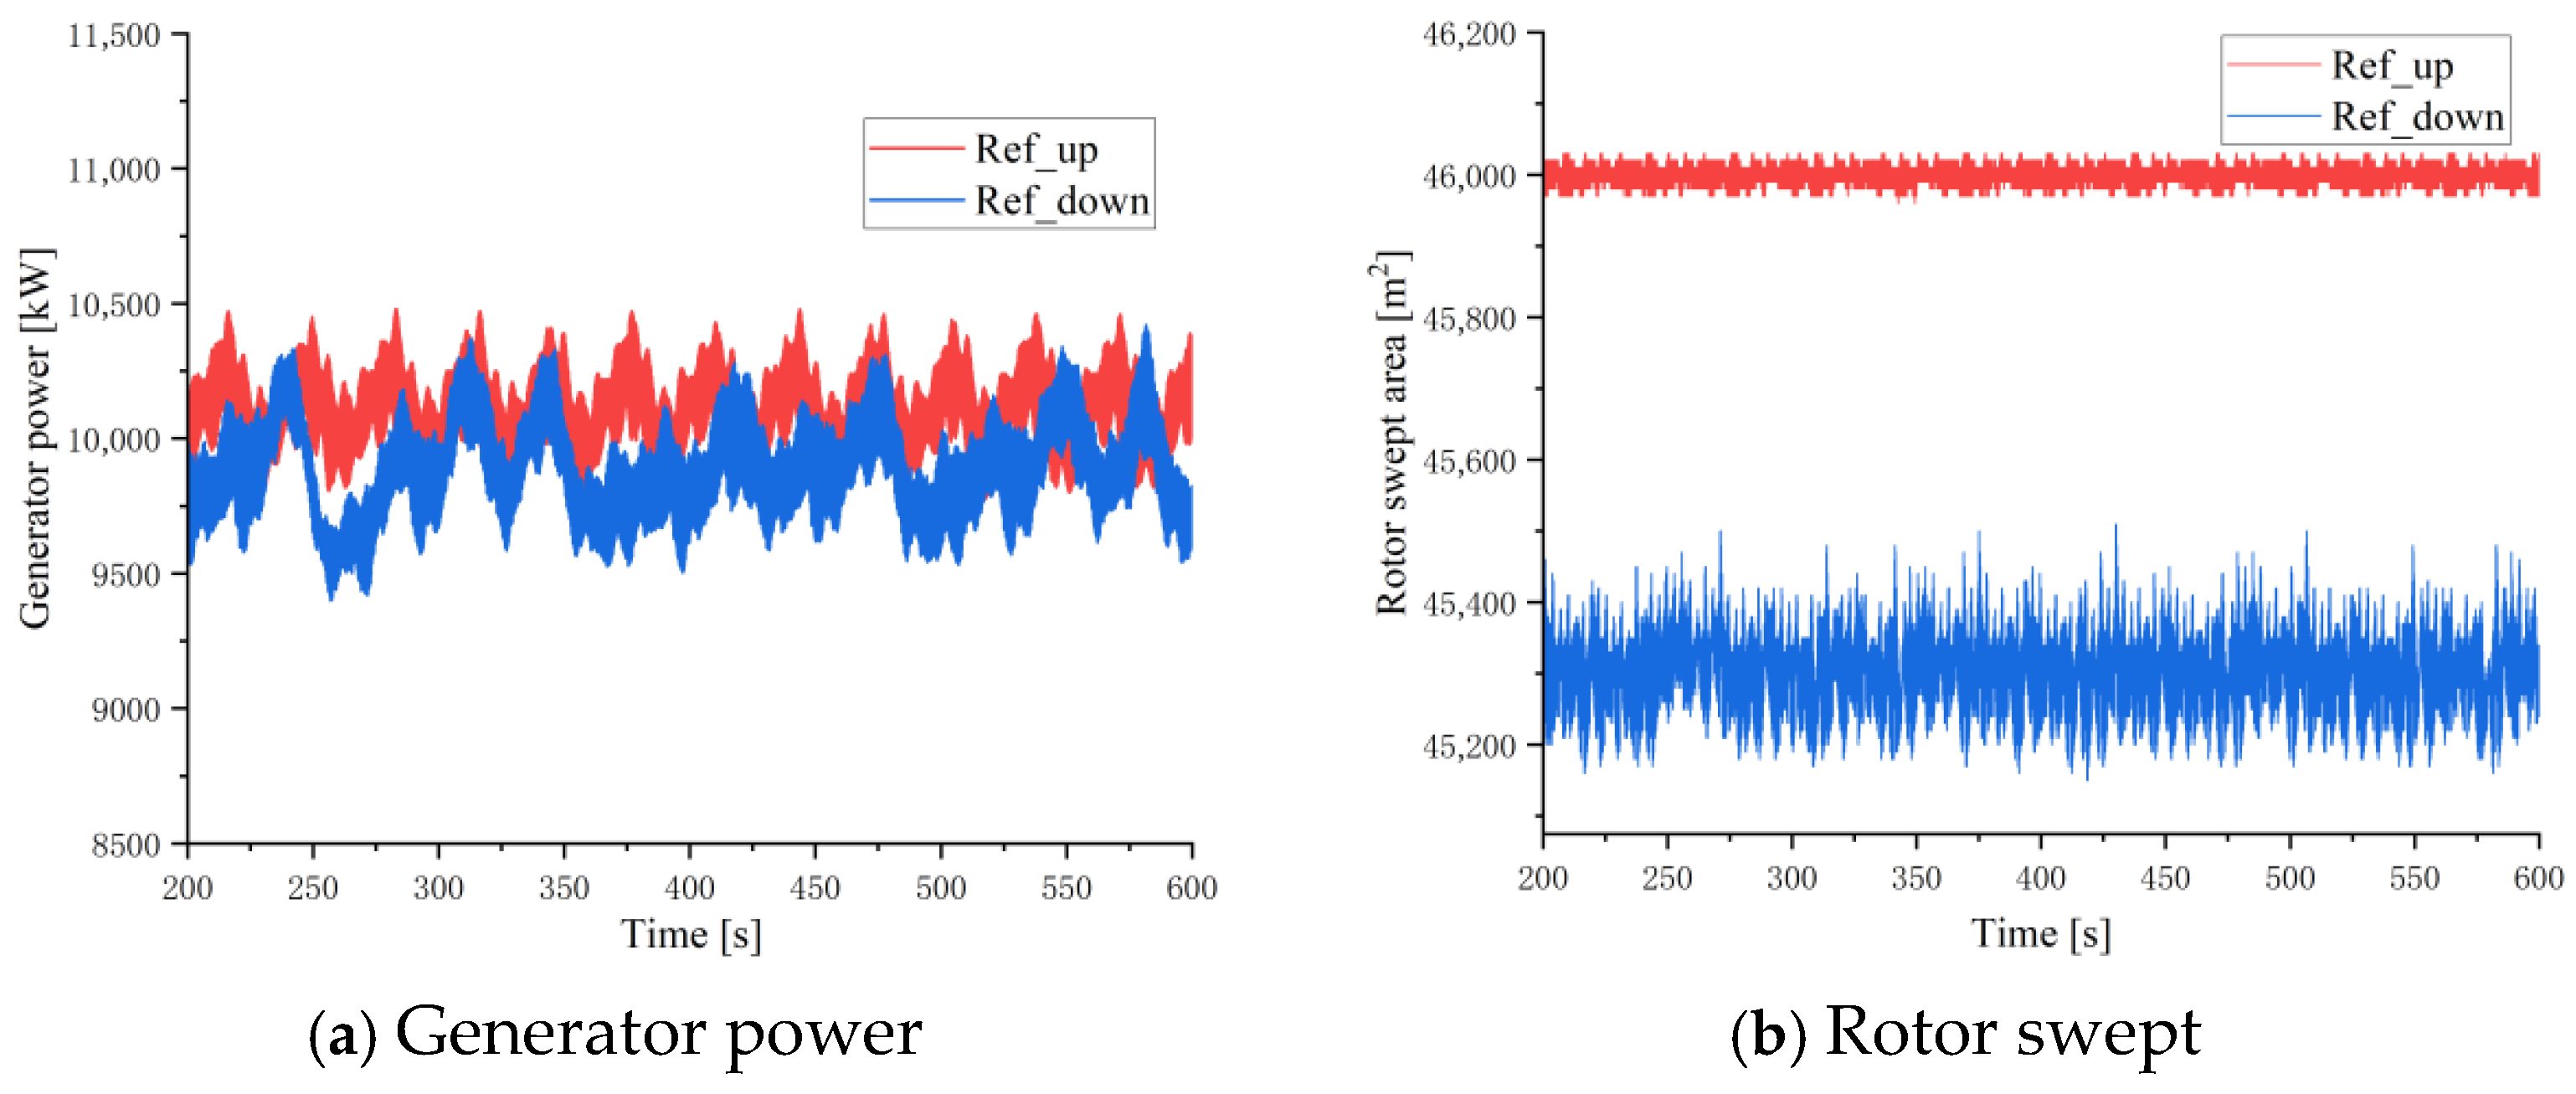
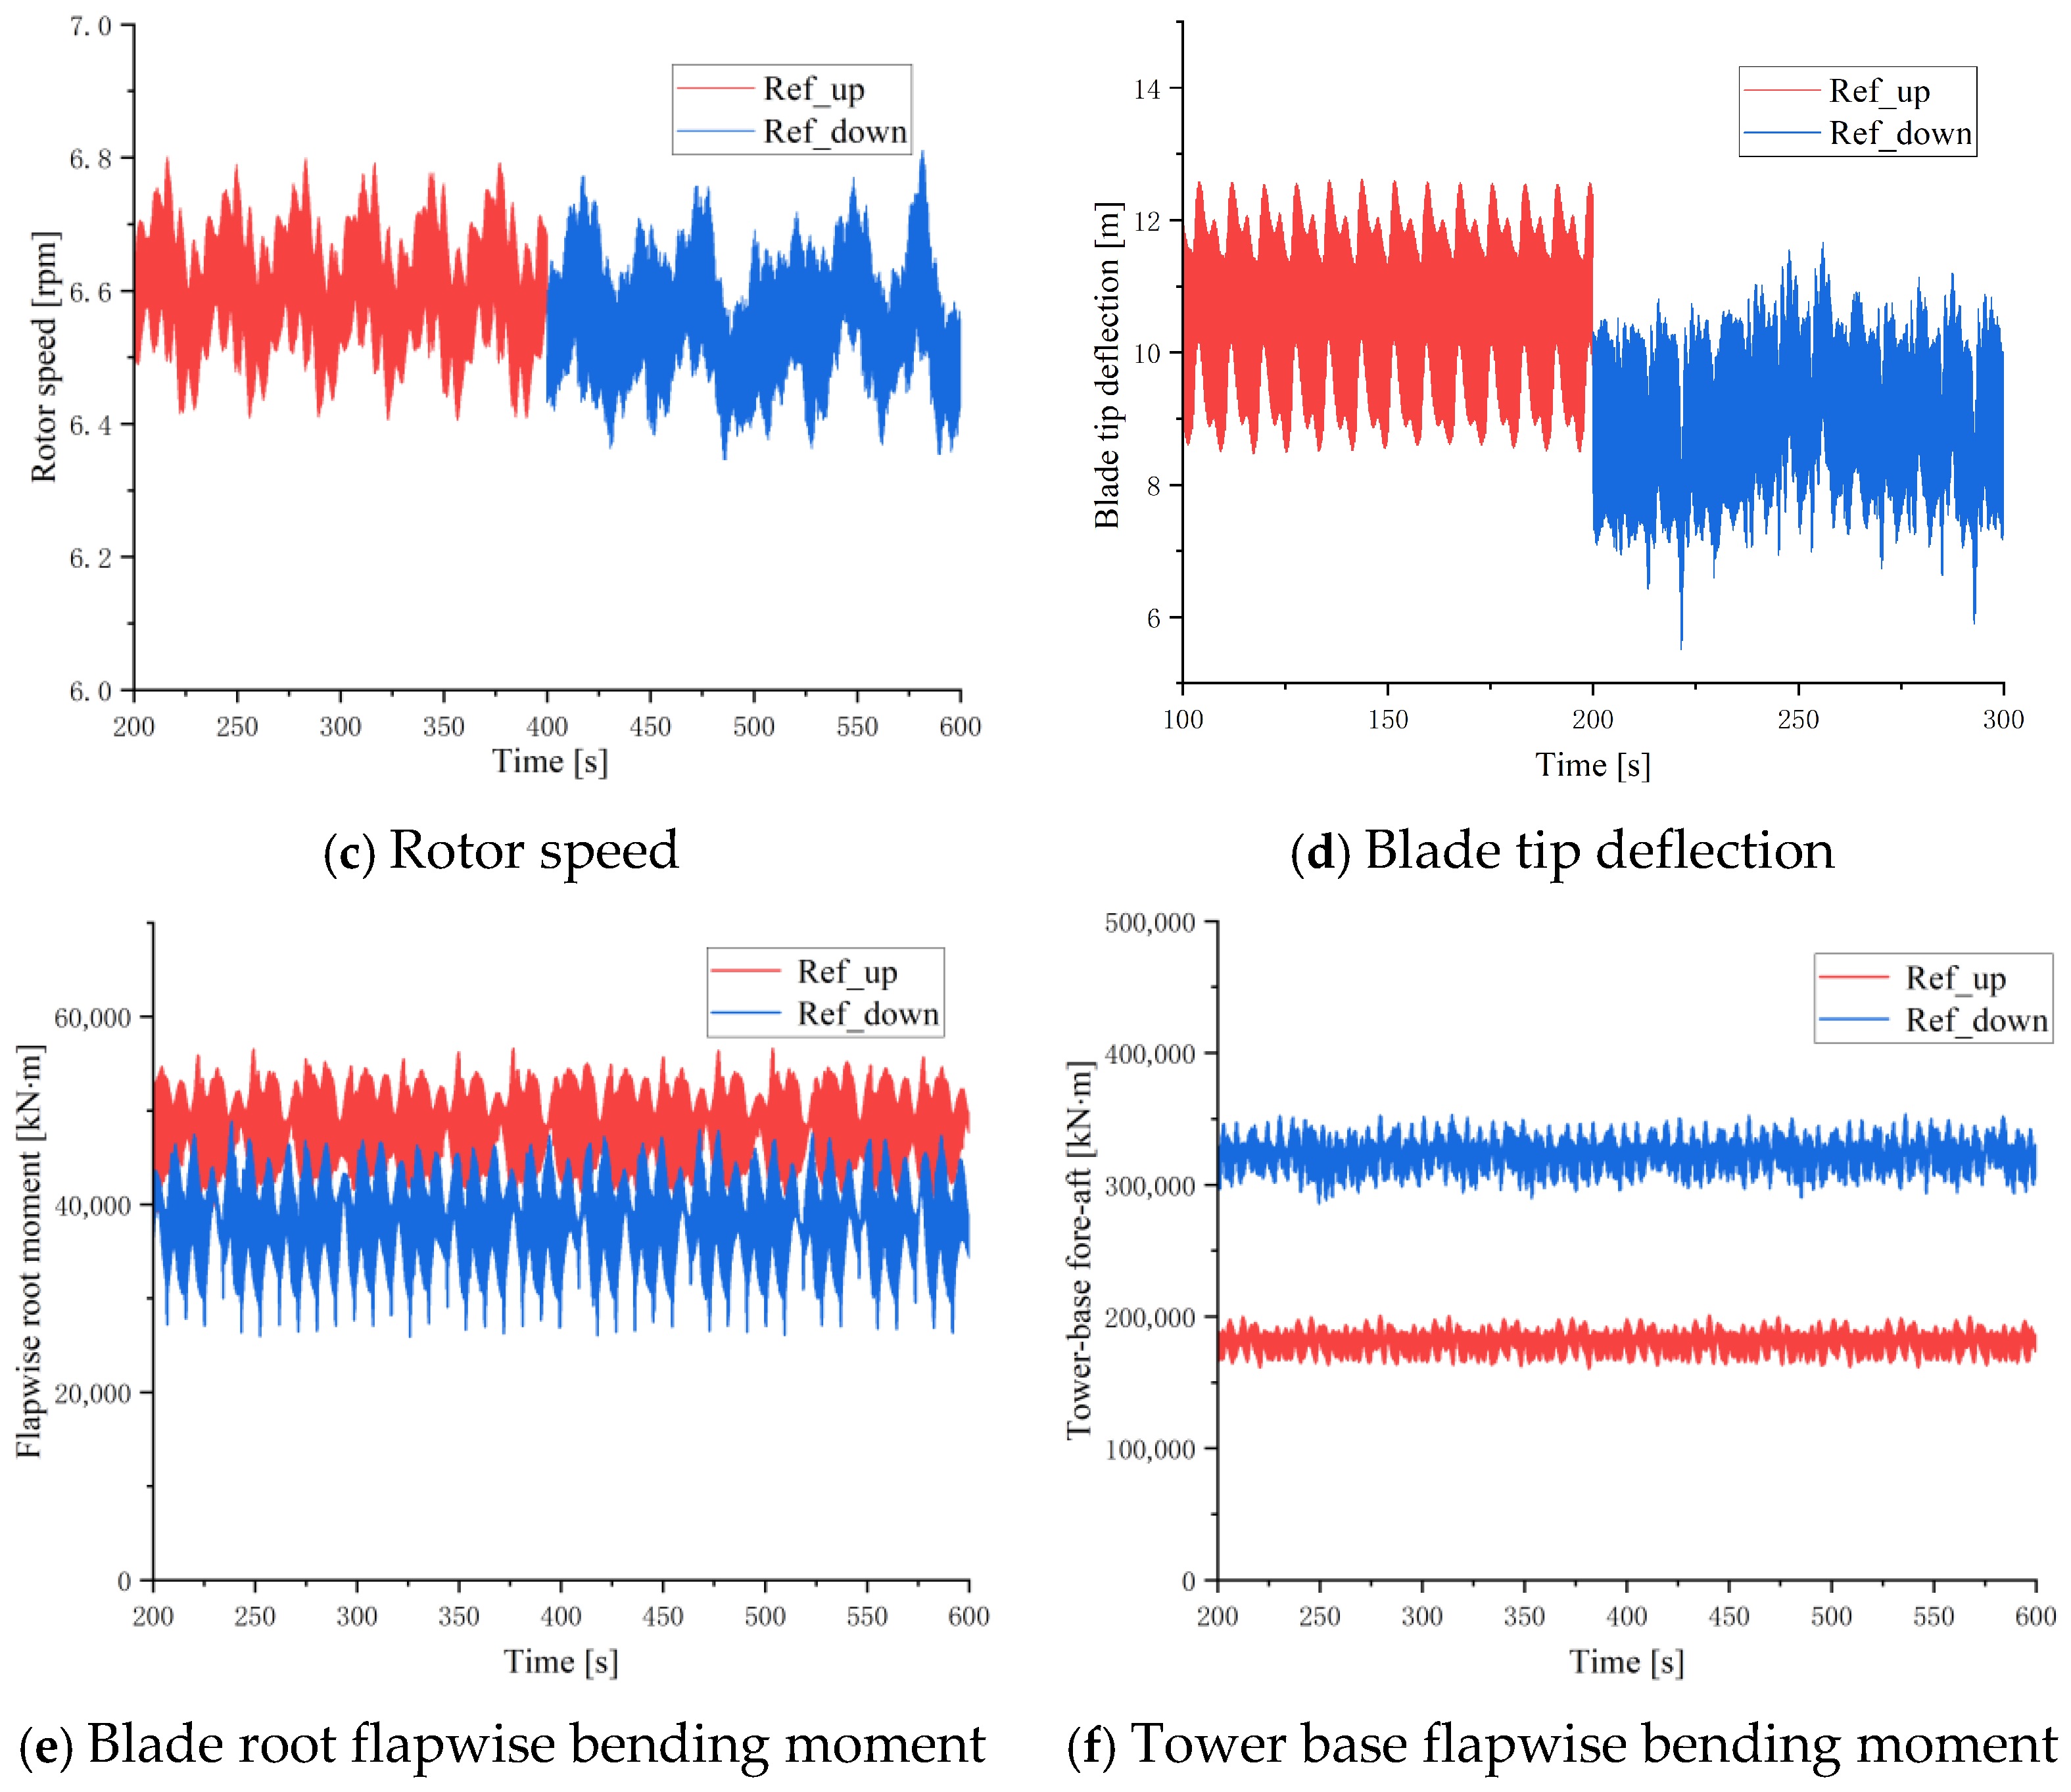
3.1. Comparison of Aeroelastic Characteristics of Upwind and Downwind Wind Turbines Under Steady Wind Conditions

3.1.1. Wind Speed of 10 m/s

Aeroelastic simulations of the Ref_up and Ref_down were conducted for 600 s under a steady wind speed of 10 m/s, with an initial rotor speed of 7.55 rpm. It should be stated that wind shear is not considered in Section 3.1. From Figure 5a, it can be observed that the output power of Ref_down decreased by approximately 2% as compared with Ref_up. The power output fluctuation range of Ref_up is around ±3%, while that of Ref_down is about ±4%. Reference [21] stated that wind shear and tower shadow are two interconnected factors that influence power output. The tower shadow effect, on the other hand, introduces periodic fluctuations in wind speed as the blades pass behind the tower, which are more significant than those caused by wind shear alone. As no wind shear is considered here, the main reason for the increased fluctuation is the tower shadow effect. When the blades of Ref_down pass through the tower wake region, the wind speed drops rapidly, which leads to the rapid changes in blade angle of attack, thereby affecting the amplitude of power output fluctuations. Similarly, as shown in Figure 5b, the rotor area of Ref_up is relatively stable, while that of Ref_down fluctuates more significantly (approximately ±0.4%). As compared to Ref_up, the rotor area of Ref_down is reduced by about 0.65%, which is also one of the reasons for the power drop in the downwind wind turbine. However, since Ref_down blades also feature a forward pre-bend design and the mass/stiffness parameters of the blades have not been changed, the overall variation in rotor area is relatively small. Shown in Figure 5c, the average rotor speed of Ref_down is 6.54 rpm, while that of Ref_up is 6.6 rpm, with a difference of about 1%. Ref_down has rotor speed fluctuations around ±4%, which is at the same level as its power output fluctuations. The tip displacement of Ref_down blades is smaller, as shown in Figure 5d, but the fluctuation range is larger, reaching about 17%. It should be noted that the displacement of the Ref_down blade makes the blade tip away from the tower. The flapwise bending moment at the blade root of Ref_down is lower than that of Ref_up, as shown in Figure 5e. The reduction reaches about 20.3%, which shows a great potential of Ref_down to reduce the blade mass.
Figure 5f shows the comparison of the flapwise bending moments at the tower base of the two types of wind turbines. The flapwise bending moment at the tower base of Ref_down is significantly higher than that of Ref_up, about 78% higher. This is mainly due to the change in the center of mass position of the rotor-nacelle assembly. For Ref_up, the center of mass of the rotor-nacelle is located in front of the tower. During operation, the thrust moment caused by the rotor normal thrust and the overturning moment caused by gravity are in opposite directions, keeping the combined bending moment at the tower base at a relatively low level. However, due to the change in the center of mass position, the thrust moment and overturning moment at the tower base of Ref_down are in the same direction, thereby exacerbating the extreme loads at the tower base. Additionally, it can be inferred from Figure 5 that under the same wind speed, the extreme loads experienced by Ref_up are greater than those of Ref_down, but the fatigue loads may be smaller. Table 3 provides the average values of various aeroelastic performance parameters for the two wind turbines.

3.1.2. Wind Speed of 15 m/s

Simulation results under wind speed 15 m/s are shown in Figure 6 and Table 4. The trends in power generation, rotor area, tip displacement, and blade root flapwise moment for both wind turbines are similar to those observed under a wind speed of 10 m/s. Here, both types of wind turbines reach their rated power, but the power fluctuation of Ref_down remains relatively high, around 3.1%. Similar to 10 m/s, the rotor area of Ref_down is approximately 1% lower than Ref_up. The average rotor speed for both wind turbines is 7.55 rpm, which is consistent with the rated rotor speed. The flapwise bending moment at the blade root of Ref_down is still lower than that of Ref_up, by about 25%. And the flapwise bending moment at the tower base of Ref_down is still approximately 67% higher.

3.2. Comparison of Ultimate and Fatigue Load Characteristics of the Upwind and Downwind Wind Turbines

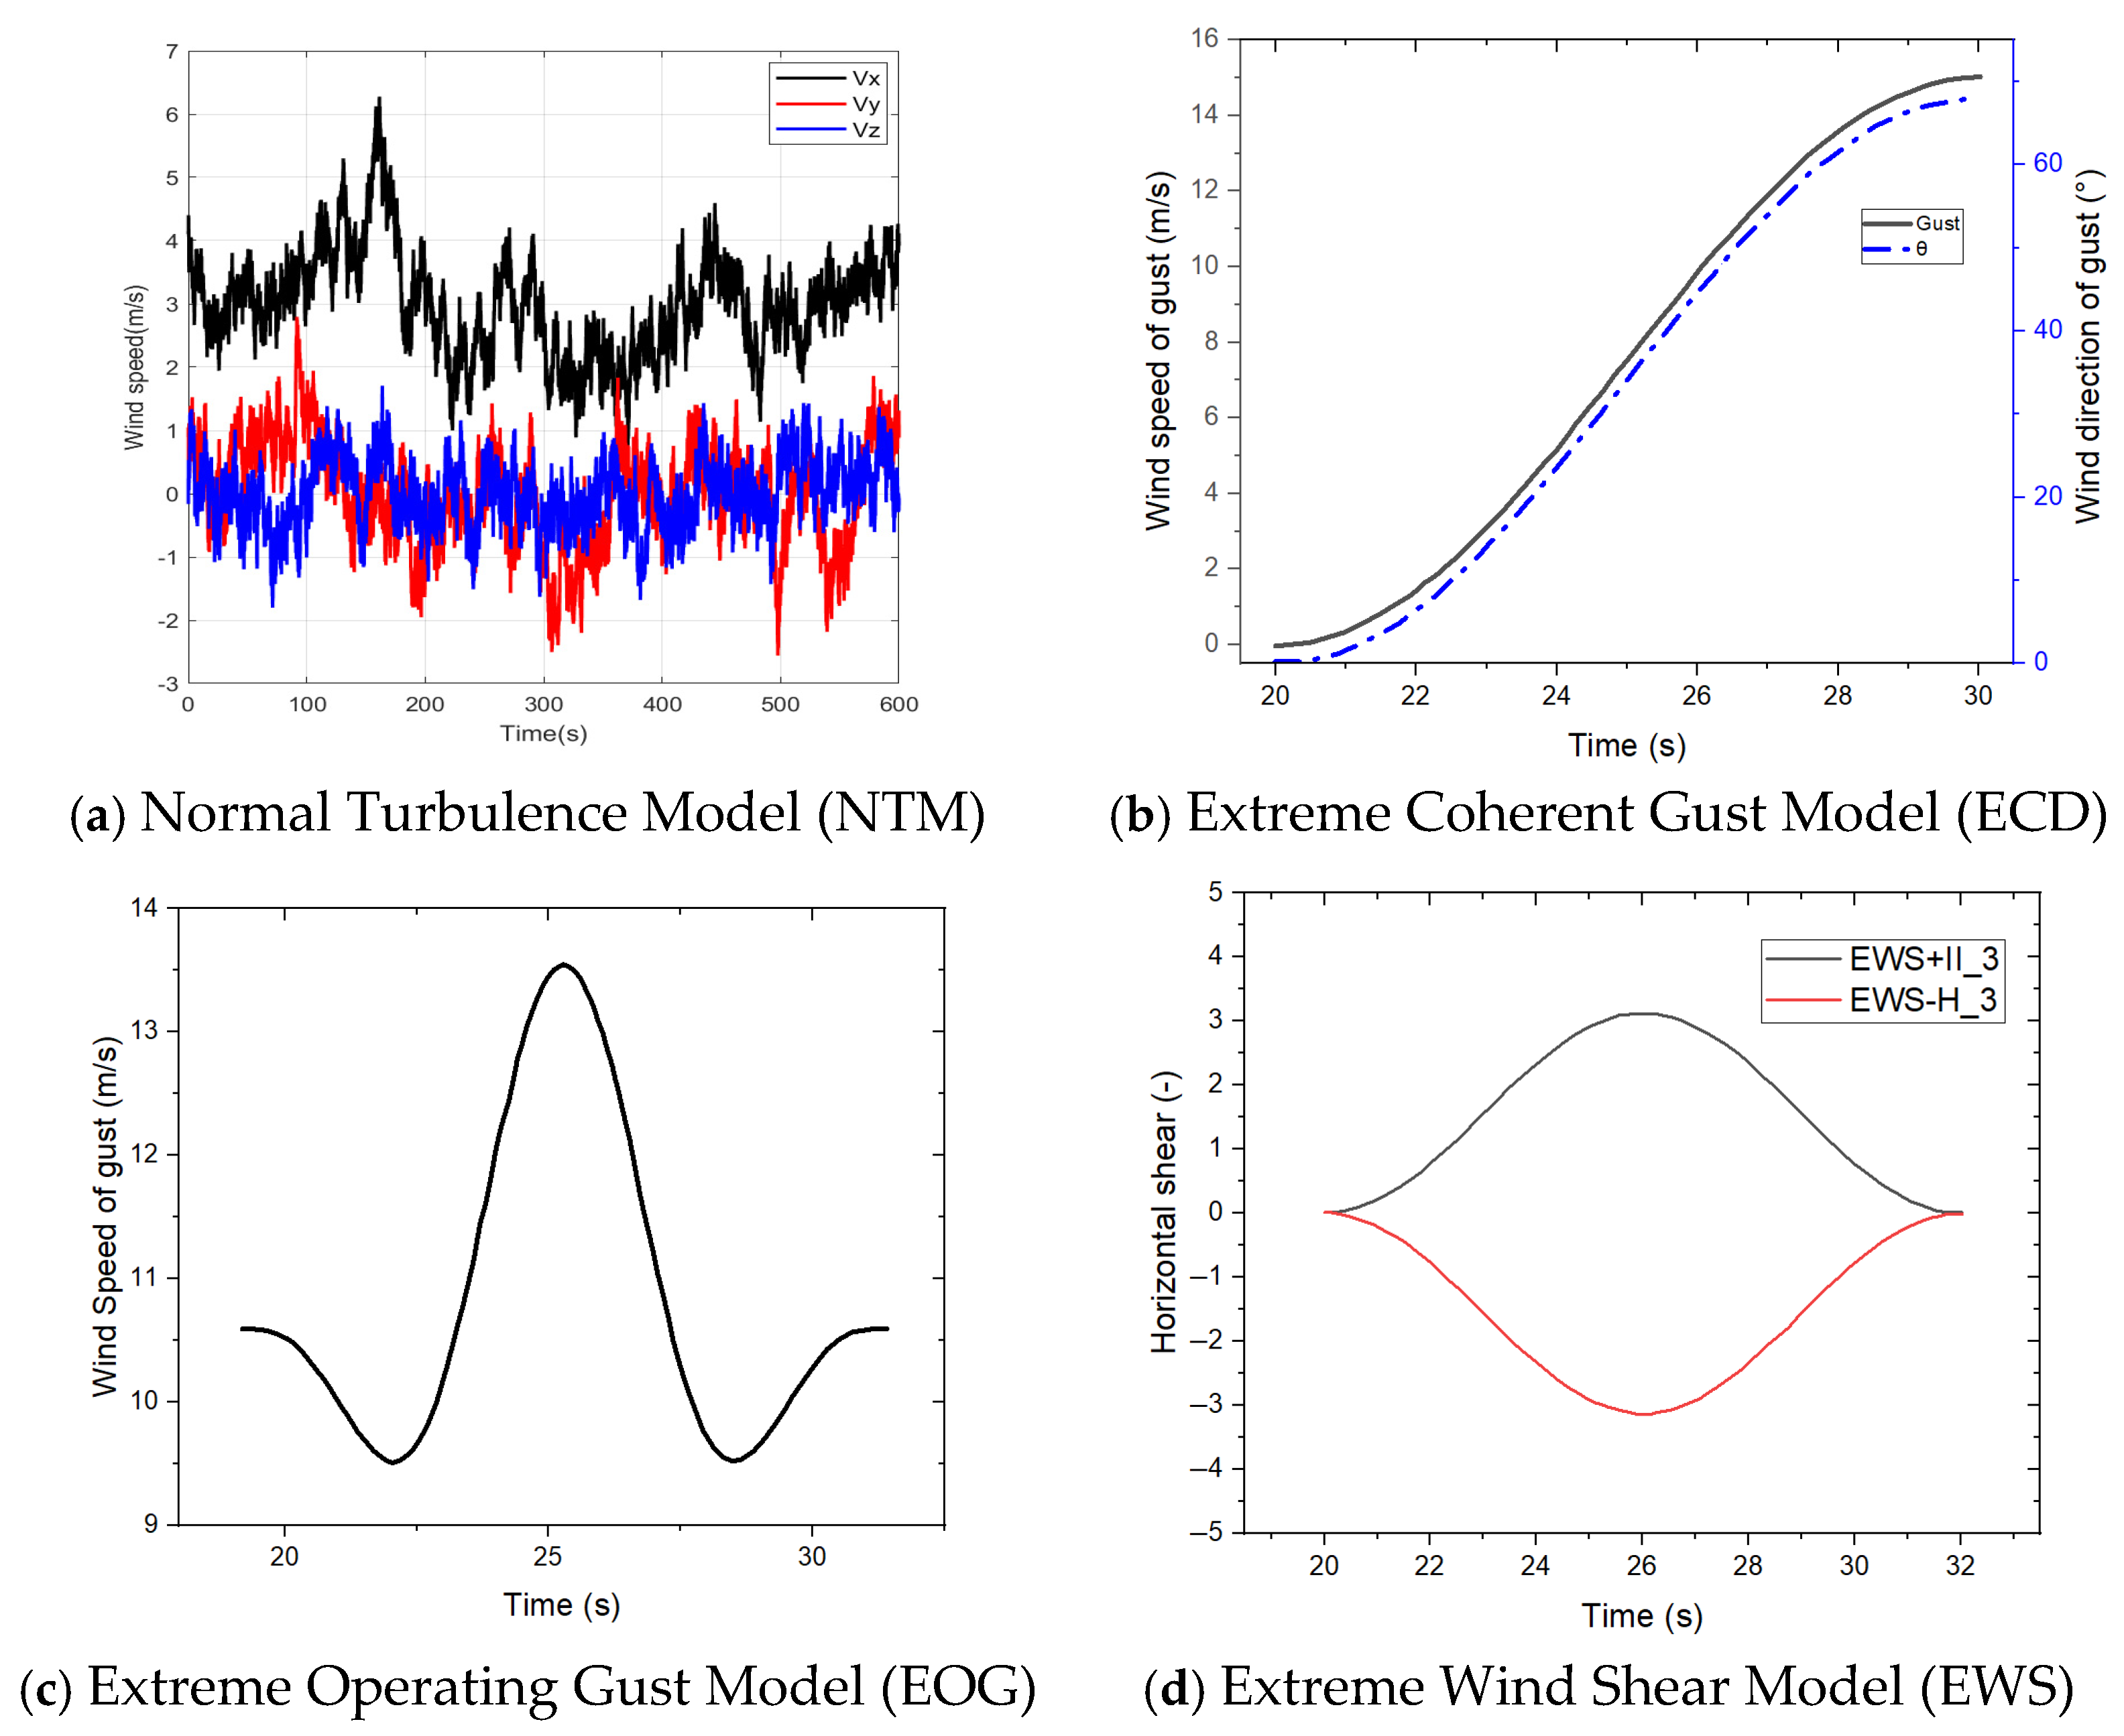
3.2.1. Simulation Conditions and Load Analysis Methods

Referring to the design load cases (DLC) for wind turbines specified in the IEC 61400-3 standard [22], a total of 66 simulation conditions were selected for calculation, as shown in Table 5. In terms of equivalent fatigue load analysis, the Normal Turbulence Model (NTM) with average wind speeds of 3, 5, 7, …, 25 m/s was selected for calculations. The wind field files were generated by the Turbsim software TurbSim_v2.00 [23] on a grid size of 54 × 30, with a grid height of 270 m and a width of 250 m. The simulation duration for each condition was 600 s. To obtain the equivalent fatigue loads on the blades, the time-series data obtained from the analysis simulations must be converted into cycle-count matrices. The rainflow counting algorithm is utilized here, which is commonly used in the wind energy industry. The equivalent fatigue loads are calculated for a 20-year life cycle with the Weibull distribution parameters k = 2.4694 and c = 9.4925.
In terms of ultimate load calculations, several representative extreme wind conditions were selected for analysis. These include the extreme coherent gust with direction change (ECD), extreme wind shear (EWS), and extreme operating gust (EOG). For the extreme coherent gust and extreme operating gust, simulations were conducted based on three wind speeds at hub height: the rated wind speed, and wind speeds 2 m/s above and below the rated wind speed. For the extreme wind shear condition, multiple wind speeds between the cut-in and cut-out speeds were used for simulations, with each wind speed considering both positive and negative horizontal and vertical wind shear, totalling 48 cases. The extreme wind conditions were generated using the IECWind [24]. Figure 7 illustrates the four DLC conditions described above. Figure 7a shows the NTM with an average wind speed of 3 m/s at hub height; Figure 7b depicts the changes in wind speed and wind direction angle at hub height over time under ECD; Figure 7c shows the variation in average wind speed at hub height over time under the EOG; and Figure 7d illustrates the changes in horizontal positive and negative wind shear over time under EWS. The ultimate load analysis will be conducted hereafter, which determines the magnitude and timing of ultimate loads by calculating the extreme values from one or more time-series files.

3.2.2. Fatigue Load Analysis

The fatigue load analysis will be conducted for Ref_up and Ref_down under turbulent wind conditions. The calculation conditions are the DLC1.2 power generation conditions introduced earlier, with a total of 12 cases, each with a simulation duration of 600 s. By simulating the operation of the upwind and downwind wind turbines under these conditions and calculating the equivalent fatigue loads at the blade roots, the results shown in Table 6 and Table 7 were obtained. Nomenclature of forces, which will be frequently used below, is listed in Table 8. RootFx represents the equivalent value of the flapwise shear force at the blade root, RootFy indicates the equivalent value of the edgewise shear force at the blade root, RootMx represents the equivalent value of the edgewise bending moment at the blade root, and RootMy represents the equivalent value of the flapwise bending moment at the blade root. The fatigue life curve, often referred to as the S-N curve, is an important tool in materials science and engineering mechanics for describing the fatigue behaviour of materials under cyclic loading. It reflects the number of cycles required for fatigue damage to occur at different stress levels. The constant m is a key parameter in fatigue life modelling and directly reflects the sensitivity of the material to cyclic stress. Typically, m is taken as 10 for blade fatigue load analysis, 4 for tower fatigue load analysis, and generally 7 or 8 for other components.
The equivalent fatigue loads at the blade roots are compared in Figure 8. In terms of fatigue shear forces at the blade root, Ref_down experiences higher equivalent flapwise (RootFx) and edgewise (RootFy) shear forces compared to Ref_up. Specifically, the equivalent flapwise shear force and edgewise shear force of Ref_down are approximately 13.21% and 4.38% higher than Ref_up, respectively. However, in terms of equivalent fatigue bending moments, Ref_down experiences 2.41% lower equivalent flapwise (RootMy) and 2.63% lower edgewise (RootMx) bending moments compared to Ref_up.

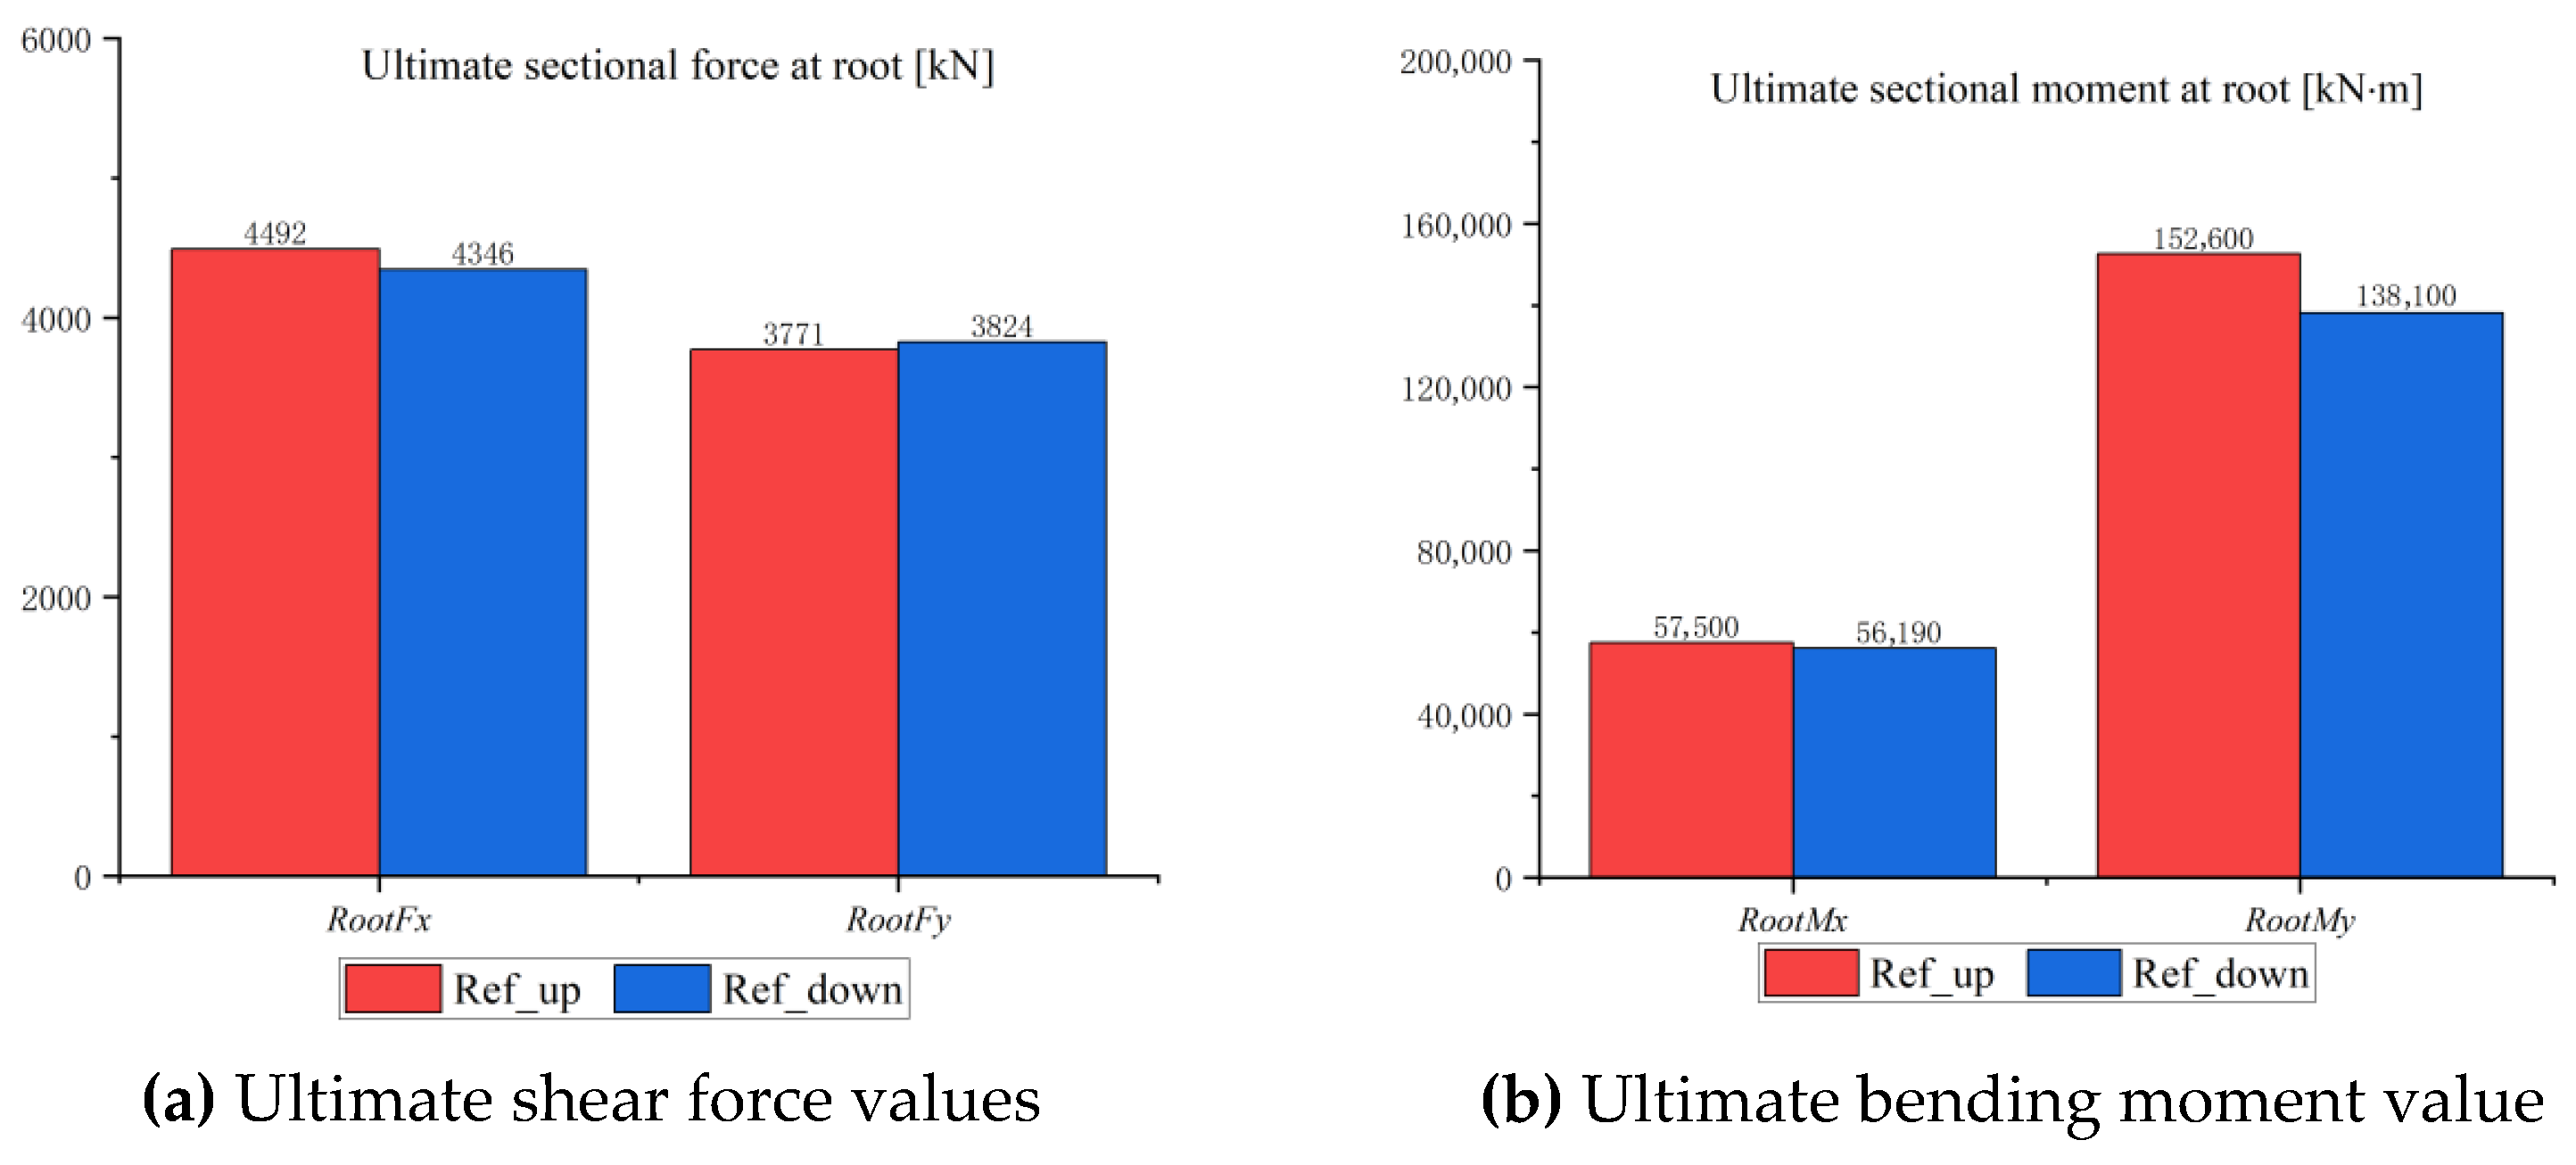
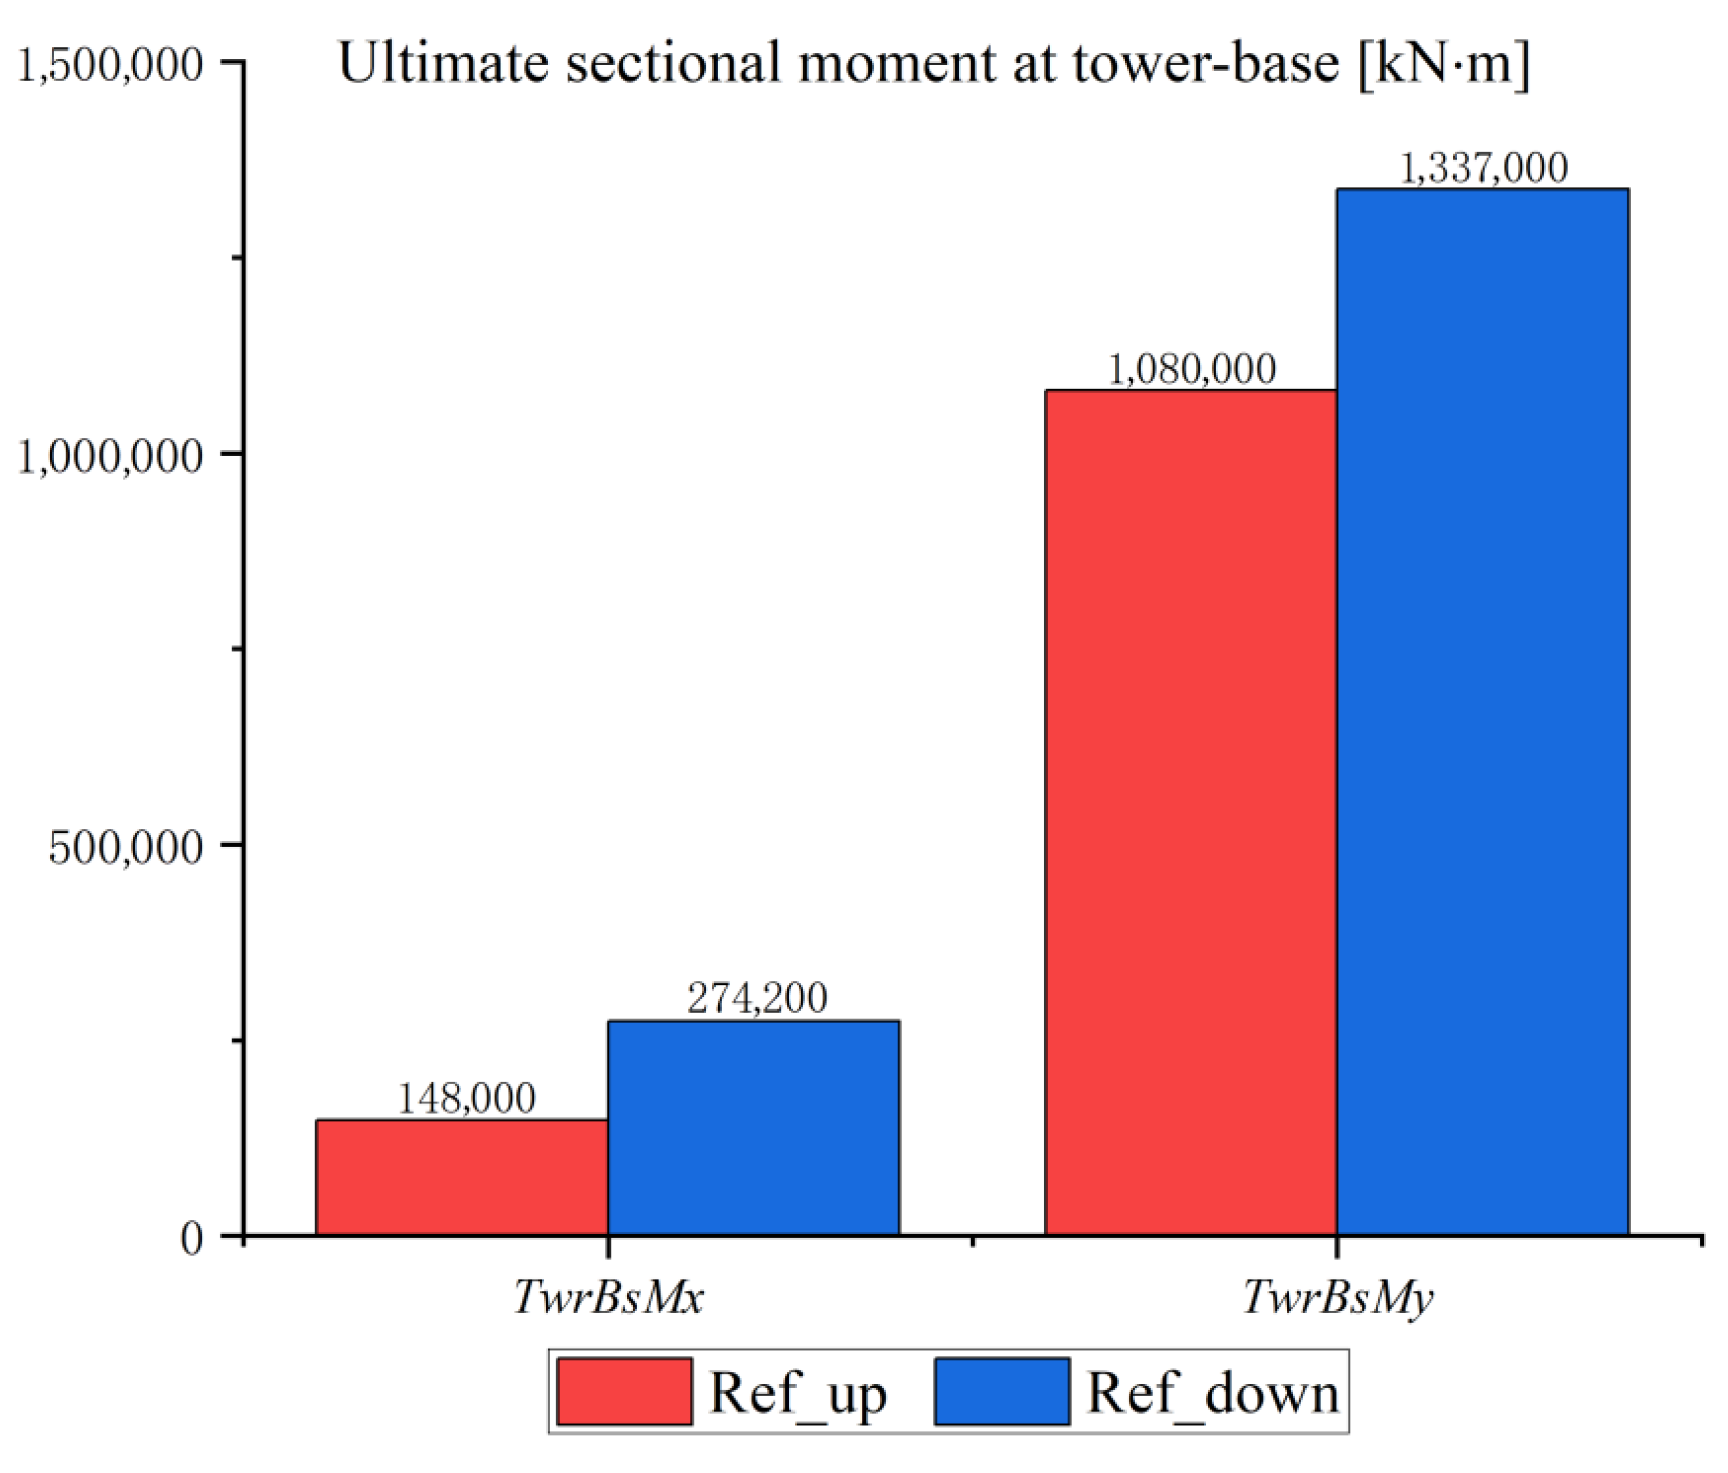
3.2.3. Ultimate Load Analysis

The ultimate loads of Ref_down and Ref_up were analyzed under extreme wind conditions, including DLC 1.4, 1.5, and 2.3, with a total of 54 cases, each with a calculation time of 60 s. The ultimate loads at the blade roots are shown in Table 9 and Table 10. In the second column of the tables, Maximum represents the maximum values of the ultimate loads, where Minimum indicates the minimum value. For the blade roots and tower, both of which are cylindrical structures, only the value with the largest absolute value between Minimum and Maximum is considered when analyzing their ultimate loads. The third column of the tables indicates the conditions corresponding to the ultimate load values. In the following text, various wind conditions will be named using abbreviations, such as EWS+H for Extreme Wind Shear with positive horizontal variation, and EWS-V for Extreme Wind Shear with negative vertical variation. The reference wind speed at the hub will be added after the abbreviation, for example, “ECD_R” represents the Extreme Coherent Gust model at the rated wind speed, and “EOG_R+2” represents the Extreme Operating Gust at the rated wind speed plus 2 m/s. The bold numbers in the tables correspond to the ultimate values of the shear force or bending moment in the respective directions. It can be observed that the majority of the ultimate loads occur under the extreme wind shear condition with a positive horizontal variation at a hub height average wind speed of 25 m/s (EWS+H_25.0).
Figure 9 presents a comparison of the ultimate loads at the blade roots of Ref_up and Ref_down. In terms of ultimate shear forces at the blade roots, the differences between the two wind turbines are relatively small. Ref_down has an ultimate flapwise shear force 3.25% lower than that of Ref_up, and an ultimate edgewise shear force 1.41% higher. Ref_down also has a 2.27% lower ultimate edgewise bending moment at the blade root than that of Ref_up, and has a 9.50% lower ultimate flapwise bending moment. This indicates that the downwind wind turbine has obvious advantages in reducing the ultimate loads on the blades.
Table 11 and Table 12 list the magnitudes of the ultimate loads at the tower base of Ref_up and Ref_down. In the tables, TwrBsMx represents the bending moment in the edgewise direction at the tower base, and TwrBsMy represents the bending moment in the flapwise direction at the tower base. Similar to the blade root loads, most of the ultimate loads at the tower base occur under the extreme wind shear condition with a positive horizontal variation at a hub height average wind speed of 25 m/s (EWS+H_25.0).
The comparison of the ultimate bending moments at the tower base is shown in Figure 10. It is obvious that the ultimate tower bending moments of Ref_down are significantly higher than those of Ref_up. Specifically, the ultimate edgewise or side-to-side bending moment (TwrBsMx) and the ultimate flapwise or fore-aft bending moment (TwrBsMy) of Ref_down see an increase of 85.27% and 19.22% compared with Ref_up. This finding is consistent with the comparison of tower base bending moments under steady wind conditions in Section 3.1.

3.3. Comparison of Downwind Versus Upwind for Wind Turbines of Different Sizes

For a comprehensive comparison of the upwind configuration and its downwind counterparts, the ultimate and fatigue load characteristics of the NREL 5 MW reference wind turbine [25] are analyzed here. The simulation conditions and methods utilized here are nearly the same as those for the IEA 15 MW wind turbine in Section 3.2.

3.3.1. Fatigue Load Analysis

The fatigue load analysis for NREL 5 MW upwind wind turbine Ref_up and its downwind counterpart Ref_down is conducted in the same way as those in Section 3.2. A total of 12 normal turbulence modelled wind conditions of 3, 5, 7, … 21, 23, and 25 m/s are generated according to the requirements of DLC1.2 power generation conditions. The simulation time for each case is 600 s, and the equivalent fatigue loads are calculated for a 20-year (624,119,151.7 s) life cycle for both windward and leeward wind turbines with the Weibull distribution parameters k = 2.4694 and c = 9.4925. The constant m is taken to be the same as in Section 2.3 and is taken to be 10 for both comparative analyses.
The equivalent fatigue loads at blade roots are compared in Figure 11. The equivalent flapwise shear force of Ref_down is approximately 10.75% higher than that of Ref_up. The equivalent edgewise shear force of Ref_down is about 1.65% higher than Ref_up. In terms of equivalent fatigue bending moments at blade roots, Ref_down experiences 2.44% higher flapwise moments (RootMy) and 3.32% higher edgewise moments (RootMx) compared to Ref_up.

3.3.2. Ultimate Load Analysis

The ultimate load analysis for NREL 5 MW is conducted in the same way as those in Section 3.2. For the ECD and EOG, there will be three wind speeds at hub height: the rated wind speed, and wind speeds 2 m/s above and below the rated wind speed. It should be noted that the wind speeds at hub height for NREL 5 MW are different from those of IEA 15 MW. For the EWS, wind speeds are set from 3 to 21 m/s, with each wind speed considering both positive and negative, horizontal and vertical wind shear, totalling 40 cases.
Table 13 and Table 14 and Figure 12 show the ultimate loads at the blade roots of Ref_up and Ref_down for NREL 5 MW. In terms of ultimate shear forces, Ref_down has a flapwise force 10.62% lower than that of Ref_up and an edgewise force 2.02% higher. In terms of ultimate bending moment, Ref_down has a 3.17% higher value for edgewise and a 12.42% lower value for flapwise.
Comparison of ultimate bending moments at the tower base for NREL 5 MW is shown in Table 15 and Table 16 and Figure 13. The edgewise or side-to-side bending moment (TwrBsMx) of Ref_down is 11.28% lower than that of Ref_up. The flapwise or fore-aft bending moment (TwrBsMy) of Ref_down is 3.68% higher than Ref_up. Although the TwrBsMx of Ref_down increases largely, its magnitude is smaller compared with TwrBsMy. Therefore, it is the fore-aft bending moment that determines the strength design of the tower. In other words, the tower of Ref_down should be designed to survive 3.68% more bending moments. Recall the finding in Figure 12b, Ref_down has 3.17% higher ultimate bending moment at the blade root along edgewise than that of Ref_up and 12.42% lower along flapwise. The benefit of saving blade mass on Ref_down can be canceled by the increased tower mass.
For a comprehensive understanding of the characteristics of up/downwind wind turbines of different sizes, we collect additional results from similar papers on the comparison of up/downwind turbines. The results are compared in Table 17, where the Suzlon-based 2.1 MW wind turbines can be found in paper [26] and the Hitachi-based 10 MW turbines in paper [27].
For equivalent flapwise fatigue bending moments at the blade root, when the turbine size is increasing from 2.1 MW to 15 MW, the deviation in the downwind turbine (with respect to the upwind) is decreasing from positive 5.00% to −2.63% gradually, which shows a clear trend of decline. This means that the disadvantage of a downwind turbine (higher flapwise fatigue) is gradually disappearing and even becomes an advantage. For equivalent edgewise fatigue bending moments at the blade root, when the turbine size increases from 2.1 MW to 15 MW, a similar situation happens as for flapwise. The deviation in the downwind turbine (with respect to the upwind) is decreasing from positive 7.00% to −2.41% gradually, which also shows a clear trend of decline. This implies that the disadvantage of a downwind turbine (higher edgewise fatigue) is gradually relieved and even becomes an advantage.
For extreme flapwise bending moments at the blade root, when the turbine size is increasing, the trend is not monotonic. But their values are no larger than −9.5% percent, which all confirms the common belief that downwind types reduce the flapwise extreme loads. For extreme edgewise bending moments at the blade root, when the turbine size is increasing, the value is monotonically decreasing from 5.00% to −2.27%. This means that the disadvantage of a downwind turbine (higher edgewise extreme load) is gradually disappearing and even becomes an advantage.
For extreme flapwise bending moments at the tower base, when the turbine size increases, the trend is not monotonic. Except for the Hitachi-based 10 MW, the downwind turbines of 2.1 MW, 5 MW, and 10 MW all see increased fore-aft bending moments (positive value in Table 17). In comparison, the 10 MW wind turbine has a variation of −9.0% which seems to deviate much from the other turbines. This may be caused by the different load cases for extreme load analysis. It is more reliable to trust the extreme loads of a 2.1 MW turbine with a positive value, as full design load cases are considered in the paper. Additionally, this may also be caused by different designs of the rotor-nacelle weight center. For extreme edgewise bending moments at the tower base, when the turbine size is increasing, the trend is also not monotonic. This may be caused by the different load cases for extreme load analysis. It is more reliable to trust the extreme loads of a 2.1 MW turbine with a positive value, as full design load cases are considered in the paper.
Combining the results above, the weakness of the downwind turbine at the blade root (their higher fatigue loads both flapwise and edgewise, their higher edgewise extreme load is relieved when the turbine power is increased from 5 MW to 15 MW. And the downwind turbines can reduce the flapwise extreme load by more than 10%, no matter what the power level is. The discipline remained unclear due to the fatigue and extreme load at the tower base; the trend is not monotonic, which needs more studies. However, it is more likely that the downwind type would increase the extreme load at the tower base.
For the IEA 15 MW, the downwind turbine sees an increase of 85.27% for extreme side-to-side bending moment over the upwind turbine and an increase of 19.22% for flapwise. However, it is the flapwise moment (with a large magnitude) that determines the design of the tower. Therefore, the tower of a downwind turbine should be designed to survive 19.22% more bending moments. The benefit of saving blade mass by downwind design is overwhelmed by the increased tower mass. But if we design the downwind turbine in a more proper way, for example, optimizing the weight center of rotor-nacelle and optimizing the control strategy, the increase in tower moments should be relieved.

4. Conclusions

This paper compares in detail the aeroelastic performances of the IEA 15 MW upwind wind turbine to its downwind counterpart configuration. Then, for a comprehensive comparison of up/downwind configurations, the ultimate and fatigue load characteristics of NREL 5 MW are simulated and analyzed. Additionally, results of a 2.1 MW and a 10 MW wind turbine are also gathered for comparison. The key trends across turbine sizes (2.1 MW to 15 MW) for downwind versus upwind configurations are as follows:
For Blade Root Loads, the trend is clear.
  • Clear monotonic trend on fatigue bending moments: Downwind turbine’s initial disadvantage (higher fatigue compared with upwind turbine) at 2.1 MW (flapwise increment: +5.00%, edgewise increment: +7.00%) transitions to an advantage at 15 MW (flapwise increment: −2.63%, edgewise increment: −2.41%).
  • Clear monotonic trend on extreme edgewise bending moments: Downwind shifts from a disadvantage (+5.00% higher compared with upwind turbine at 2.1 MW) to an advantage (−2.27% at 15 MW).
  • Non-monotonic trend on extreme flapwise bending moments: Downwind consistently reduces extreme loads (reduction always surpasses −9.5%), supporting its role in mitigating flapwise extremes.
For tower base loads, the trend is unclear, which needs further study. Except for the Hitachi-based 10 MW, the downwind turbines of 2.1 MW, 5 MW, and 10 MW all see increased fore-aft bending moments. At the same time, the 10 MW wind turbine has a variation of −9.0% which seems to deviate much from the other turbines. The downwind turbines of 2.1 MW and 15 MW see increased side-to-side bending moments. In comparison, the 5 MW wind turbine has a variation of −11.28%. The trend is non-monotonic, which may be caused by the different load cases for extreme load analysis. It is more reliable to trust the extreme tower base loads from a 2.1 MW turbine (downwind turbines have higher extreme tower base bending moments, both fore-aft and side-to-side directions), as full design load cases are considered in their simulations.
In conclusion, the main advantage of a downwind wind turbine is the ability to reduce extreme blade loads and reduce blade mass. But tower reinforcement costs may offset blade mass savings. The weight center of rotor-nacelle assembling should be specifically designed or adjusted to reduce tower base loads. Additionally, advanced control strategies (e.g., individual pitch control or trailing-edge flaps) can be explored in the future, which could enhance fatigue life.

Author Contributions

Conceptualization, Z.S. (Zixuan Sun), Y.X. and Z.S. (Zhenye Sun); methodology, Z.S. (Zhenye Sun); software, Z.S. (Zhenye Sun) and Y.X.; validation, Z.S. (Zixuan Sun), Z.S. (Zhenye Sun), Y.X. and W.Z.; formal analysis, Z.S. (Zixuan Sun) and Z.S. (Zhenye Sun); investigation, Z.S. (Zhenye Sun), W.S. and E.F.; writing—original draft preparation, Z.S. (Zixuan Sun), Z.S. (Zhenye Sun) and E.F.; supervision, Z.S. (Zhenye Sun) and E.F. All authors have read and agreed to the published version of the manuscript.

Funding

This research was funded by the Jiangsu Province Graduate Research and Practice Innovation Program under grant numbers SJCX24_2256. This research was also funded by the 2024 Jiangsu Provincial Carbon Peaking and Carbon Neutrality Science and Technology Innovation Special Project (No. BT2024003), National Natural Science Foundation of China, No. 51905469, and the Yangzhou Science and Technology Bureau (No. YZ2023247).

Institutional Review Board Statement

Not applicable.

Informed Consent Statement

Not applicable.

Data Availability Statement

Data available on request due to restrictions, e.g., privacy or ethical. The data presented in this study are available on request from the corresponding author. The data are not publicly available due to the large volume of data.

Conflicts of Interest

Author Yusheng Xia was employed by the company Beijing Goldwind Science & Creation Windpower Equipment Co., Ltd. The remaining authors declare that the research was conducted in the absence of any commercial or financial relationships that could be construed as a potential conflict of interest. We want to express our gratitude to the academic license of HAWC2 awarded for Yusheng Xia during his master studies. All the original data related with HAWC2 is got during that time and has no relationship with the company now hired him.

References

  1. Sun, Z.; Zhu, W.J.; Shen, W.Z.; Zhong, W.; Cao, J.; Tao, Q. Aerodynamic Analysis of Coning Effects on the DTU 10 MW Wind Turbine Rotor. Energies 2020, 13, 5753. [Google Scholar] [CrossRef]
  2. Sun, Z.; Sessarego, M.; Chen, J.; Shen, W.Z. Design of the OffWindChina 5 MW wind turbine rotor. Energies 2017, 10, 777. [Google Scholar] [CrossRef]
  3. Noyes, C.; Loth, E.; Martin, D.; Johnson, K.; Ananda, G.; Selig, M. Extreme-scale load-aligning rotor: To hinge or not to hinge? Appl. Energy 2020, 257, 113985. [Google Scholar] [CrossRef]
  4. Noyes, C.; Qin, C.; Loth, E. Analytic analysis of load alignment for coning extreme-scale rotors. Wind Energy 2020, 23, 357–369. [Google Scholar] [CrossRef]
  5. Noyes, C.; Qin, C.; Loth, E. Pre-aligned downwind rotor for a 13.2 MW wind turbine. Renew. Energy 2018, 116, 749–754. [Google Scholar] [CrossRef]
  6. Loth, E.; Steele, A.; Qin, C.; Ichter, B.; Selig, M.S.; Moriarty, P. Downwind pre-aligned rotors for extreme-scale wind turbines. Wind Energy 2017, 20, 1241–1259. [Google Scholar] [CrossRef]
  7. Ichter, B.; Steele, A.; Loth, E.; Moriarty, P.; Selig, M. A morphing downwind-aligned rotor concept based on a 13-MW wind turbine. Wind Energy 2016, 19, 625–637. [Google Scholar] [CrossRef]
  8. Kaminski, M.; Noyes, C.; Loth, E.; Damiani, R.; Hughes, S.; Bay, C.; Chetan, M.; Griffith, D.T.; Johnson, K.; Martin, D. Gravo-aeroelastic scaling of a 13-MW downwind rotor for 20% scale blades. Wind Energy 2021, 24, 229–245. [Google Scholar] [CrossRef]
  9. Kaminski, M.; Loth, E.; Fingersh, L.J.; Scholbrock, A.; Selig, M. Parked aeroelastic field rotor response for a 20% scaled demonstrator of a 13-MW downwind turbine. Wind Energy 2023, 26, 182–200. [Google Scholar] [CrossRef]
  10. Kaminski, M.; Simpson, J.; Loth, E.; Fingersh, L.J.; Scholbrock, A.; Johnson, N.; Johnson, K.; Pao, L.; Griffith, T. Gravo-aeroelastically-scaled demonstrator field tests to represent blade response of a flexible extreme-scale downwind turbine. Renew. Energy 2023, 218, 119217. [Google Scholar] [CrossRef]
  11. Simpson, J.G.; Kaminski, M.; Loth, E. Influence of tower shadow on downwind flexible rotors: Field tests and simulations. Wind Energy 2022, 25, 881–896. [Google Scholar] [CrossRef]
  12. Zalkind, D.S.; Ananda, G.K.; Chetan, M.; Martin, D.P.; Bay, C.J.; Johnson, K.E.; Loth, E.; Griffith, D.T.; Selig, M.S.; Pao, L.Y. System-level design studies for large rotors. Wind Energy Sci. 2019, 4, 595–618. [Google Scholar] [CrossRef]
  13. Phadnis, M.; Escalera Mendoza, A.S.; Jeong, M.; Loth, E.; Todd Griffith, D.; Pusch, M.; Pao, L. Comparison of 25 MW downwind and upwind turbine designs with individual pitch control. In Journal of Physics: Conference Series; Institute of Physics: London, UK, 2024. [Google Scholar]
  14. OpenFAST Documentation—OpenFAST v4.0.2 Documentation. Available online: https://openfast.readthedocs.io/en/main/ (accessed on 22 March 2025).
  15. Moriarty, P.J.; Hansen, A.C. AeroDyn Theory Manual; NREL/TP-500-36881; National Renewable Energy Laboratory: Golden, CO, USA, 2005; p. 15014831.
  16. Wang, Q.; Sprague, M.A.; Jonkman, J.; Johnson, N.; Jonkman, B. BeamDyn: A high-fidelity wind turbine blade solver in the FAST modular framework. Wind Energy 2017, 20, 1439–1462. [Google Scholar] [CrossRef]
  17. Gaertner, E.; Rinker, J.; Sethuraman, L.; Zahle, F.; Anderson, B.; Barter, G.; Abbas, N.; Meng, F.; Bortolotti, P.; Skrzypinski, W.; et al. Definition of the IEA 15-Megawatt Offshore Reference Wind; NREL Technical Report; National Renewable Energy Laboratory: Golden, CO, USA, 2020; p. NREL/TP500075698.
  18. IEA Task 37 2020 IEA GitHub Repository URL[DB/OL]. Available online: https://github.com/IEAWindTask37/IEA-15-240-RWT (accessed on 26 February 2023).
  19. Brown, K.; Bortolotti, P.; Branlard, E.; Chetan, M.; Dana, S.; de Velder, N.; Doubrawa, P.; Hamilton, N.; Ivanov, H.; Jonkman, J.; et al. One-to-one aeroservoelastic validation of operational loads and performance of a 2.8MW wind turbine model in OpenFAST. Wind Energy Sci. 2024, 9, 1791–1810. [Google Scholar] [CrossRef]
  20. Rinker, J.; Gaertner, E.; Zahle, F.; Skrzypiński, W.; Abbas, N.; Bredmose, H.; Barter, G.; Dykes, K. Comparison of loads from HAWC2 and OpenFAST for the IEA Wind 15 MW Reference Wind Turbine. J. Phys. Conf. Ser. 2020, 1618, 052052. [Google Scholar] [CrossRef]
  21. Das, S.; Karnik, N.; Santoso, S. Time-Domain Modeling of Tower Shadow and Wind Shear in Wind Turbines. Int. Sch. Res. 2011, 2011, 890582. [Google Scholar] [CrossRef]
  22. IEC 61400-3:2009. Available online: https://webstore.iec.ch/en/publication/5446 (accessed on 26 March 2025).
  23. TurbSim|Wind Research|NREL. Available online: https://www2.nrel.gov/wind/nwtc/turbsim (accessed on 26 March 2025).
  24. IECWind|Wind Research|NREL. Available online: https://www2.nrel.gov/wind/nwtc/iecwind (accessed on 26 March 2025).
  25. Jonkman, J.; Butterfield, S.; Musial, W.; Scott, G. Definition of a 5-MW Reference Wind Turbine for Offshore System Development; National Renewable Energy Laboratory (NREL): Golden, CO, USA, 2009; p. NREL/TP-500-38060. [CrossRef]
  26. Noyes, C.; Qin, C.; Loth, E. Changes in design driving load cases: Operating an upwind turbine with a downwind rotor configuration. Wind Energy 2019, 23, 1421–1653. [Google Scholar] [CrossRef]
  27. Bortolotti, P.; Kapila, A.; Bottasso, C.L. Comparison between upwind and downwind designs of a 10 MW wind turbine rotor. Wind Energy Sci. 2019, 4, 115–125. [Google Scholar] [CrossRef]
Figure 1. Schematic drawing of structural conversion from the upwind to the downwind wind turbine.
Machines 13 00599 g001
Figure 2. Schematic drawing of the blade reference coordinate system for OpenFAST and HAWC2.
Machines 13 00599 g002
Figure 3. Structural parameters input for OpenFAST and HAWC2.
Machines 13 00599 g003
Figure 4. Output of blade root bending moments from OpenFAST and HAWC2.
Machines 13 00599 g004
Figure 5. Comparison of the aeroelastic performance of the upwind and downwind wind turbines under a steady wind of 10 m/s.
Machines 13 00599 g005aMachines 13 00599 g005b
Figure 6. Comparison of the aeroelastic performance of the upwind and downwind wind turbines under a steady wind of 15 m/s.
Machines 13 00599 g006
Figure 7. The different DLC conditions chosen for calculation.
Machines 13 00599 g007
Figure 8. Comparison of equivalent fatigue loads at blade roots of the upwind and downwind wind turbines.
Machines 13 00599 g008
Figure 9. Comparison of ultimate loads at blade roots of the upwind and downwind 15 MW wind turbines.
Machines 13 00599 g009
Figure 10. Comparison of ultimate bending moments at the tower base of the upwind and downwind 15 MW wind turbines.
Machines 13 00599 g010
Figure 11. Comparison of equivalent fatigue loads at blade roots for NERE 5 MW wind turbines.
Machines 13 00599 g011
Figure 12. Comparison of ultimate loads at blade roots for NREL 5 MW wind turbines.
Machines 13 00599 g012
Figure 13. Comparison of ultimate bending moments at the tower base for NREL 5 MW turbines.
Machines 13 00599 g013
Table 1. IEA 15 MW reference wind turbine.
ParameterValue
Number of rotor blades3
Rotor diameter242 m
Rated aerodynamic power15 MW
Cut-in speed3 m/s
Rated wind speed10.59 m/s
Cut-out speed25 m/s
Blade cone angle
Blade length117 m
Wind turbine classIEC Class 1B
Hub height150 m
Rated rational speed7.56 rpm
Table 2. Basic aerodynamic parameters of the IEA Wind 15 MW RWT blades.
Blade Span [m]Chord Length [m]Twist Angle [rad]Airfoil Selection
05.20.272circular
2.345.2080.272circular
17.555.6210.199SNL-FFA-W3-500
28.684927065.7030.126FFA-W3-360
38.474742235.1660.084FFA-W3-330blend
51.383983534.4280.042FFA-W3-301
62.907554633.9980.023FFA-W3-270blend
74.670295863.5250.004FFA-W3-241
90.294030722.881−0.028FFA-W3-211
1170.5−0.021FFA-W3-211
Table 3. Mean aeroelastic performance parameters uner wind speed of 10 m/s.
Generator
Power
Rotor SweptRotor SpeedBlade Root Flapwise Bending MomentTower Base Flapwise Bending Moment
(kW)(m2)(rpm)(kN·m)(kN·m)
Ref_up10,16746,0026.6047,264180,854
Ref_down994445,3136.5437,735322,067
Table 4. Mean aeroelastic performance parameters uner wind speed of 15 m/s.
Generator
Power
Rotor SweptRotor SpeedBlade Root Flapwise Bending MomentTower Base Flapwise Bending Moment
(kW)(m2)(rpm)(kN·m)(kN·m)
Ref_up14,73646,0337.5547,296204,594
Ref_down14,76245,6007.5535,360342,129
Table 5. DLC Condition Settings.
DLCWind ConditionWind
Speeds
Additional SettingsNumber of
Simulations
1.2NTM3:2:25 m/s-12
1.4ECDVr,Vr ±2 m/s-3
1.5EWS3:2:25 m/s±Vert/Horz48
2.3EOGVr,Vr ±2 m/s-3
NTM: normal turbulence model; ECD: extreme coherent gust with direction change; EWS: extreme wind shear; EOG: extreme operating gust; Vr: rated wind speed; Vert/Horz: wind shear along vertical or horizontal direction.
Table 6. Equivalent fatigue loads at the blade roots of the upwind wind turbine.
Fatigue Cycles
(20 Years)
RootFx (kN)RootFy (kN)RootMx (kN·m)RootMy (kN·m)
m31.1686 × 1031.1632 × 1032.3732 × 1042.5140 × 104
41.2354 × 1031.2448 × 1032.7279 × 1042.7490 × 104
51.3006 × 1031.3461 × 1033.0580 × 1043.0086 × 104
91.6249 × 1031.7540 × 1034.0432 × 1044.3249 × 104
101.7539 × 1031.8480 × 1034.2275 × 1044.7584 × 104
111.8993 × 1031.9440 × 1034.3956 × 1045.2348 × 104
122.0506 × 1032.0462 × 1034.5511 × 1045.7345 × 104
Table 7. Equivalent fatigue loads at the blade roots of the downwind wind turbine.
Fatigue Cycles
(20 Years)
RootFx (kN)RootFy (kN)RootMx (kN·m)RootMy (kN·m)
m31.1366 × 1031.1377 × 1032.3810 × 1042.5467 × 104
41.2094 × 1031.2342 × 1032.7085 × 1042.7462 × 104
51.2801 × 1031.3475 × 1033.0221 × 1042.9710 × 104
91.7777 × 1031.8154 × 1033.9465 × 1044.2164 × 104
101.9856 × 1031.9289 × 1034.1162 × 1044.6438 × 104
112.1967 × 1032.0445 × 1034.2714 × 1045.1047 × 104
122.4010 × 1032.1635 × 1034.4166 × 1045.5788 × 104
Table 8. Nomenclature for discussion of forces.
TermDescriptionsTermDescriptions
RootFxFlapwise shear force at the blade rootRootFyEdgewise shear force at the blade root
RootMxEdgewise bending moment at the blade rootRootMyFlapwise bending moment at the blade root
TwrBsMxEdgewise bending moment at the tower baseTwrBsMyFlapwise bending moment at the tower base
Table 9. Ultimate loads at the blade roots of the upwind 15 MW wind turbine.
RootFxRootFyRootMxRootMy
VariableTypeWorking ConditionsUltimate Value(kN)(kN)(kN·m)(kN·m)
RootFxMinimumEWS+H_25.0−1668−1668−8619057−31,270
RootFxMaximumEWS+H_25.0449244921132−26,820144,000
RootFyMinimumEWS+H_21.0−2444249−244434,19017,060
RootFyMaximumEWS+H_25.0377116543771−46,48065,360
RootMxMinimumEWS+H_25.0−57,50020943003−57,50079,900
RootMxMaximumEWS+H_25.054,7301195−177454,73034,600
RootMyMinimumEWS+H_25.0−31,270−1668−8619057−31,270
RootMyMaximumEWS+H_25.0152,6003754175−1910152,600
Table 10. Ultimate loads at the blade roots of the downwind 15 MW wind turbine.
RootFxRootFyRootMxRootMy
VariableTypeWorking ConditionsUltimate Value(kN)(kN)(kN·m)(kN·m)
RootFxMinimumEWS+H_25.0−2931−2931214−2834−29,050
RootFxMaximumEWS+H_25.0434643461062−18,110127,000
RootFyMinimumEWS+H_25.0−3824−496−382452,010−16,310
RootFyMaximumEWS+H_25.029654542965−56,19052,540
RootMxMinimumEWS+H_25.0524542965−56,190−52,540
RootMxMaximumEWS+H_25.052,6901169−207052,69049,880
RootMyMinimumEWS+H_25.0−58,430−1544592−8153−58,430
RootMyMaximumEWS+H_25.0138,1004214387−17,540138,100
Table 11. Ultimate loads at the tower base of the upwind 15 MW wind turbine.
TwrBsMxTwrBsMy
VariableTypeWorking ConditionsUltimate Value(kN·m)(kN·m)
TwrBsMxMinimumEWS+H_25.0−86,840−86,84039,580
TwrBsMxMaximumEWS+H_25.0148,000148,000147,600
TwrBsMyMinimumEWS+H_15.0−173,30029,080−173,300
TwrBsMyMaximumEWS+H_25.01,080,00066,5801,080,000
Table 12. Ultimate loads at the tower base of the downwind 15 MW wind turbine.
TwrBsMxTwrBsMy
VariableTypeWorking ConditionsUltimate Value(kN·m)(kN·m)
TwrBsMxMinimumEWS+H_25.0−197,300−197,300130,600
TwrBsMxMaximumEWS+H_25.0274,200274,20064,440
TwrBsMyMinimumEWS+H_15.0−129,700−50,490−12,970
TwrBsMyMaximumEWS+H_25.01,337,00061,4701,337,000
Table 13. Ultimate loads at the blade roots of the upwind 5 MW wind turbine.
RootFxRootFyRootMxRootMy
VariableTypeWorking ConditionsUltimate Value(kN)(kN)(kN·m)(kN·m)
RootFxMinimumECDR+2−146−146106−1603−5343
RootFxMaximumEWSH-21518518−143300316,220
RootFyMinimumEWSH-11−247345−247614812,550
RootFyMaximumEWSH-21205164205−52415033
RootMxMinimumEWSH-21−5244169203−52445211
RootMxMaximumEWSH-116151346−247615112,560
RootMyMinimumECDR+2−5343−146106−1603−5343
RootMyMaximumECDR+217,8004747131817,800
Table 14. Ultimate loads at the blade roots of the downwind 5 MW wind turbine.
RootFxRootFyRootMxRootMy
VariableTypeWorking ConditionsUltimate Value(kN)(kN)(kN·m)(kN·m)
RootFxMinimumDNEWSH-21−85−85−191242−3554
RootFxMaximumDNEWSH-21463463−154331514,880
RootFyMinimumDNEWSH-11−252307−252631011,650
RootFyMaximumDNEWSH-21184116184−46903872
RootMxMinimumDNEWSH-21−4690116184−46903872
RootMxMaximumDNEWSH-116346307−251634611,660
RootMyMinimumDNEWSH-21−3635−83−311330−3635
RootMyMaximumDNEWSH-21−85−85−191242−3554
Table 15. Ultimate loads at the tower base of the upwind 5 MW wind turbine.
TwrBsMxTwrBsMy
VariableTypeWorking ConditionsUltimate Value(kN·m)(kN·m)
TwrBsMxMinimumEWSH-21−8959−89593414
TwrBsMxMaximumECDR+220,57020,5702735
TwrBsMyMinimumEWSH-21−61,3805794−61,380
TwrBsMyMaximumEWSH-21214,80011,720214,800
Table 16. Ultimate loads at the tower base of the downwind 5 MW wind turbine.
TwrBsMxTwrBsMy
VariableTypeWorking ConditionsUltimate Value(kN·m)(kN·m)
TwrBsMxMinimumEWSH-21−9003−90032478
TwrBsMxMaximumEWSH-2118,25018,250172,000
TwrBsMyMinimumEWSH-21−64,1504167−64,150
TwrBsMyMaximumEWSH-21222,70013,890222,700
Table 17. Comparison of ultimate and fatigue loads between upwind and downwind configurations. The relative difference with respect to the upwind configuration.
TopicSuzlon-Based 2.1 MWNREL 5 MWHitachi-Based 10 MW
DW Case
IEA 15 MW
Fatigue at blade root: flapwise bending moments5.00%2.44%Around
0.00%
−2.63%
Fatigue at blade root: edgewise bending moments7.00%3.32%Around −1.00%−2.41%
Note: For Hitachi-based 10 MW, the value −1.00% is obtained when the blade mass reduction ratio −6.80% is taken out. This is because the blade of the downwind type is optimized to have less mass.
Extreme at blade root: flapwise bending moments−10.00%−12.42%Around −15.50%−9.50%
Extreme at blade root: edgewise bending moments5.00%3.17%N/A−2.27%
Extreme at tower base: fore-aft bending moments14.00%3.68%Around −9.00%19.22%
Extreme at tower base: side-to-side bending moments10.00%−11.28%N/A85.27%
Disclaimer/Publisher’s Note: The statements, opinions and data contained in all publications are solely those of the individual author(s) and contributor(s) and not of MDPI and/or the editor(s). MDPI and/or the editor(s) disclaim responsibility for any injury to people or property resulting from any ideas, methods, instructions or products referred to in the content.

