
Semi-Supervised Fault Diagnosis Method for Hydraulic Pumps Based on Data Augmentation Consistency Regularization

 and
and
Abstract
1. Introduction
- (1)
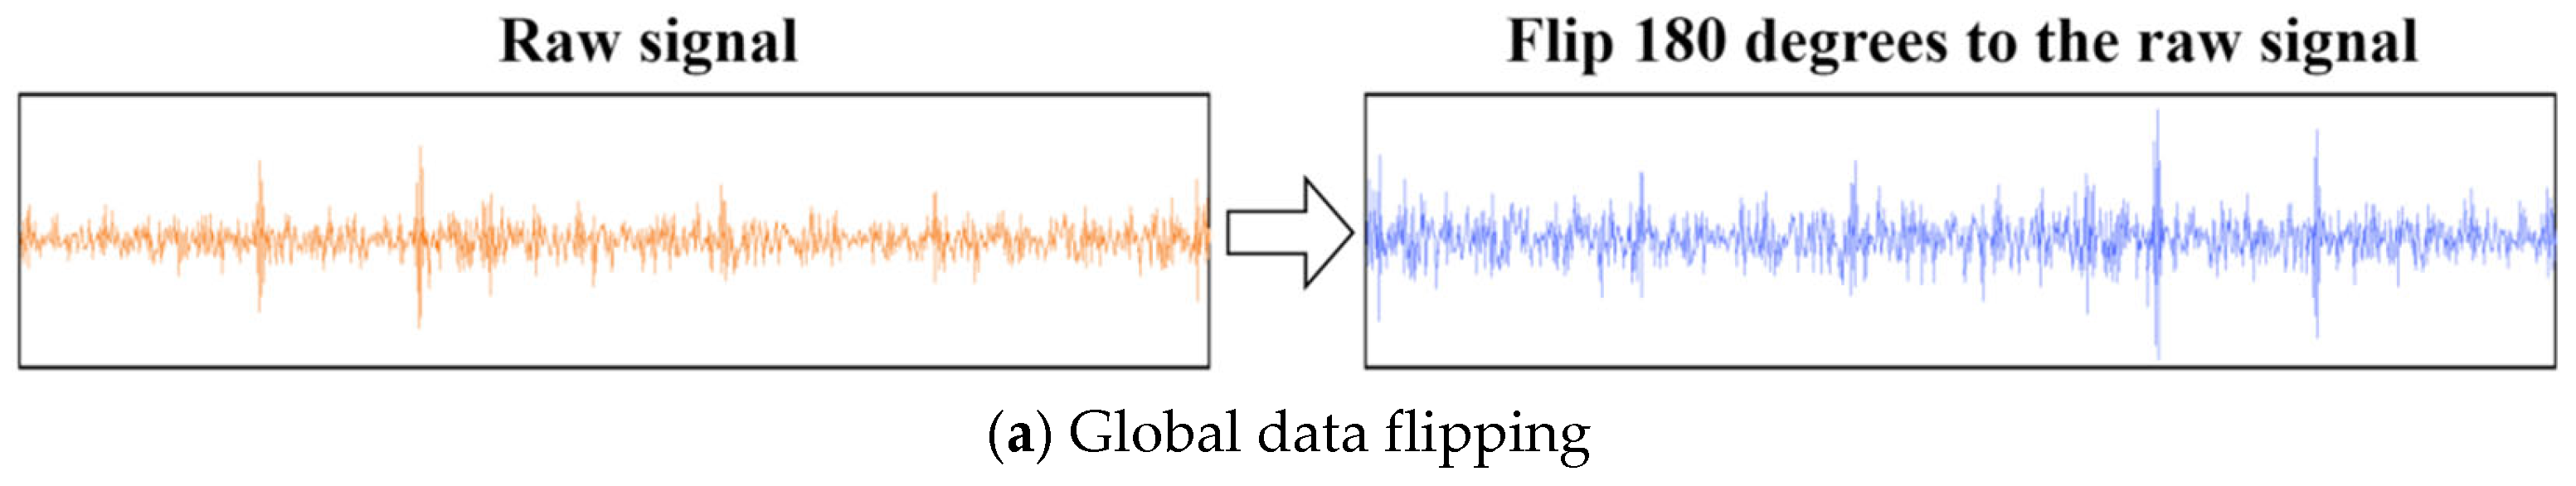
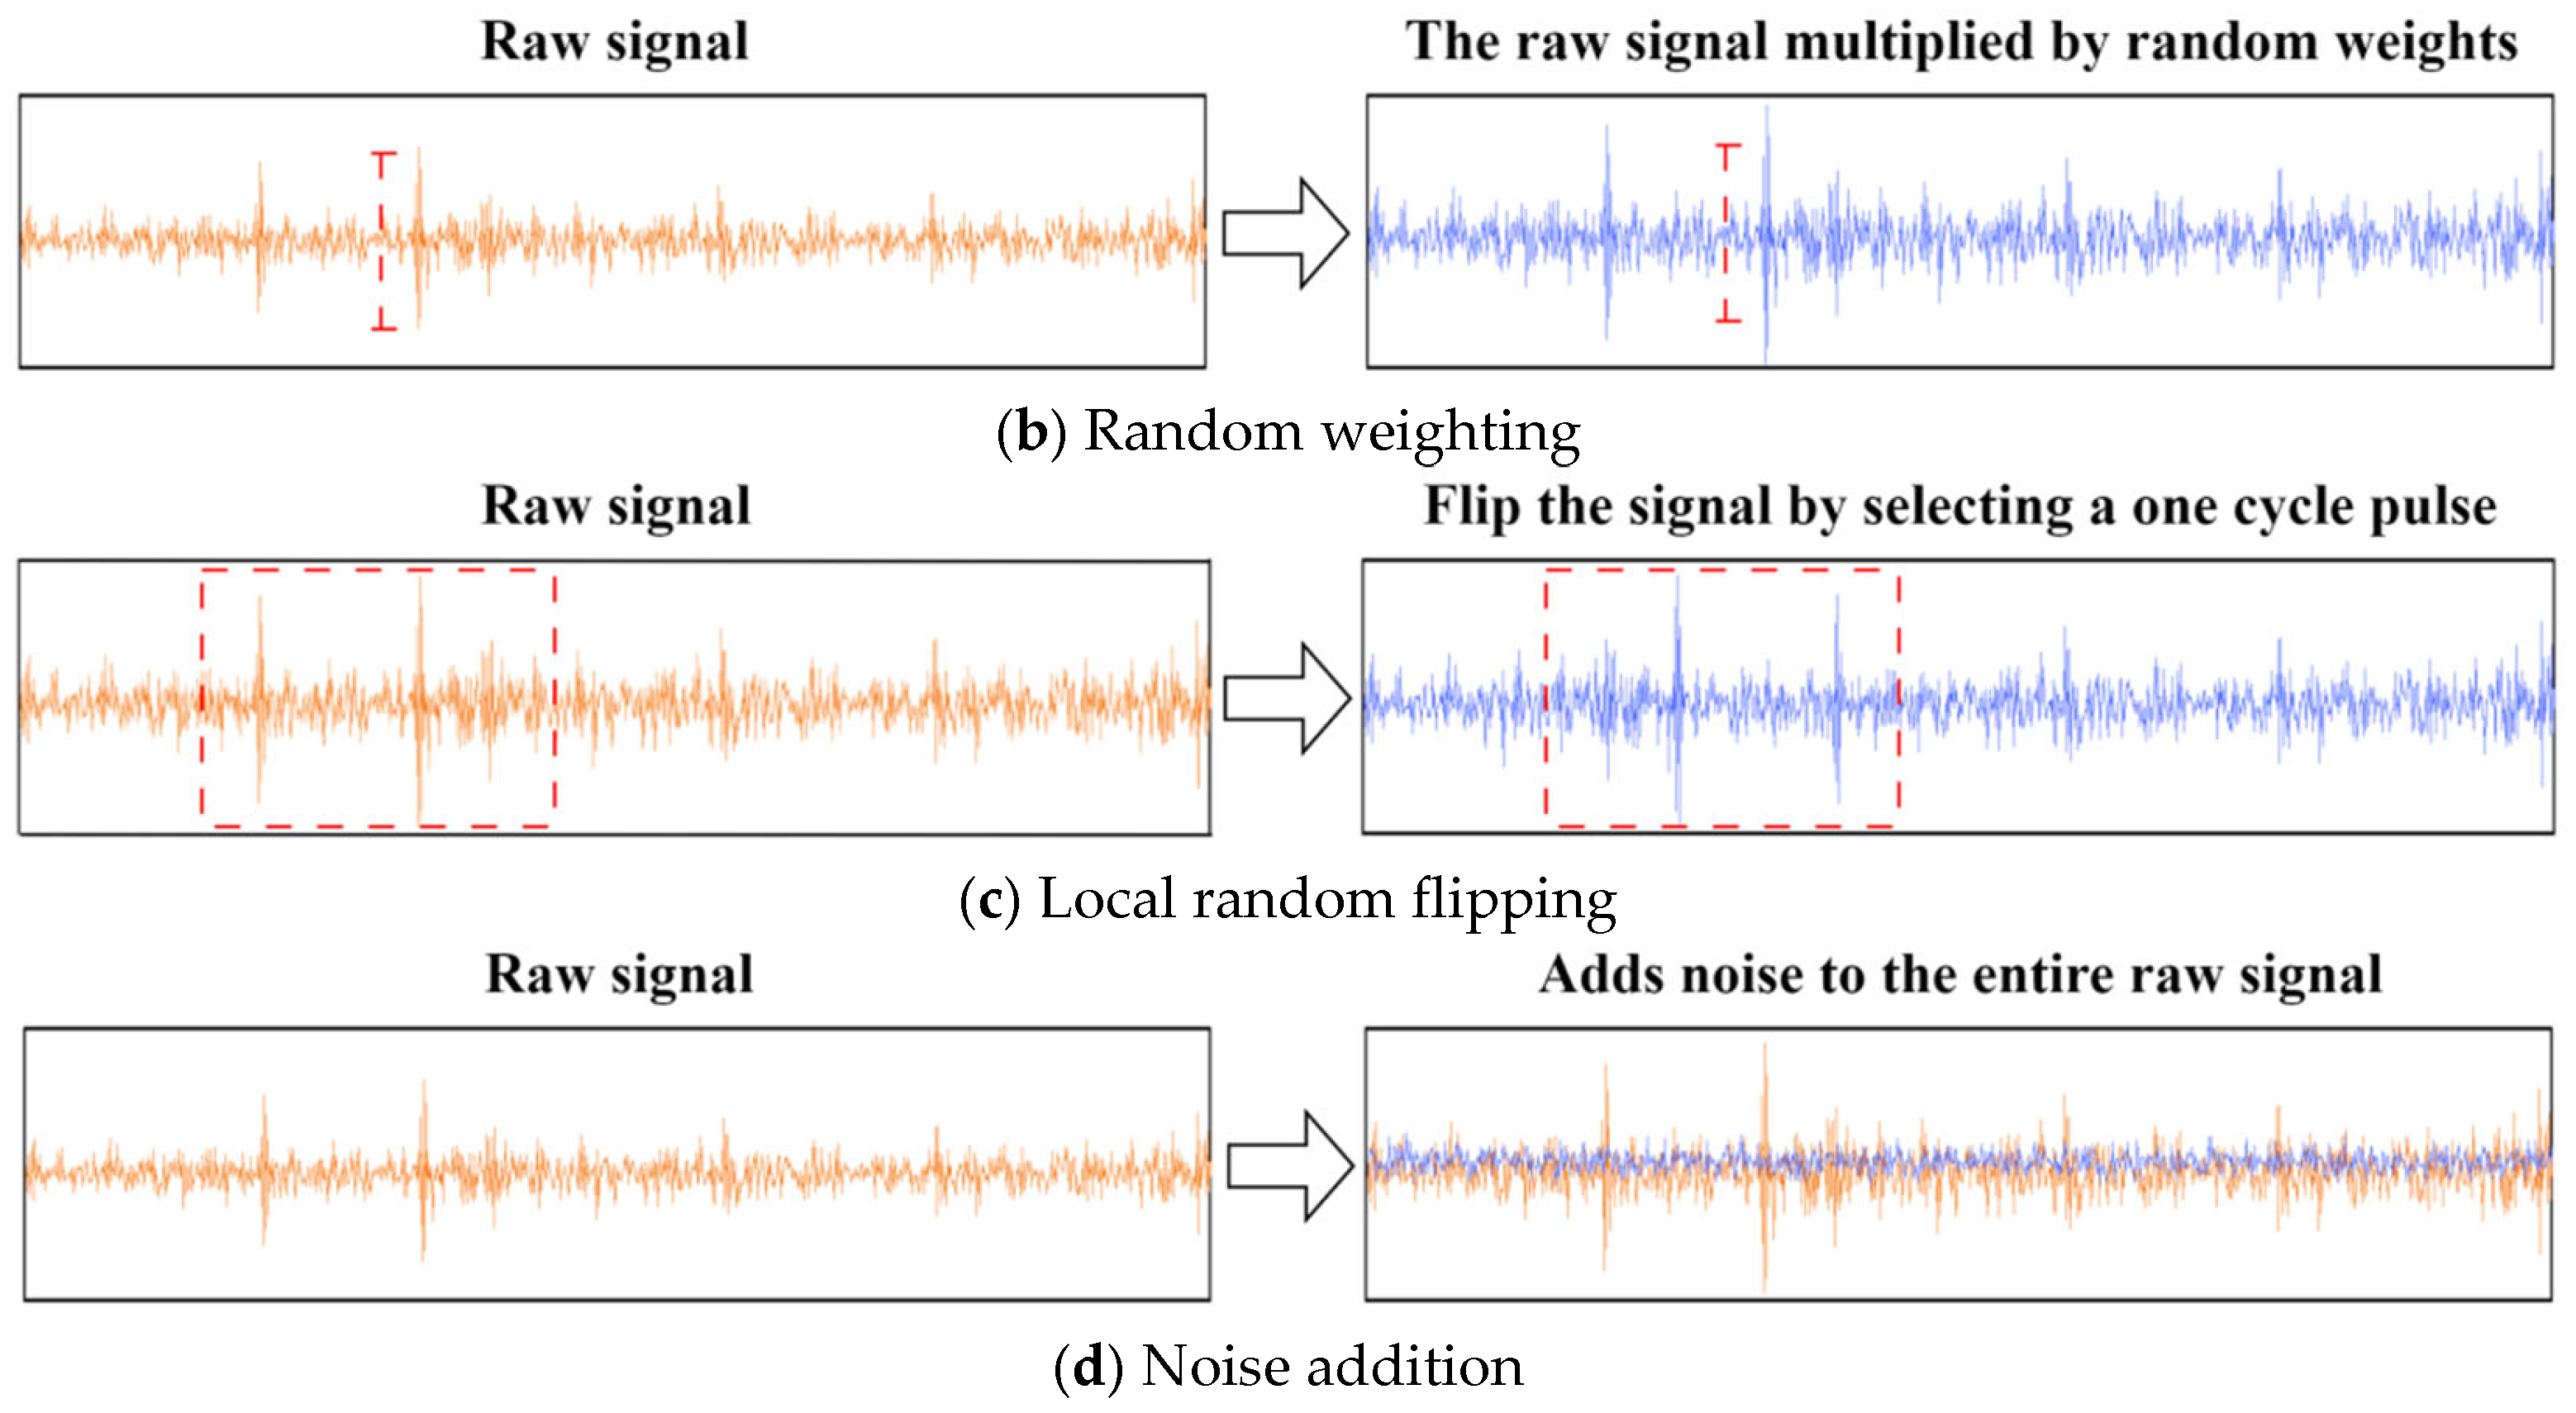
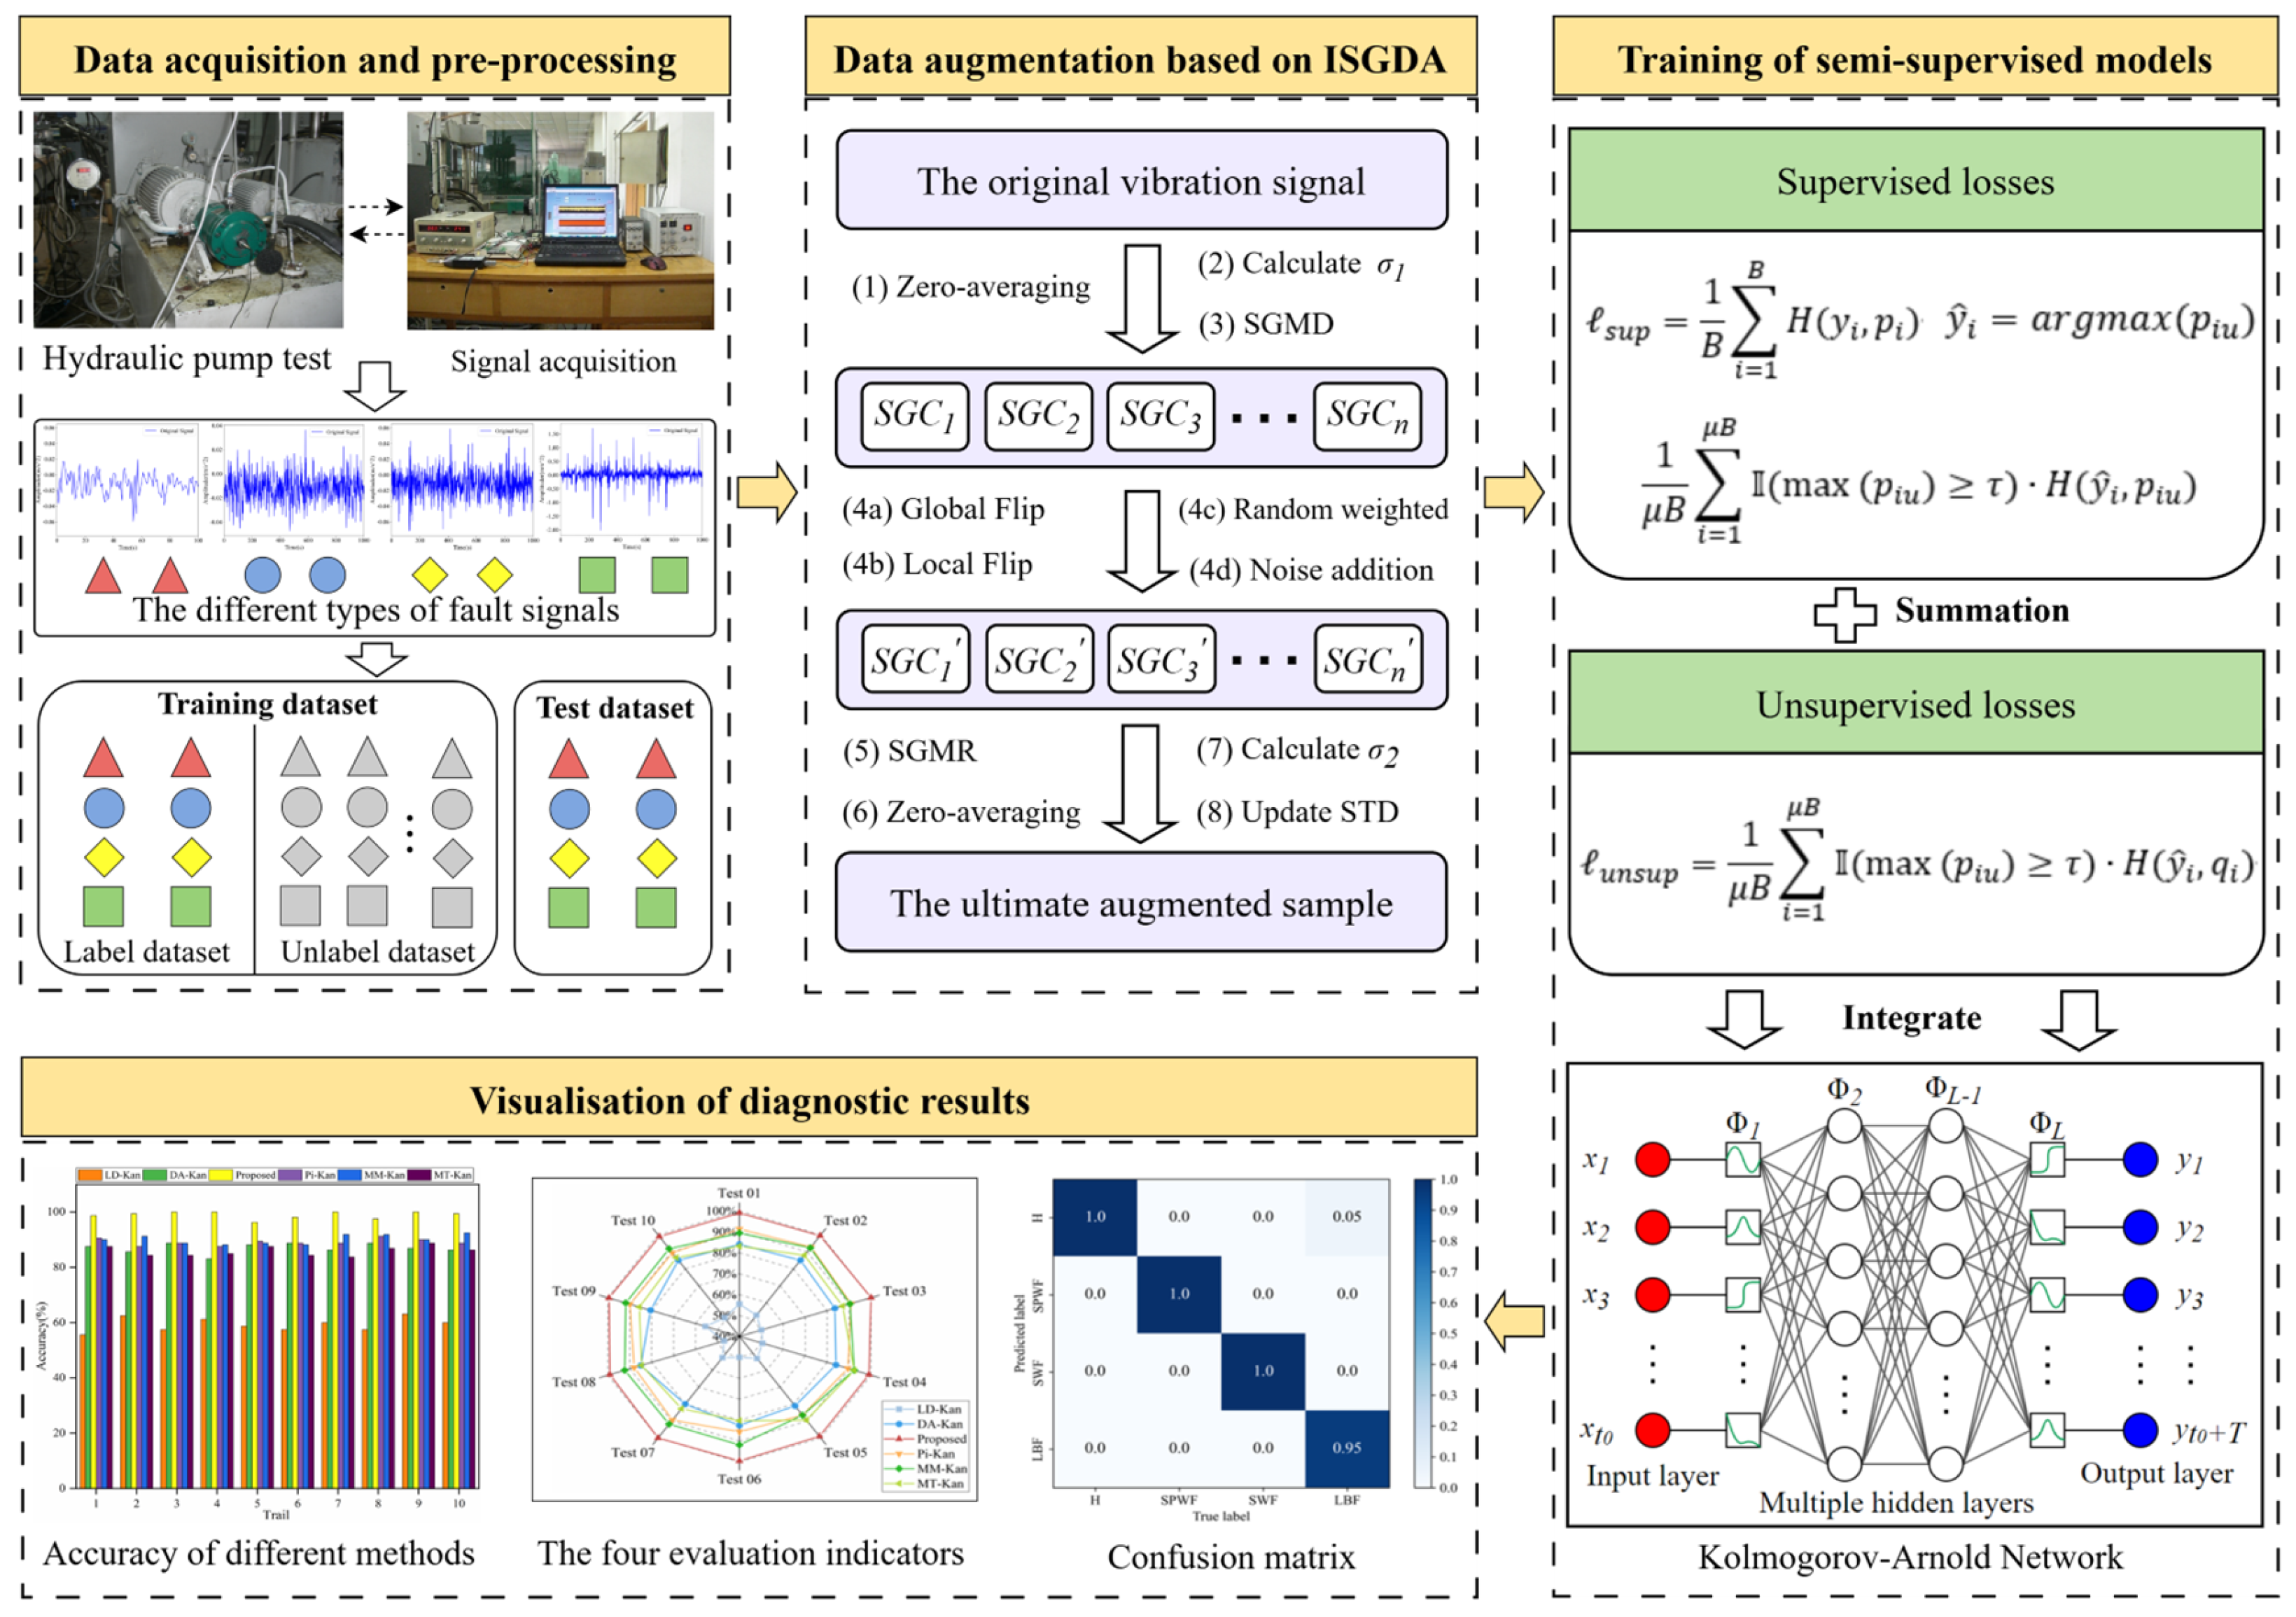
- A semi-supervised learning method based on data augmentation and consistency regularization is proposed. Utilizing the improved symplectic geometry data augmentation approach (ISGDA), the amount of labeled samples is enriched by obtaining augmented samples by applying additional perturbations to the temporal sequence signals of 1D failure samples. The results of fault diagnosis test trials indicate that the ISGDA dramatically enhances the diagnostic effect of the model in situations where the labeled failure data is rare, and meanwhile effectively suppresses the overfitting problem in the training.
- (2)
- The consistency strategy among primitive labeled samples and enhanced samples is constructed, and the supervised loss function is defined. Standard cross entropy is calculated for enhanced labeled samples to effectively improve the classification performance of the semi-supervised task under the condition that label info of the marked samples is always kept constant.
- (3)
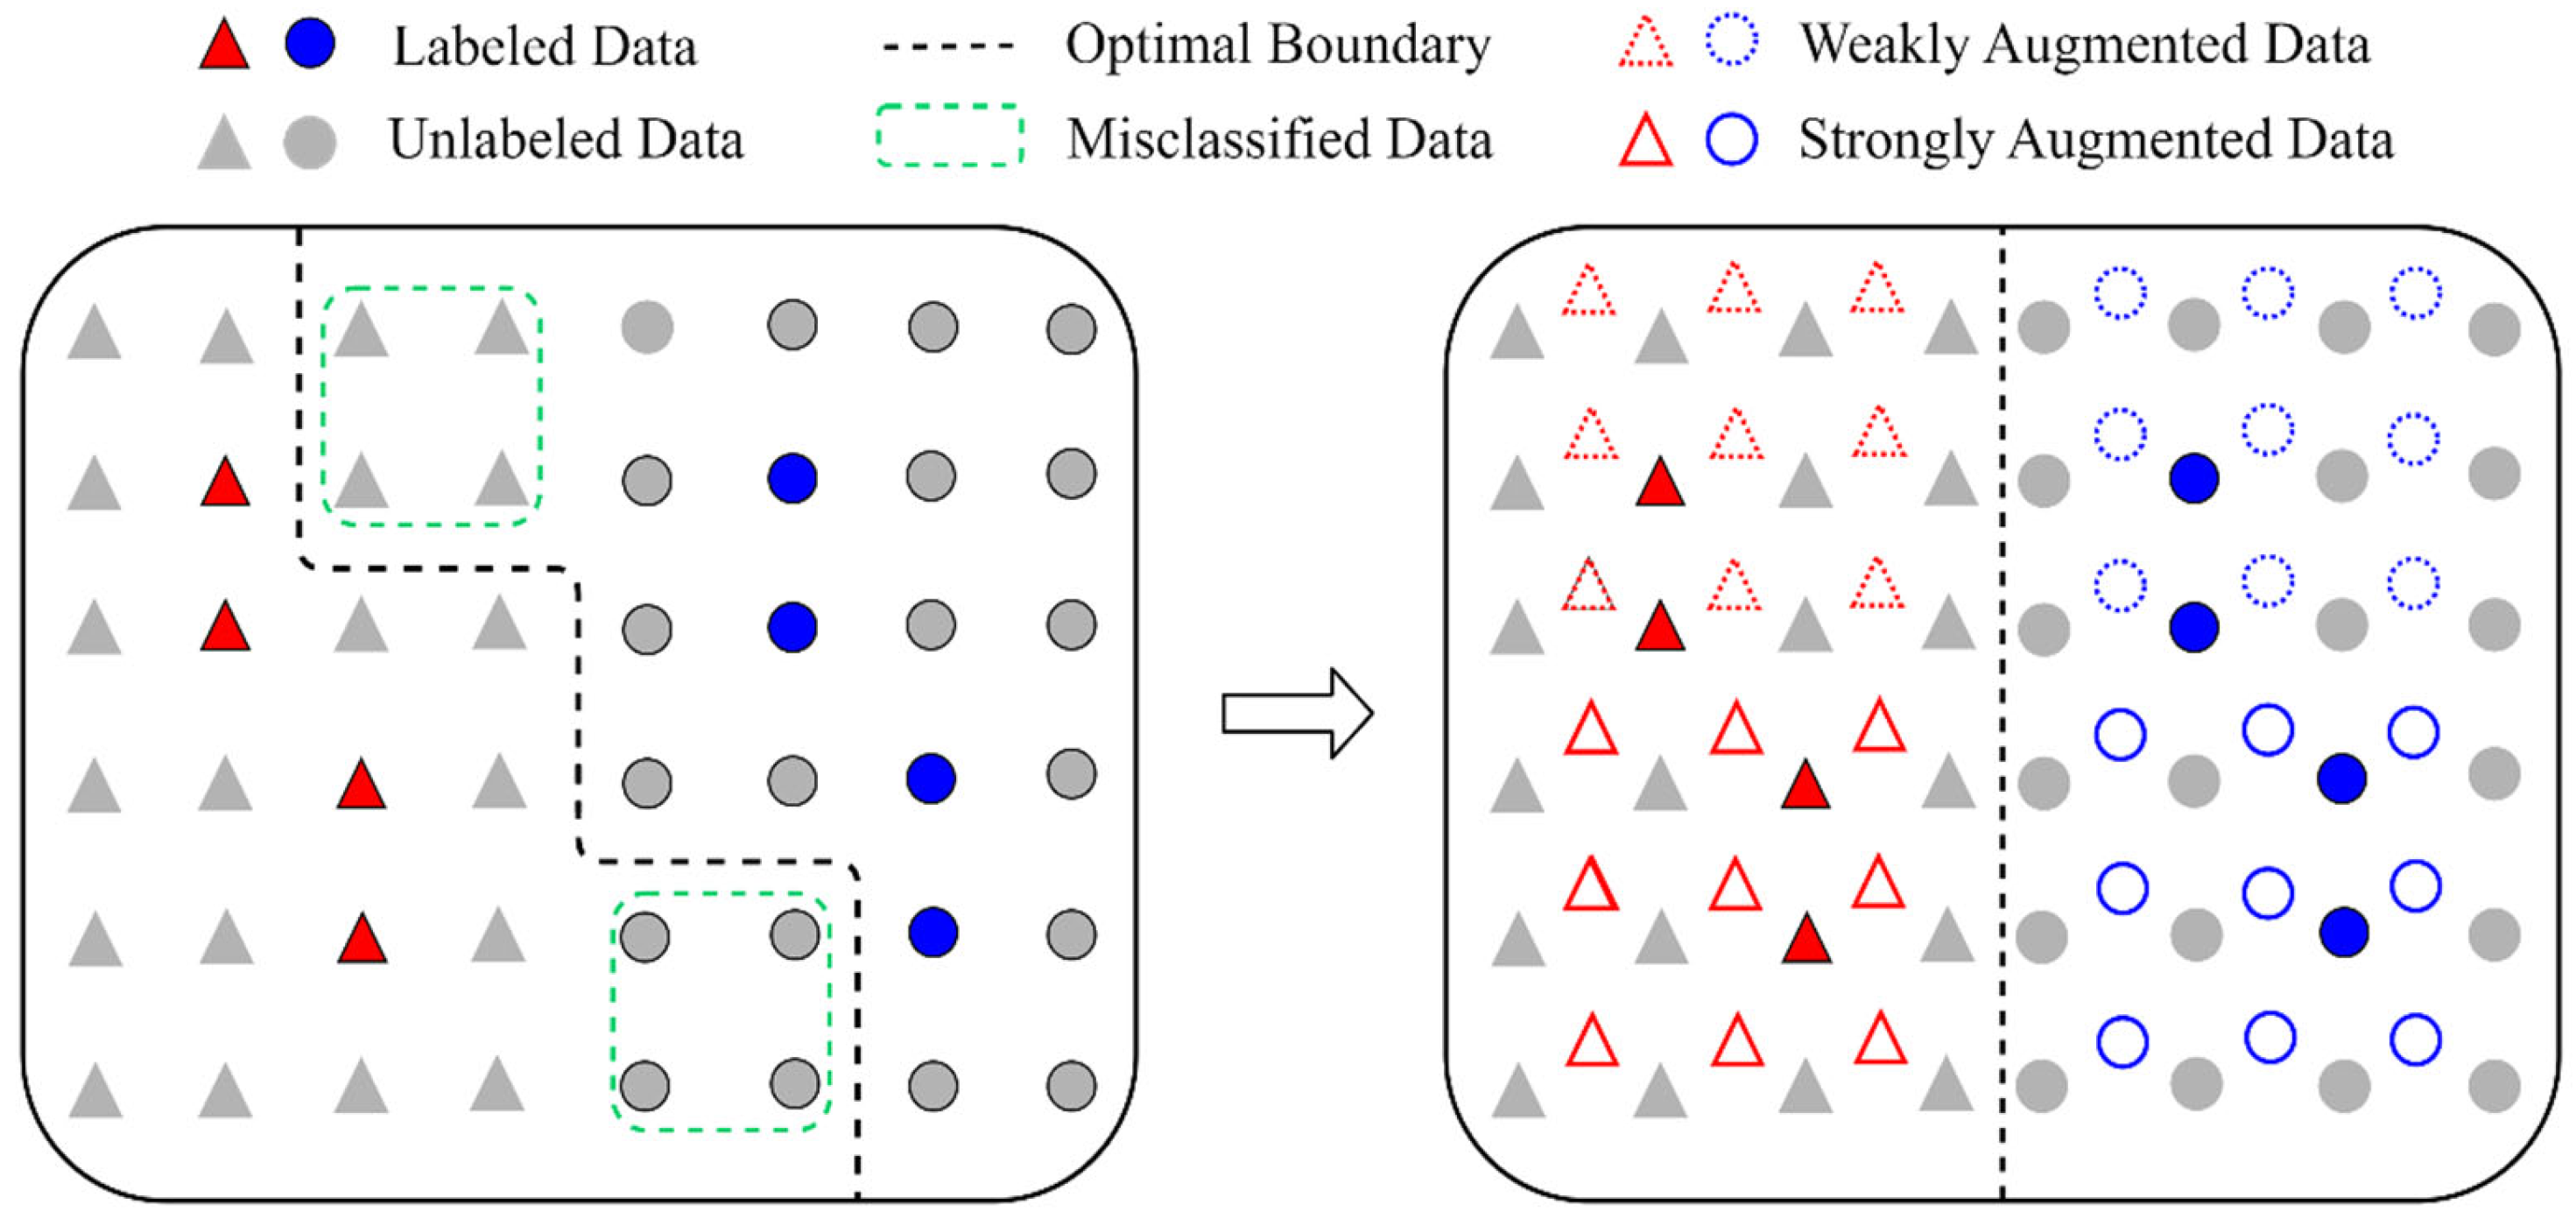
- A prediction mechanism is designed to discriminate the potential label distribution of unlabeled samples after augmentation, and an unsupervised consistency loss function is constructed in order to minimize the distributional gap among unlabeled augmented samples.
2. Basic Theory
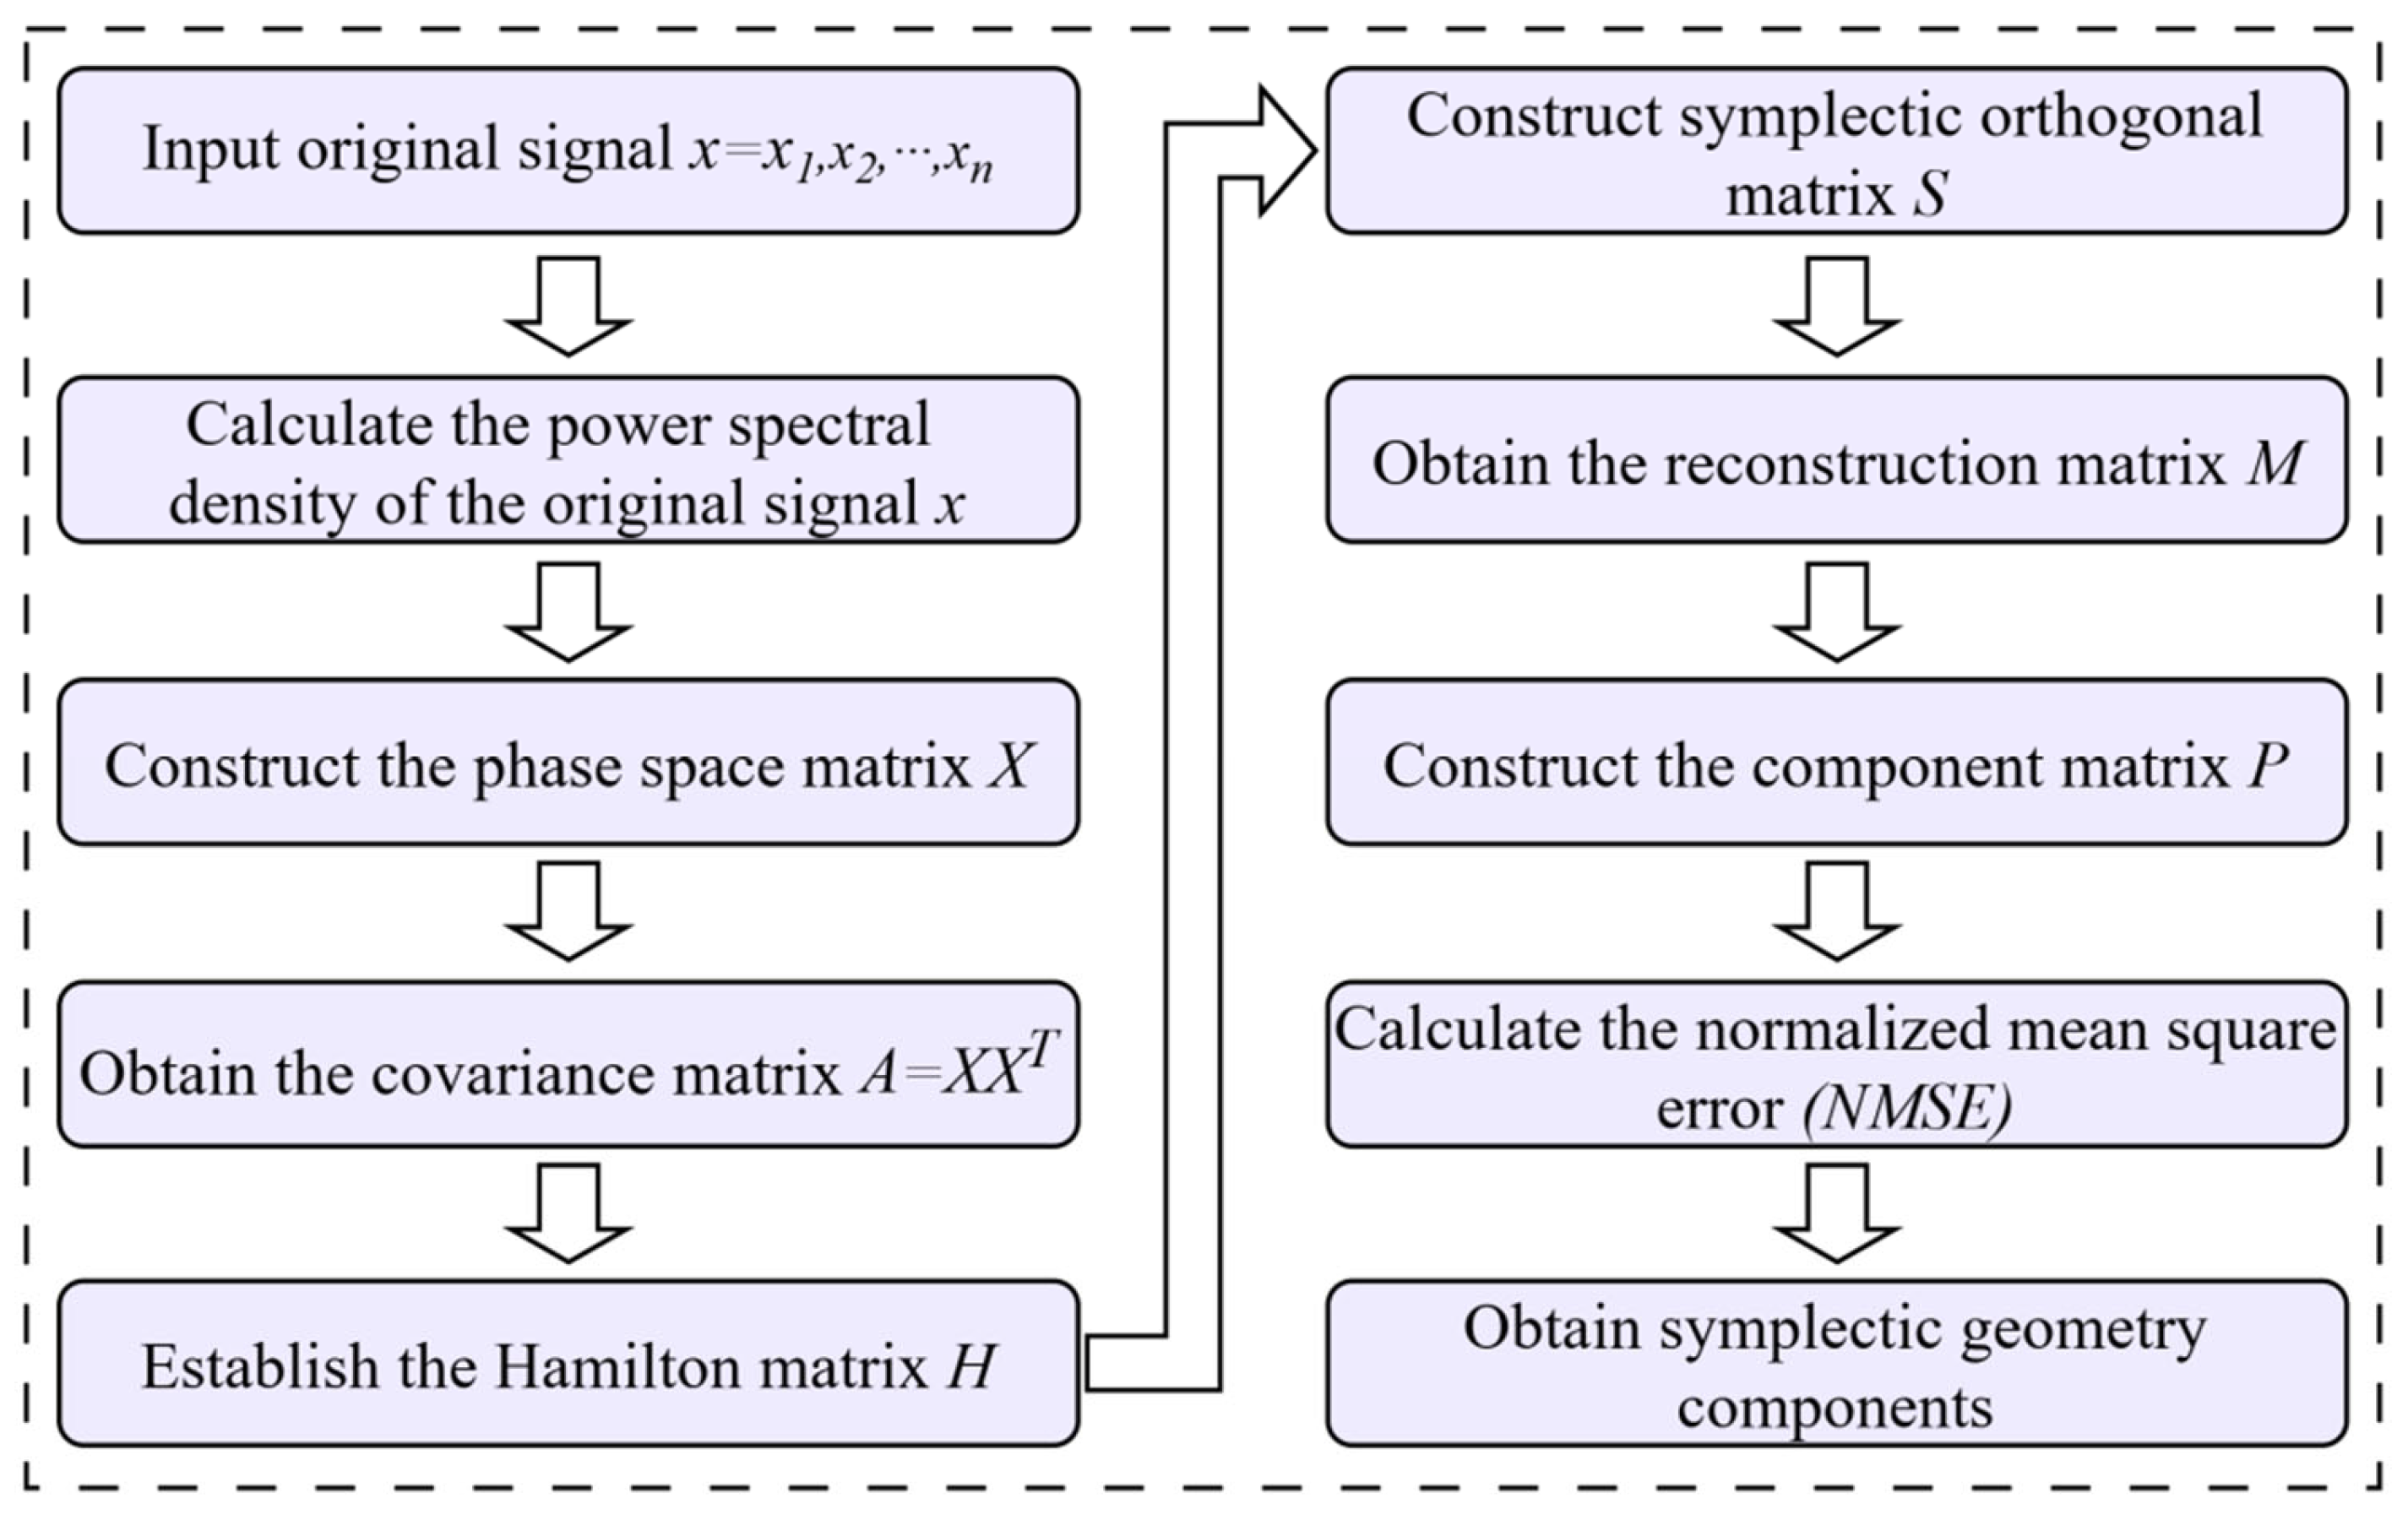
2.1. Symplectic Geometry Modal Decomposition
2.2. Kolmogorov-Arnold Network
3. The Overall Methodological Framework
3.1. A Data Augmentation Approach Based on Improved Symplectic Geometry
3.2. The Objective Function
3.3. Overall Modeling Framework for Fault Diagnosis
| Algorithm 1. The pseudo-code for DACR approach |
| 1: Input: Labeled dataset ; unlabeled dataset ; confidence threshold ; unlabeled data ratio ; unlabeled loss weight ; the maximum iterations epoch; batch size . 2: Initialize the network model parameters. 3: Weak enhancement for labeled data. . 4: Weak and strong enhancement of unlabeled data. , . 5: for epoch = 1 to epoch do. 6: for = 1 to do. 7: Cross-entropy loss for labeled data . 8: for = 1 to do. 9: Weakly enhanced label prediction for unlabeled data. , . 10: end for 11: Cross-entropy loss for pseudo-label and strongly enhanced prediction results . 12: Calculate . 13: Calculate and update network model parameters. 14: end for. 15: end for. 16: Return The trained network model. |
4. Experimental Analysis
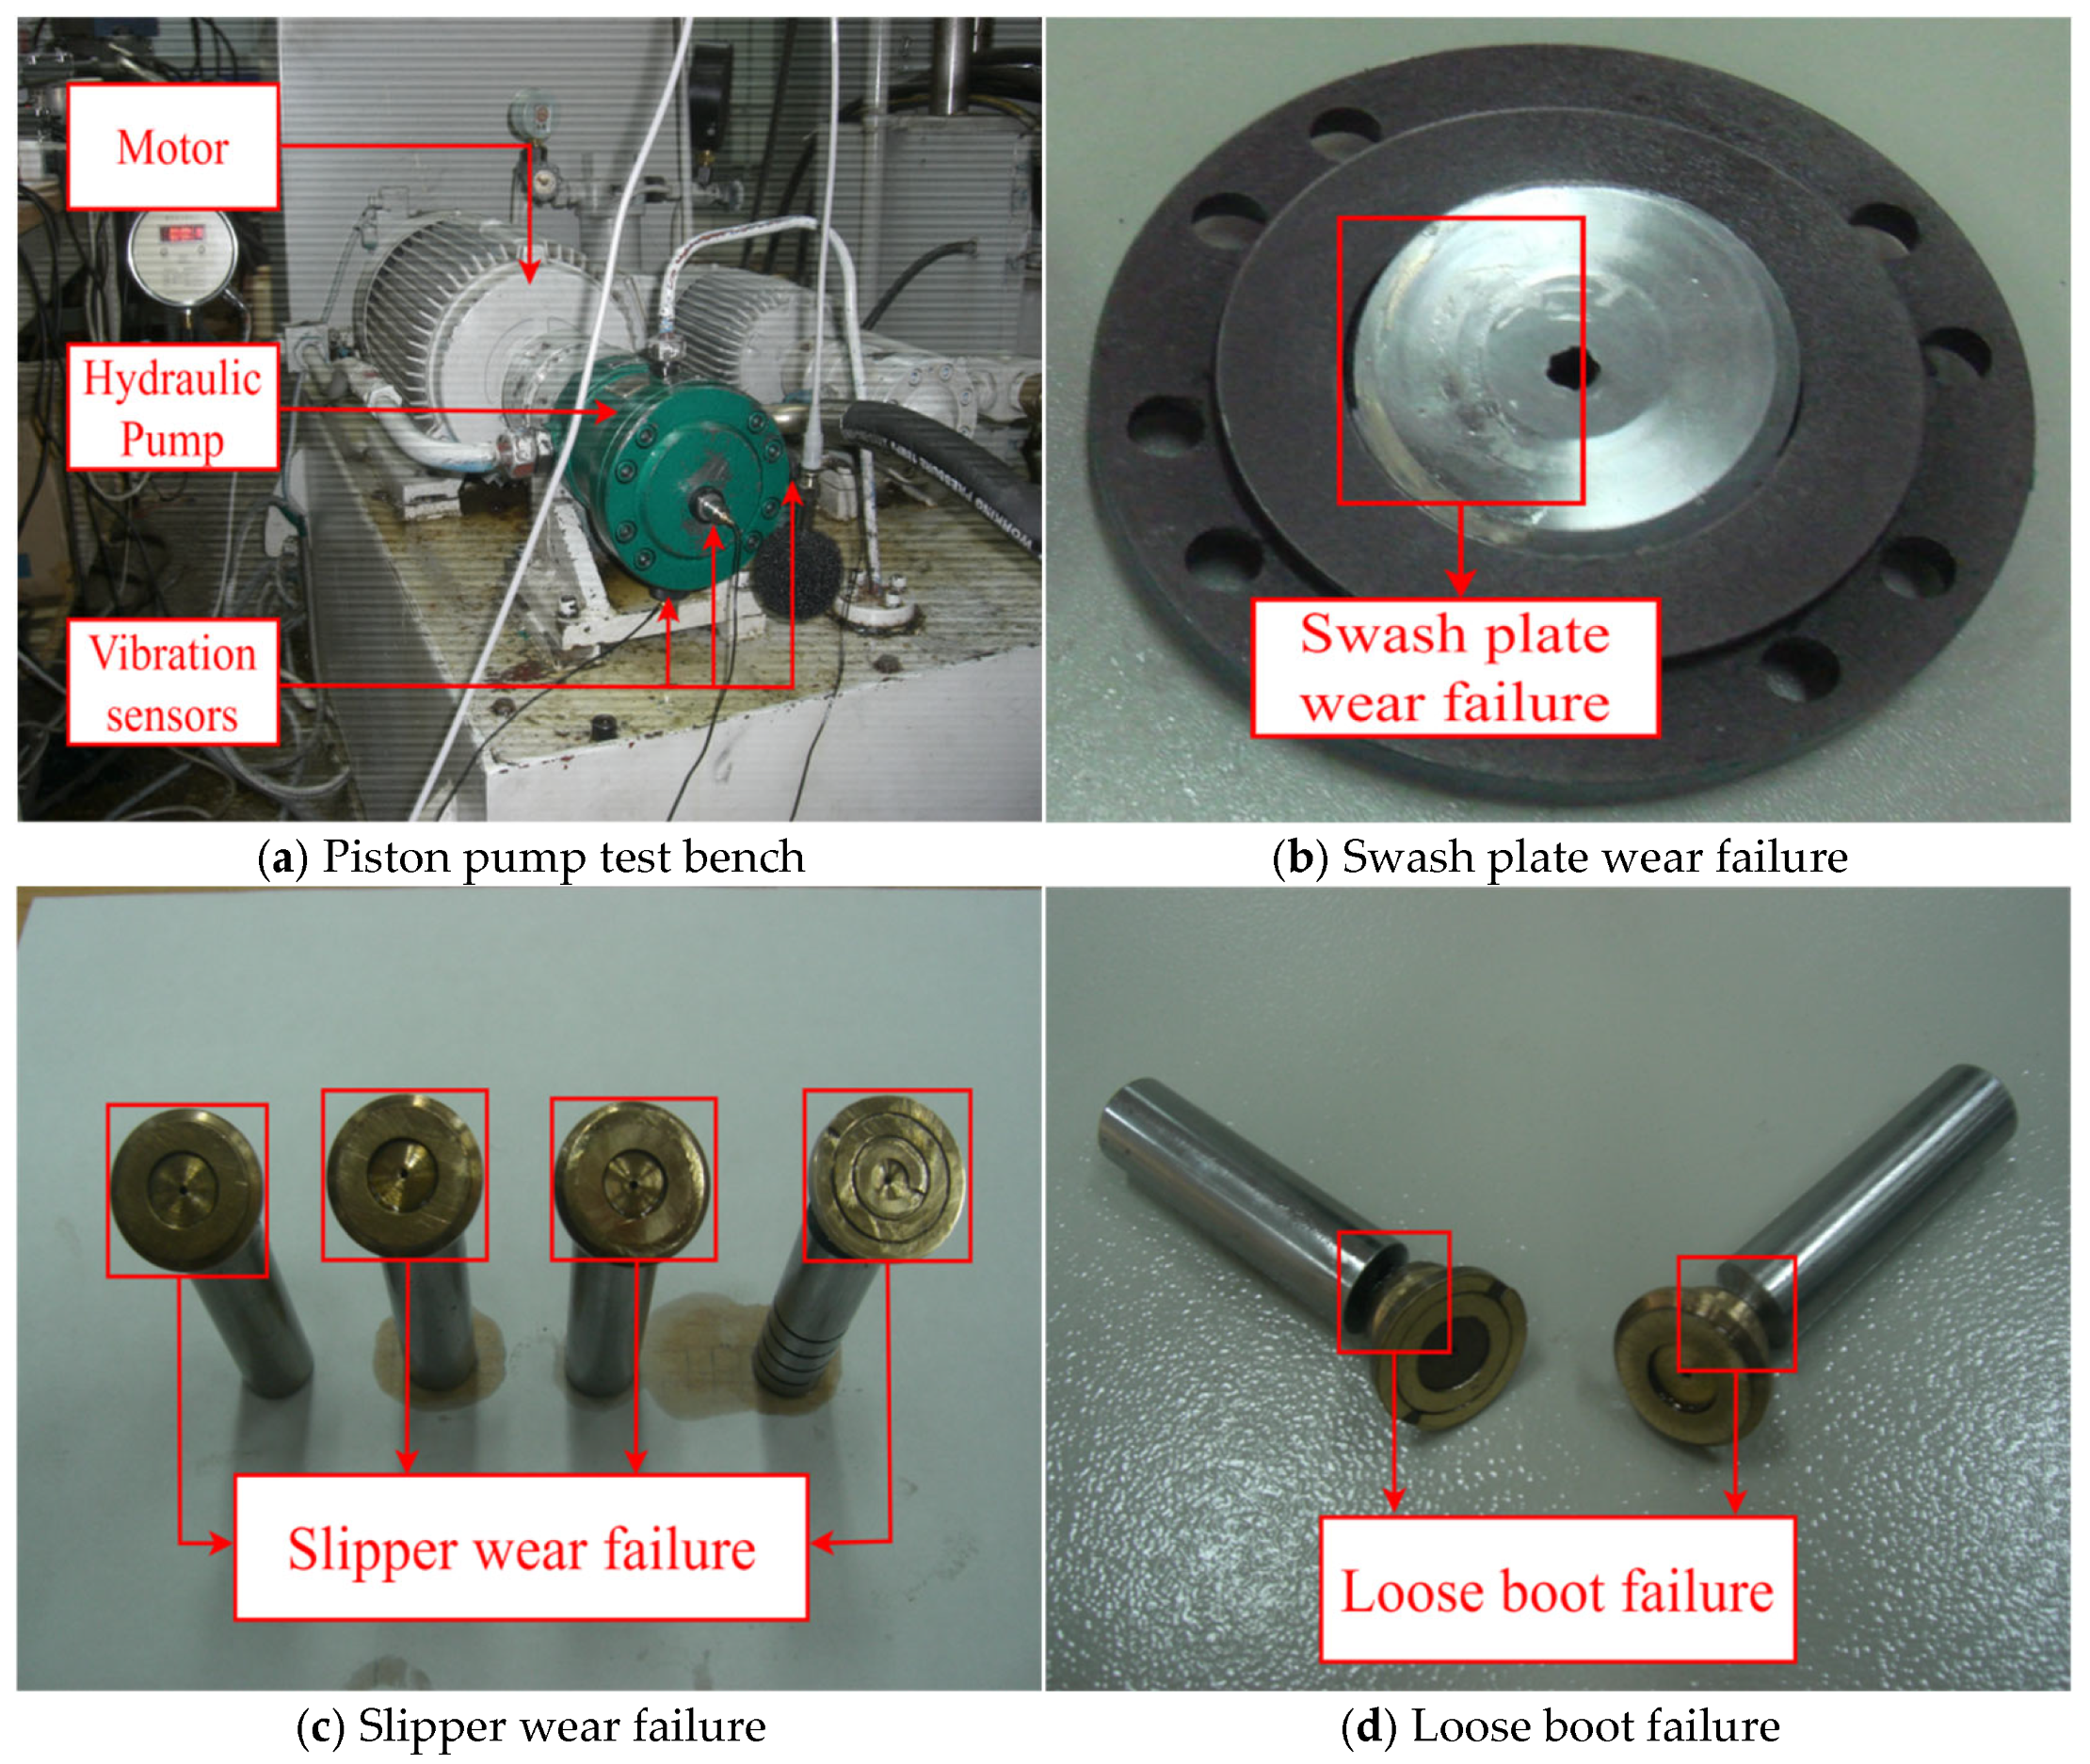
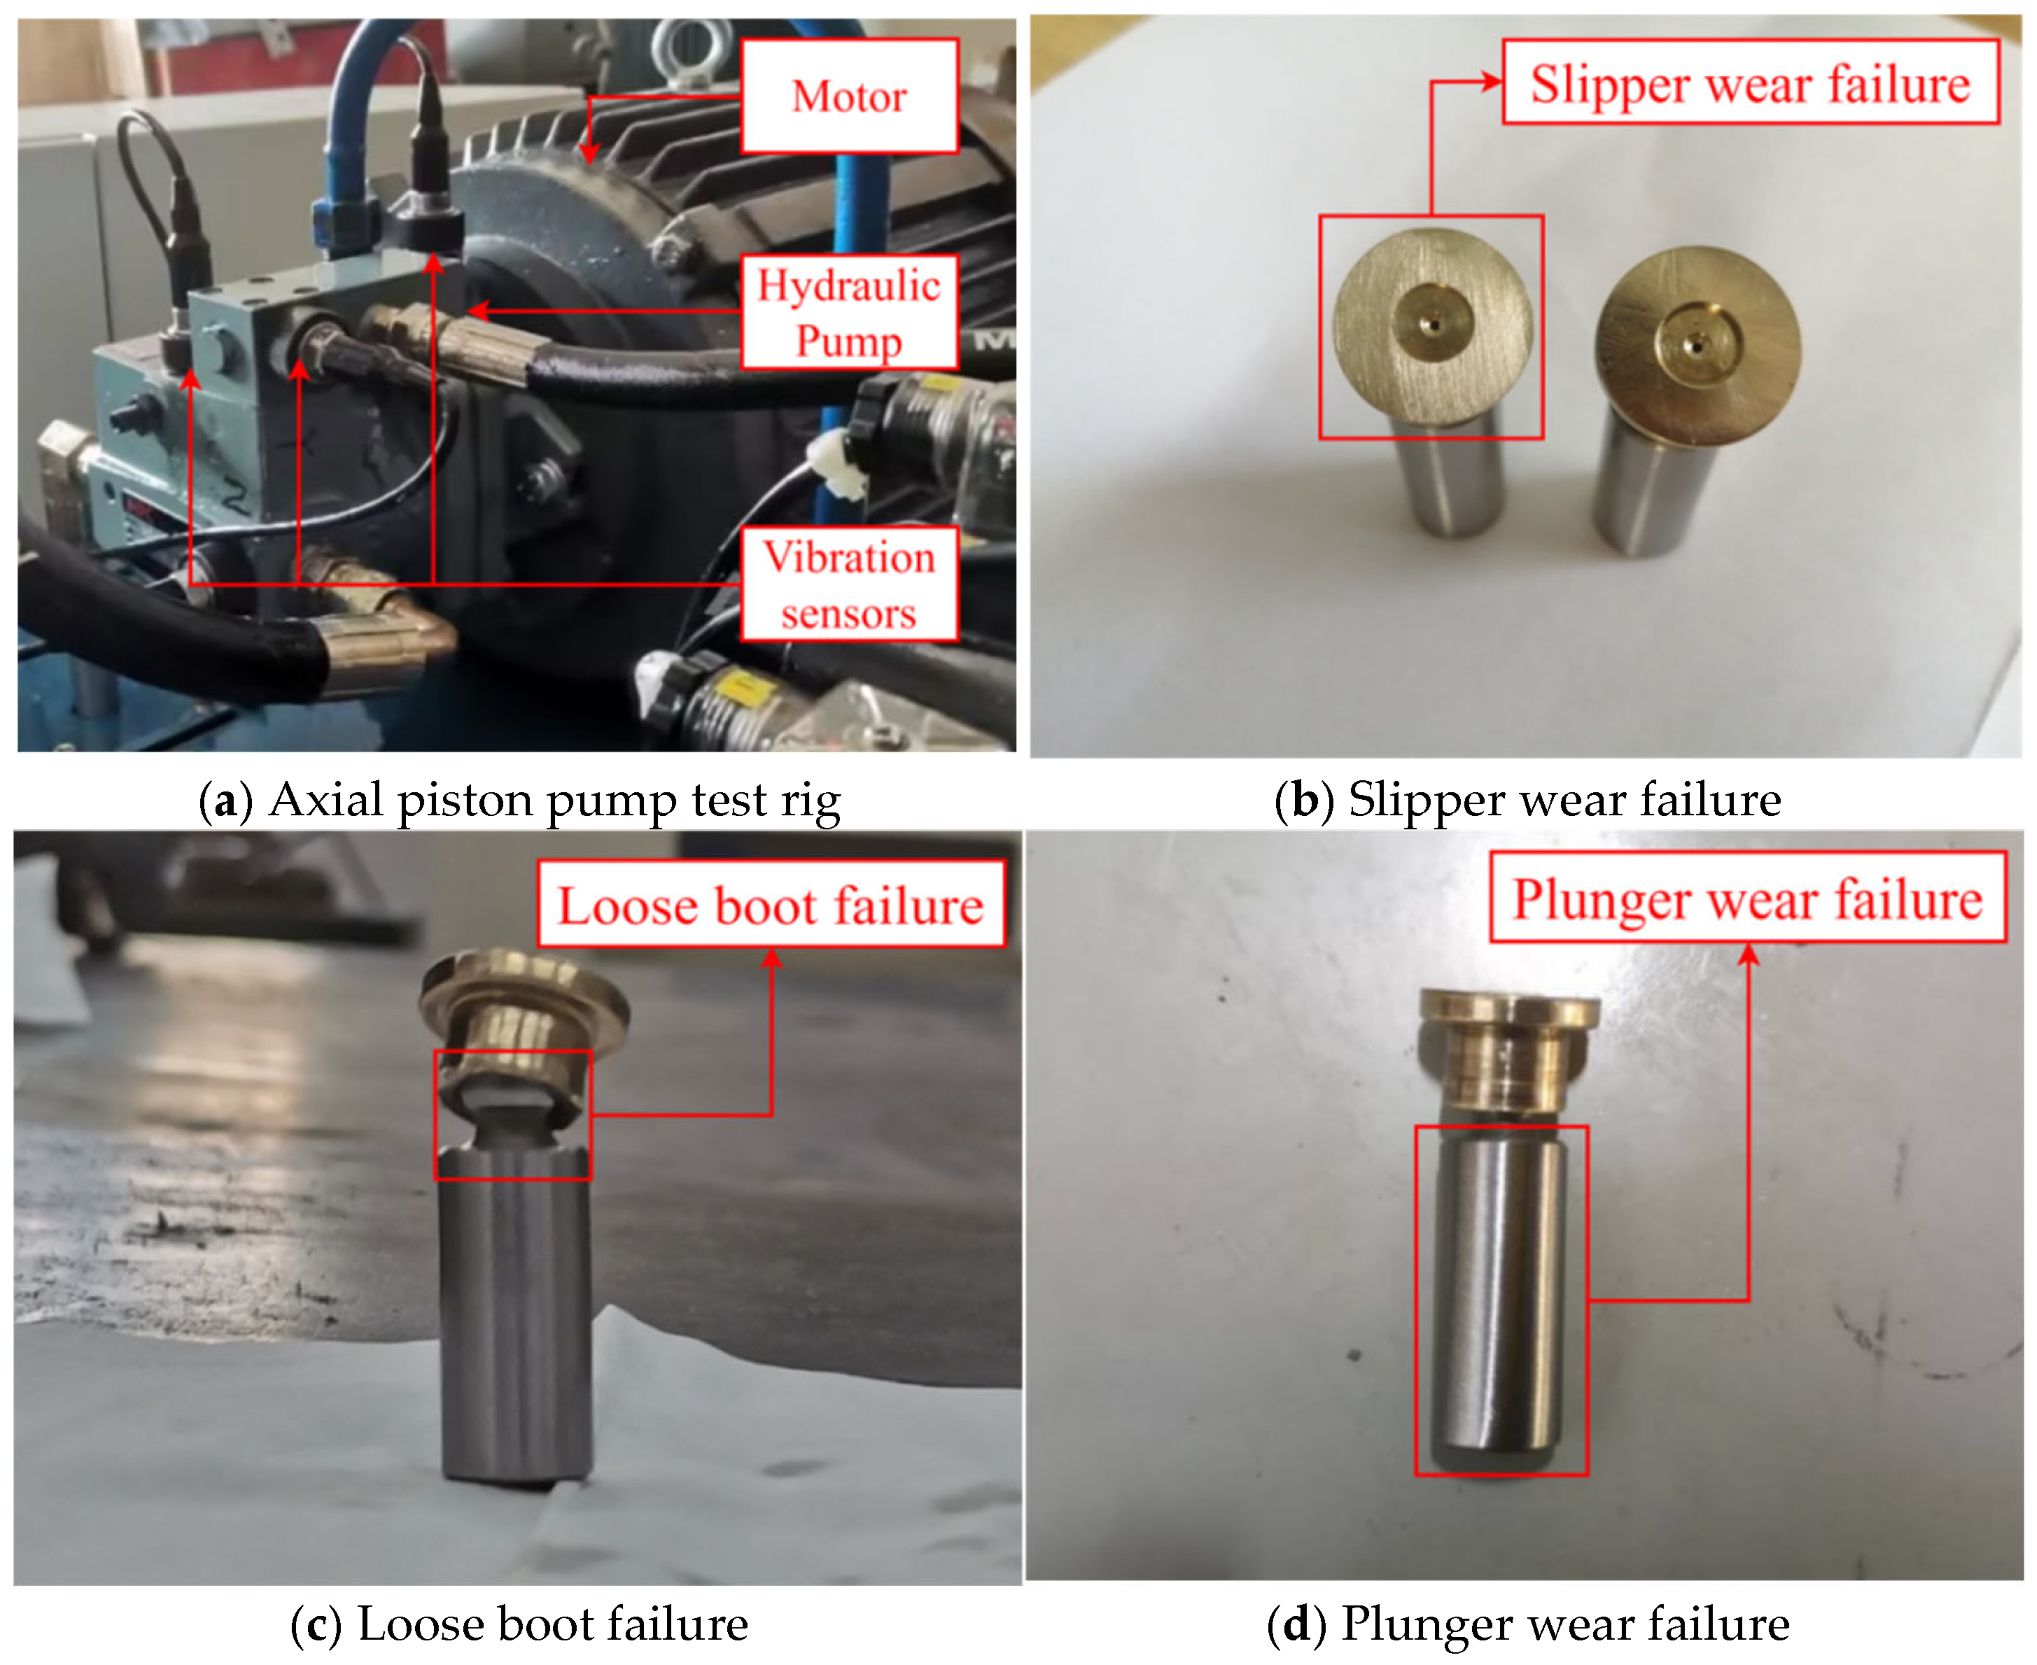
4.1. Case 1: Type 10MCY14-1B Fault Emulation Test Platform
4.2. Case 2: Type P08-B3F-R-01 Fault Emulation Test Platform
4.3. DACR Model Performance with Distinct Labeled Sample Proportions
4.4. DACR Model Performance Under Different Noise Levels
5. Conclusions
- (1)
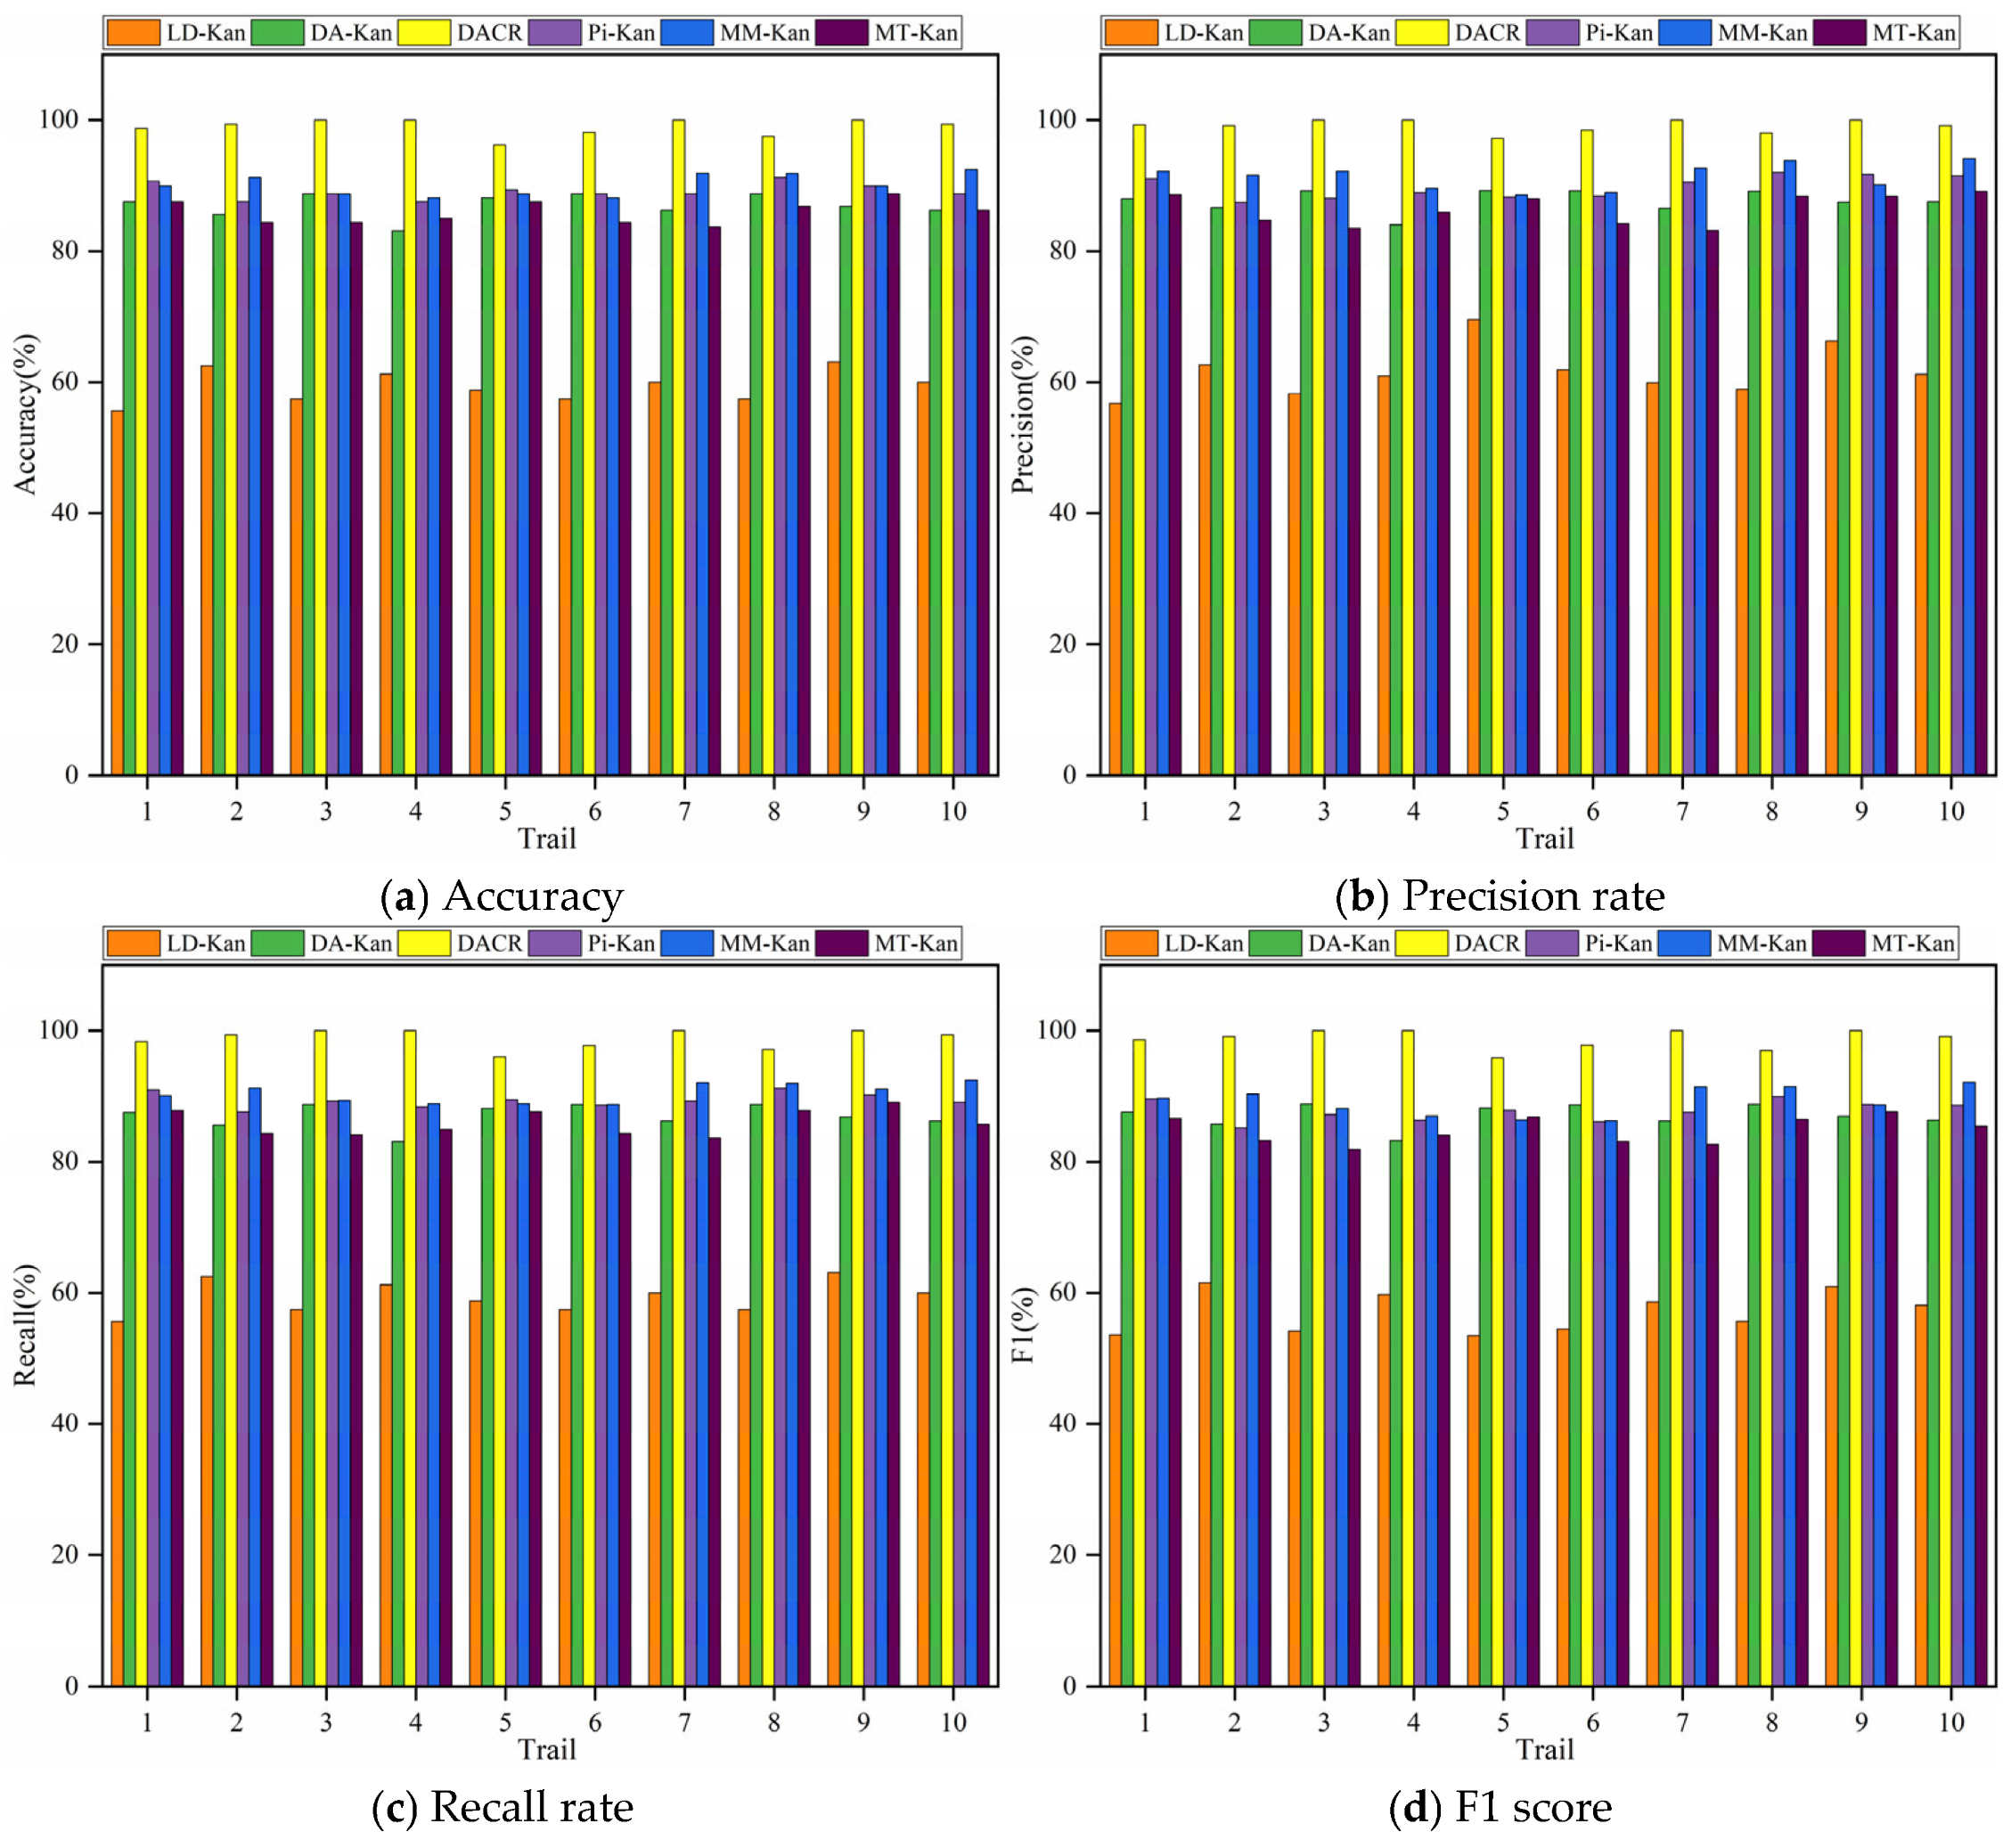
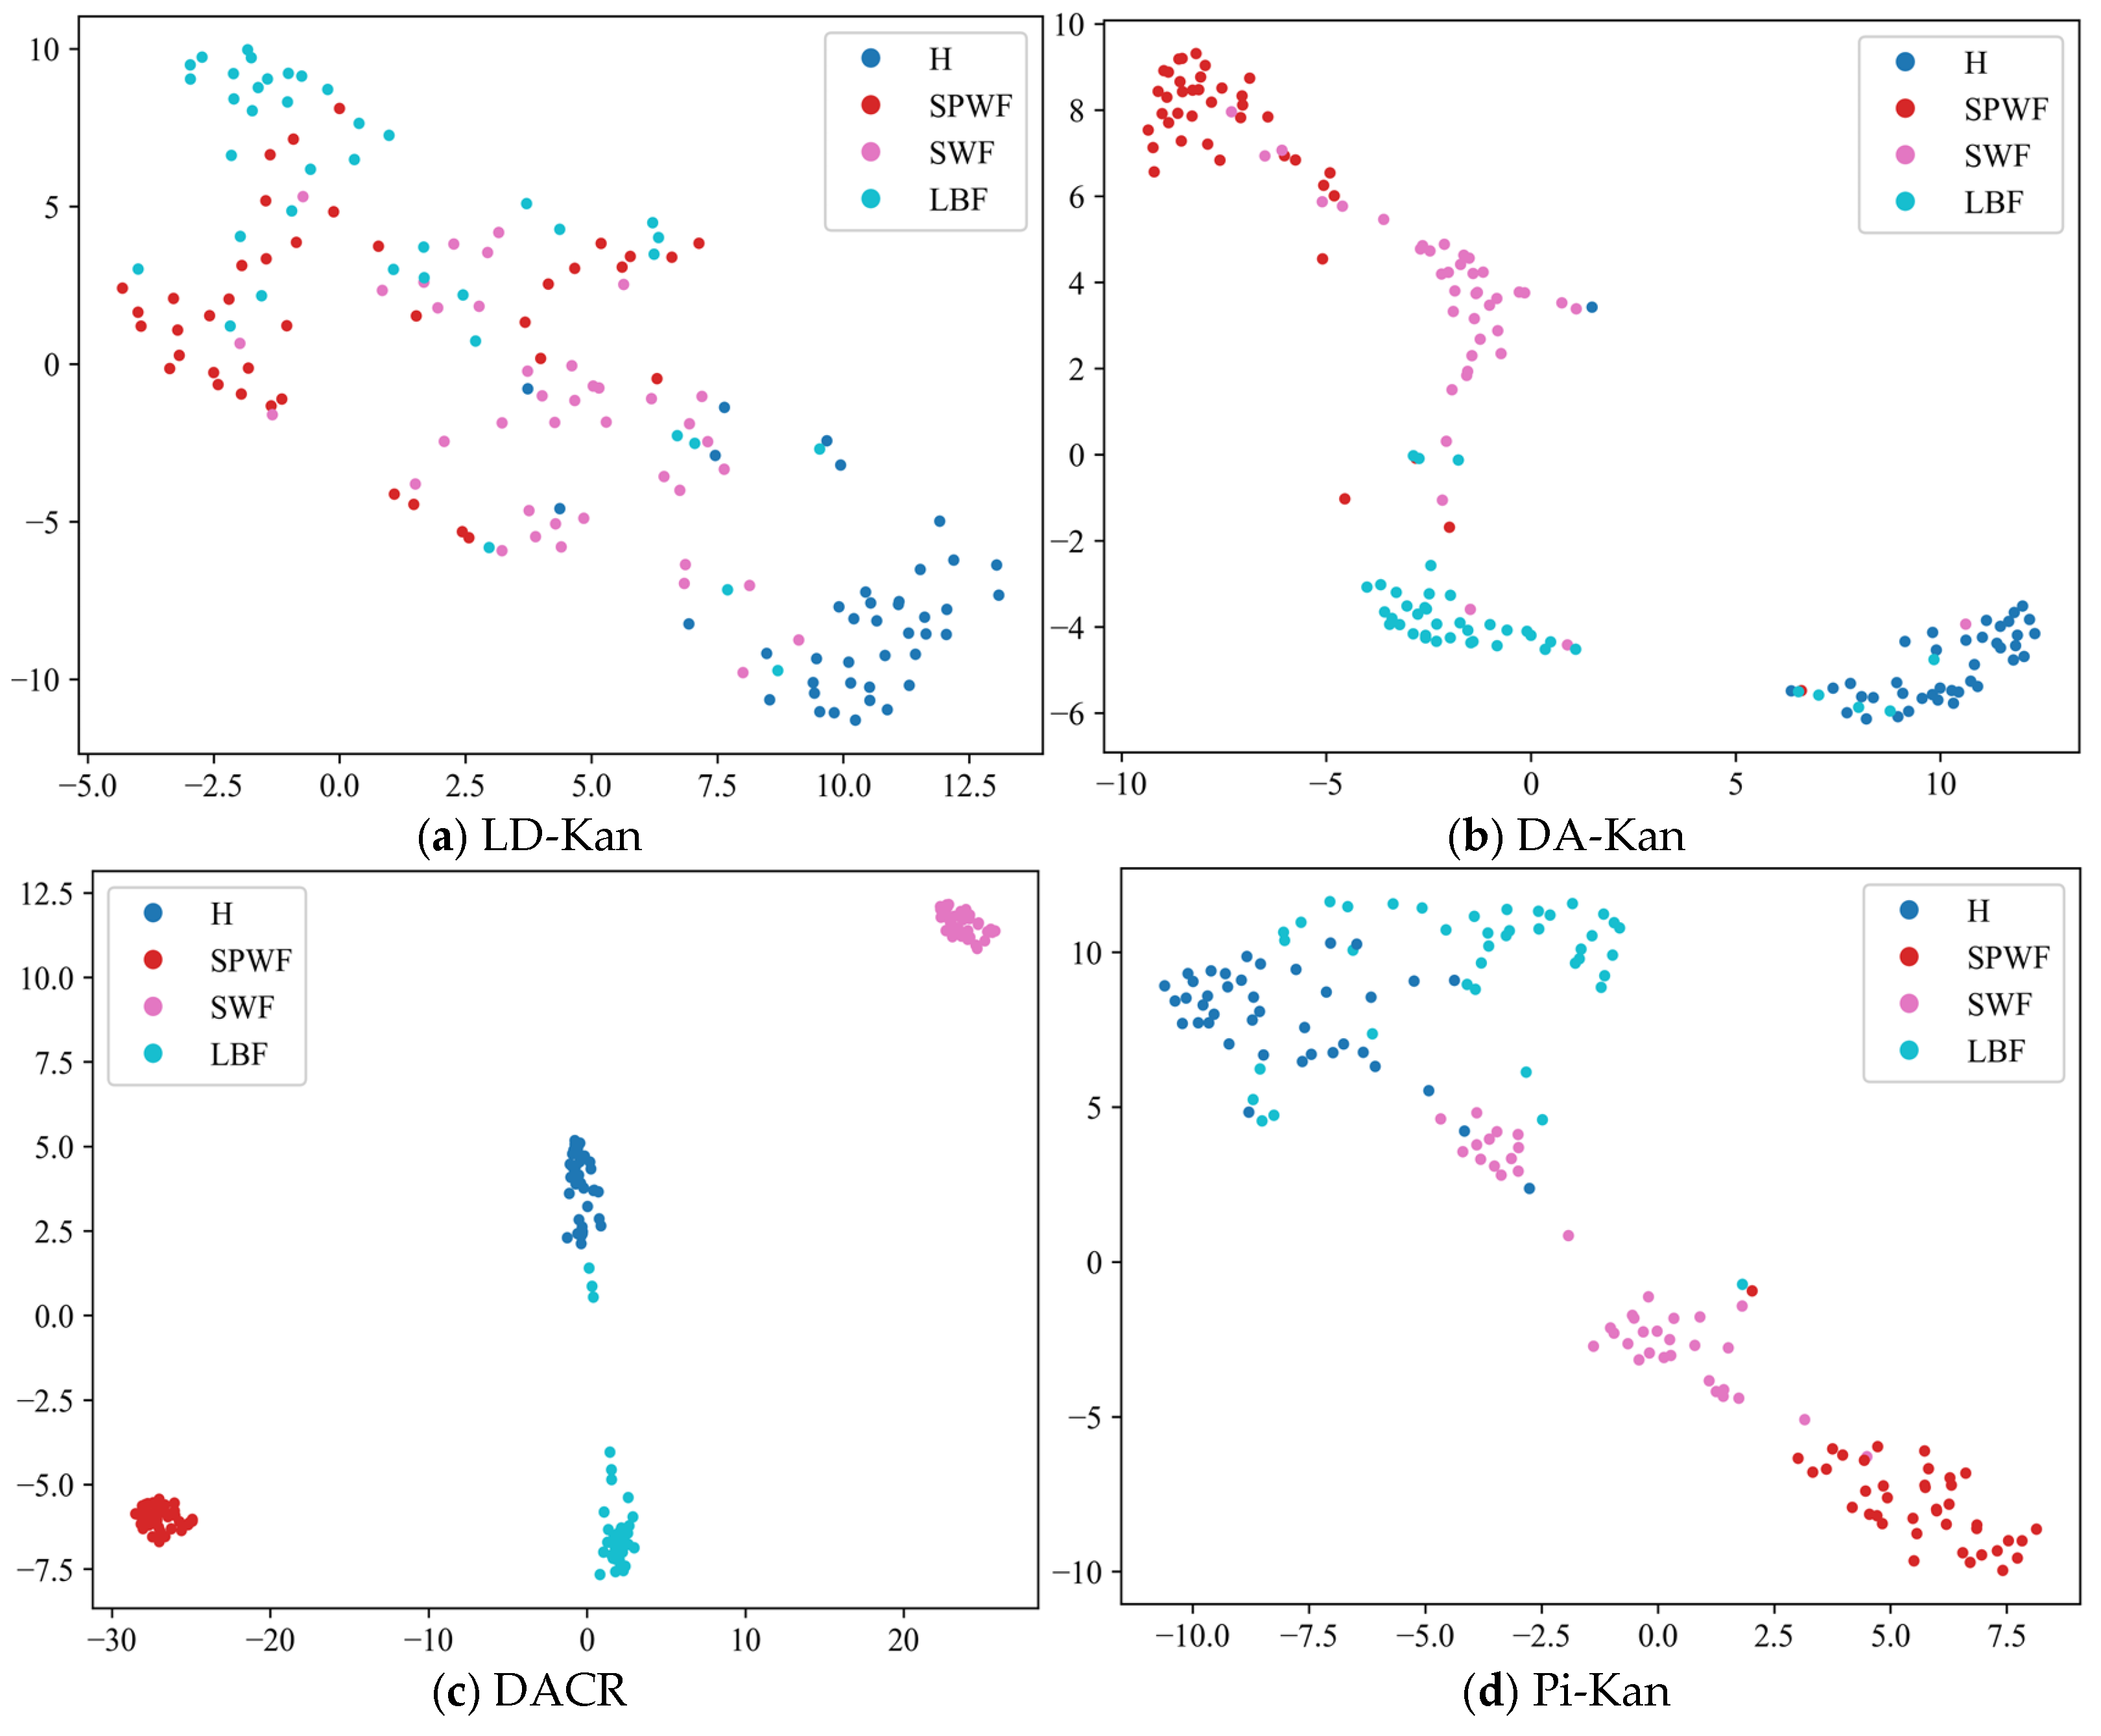
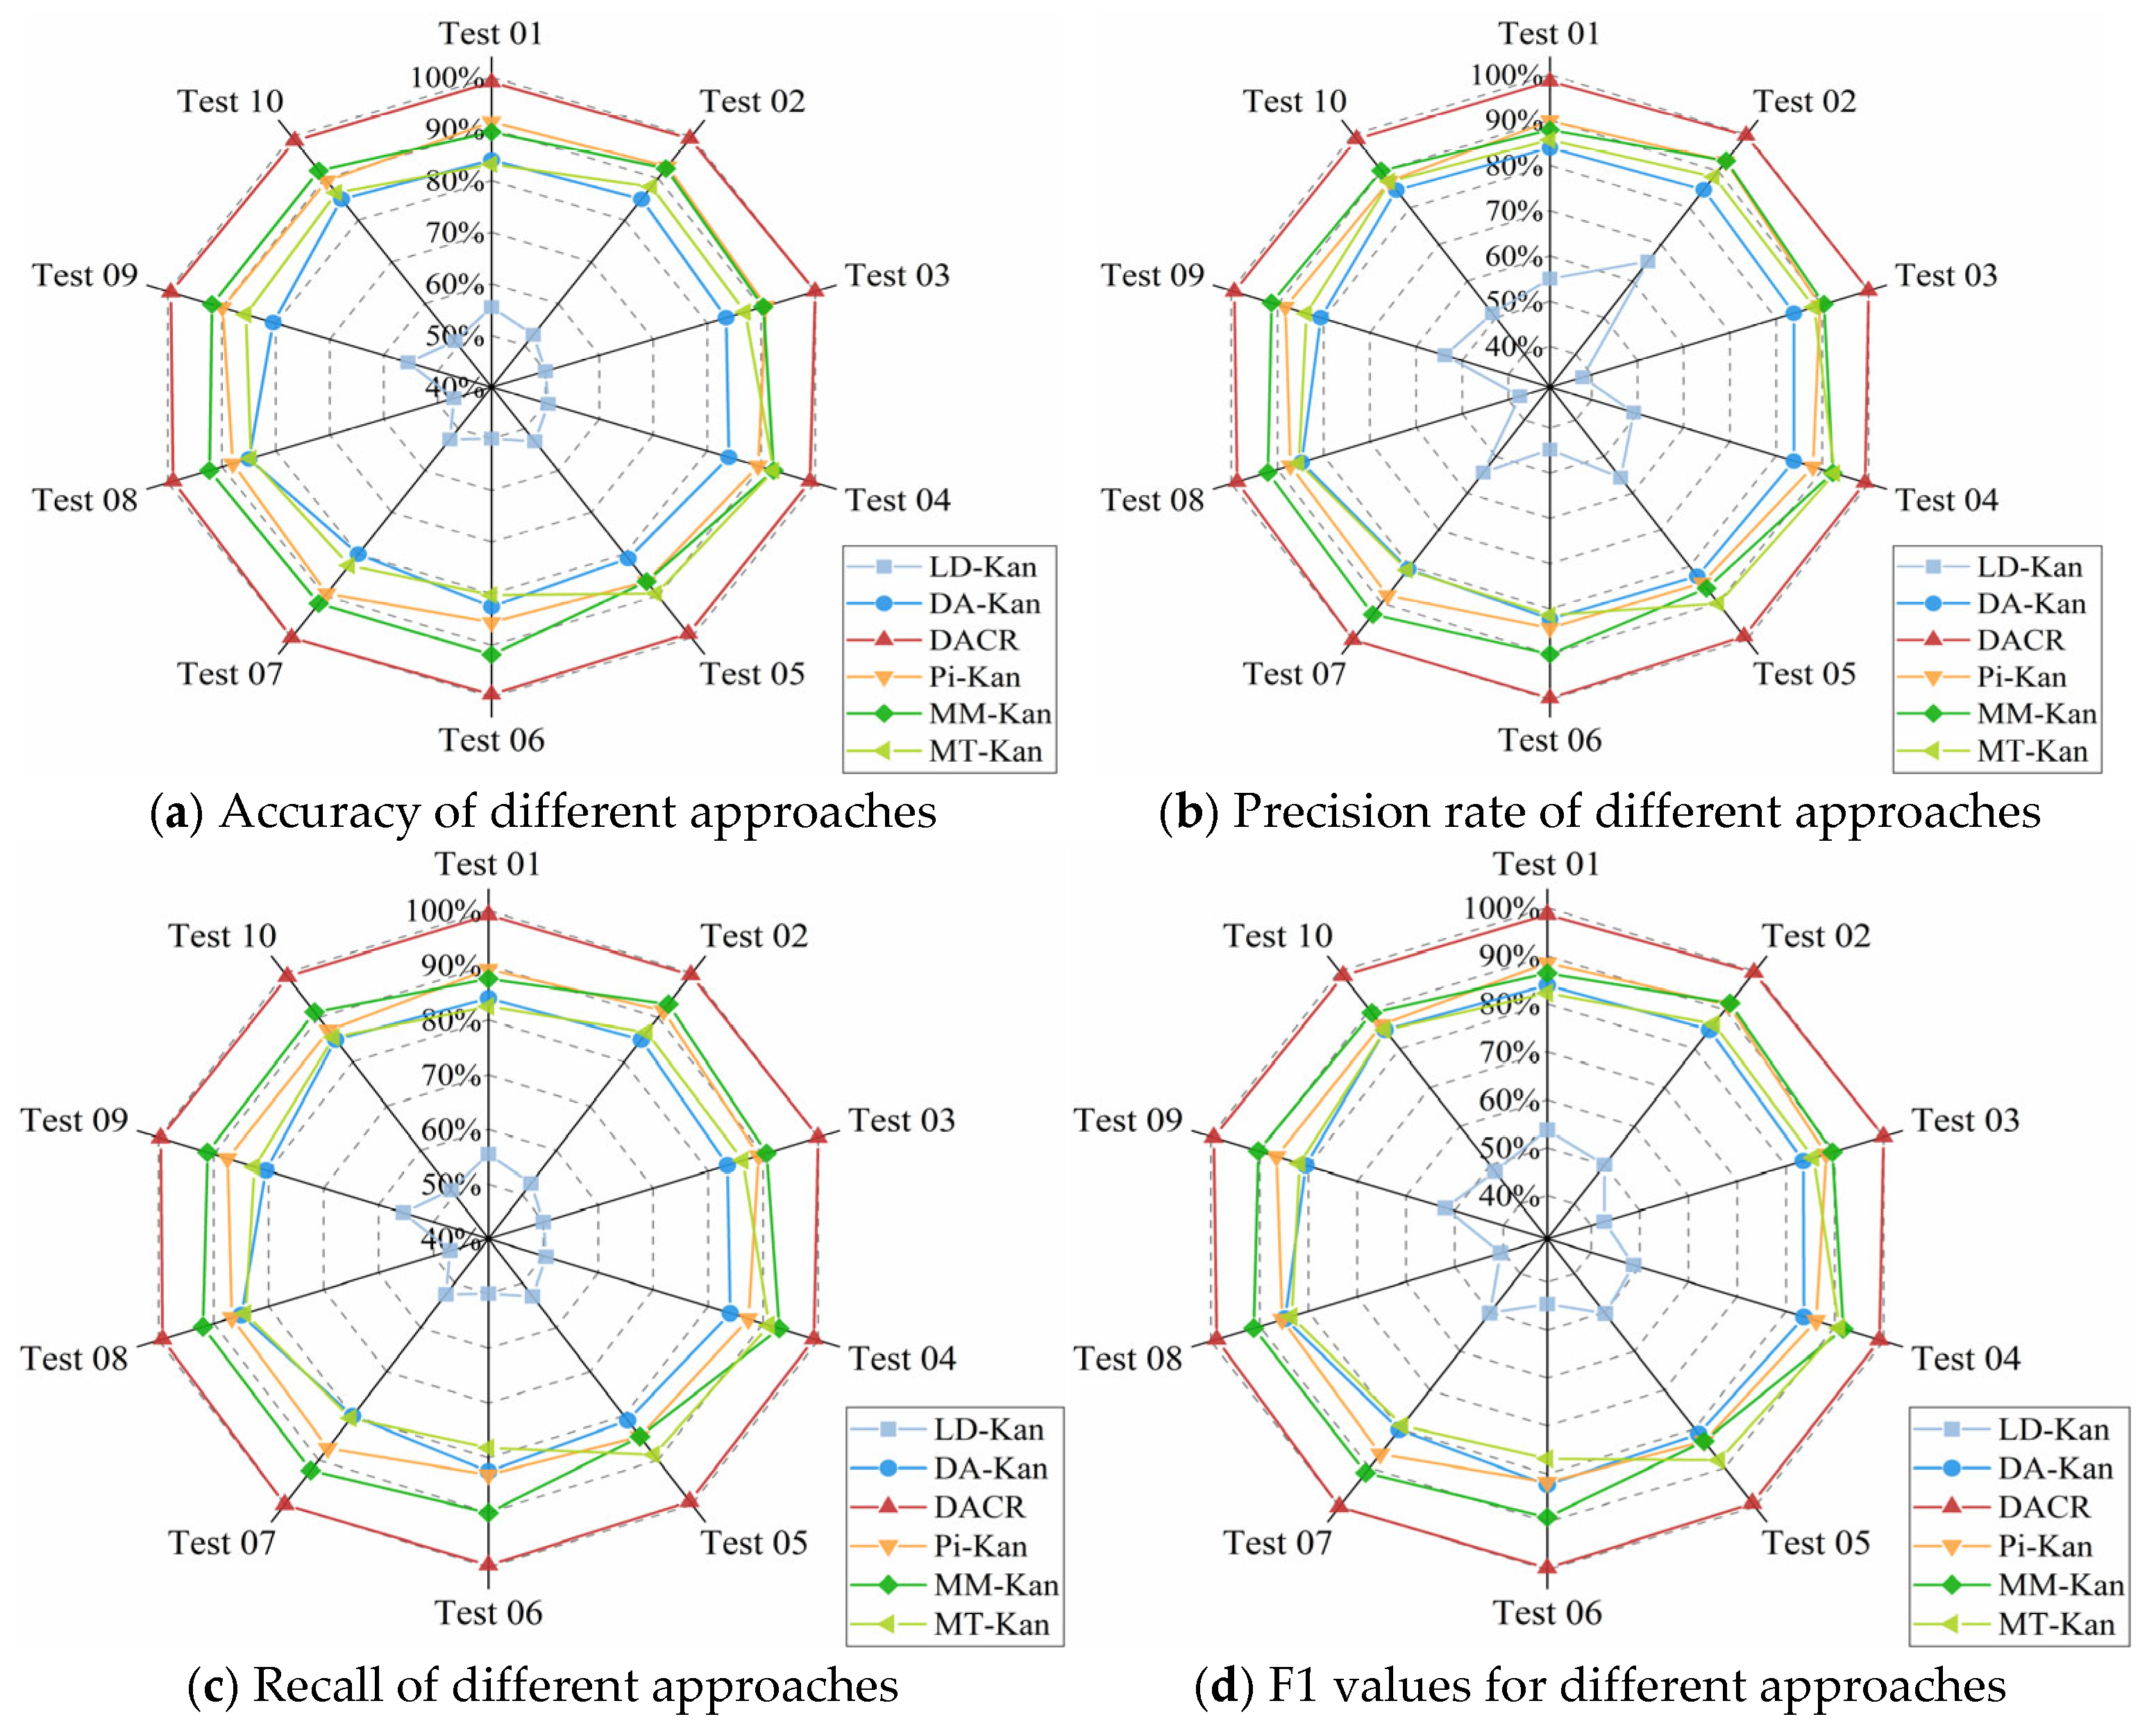
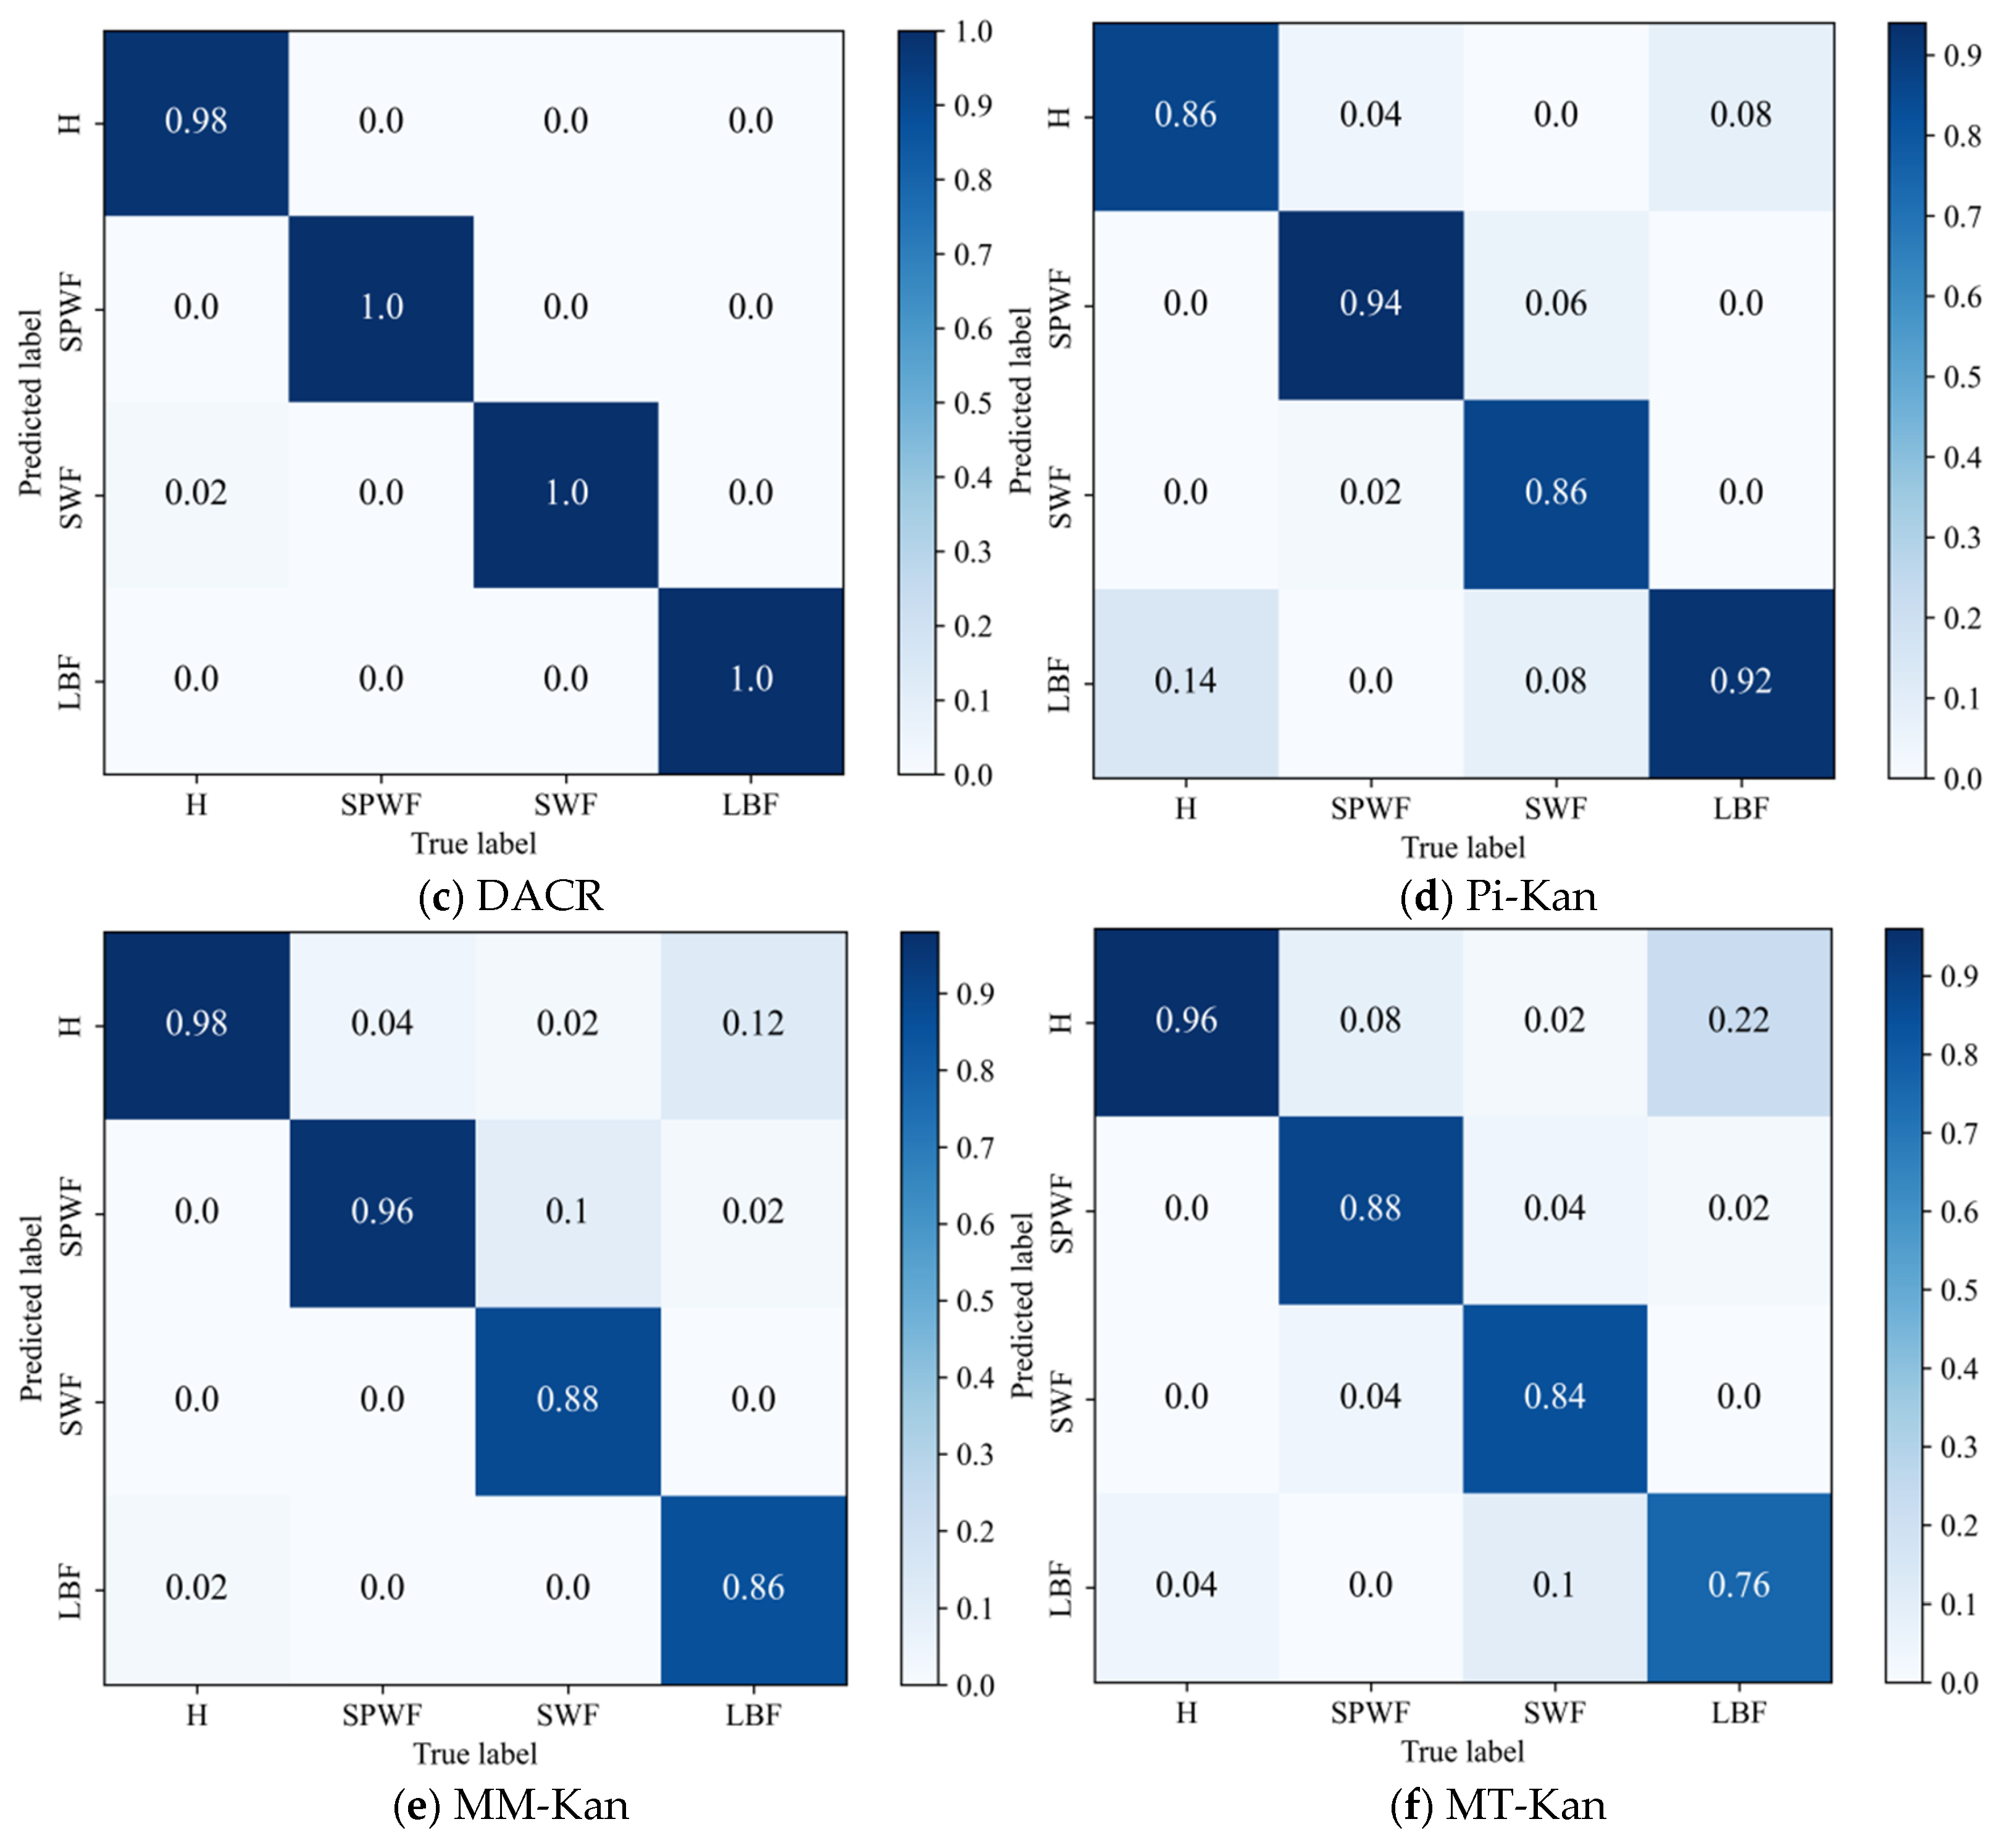
- The results of the comparison trials with other approaches indicate that the DACR approach proposed in this research has excellent classification capability for networks trained on pump class datasets under limited labeled sample conditions. In ten trials, the DACR approach is ahead of other approaches in accuracy, precision, recall, and F1 value performance, while the overall volatility is kept at the lowest level.
- (2)
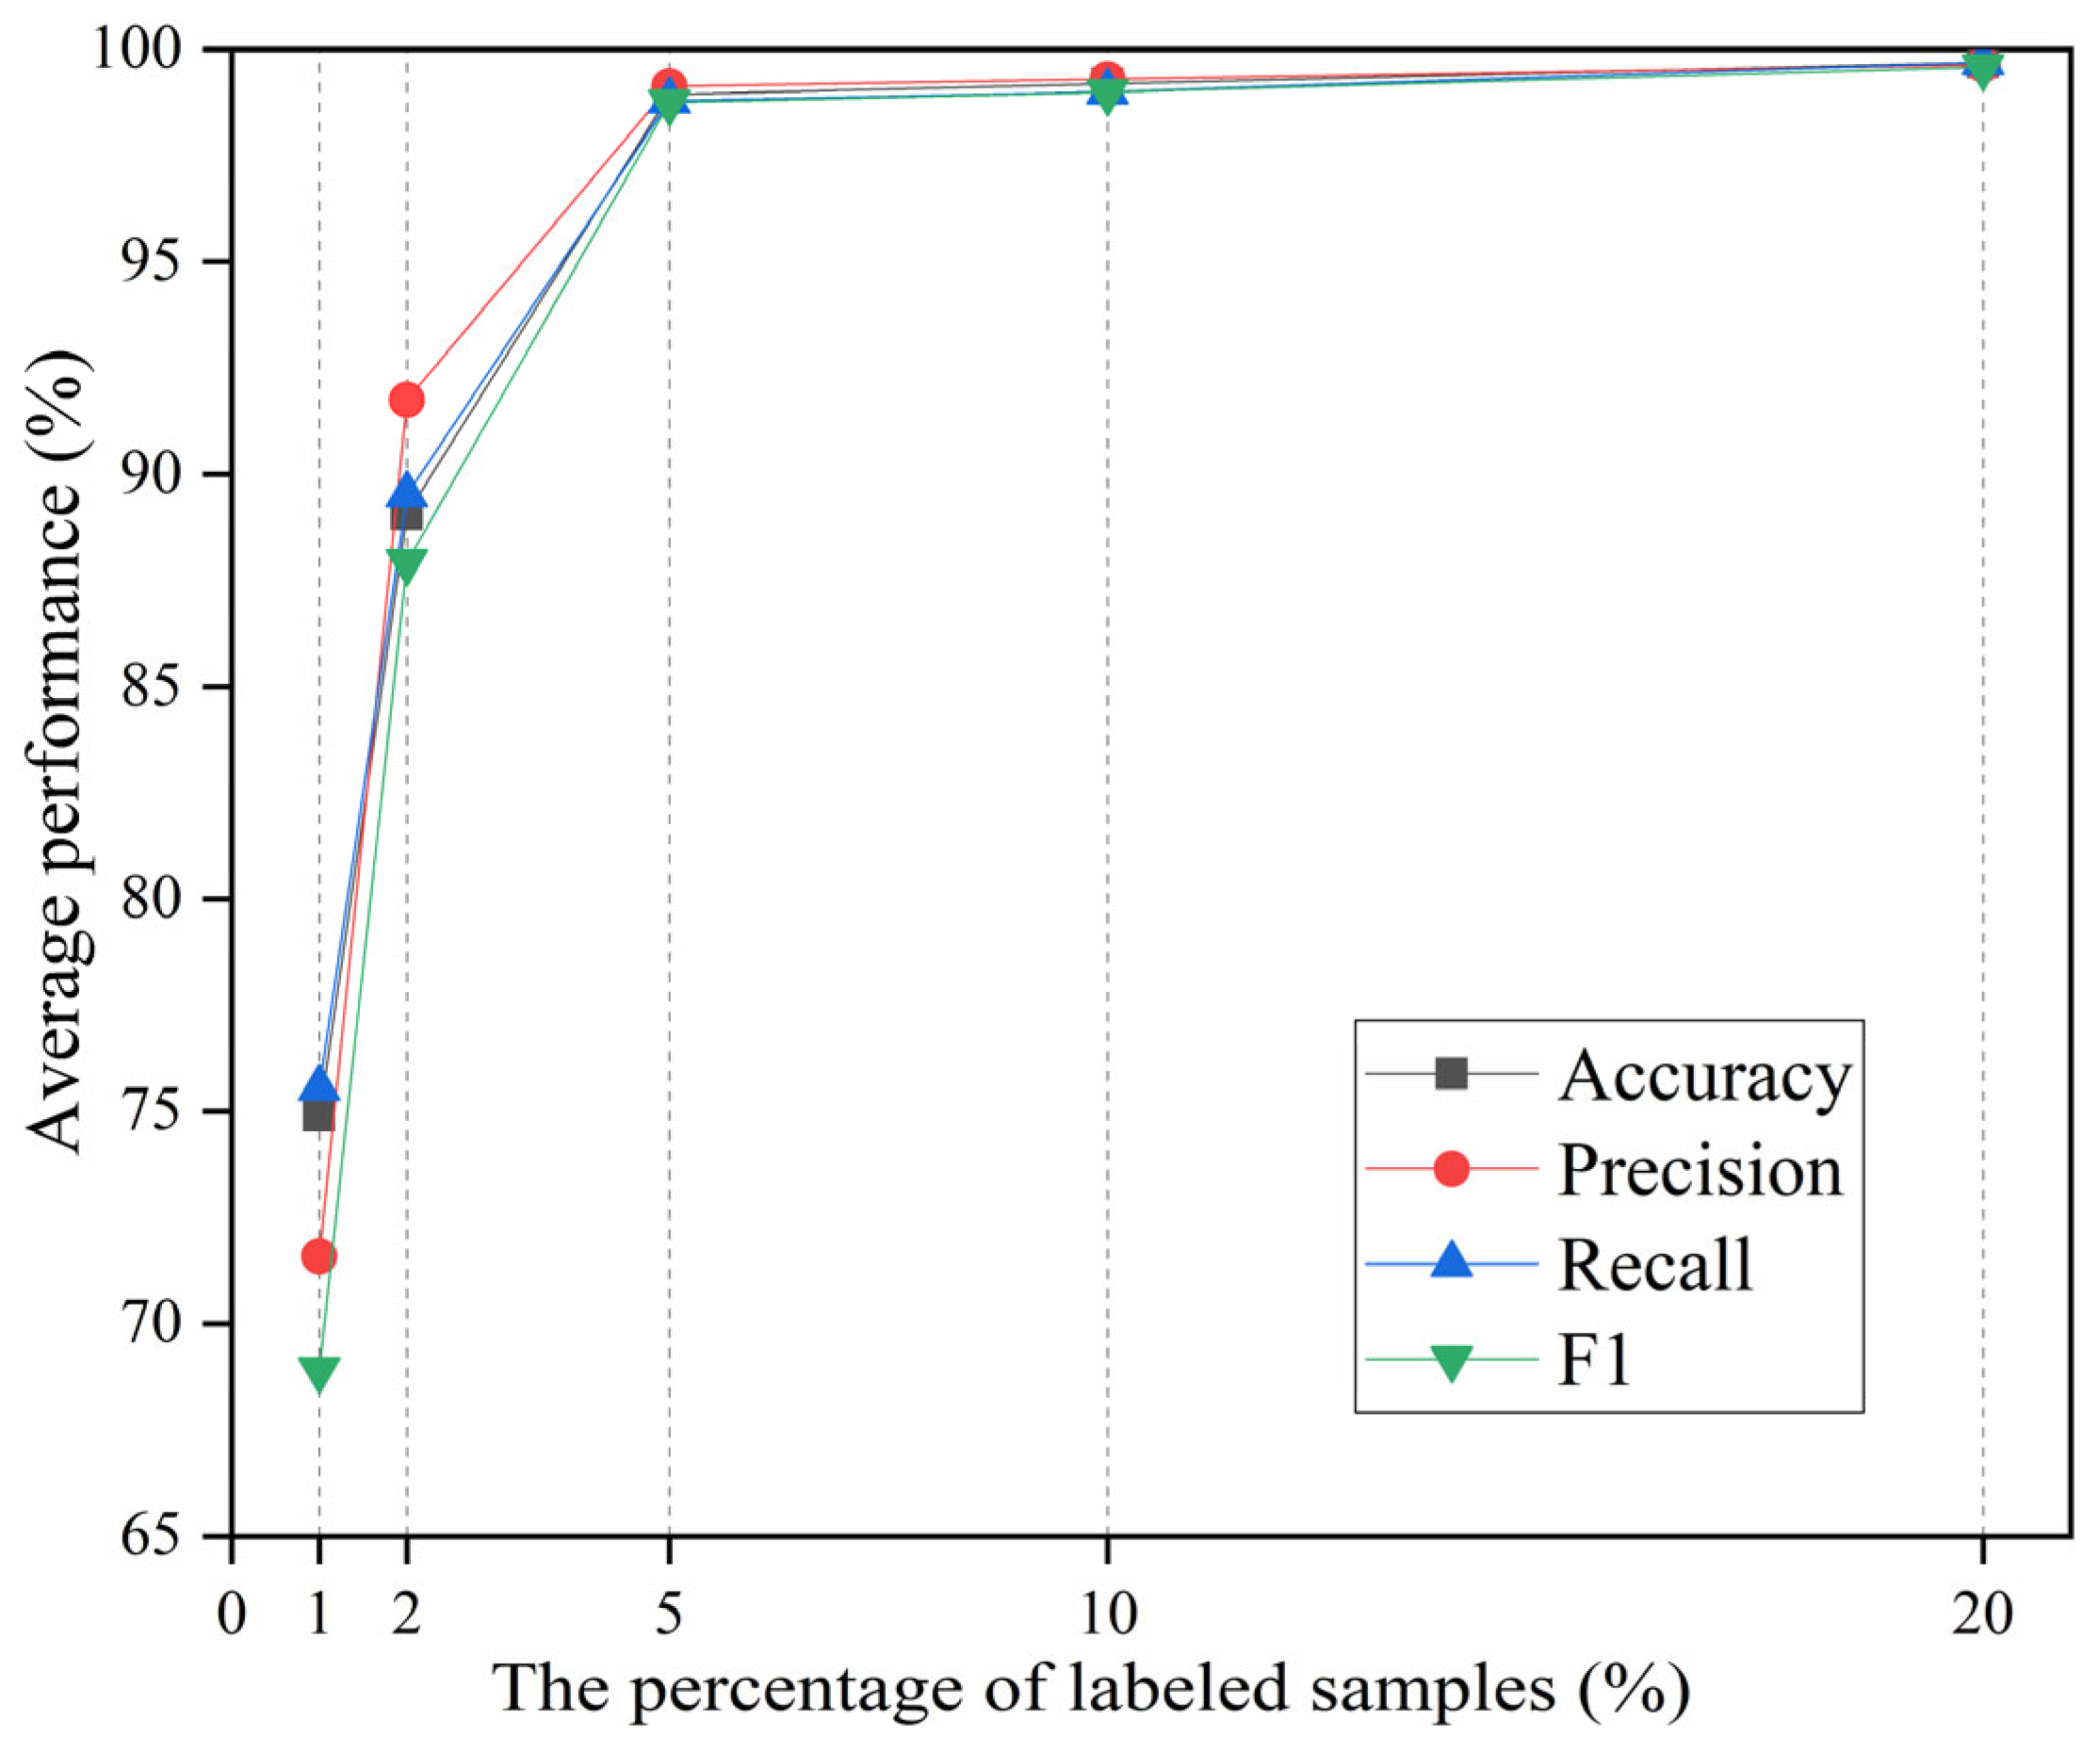
- The results from the trial analysis of the model performance under different label proportions and different signal-to-noise ratios reveal that the DACR approach is capable of maintaining high diagnostic performance while possessing good robustness under low label sample proportions.
- (3)
- In terms of technology diffusion, the DACR approach is not only suitable for fault diagnosis tasks under limited labeling samples in dealing with other rotating mechanical devices, but also able to be integrated with various classification model structures according to the actual application requirements, demonstrating a promising application prospect.
Author Contributions
Funding
Data Availability Statement
Conflicts of Interest
References
- Xu, X.; Zhang, J.; Huang, W.; Yu, B.; Lyu, F.; Zhang, X.; Xu, B. The loose slipper fault diagnosis of variable-displacement pumps under time-varying operating conditions. Reliab. Eng. Syst. Saf. 2024, 252, 110448. [Google Scholar] [CrossRef]
- Guo, J.; Liu, Y.; Yang, R.; Sun, W.; Xiang, J. A simulation-driven difference mode decomposition method for fault diagnosis in axial piston pumps. Adv. Eng. Inform. 2024, 62, 102624. [Google Scholar] [CrossRef]
- Xu, Z.; Wang, Z.; Gao, C.; Zhang, K.; Lv, J.; Wang, J.; Liu, L. A digital twin system for centrifugal pump fault diagnosis driven by transfer learning based on graph convolutional neural networks. Comput. Ind. 2024, 163, 104155. [Google Scholar] [CrossRef]
- Prasshanth, C.V.; Venkatesh, S.N.; Mahanta, T.K.; Sakthivel, N.R.; Sugumaran, V. Fault diagnosis of monoblock centrifugal pumps using pre-trained deep learning models and scalogram images. Eng. Appl. Artif. Intell. 2024, 136, 109022. [Google Scholar] [CrossRef]
- Li, Z.; Liu, Z.; Zuo, M. Homotypic multi-source mixed signal decomposition based on maximum time-shift kurtosis for drilling pump fault diagnosis. Mech. Syst. Signal Process. 2024, 221, 111724. [Google Scholar] [CrossRef]
- Varejão, F.M.; Mello, L.H.S.; Ribeiro, M.P.; Oliveira-Santos, T.; Rodrigues, A.L. An open source experimental framework and public dataset for vibration-based fault diagnosis of electrical submersible pumps used on offshore oil exploration. Knowl.-Based Syst. 2024, 288, 111452. [Google Scholar] [CrossRef]
- Fu, S.; Zou, L.; Wang, Y.; Lin, L.; Lu, Y.; Zhao, M.; Guo, F.; Zhong, S. DCSIAN: A novel deep cross-scale interactive attention network for fault diagnosis of aviation hydraulic pumps and generalizable applications. Reliab. Eng. Syst. Saf. 2024, 249, 110246. [Google Scholar] [CrossRef]
- Li, Y.; Zhang, L.; Liang, P.; Wang, X.; Wang, B.; Xu, L. Semi-supervised meta-path space extended graph convolution network for intelligent fault diagnosis of rotating machinery under time-varying speeds. Reliab. Eng. Syst. Saf. 2024, 251, 110363. [Google Scholar] [CrossRef]
- Zhong, Q.; Xu, E.; Shi, Y.; Jia, T.; Ren, Y.; Yang, H.; Li, Y. Fault diagnosis of the hydraulic valve using a novel semi-supervised learning method based on multi-sensor information fusion. Mech. Syst. Signal Process. 2023, 189, 110093. [Google Scholar] [CrossRef]
- Xu, H.; Wang, X.; Huang, J.; Zhang, F.; Chu, F. Semi-supervised multi-sensor information fusion tailored graph embedded low-rank tensor learning machine under extremely low labeled rate. Inf. Fusion 2024, 105, 102222. [Google Scholar] [CrossRef]
- Huang, Z.; Li, K.; Xu, Z.; Yin, R.; Yang, Z.; Mei, W.; Bing, S. STP-Model: A semi-supervised framework with self-supervised learning capabilities for downhole fault diagnosis in sucker rod pumping systems. Eng. Appl. Artif. Intell. 2024, 135, 108802. [Google Scholar] [CrossRef]
- Fu, X.; Tao, J.; Jiao, K.; Liu, C. A novel semi-supervised prototype network with two-stream wavelet scattering convolutional encoder for TBM main bearing few-shot fault diagnosis. Knowl.-Based Syst. 2024, 286, 111408. [Google Scholar] [CrossRef]
- Liang, P.; Xu, L.; Shuai, H.; Yuan, X.; Wang, B.; Zhang, L. Semi-supervised subdomain adaptation graph convolutional network for fault transfer diagnosis of rotating machinery under time-varying speeds. IEEE/ASME Trans. Mechatron. 2024, 29, 730–741. [Google Scholar] [CrossRef]
- Yao, X.; Lu, X.; Jiang, Q.; Shen, Y.; Xu, F.; Zhu, Q. SSPENet: Semi-supervised prototype enhancement network for rolling bearing fault diagnosis under limited labeled samples. Adv. Eng. Inform. 2024, 61, 102560. [Google Scholar] [CrossRef]
- Han, T.; Xie, W.; Pei, Z. Semi-supervised adversarial discriminative learning approach for intelligent fault diagnosis of wind turbine. Inf. Sci. 2023, 648, 119496. [Google Scholar] [CrossRef]
- Deng, C.; Deng, Z.; Miao, J. Semi-supervised ensemble fault diagnosis method based on adversarial decoupled auto-encoder with extremely limited labels. Reliab. Eng. Syst. Saf. 2024, 242, 109740. [Google Scholar] [CrossRef]
- Yan, S.; Shao, H.; Xiao, Y.; Zhou, J.; Xu, Y.; Wan, J. Semi-supervised fault diagnosis of machinery using LPS-DGAT under speed fluctuation and extremely low labeled rates. Adv. Eng. Inform. 2022, 53, 101648. [Google Scholar] [CrossRef]
- Zhang, T.; Li, C.; Chen, J.; He, S.; Zhou, Z. Feature-level consistency regularized Semi-supervised scheme with data augmentation for intelligent fault diagnosis under small samples. Mech. Syst. Signal Process. 2023, 203, 110747. [Google Scholar] [CrossRef]
- Ramírez-Sanz, J.M.; Maestro-Prieto, J.A.; Arnaiz-González, Á.; Bustillo, A. Semi-supervised learning for industrial fault detection and diagnosis: A systemic review. ISA Trans. 2023, 143, 255–270. [Google Scholar] [CrossRef]
- Zhang, L.; Wang, B.; Liang, P.; Yuan, X.; Li, N. Semi-supervised fault diagnosis of gearbox based on feature pre-extraction mechanism and improved generative adversarial networks under limited labeled samples and noise environment. Adv. Eng. Inform. 2023, 58, 102211. [Google Scholar] [CrossRef]
- Miao, J.; Deng, Z.; Deng, C.; Chen, C. Boosting efficient attention assisted cyclic adversarial auto-encoder for rotating component fault diagnosis under low label rates. Eng. Appl. Artif. Intell. 2024, 133, 108499. [Google Scholar] [CrossRef]
- He, Y.; He, D.; Lao, Z.; Jin, Z.; Miao, J.; Lai, Z.; Chen, Y. Few-shot fault diagnosis of turnout switch machine based on flexible semi-supervised meta-learning network. Knowl.-Based Syst. 2024, 294, 111746. [Google Scholar] [CrossRef]
- Ozdemir, R.; Koc, M. On the enhancement of semi-supervised deep learning-based railway defect detection using pseudo-labels. Expert Syst. Appl. 2024, 251, 124105. [Google Scholar] [CrossRef]
- Azar, K.; Hajiakhondi-Meybodi, Z.; Naderkhani, F. Semi-supervised clustering-based method for fault diagnosis and prognosis: A case study. Reliab. Eng. Syst. Saf. 2022, 222, 108405. [Google Scholar] [CrossRef]
- Su, Z.; Zhang, J.; Xu, H.; Zou, J.; Fan, S. Deep semi-supervised transfer learning method on few source data with sensitivity-aware decision boundary adaptation for intelligent fault diagnosis. Expert Syst. Appl. 2024, 249, 123714. [Google Scholar] [CrossRef]
- Lu, F.; Tong, Q.; Jiang, X.; Feng, Z.; Xu, J.; Wang, X.; Huo, J. A deep targeted transfer network with clustering pseudo-label learning for fault diagnosis across different Machines. Mech. Syst. Signal Process. 2024, 213, 111344. [Google Scholar] [CrossRef]
- Kumar, D.D.; Fang, C.; Zheng, Y.; Gao, Y. Semi-supervised transfer learning-based automatic weld defect detection and visual inspection. Eng. Struct. 2023, 292, 116580. [Google Scholar] [CrossRef]
- Yu, T.; Li, C.; Huang, J.; Xiao, X.; Zhang, X.; Li, Y.; Fu, B. ReF-DDPM: A novel DDPM-based data augmentation method for imbalanced rolling bearing fault diagnosis. Reliab. Eng. Syst. Saf. 2024, 251, 110343. [Google Scholar] [CrossRef]
- Kulevome, D.K.B.; Wang, H.; Cobbinah, B.M.; Mawuli, E.S.; Kumar, R. Effective time-series Data Augmentation with Analytic Wavelets for bearing fault diagnosis. Expert Syst. Appl. 2024, 249, 123536. [Google Scholar] [CrossRef]
- Tian, J.; Jiang, Y.; Zhang, J.; Luo, H.; Yin, S. A novel data augmentation approach to fault diagnosis with class-imbalance problem. Reliab. Eng. Syst. Saf. 2024, 243, 109832. [Google Scholar] [CrossRef]
- Mueller, P.N. Attention-enhanced conditional-diffusion-based data synthesis for data augmentation in machine fault diagnosis. Eng. Appl. Artif. Intell. 2024, 131, 107696. [Google Scholar] [CrossRef]
- Van der Maaten, L.; Hinton, G. Visualizing data using t-SNE. J. Mach. Learn. Res. 2008, 9, 2579–2605. [Google Scholar]
- Martins, D.H.; de Lima, A.A.; Gutiérrez, R.H.; Pestana-Viana, D.; Netto, S.L.; Vaz, L.A.; da Silva, E.A.; Haddad, D.B. Improved variational mode decomposition for combined imbalance-and-misalignment fault recognition and severity quantification. Eng. Appl. Artif. Intell. 2023, 124, 106516. [Google Scholar] [CrossRef]
- Wang, L.; Liu, Z. An improved local characteristic-scale decomposition to restrict end effects, mode mixing and its application to extract incipient bearing fault signal. Mech. Syst. Signal Process. 2021, 156, 107657. [Google Scholar] [CrossRef]
- Ma, Y.; Cheng, J.; Wang, P.; Wang, J.; Yang, Y. A novel Lanczos quaternion singular spectrum analysis method and its application to bevel gear fault diagnosis with multi-channel signals. Mech. Syst. Signal Process. 2022, 168, 108679. [Google Scholar] [CrossRef]
- Wang, N.; Ma, P.; Wang, X.; Wang, C.; Zhang, H. Detection of unknown bearing faults using re-weighted symplectic geometric node network characteristics and structure analysis. Expert Syst. Appl. 2023, 215, 119304. [Google Scholar] [CrossRef]
- Yu, B.; Cao, N.; Zhang, T. A novel signature extracting approach for inductive oil debris sensors based on symplectic geometry mode decomposition. Measurement 2021, 185, 110056. [Google Scholar] [CrossRef]
- Liu, Z.; Wang, Y.; Vaidya, S.; Ruehle, F.; Halverson, J.; Soljačić, M.; Hou, T.Y.; Tegmark, M. Kan: Kolmogorov-arnold networks. arXiv 2024, arXiv:2404.19756. [Google Scholar]
- Pan, H.; Yang, Y.; Li, X.; Zheng, J.; Cheng, J. Symplectic geometry mode decomposition and its application to rotating machinery compound fault diagnosis. Mech. Syst. Signal Process. 2019, 114, 189–211. [Google Scholar] [CrossRef]
- Wang, S.; Hu, J.; Du, Y.; Yuan, X.; Xie, Z.; Liang, P. WCFormer: An interpretable deep learning framework for heart sound signal analysis and automated diagnosis of cardiovascular diseases. Expert Syst. Appl. 2025, 276, 127238. [Google Scholar] [CrossRef]
- Xu, J.; Qu, J. Capacity estimation of lithium-ion battery based on soft dynamic time warping, stratified random sampling and pruned residual neural networks. Eng. Appl. Artif. Intell. 2024, 138, 109278. [Google Scholar] [CrossRef]
- Berthelot, D.; Carlini, N.; Goodfellow, I.; Papernot, N.; Oliver, A.; Raffel, C. Mixmatch: A holistic approach to semi-supervised learning. arXiv 2019, arXiv:1905.02249. [Google Scholar]
- Laine, S.; Aila, T. Temporal ensembling for semi-supervised learning. arXiv 2016, arXiv:1610.02242. [Google Scholar]
- Tarvainen, A.; Valpola, H. Mean teachers are better role models: Weight-averaged consistency targets improve semi-supervised deep learning results. arXiv 2017, arXiv:1703.01780. [Google Scholar]
- Fu, S.; Lin, L.; Wang, Y.; Zhao, M.; Guo, F.; Zhong, S.; Liu, Y. High imbalance fault diagnosis of aviation hydraulic pump based on data augmentation via local wavelet similarity fusion. Mech. Syst. Signal Process. 2024, 209, 111115. [Google Scholar] [CrossRef]
- Tang, S.; Zhu, Y.; Yuan, S. A novel adaptive convolutional neural network for fault diagnosis of hydraulic piston pump with acoustic images. Adv. Eng. Inform. 2022, 52, 101554. [Google Scholar] [CrossRef]
- Qiu, Z.; Li, W.; Tang, T.; Wang, D.; Wang, Q. Denoising graph neural network based hydraulic component fault diagnosis method. Mech. Syst. Signal Process. 2023, 204, 110828. [Google Scholar] [CrossRef]
- Huang, X.; Zhang, J.; Huang, W.; Lyu, F.; Xu, H.; Xu, B. Multi-output sparse Gaussian process based fault detection for a variable displacement pump under random time-variant working conditions. Mech. Syst. Signal Process. 2024, 211, 111191. [Google Scholar] [CrossRef]


| Case | Hydraulic Pump Models | Rated Pressure (Mpa) | Rated Displacement (ml/r) | Rated Speed (r/min) | Number of Plungers | Weight (Kg) |
|---|---|---|---|---|---|---|
| 1 | 10MCY14-1B | 31.5 | 10 | 1500 | 7 | 16.4 |
| 2 | P08-B3F-R-01 | 21.5 | 8 | 1450 | 9 | 15.6 |
| Label | Healthy Conditions | Description | Number of Training Datasets | Number of Test Datasets |
|---|---|---|---|---|
| 0 | H | State of health | 159 | 40 |
| 1 | SPWF | Swash plate wear failure | 159 | 40 |
| 2 | SWF | Slipper wear failure | 159 | 40 |
| 3 | LBF | Loose boot failure | 159 | 40 |
| Number | Network layer | Type | Input Size | Output Size | Activation Function | Bias |
|---|---|---|---|---|---|---|
| 1 | Input | Reshape | (B, C, L) | (B, L×C) | - | - |
| 2 | Hidden Layer 1 | Linear | L×C | 512 | Sigmoid | True |
| 3 | Hidden Layer 2 | Linear | 512 | 256 | Sigmoid | True |
| 4 | Output | Linear | 256 | 4 | - | True |
| Parameter Name | Notation | Parameter Value |
|---|---|---|
| Sampling frequency | fs | 10 kHz |
| ISGDA signal-to-noise ratio | SNR | 20 dB |
| Trajectory matrix window length | nfft | 256 |
| Correlation coefficient threshold of each component | - | 0.8 |
| Normalized mean square error decision threshold | - | 0.001 |
| Pseudo-label threshold | 0.95 | |
| Unlabeled loss weight | 1 | |
| Activation function | - | Sigmoid |
| Optimizer | - | Adam |
| Epochs | - | 100 |
| Batch size | - | 16 |
| Learning rate | lr | 1 × 10⁻⁴ |
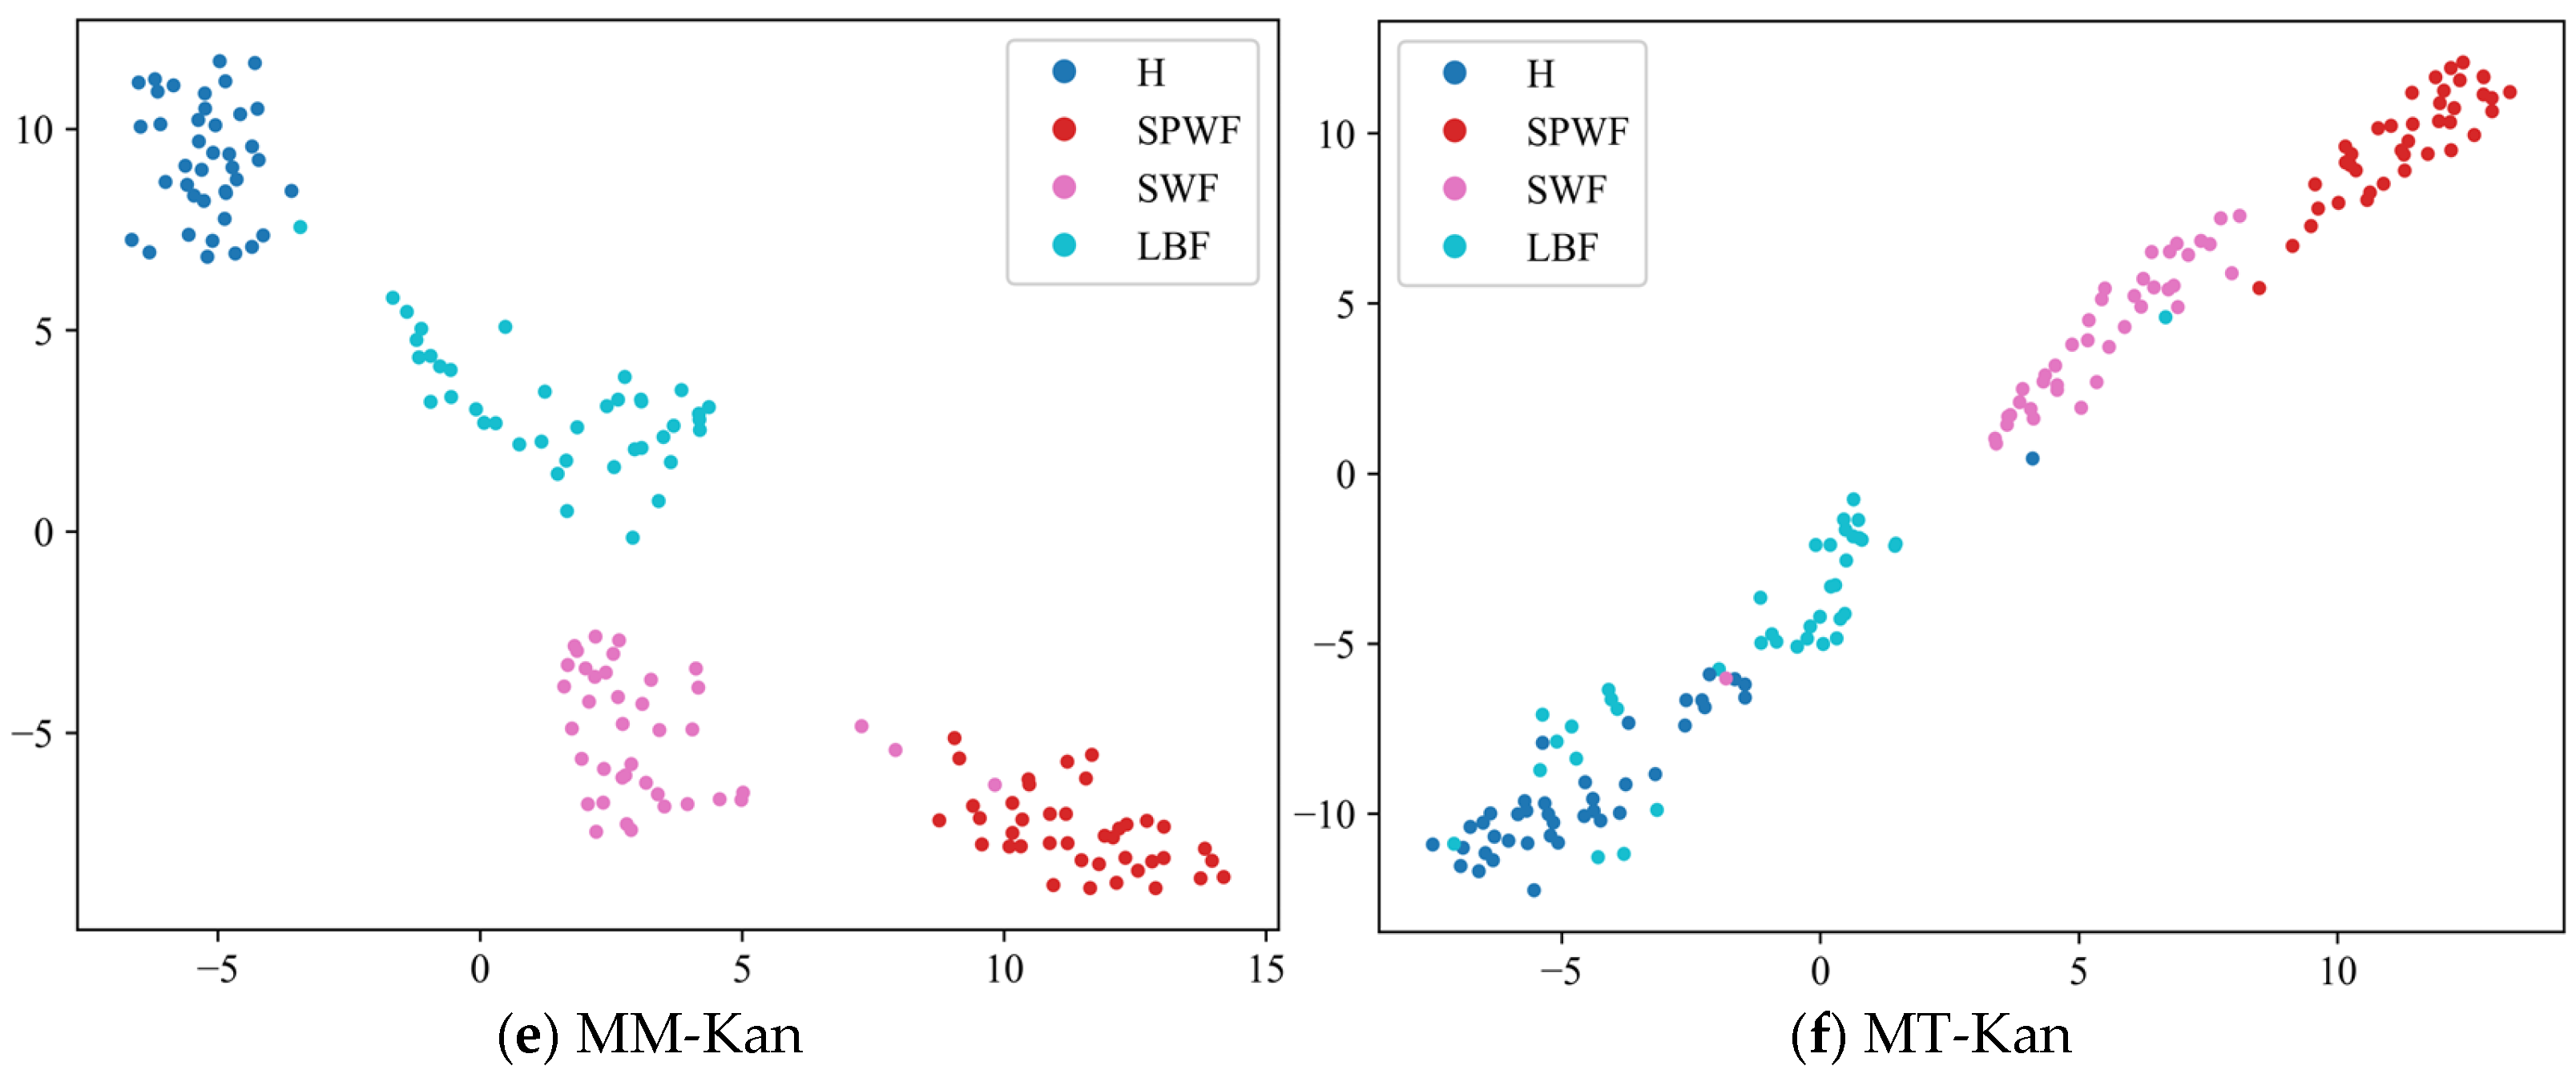
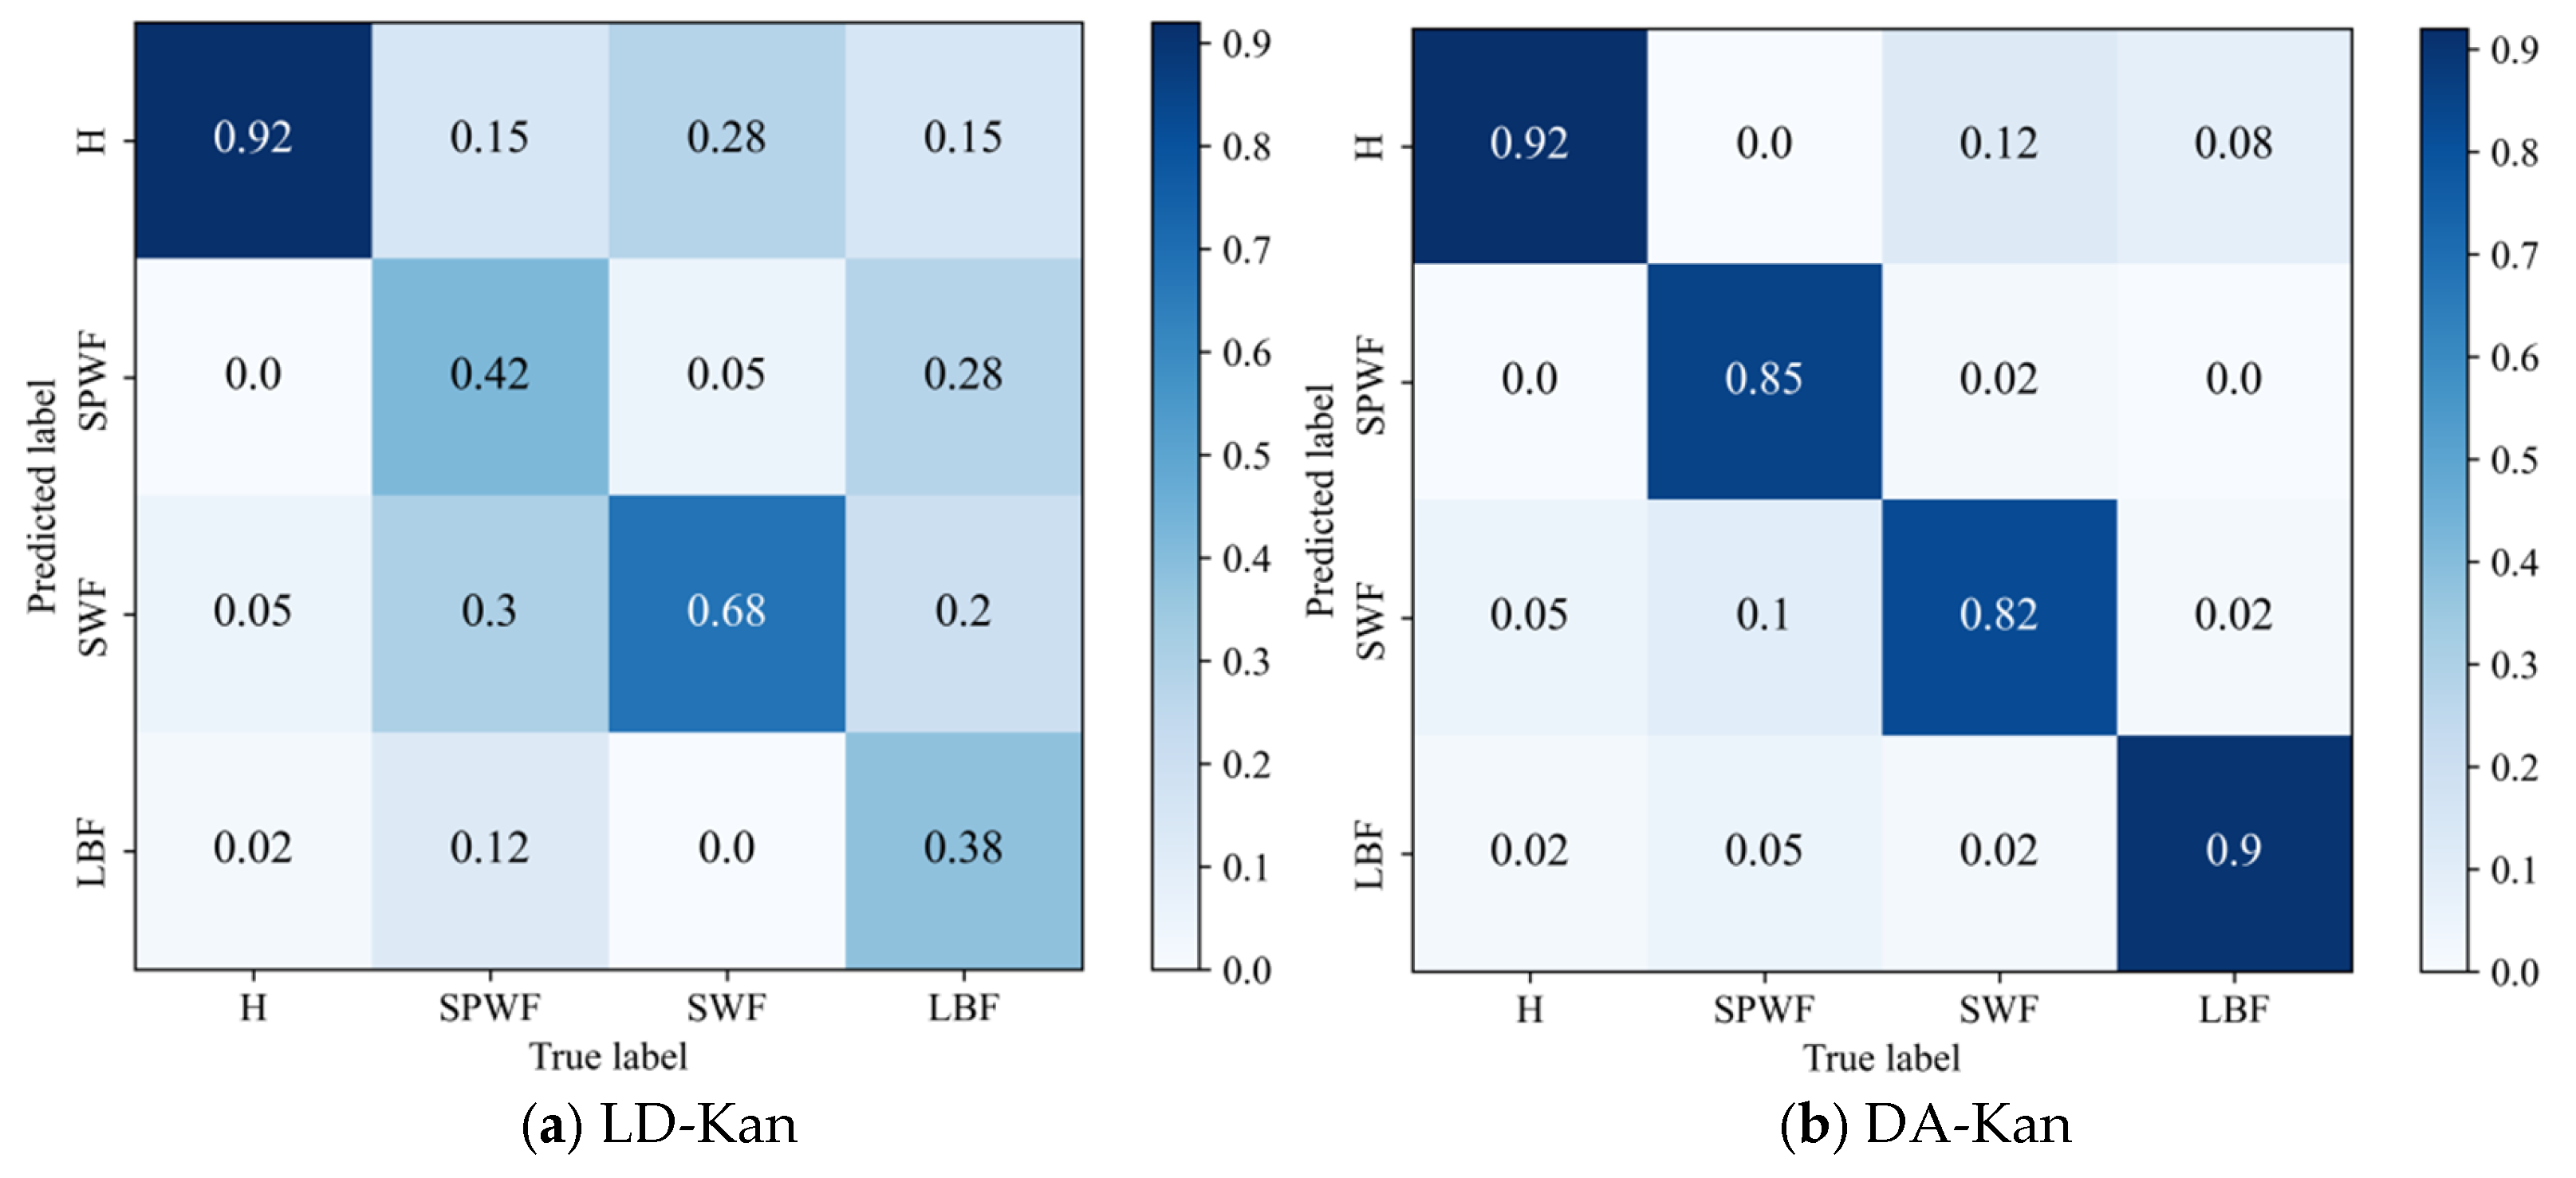
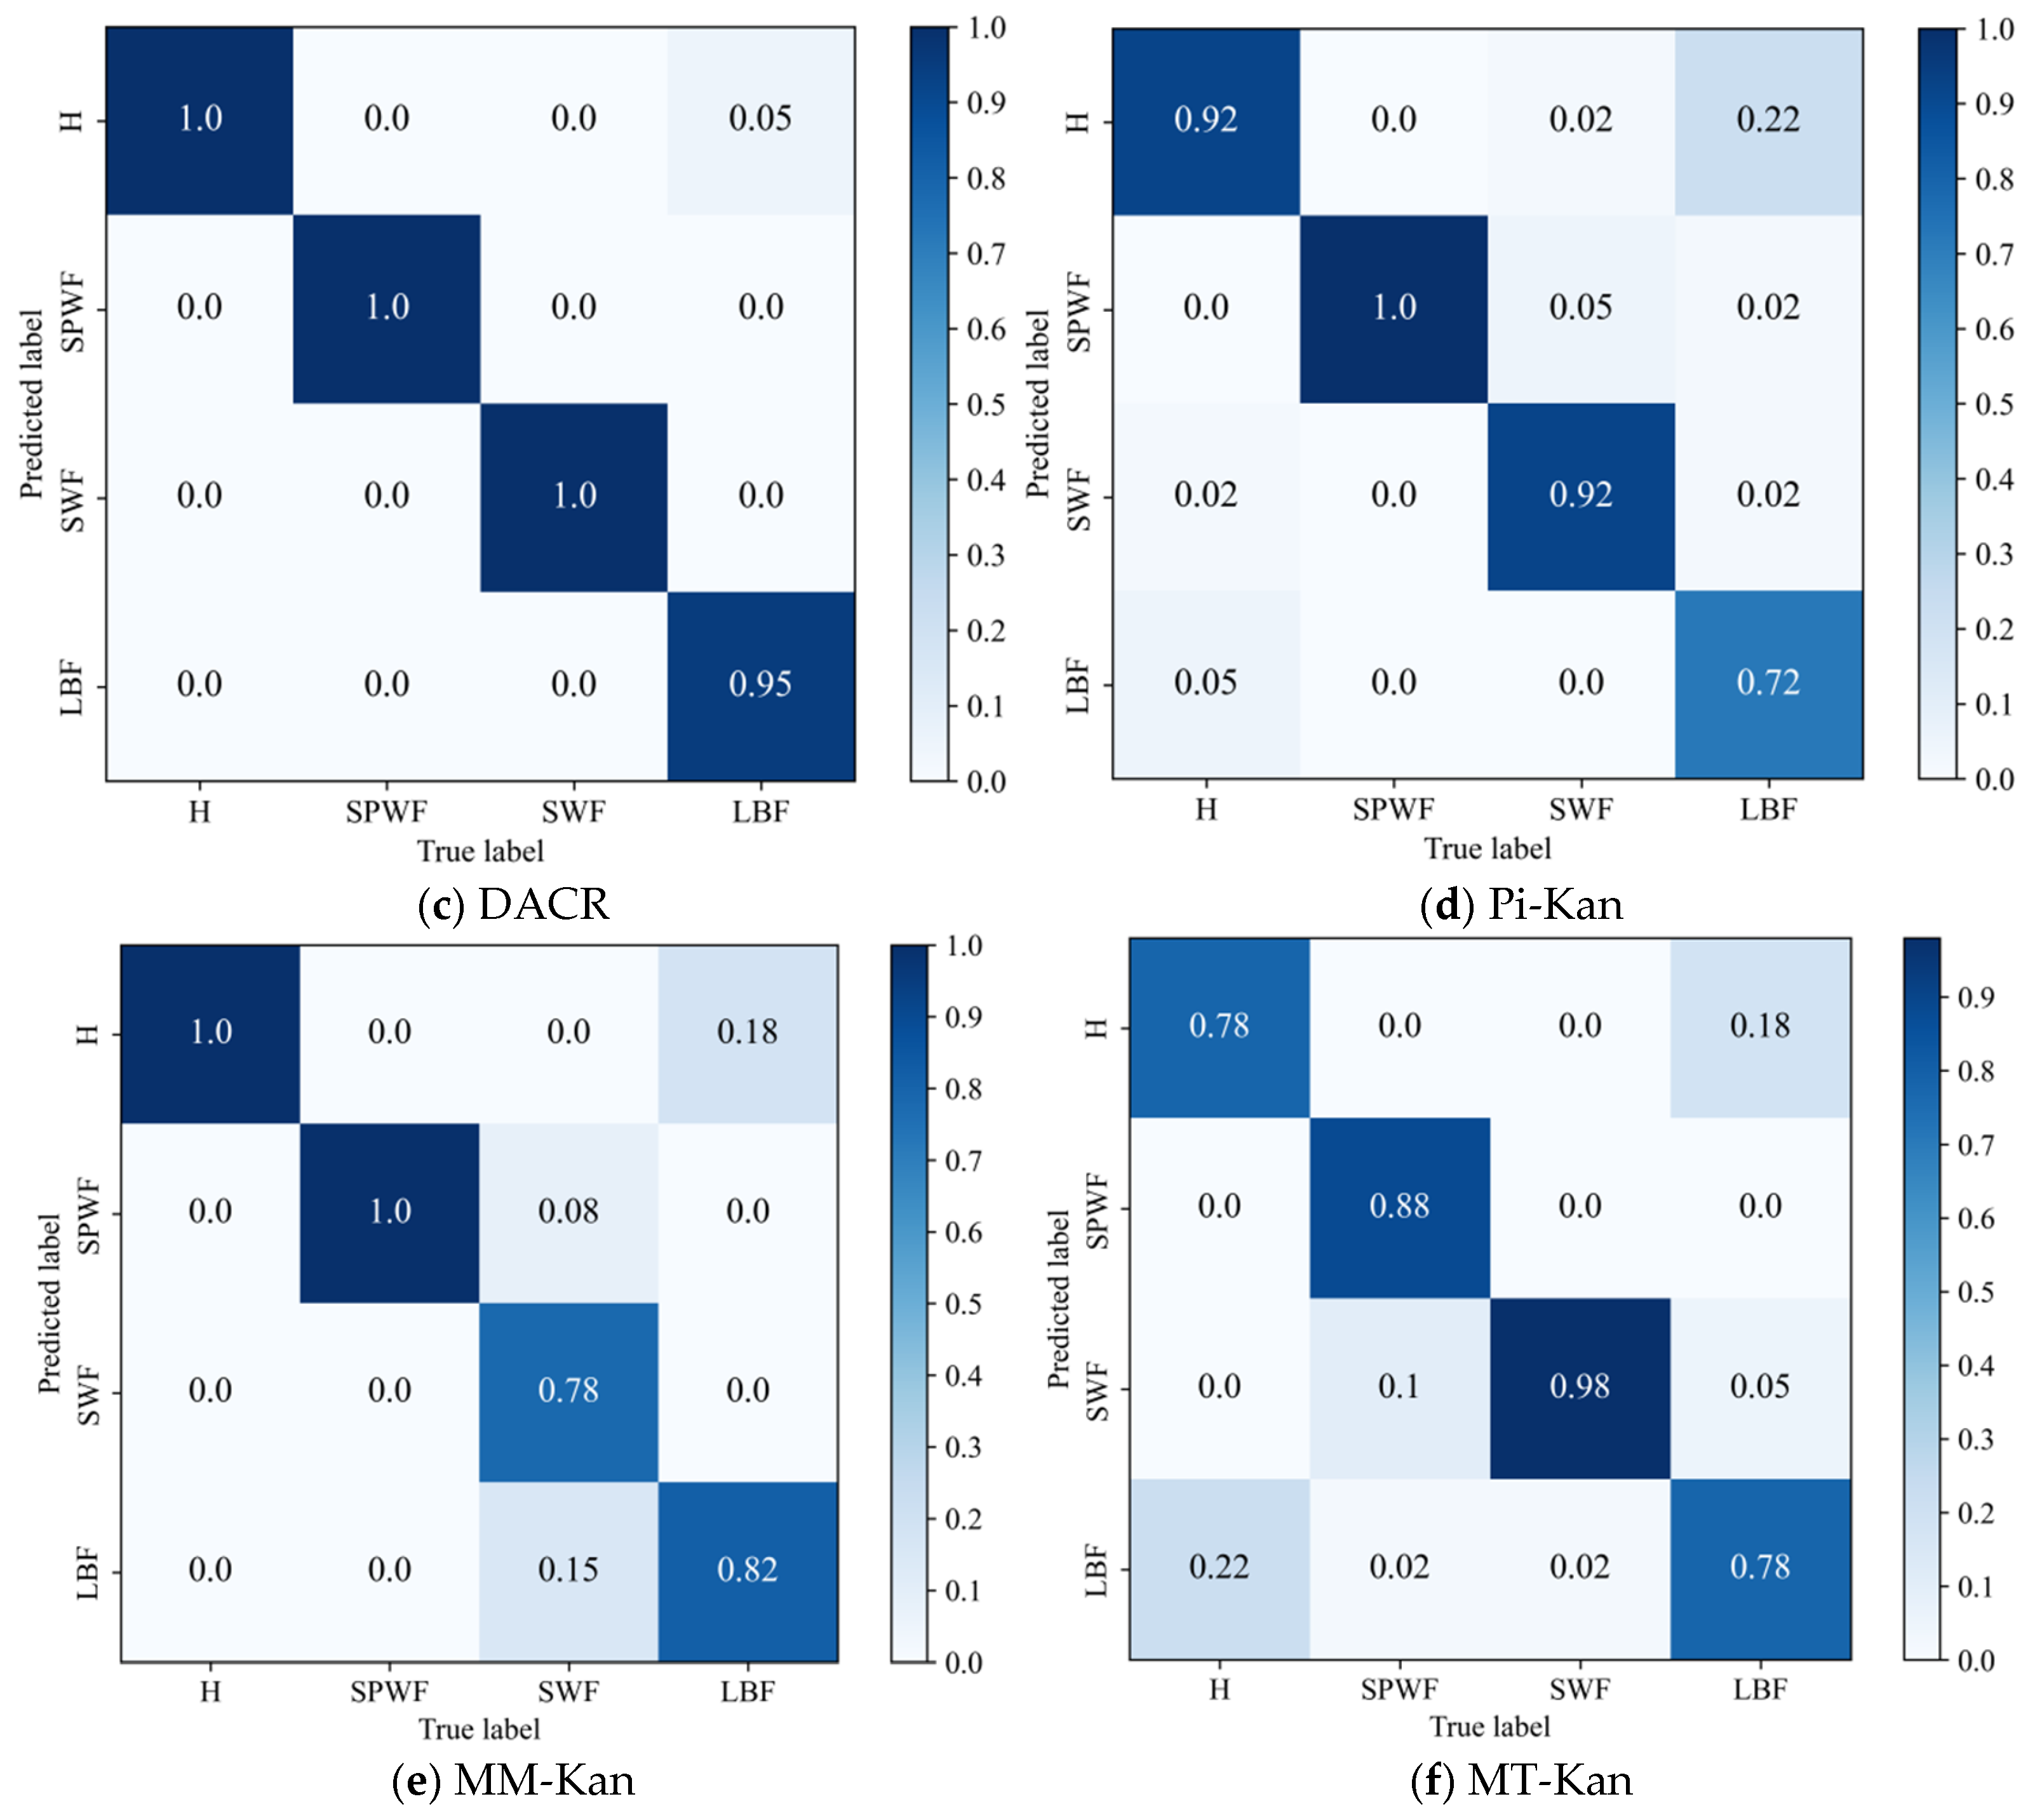
| Component | DACR | MM-Kan | Pi-Kan | MT-Kan | LD-Kan | DA-Kan |
|---|---|---|---|---|---|---|
| ISGDA Data Augmentation | Weak and Strong | Strong | Strong | Strong | None | Weak and Strong |
| Label post-processing | Pseudo-labeling | Sharpening | None | EMA | None | None |
| Consistency Loss | MSE (masked by threshold) | MSE with MixUp | MSE between input pair | MSE between student & teacher | None | None |
| Supervised Loss | CE | CE | CE | CE | CE | CE |
| Total Loss | CE + *CL | CE + *CL | CE + *CL | CE + *CL | CE | CE |
| Metric | Methods | |||||
|---|---|---|---|---|---|---|
| LD-Kan | DA-Kan | Proposed | Pi-Kan | MM-Kan | MT-Kan | |
| Accuracy | 59.38 ± 3.09 | 87.00 ± 0.88 | 98.94 ± 0.45 | 89.13 ± 1.32 | 90.13 ± 1.77 | 85.88 ± 0.88 |
| Precision | 61.65 ± 3.13 | 87.71 ± 0.32 | 99.13 ± 0.09 | 89.78 ± 0.33 | 91.40 ± 1.34 | 86.41 ± 0.34 |
| Recall | 59.38 ± 3.09 | 87.00 ± 0.88 | 98.79 ± 0.74 | 89.42 ± 1.33 | 90.49 ± 1.68 | 85.94 ± 1.47 |
| F1 | 57.05 ± 3.17 | 87.07 ± 0.82 | 98.75 ± 0.38 | 87.74 ± 0.70 | 89.17 ± 1.71 | 84.81 ± 0.83 |
| Label | State of Health | Explicit Explanation | Number of Training Datasets | Number of Test Datasets |
|---|---|---|---|---|
| 0 | H | State of health | 199 | 50 |
| 1 | SWF | Slipper wear failure | 199 | 50 |
| 2 | LBF | Loose boot failure | 199 | 50 |
| 3 | PWF | Plunger wear failure | 199 | 50 |
| Metric | Methods | |||||
|---|---|---|---|---|---|---|
| LD-Kan | DA-Kan | Proposed | Pi-Kan | MM-Kan | MT-Kan | |
| Accuracy | 51.75 ± 3.18 | 83.05 ± 0.71 | 99.37 ± 0.01 | 89.32 ± 1.36 | 91.06 ± 1.70 | 85.96 ± 2.38 |
| Precision | 50.48 ± 2.71 | 83.21 ± 0.71 | 99.31 ± 0.14 | 87.92 ± 1.81 | 90.57 ± 1.63 | 86.36 ± 1.10 |
| Recall | 51.75 ± 3.18 | 83.05 ± 0.71 | 99.52 ± 0.02 | 87.36 ± 1.56 | 90.54 ± 2.63 | 84.63 ± 2.17 |
| F1 | 48.10 ± 3.79 | 82.98 ± 0.72 | 99.32 ± 0.12 | 86.35 ± 1.70 | 89.34 ± 2.02 | 83.91 ± 1.82 |
| Metric | FLOPs (G) | Params (M) | Memory (MB) | Testing Time (s) |
|---|---|---|---|---|
| Value | 0.25 | 25.30 | 96.51 | 0.56 |
| Metric | The Percentage of Labeled Samples | ||||
|---|---|---|---|---|---|
| 1% | 2% | 5% | 10% | 20% | |
| Accuracy | 74.88 ± 1.77 | 89.07 ± 3.09 | 98.94 ± 0.45 | 99.19 ± 1.32 | 99.69 ± 0.44 |
| Precision | 71.59 ± 6.60 | 91.75 ± 3.54 | 99.13 ± 0.09 | 99.30 ± 1.10 | 99.63 ± 0.59 |
| Recall | 75.55 ± 1.82 | 89.52 ± 3.15 | 98.79 ± 0.74 | 99.00 ± 1.62 | 99.69 ± 0.44 |
| F1 | 68.91 ± 0.01 | 87.94 ± 3.99 | 98.75 ± 0.38 | 98.99 ± 1.58 | 99.58 ± 0.61 |
| Metric | Different Noise Intensities (dB) | ||||
|---|---|---|---|---|---|
| −10 | −5 | 0 | 5 | 10 | |
| Accuracy | 82.00 ± 5.30 | 92.07 ± 2.21 | 96.19 ± 0.45 | 97.00 ± 0.88 | 98.07 ± 0 |
| Precision | 81.06 ± 8.67 | 92.96 ± 3.44 | 97.09 ± 0.25 | 97.68 ± 0.47 | 98.44 ± 0.01 |
| Recall | 82.40 ± 5.45 | 92.25 ± 2.06 | 96.00 ± 0.45 | 96.90 ± 0.88 | 97.65 ± 0 |
| F1 | 77.73 ± 7.91 | 90.56 ± 3.24 | 95.68 ± 0.39 | 96.62 ± 1.21 | 97.60 ± 0 |
Disclaimer/Publisher’s Note: The statements, opinions and data contained in all publications are solely those of the individual author(s) and contributor(s) and not of MDPI and/or the editor(s). MDPI and/or the editor(s) disclaim responsibility for any injury to people or property resulting from any ideas, methods, instructions or products referred to in the content. |
© 2025 by the authors. Licensee MDPI, Basel, Switzerland. This article is an open access article distributed under the terms and conditions of the Creative Commons Attribution (CC BY) license (https://creativecommons.org/licenses/by/4.0/).
Share and Cite
Liu, S.; Yin, J.; Zhang, Z.; Zhang, Y.; Ai, C.; Jiang, W. Semi-Supervised Fault Diagnosis Method for Hydraulic Pumps Based on Data Augmentation Consistency Regularization. Machines 2025, 13, 557. https://doi.org/10.3390/machines13070557
Liu S, Yin J, Zhang Z, Zhang Y, Ai C, Jiang W. Semi-Supervised Fault Diagnosis Method for Hydraulic Pumps Based on Data Augmentation Consistency Regularization. Machines. 2025; 13(7):557. https://doi.org/10.3390/machines13070557
Chicago/Turabian StyleLiu, Siyuan, Jixiong Yin, Zhengming Zhang, Yongqiang Zhang, Chao Ai, and Wanlu Jiang. 2025. "Semi-Supervised Fault Diagnosis Method for Hydraulic Pumps Based on Data Augmentation Consistency Regularization" Machines 13, no. 7: 557. https://doi.org/10.3390/machines13070557
APA StyleLiu, S., Yin, J., Zhang, Z., Zhang, Y., Ai, C., & Jiang, W. (2025). Semi-Supervised Fault Diagnosis Method for Hydraulic Pumps Based on Data Augmentation Consistency Regularization. Machines, 13(7), 557. https://doi.org/10.3390/machines13070557