
Using Graph-Enhanced Deep Reinforcement Learning for Distribution Network Fault Recovery


Abstract
1. Introduction
- Ignoring the spatial topology of the distribution network, limiting global situational awareness. Distribution networks naturally exhibit a graph topology, where network connectivity directly influences power flow distribution. Neglecting these spatial features can hinder the agent’s ability to fully understand the global network state, thereby affecting the effectiveness and scalability of restoration strategies.
- A high-dimensional discrete action space leading to exponential growth in computational complexity. In the fault restoration process, an agent must determine the switching status of multiple circuit breakers simultaneously. As the number of circuit breakers increases, the possible action combinations grow exponentially, making it difficult for the agent to efficiently explore the optimal strategy in such a vast action space. This “curse of dimensionality” often results in slow training convergence and poor decision quality.
- Lack of effective cooperation mechanisms among multiple agents, affecting global restoration performance. Fault restoration in distribution networks involves the coordinated optimization of multiple physical components, naturally presenting a multi-agent interaction problem. However, most existing studies design independent reward functions for each agent, failing to capture the cooperative relationships among different decision units. As a result, agents may struggle to coordinate their actions effectively, leading to suboptimal overall restoration performance.
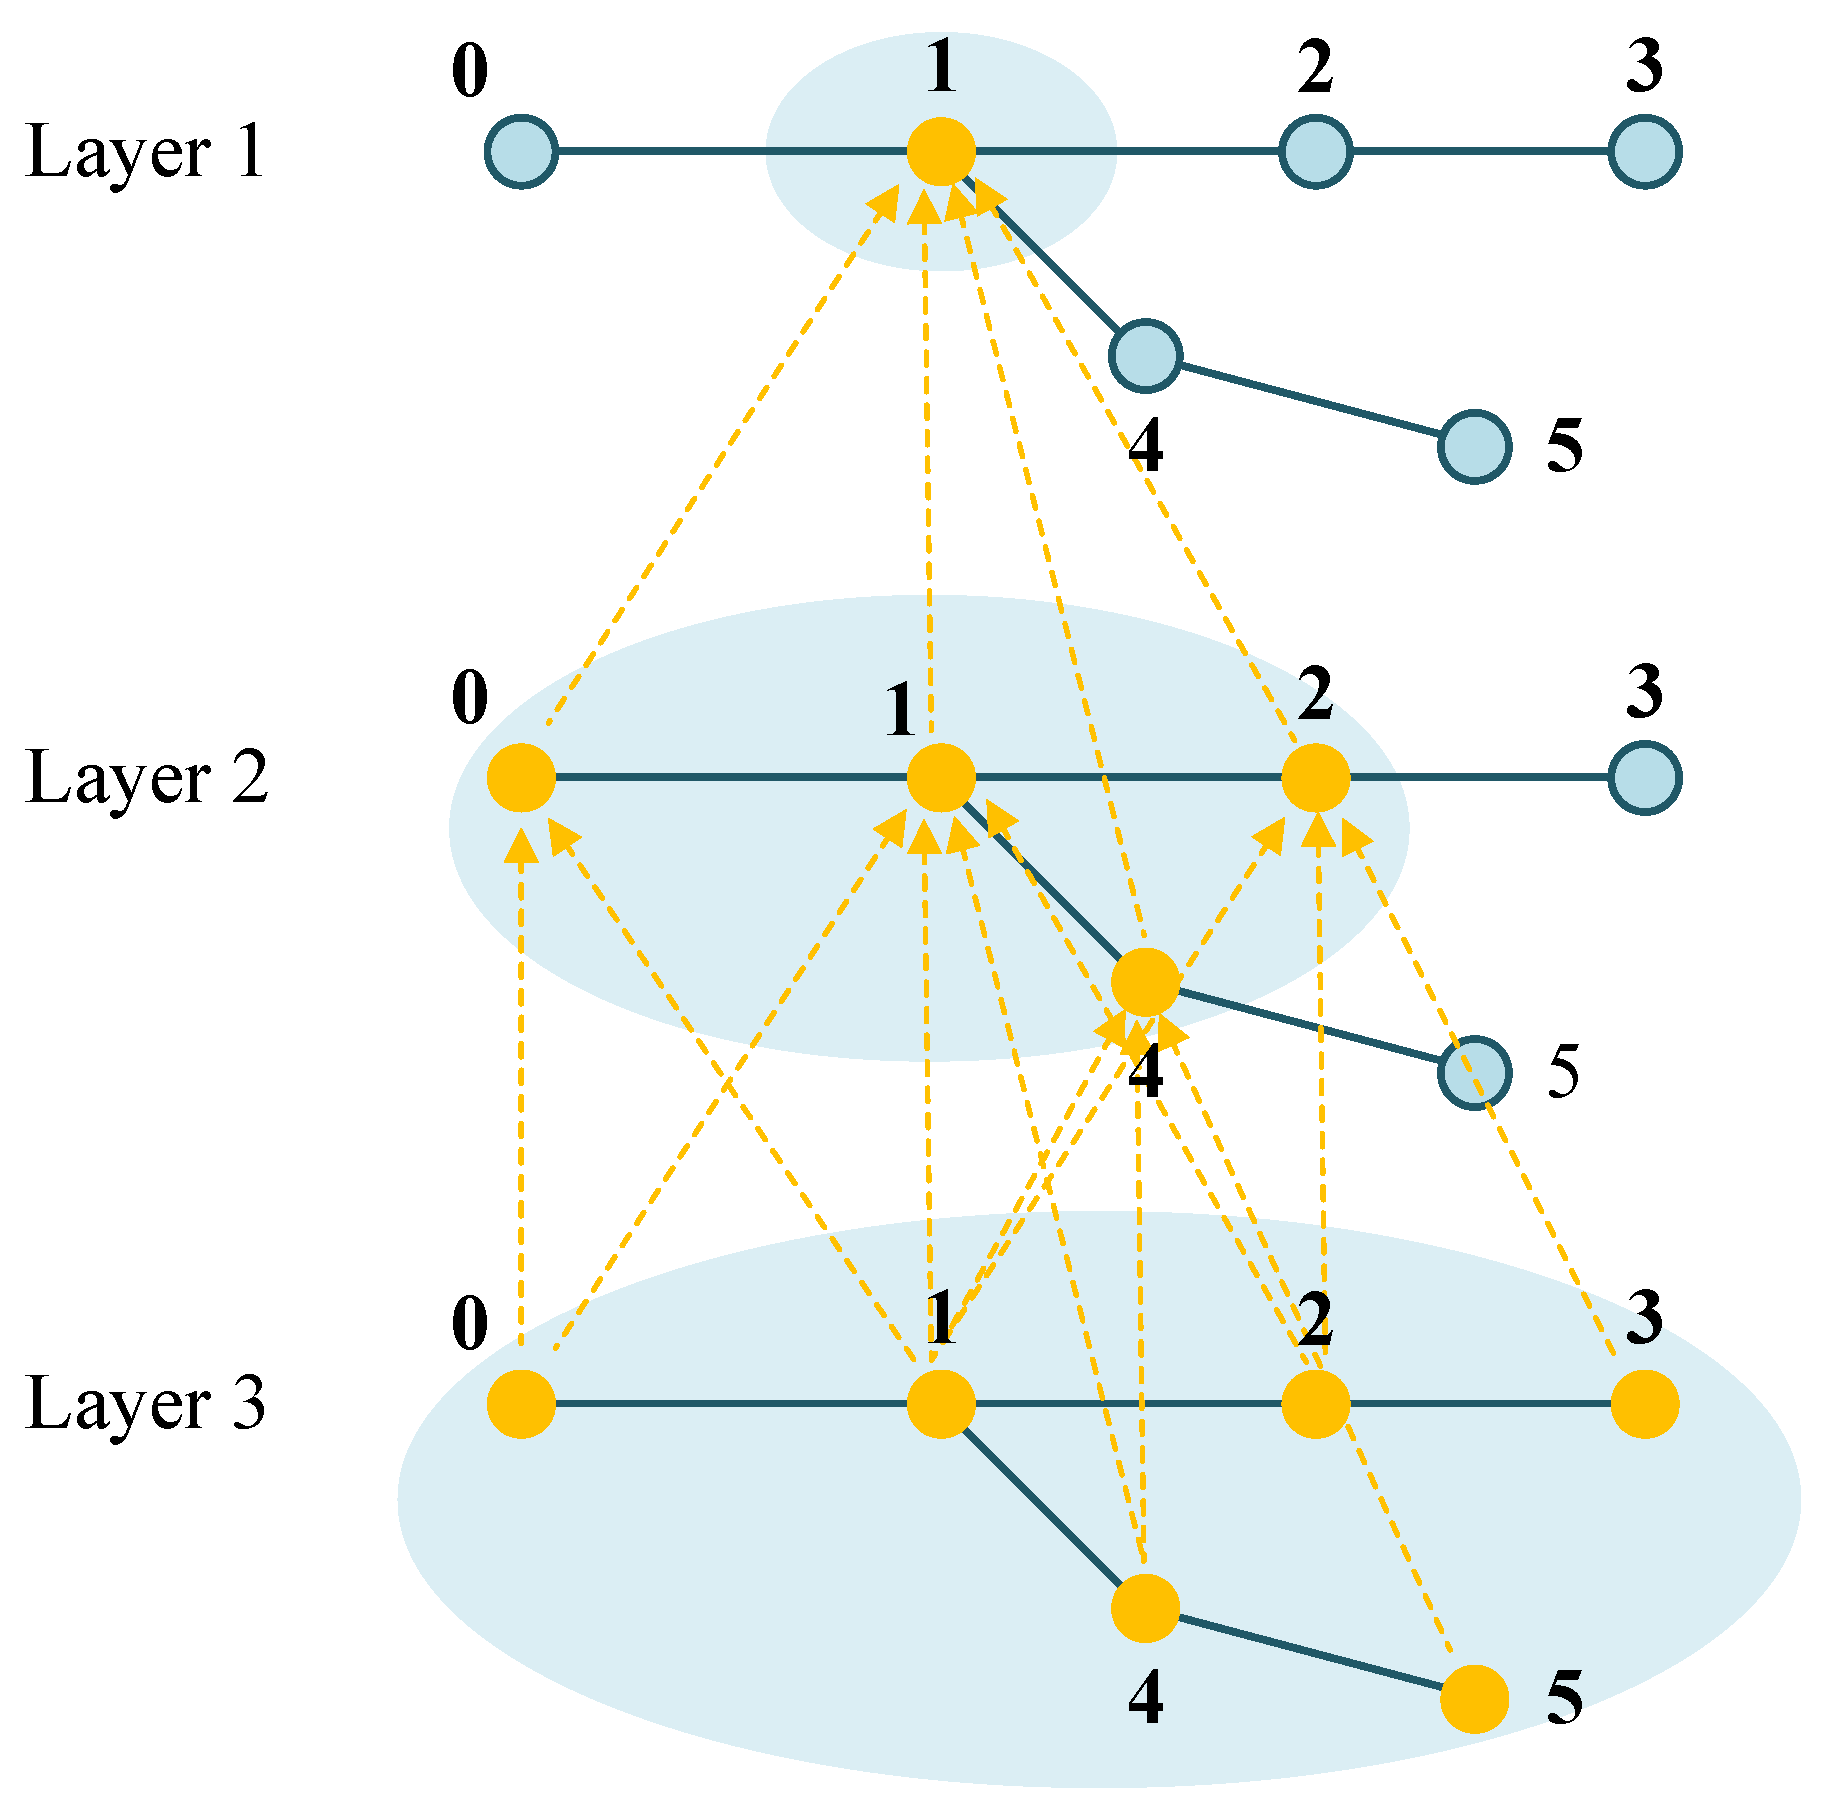
- Graph-based state representation: To capture the topological structure and interdependencies among network components, we model the distribution network as a graph and employ a graph-based neural network for feature extraction. This enables agents to effectively learn spatial correlations between network nodes, enhancing their global situational awareness and improving fault restoration effectiveness.
- Action decomposition strategy: To address the computational challenges of high-dimensional action spaces, we propose an action decomposition approach, treating each circuit breaker’s switching operation as an independent binary classification problem. By leveraging the continuity of neural network outputs, this method simplifies discrete action selection, reducing computational complexity while improving convergence and action efficiency.
- Collaborative reward mechanism: To enhance cooperation among multiple agents, we develop a collaborative reward mechanism that promotes information sharing and coordination. By designing a global reward function that accounts for the overall system restoration performance, agents not only optimize their individual actions but also contribute to achieving a globally optimal restoration strategy.
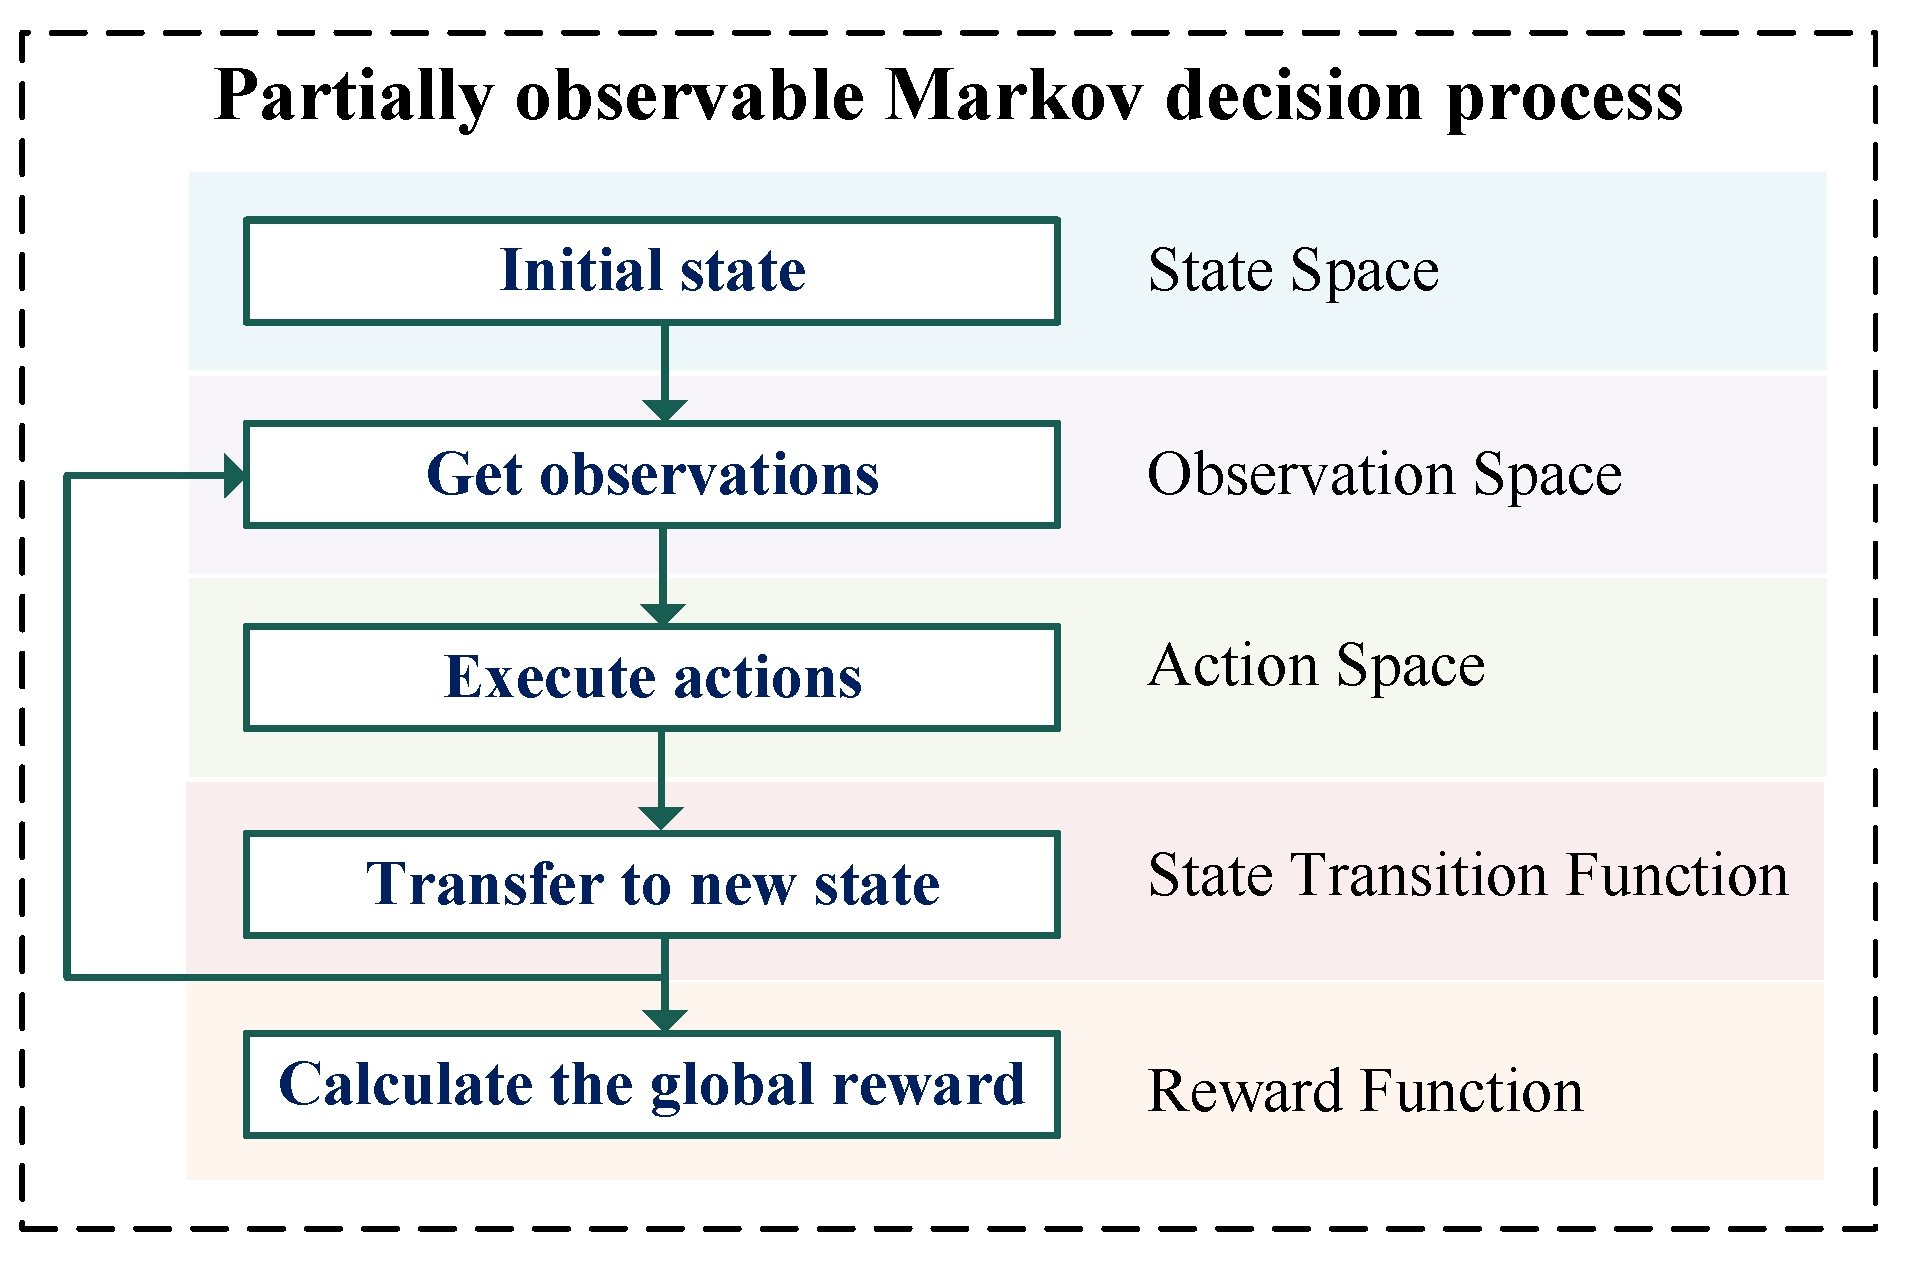
2. Partially Observable Markov Decision Process Formulation
- The network reconfiguration agent (NRA), responsible for optimizing network topology to isolate faults and restore network connectivity.
- The power scheduling agent (PSA), which schedules DERs to minimize restoration costs.
2.1. State Space
2.2. Observation Space
- The adjacency matrix encodes the topological structure of the power grid, where each element is defined as
- The node feature matrix describes node-specific attributes, where each row corresponds to a node, and each column represents a specific feature. It is defined aswhere n is the number of nodes, and d is the number of features per node. The feature vector of node i is given by .To support effective action generation, the node feature matrices for the NRA and PSA at time step t are defined aswhere and are the feature vectors of node i at time step t, defined aswhere denotes the power demand of the load at node i and time step t. and denote the maximum and minimum available power generation of the DER at node i and time step t, respectively. and correspond to the active power injection and voltage magnitude at node i and time step t, respectively. is a binary variable indicating whether the load at node i was restored at time step .
2.3. Action Space
2.4. State Transition Function
2.5. Reward Function
3. Multi-Agent Deep Reinforcement Learning Framework
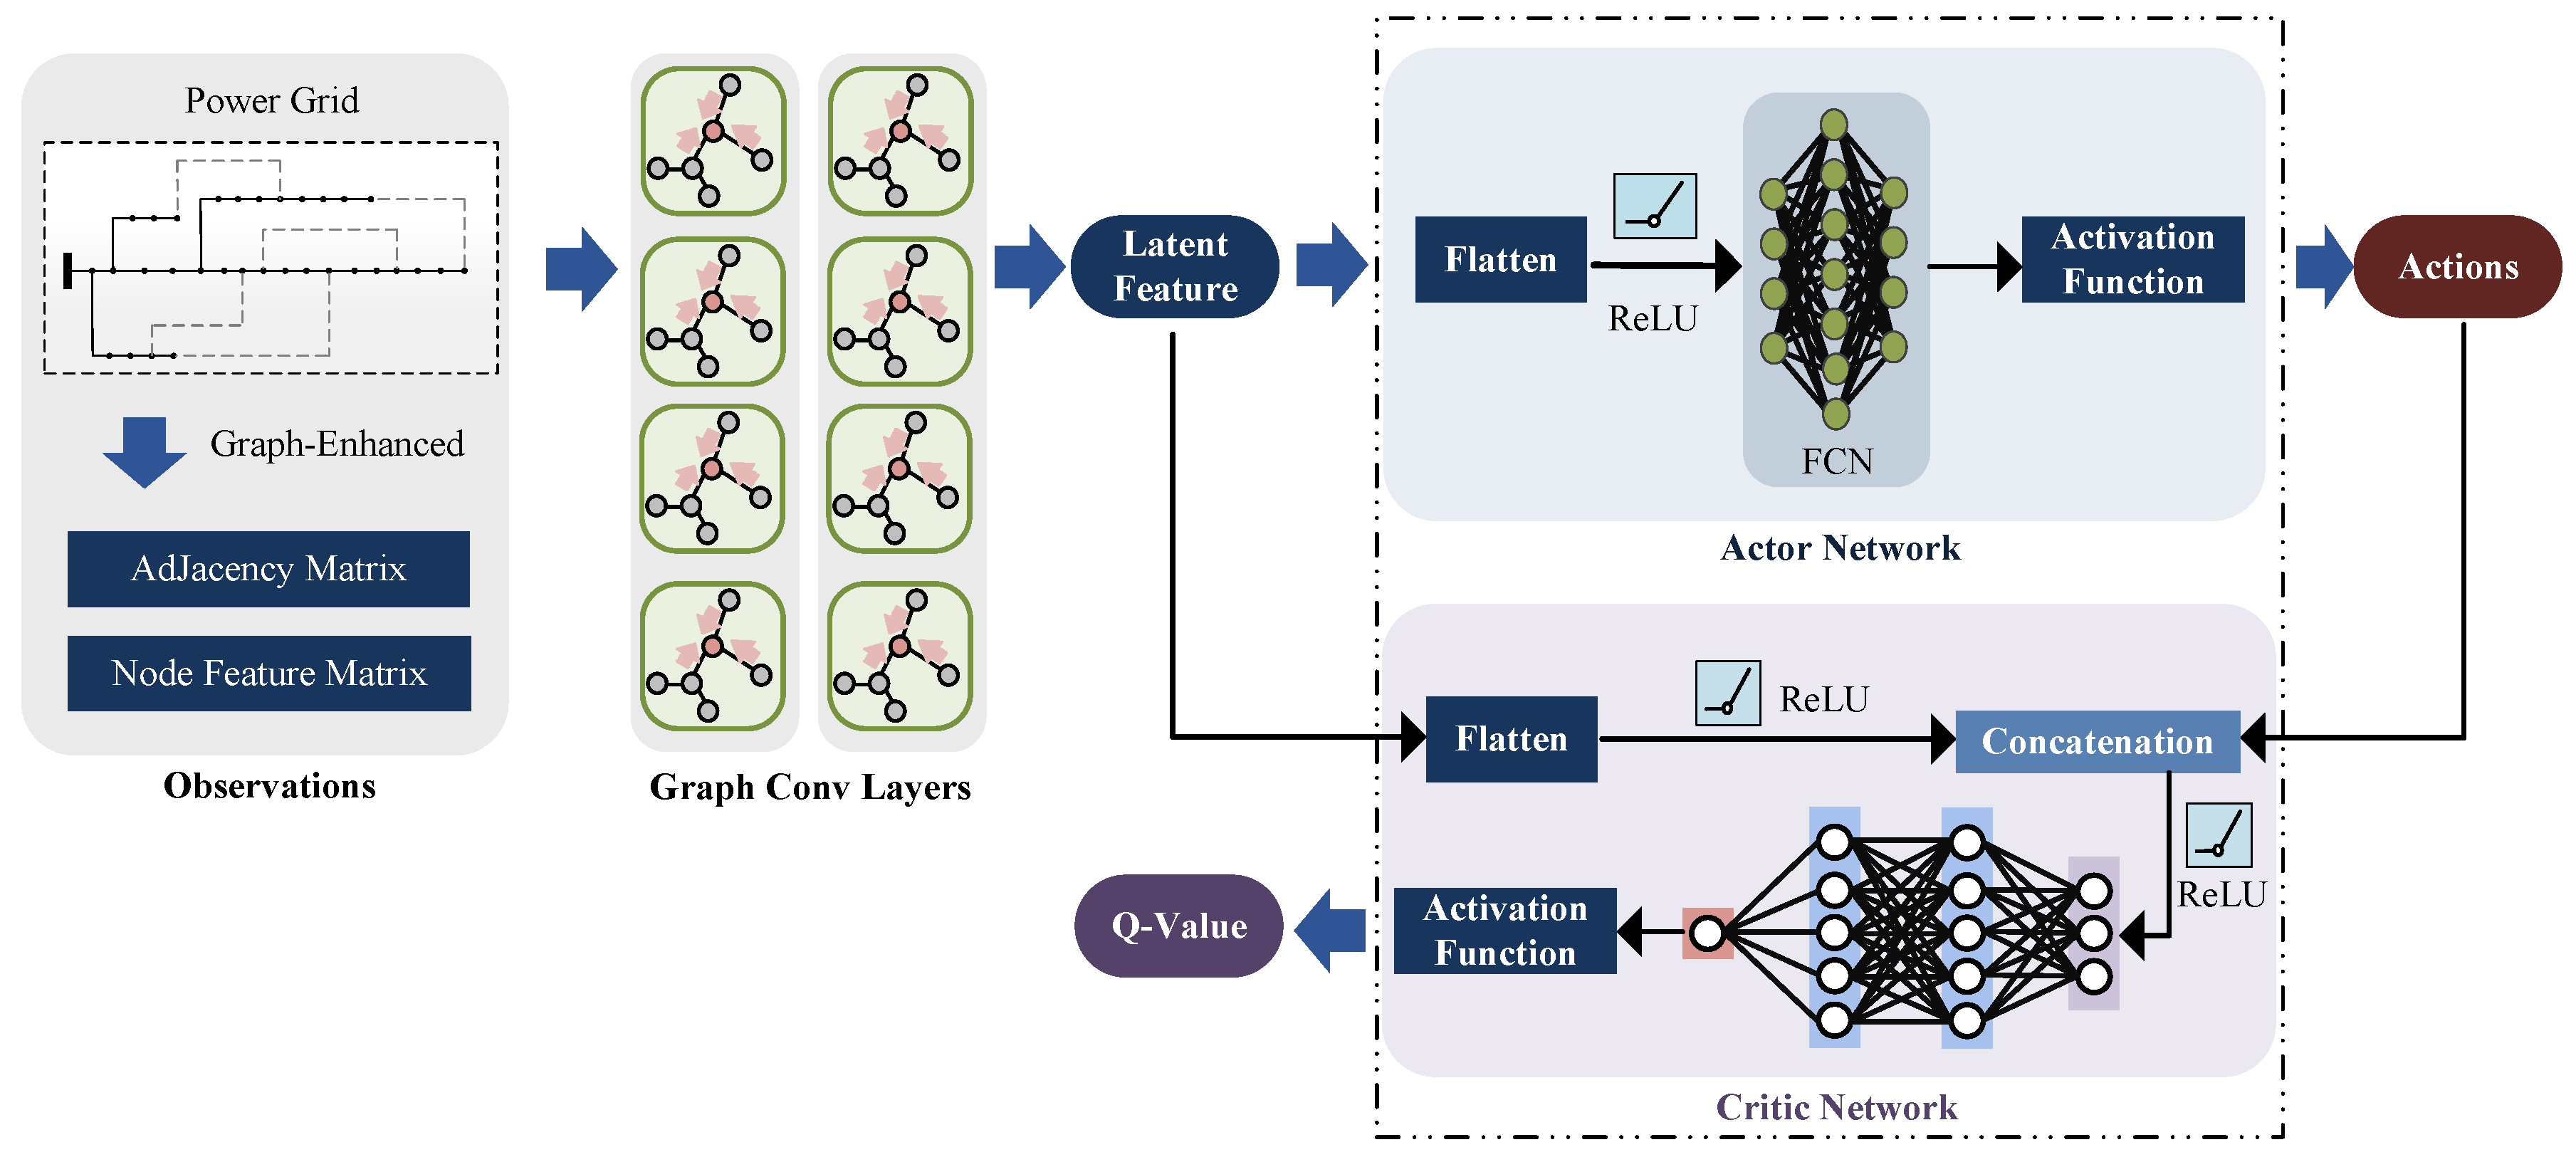
3.1. Graph-Enhanced Actor–Critic Architecture
- Actor network, which determines actions based on local observations.
- Critic network, which evaluates action quality using global information.
- The actor network extracts graph-based latent features from local observations and maps them to optimal actions.
- The critic network leverages global graph representations to estimate Q-values more effectively.
3.2. Multi-Agent Training Algorithm
- During training, each agent’s critic network has access to global state information and the actions of all agents. This helps in learning more stable and coordinated policies by leveraging system-wide observations.
- During execution, each agent makes decisions independently using only its local observations, ensuring practical applicability in real-world deployment.
- NRA shares topology changes with the PSA, allowing the PSA to adjust power dispatch accordingly.
- PSA provides load restoration feedback to the NRA, enabling it to optimize reconfiguration decisions.
- A global reward function (as defined in Section 2.5) ensures that both agents align their objectives to maximize system-wide restoration efficiency.
4. Case Study
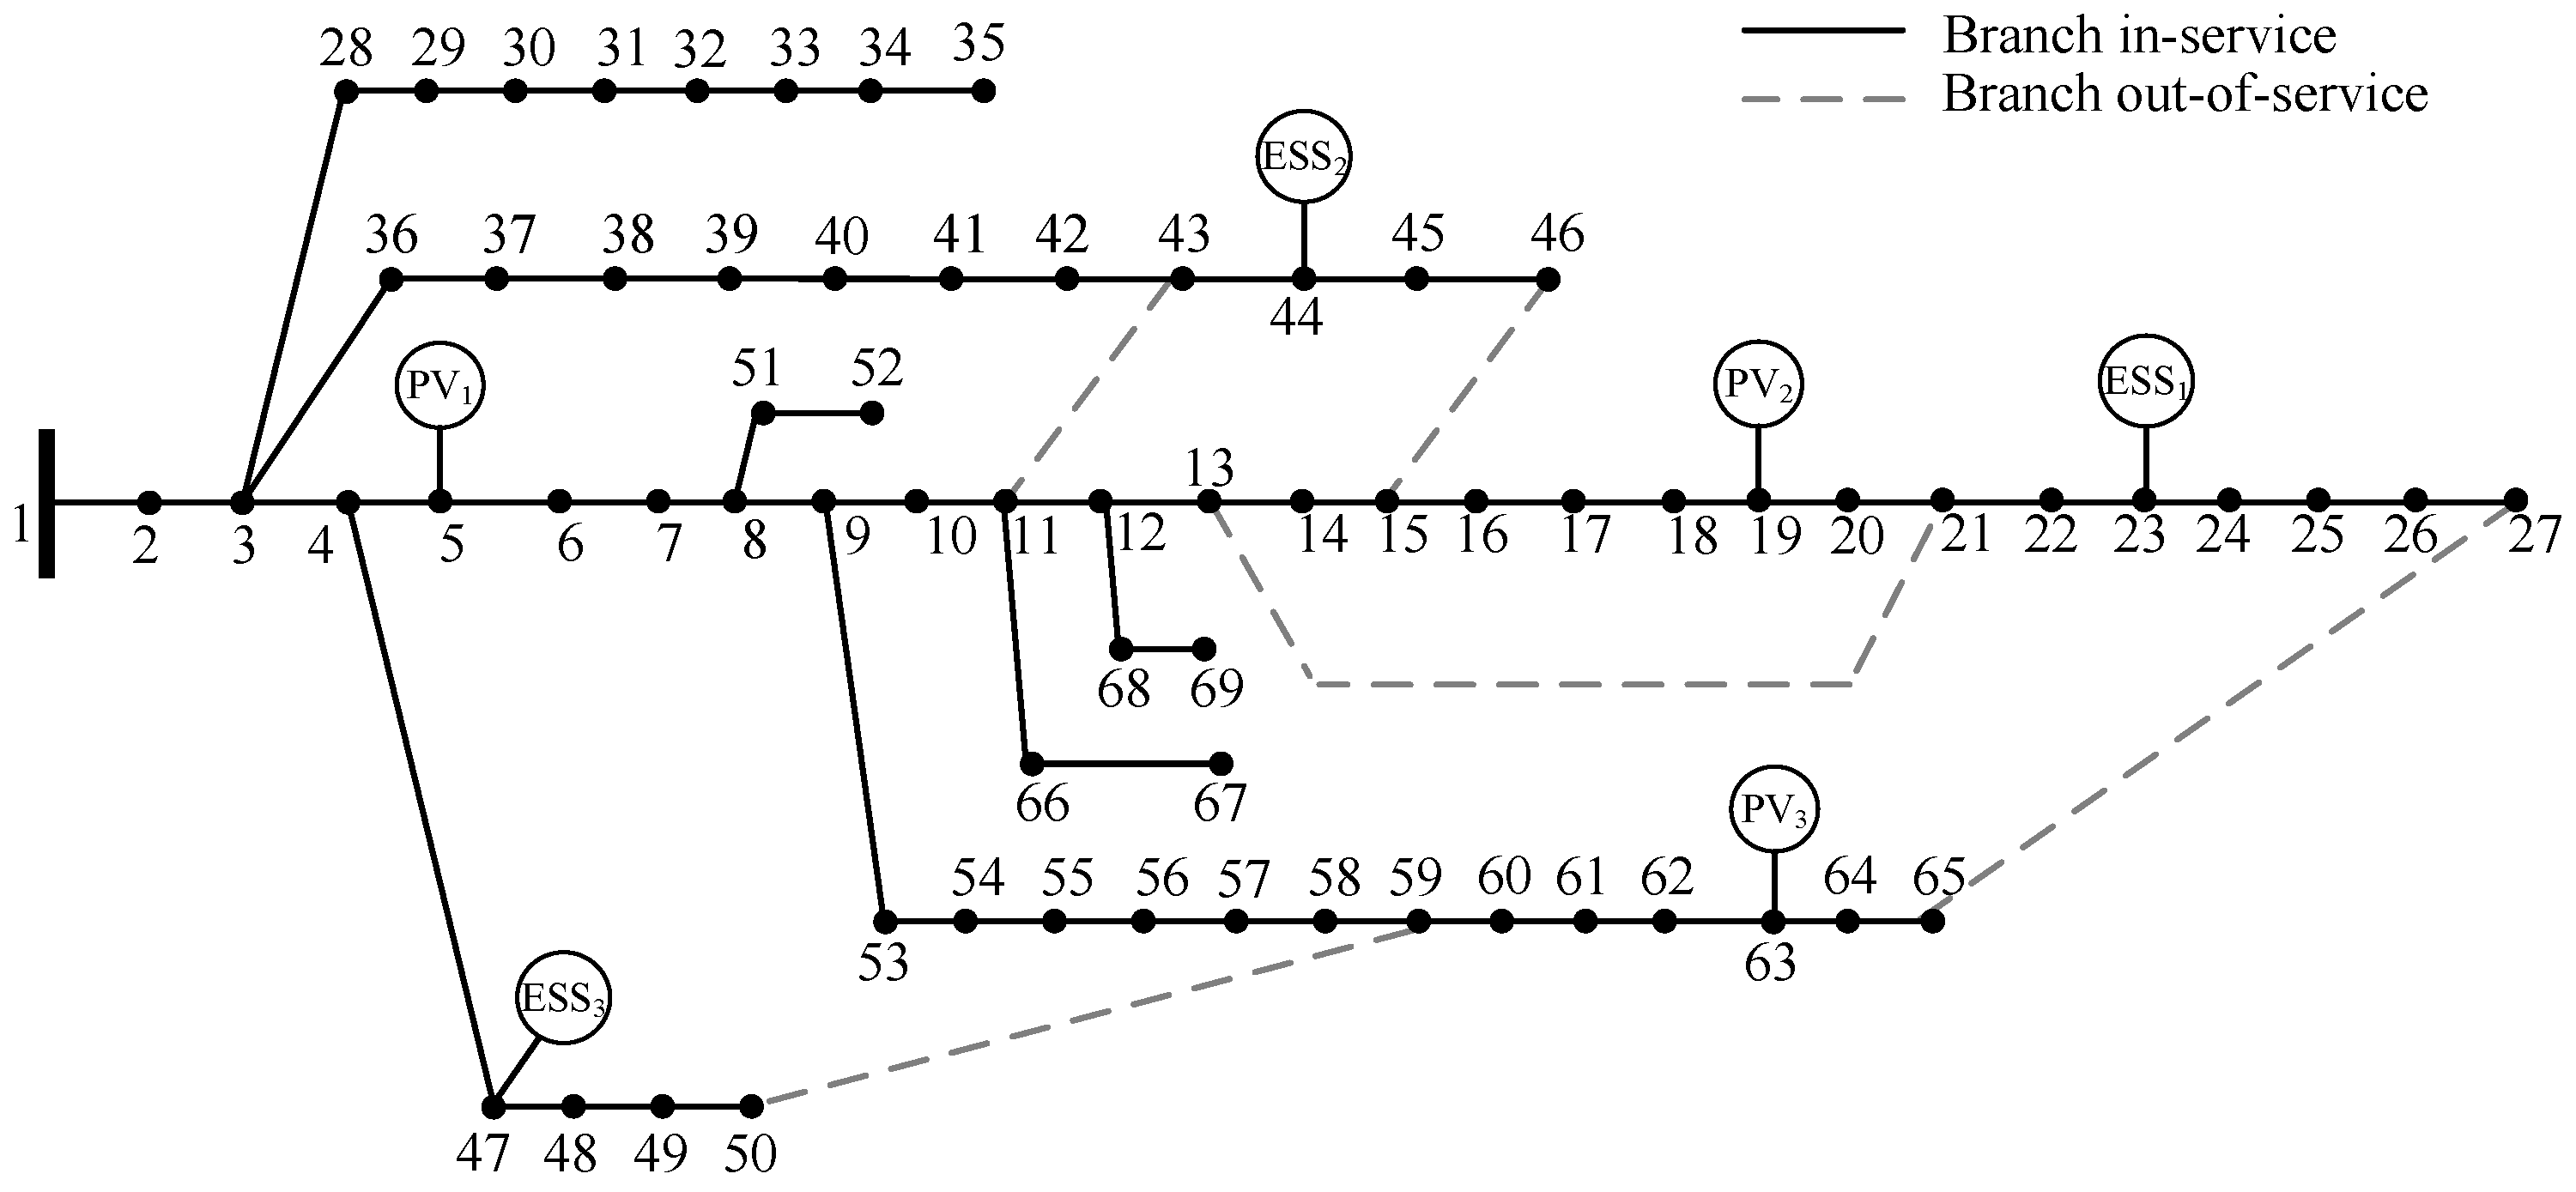
4.1. Experimental Setup
- Bus 23 is located at the end of a radial feeder, downstream of PV generation at bus 19. This placement supports voltage stability by mitigating voltage rise from upstream PV injection.
- Bus 44 is situated near the midpoint of another main feeder and adjacent to a normally open tie-switch, allowing effective interaction with reconfiguration operations and system flexibility.
- Bus 47 is located at the far end of the third radial feeder. This feeder includes a long radial section ending at node 50, with limited local generation. Deploying ESSs here helps alleviate downstream voltage drops and loss concentration, especially during peak loads.
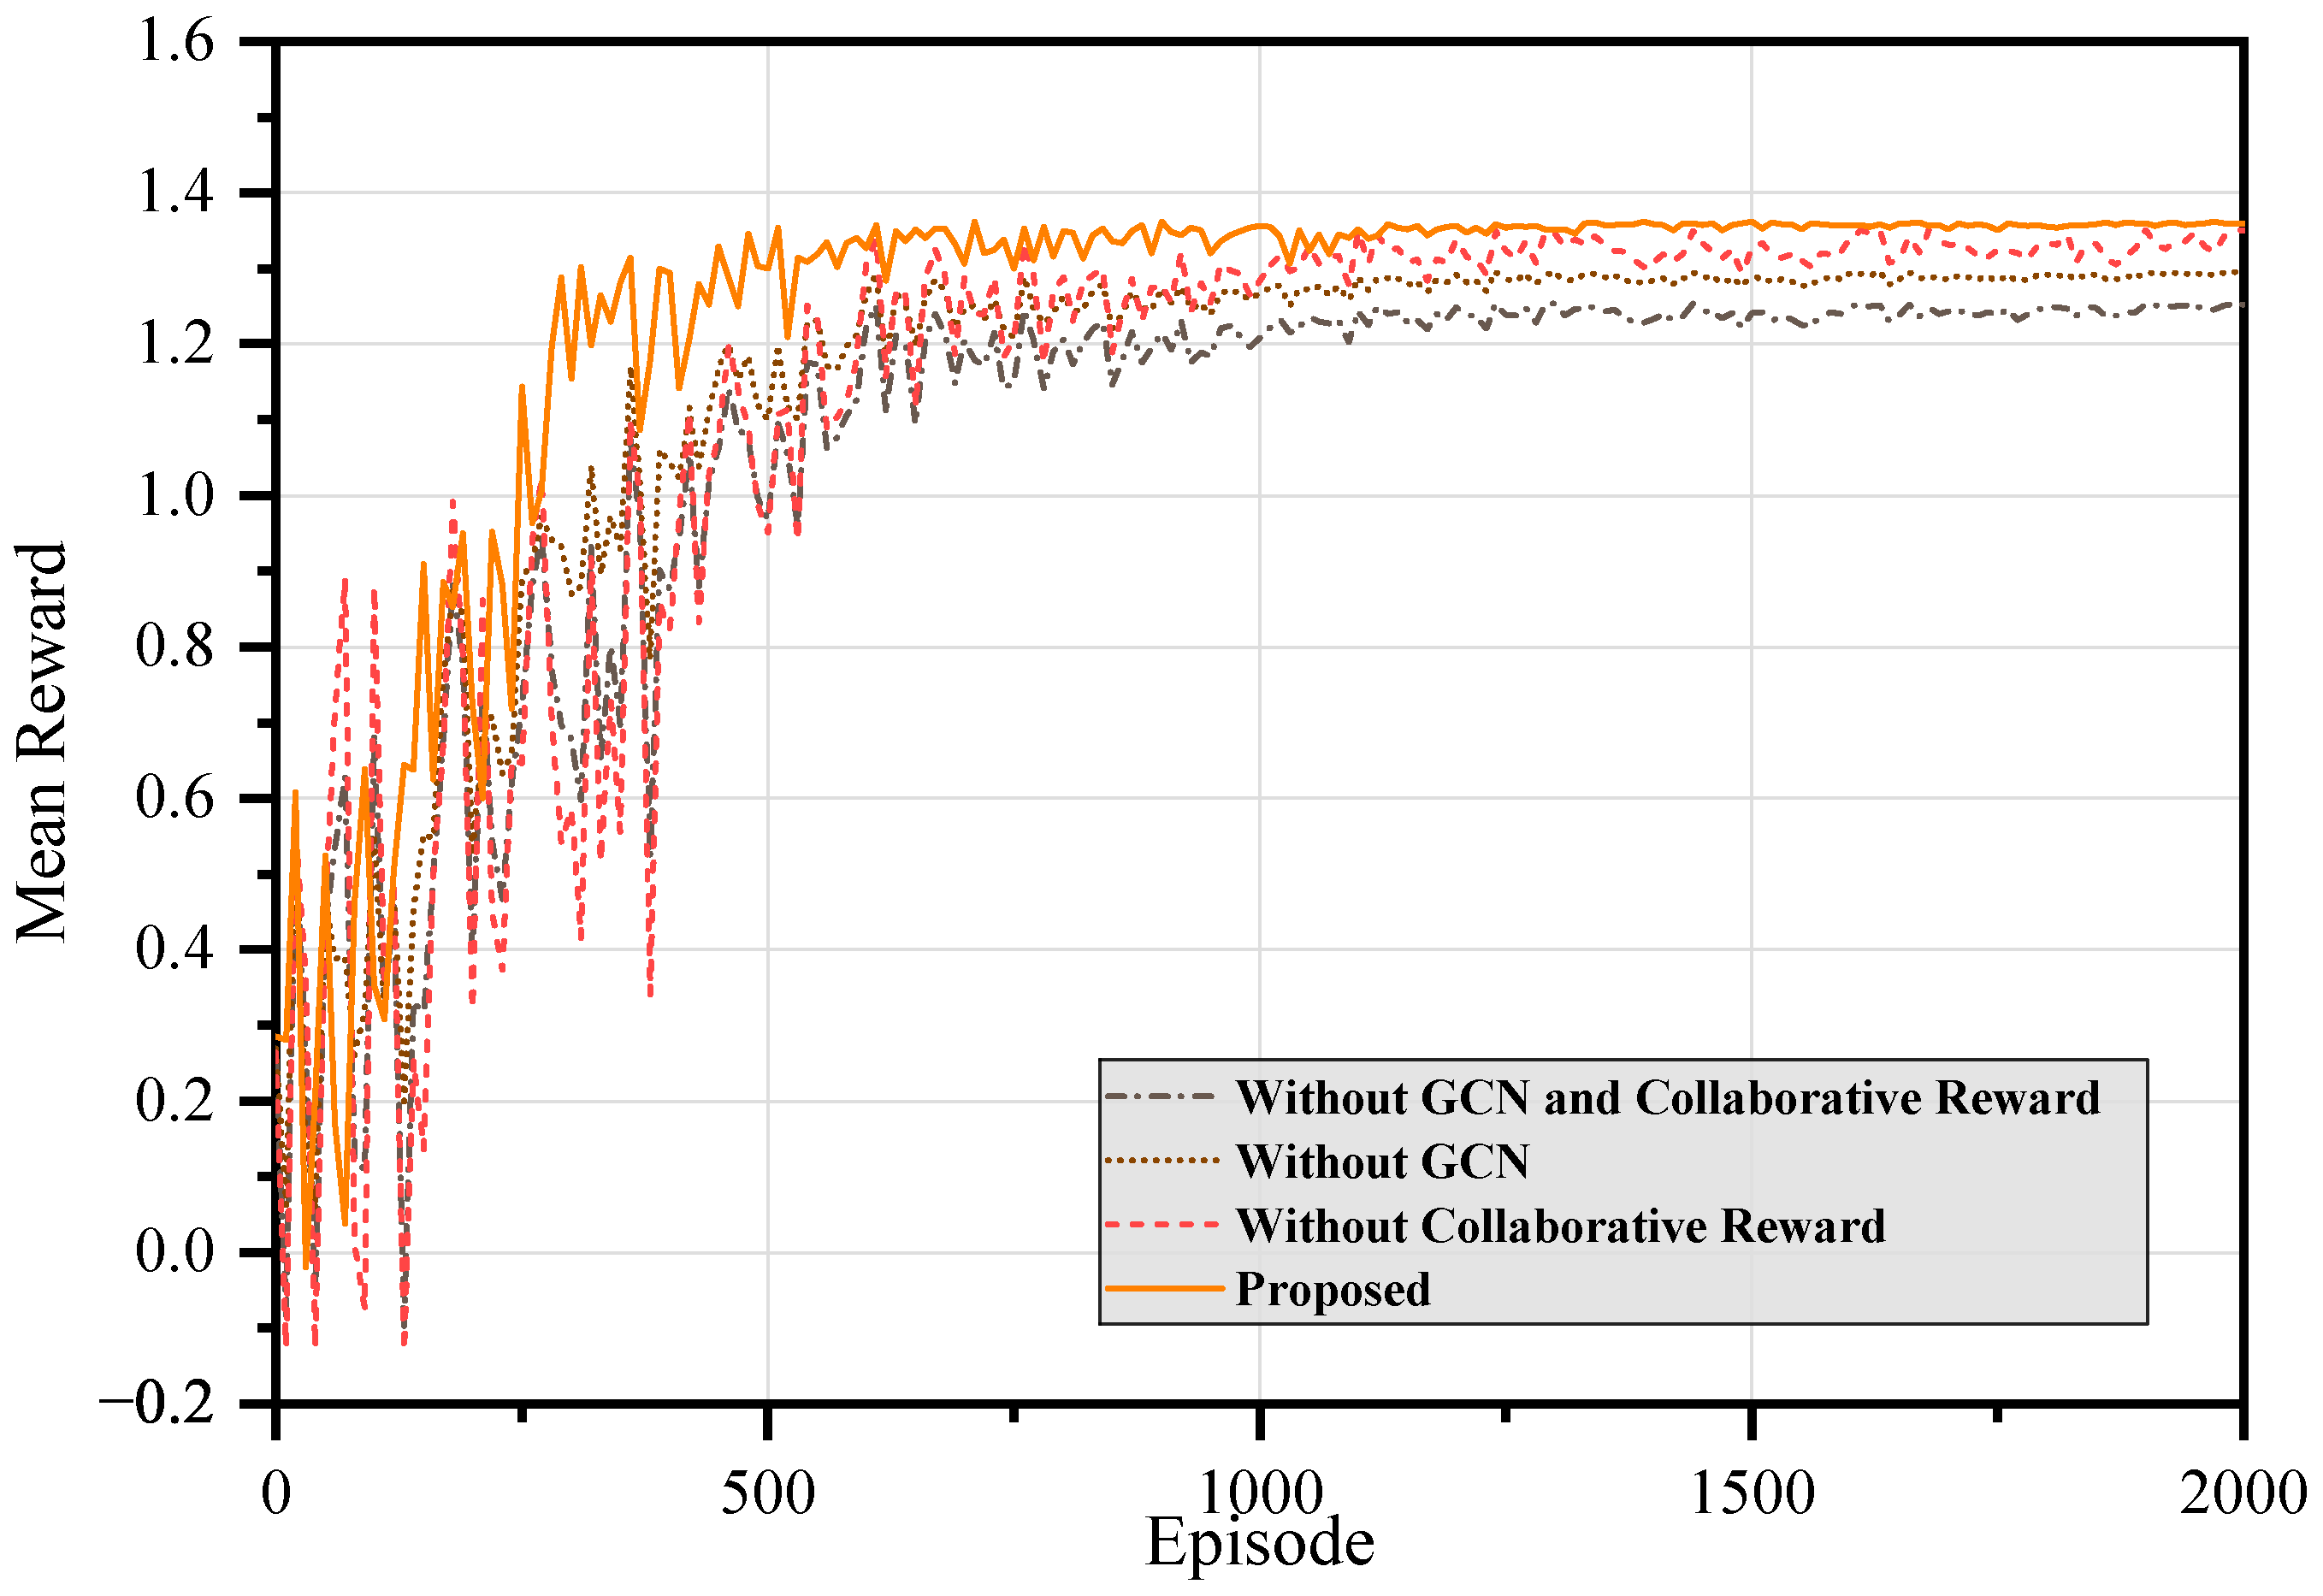
4.2. Training Performance Comparison
- DQN: designed for discrete action spaces, it enables only reconfiguration-based recovery through NRA, without continuous dispatch capability.
- DDPG: supports continuous action spaces; trains both NRA and PSA independently.
- MADDPG: facilitates centralized training with decentralized execution, enabling coordinated recovery through NRA and PSA.
- Proposed Method: builds upon MADDPG by incorporating GCNs for enhanced topology-aware decision-making and introducing a collaborative reward structure to improve agent coordination.
- Without GCN and Collaborative Reward: This baseline removes both the GCN and the collaborative reward mechanism. Agents are trained using FCNs and independent local rewards, which corresponds to the standard MADDPG algorithm.
- Without GCN: The graph-based feature extractor is replaced with a standard FCN, removing the ability to capture latent spatial features.
- Without Collaborative Reward: The collaborative reward mechanism is removed, and agents are trained by local rewards instead.
- Full Proposed Method: This is the complete version of our approach, incorporating both the GCN and the collaborative reward mechanism.
4.3. Testing and Validation
4.4. Practical Deployment and Engineering Feasibility
- Input requirements include only standard operational data such as switch status, node connectivity, load levels, and fault locations, which are typically available through existing SCADA or DMS platforms.
- Output consists of switching actions or sequences, which can be interpreted and validated by engineers without the need for algorithmic knowledge.
- Inference speed is within real-time operational requirements once the model is trained, enabling timely response in fault scenarios.
5. Conclusions
Author Contributions
Funding
Data Availability Statement
Conflicts of Interest
Appendix A

| Symbol | Definition |
|---|---|
| State space | |
| Observation space | |
| Action space | |
| The transition function | |
| The state of distribution system at time step t | |
| The graph representation of the distribution system at time step t | |
| N, E | The sets of nodes and edges, respectively |
| The set of all controllable switches | |
| ℧ | The set of DERs |
| The adjacency matrix | |
| The node feature matrix | |
| , | The node feature matrices for NRA and PSA at time step t, respectively |
| , | The feature vectors of node i for NRA and PSA, respectively |
| The power demand of the load at node i and time step t | |
| , | The maximum and minimum available power generation of the DER at node i and time step t, respectively |
| The active power injection at node i and time step t | |
| The voltage magnitude at node i and time step t | |
| A binary variable indicating whether the load at node i was restored at time step | |
| The actions for NRA and PSA at time step t, respectively | |
| The probability of closing switch at the time step t | |
| The power generation scaling factor of DER ℘ at time step t | |
| The actual power output of DER ℘ | |
| The maximum available generation capacity of DER ℘ at time step t | |
| The discounted cumulative reward at time step t | |
| The discount factor | |
| The rewards for network reconfiguration and power scheduling at time step t, respectively | |
| The total load power restored after the action at time step t | |
| The cost coefficient associated with DER ℘ | |
| The actual power generation of DER ℘ at time step t | |
| The global reward at time step t | |
| , , | The coefficients used to balance the contributions of different reward components |
| The penalty function to enforce system constraints during fault recovery |
| Symbol | Definition |
|---|---|
| The feature matrix at layer l | |
| A trainable weight matrix | |
| The normalized adjacency matrix | |
| The degree matrix | |
| A non-linear activation function | |
| The policy of agent i | |
| The parameters of actor network | |
| The local observation of agent i at current time step | |
| The centralized Q-function at current time step | |
| The experience replay buffer, which stores past transitions for stable training | |
| The parameters of critic network of agent i | |
| The target Q-value at current time step | |
| The estimated Q-value at the next time step | |
| The state at the next time step | |
| The actions of agents at the next time step |
References
- Zhao, Y.; Lin, J.; Song, Y.; Xu, Y. A robust microgrid formation strategy for resilience enhancement of hydrogen penetrated active distribution networks. IEEE Trans. Power Syst. 2023, 39, 2735–2748. [Google Scholar] [CrossRef]
- Ghosh, P.; De, M. Probabilistic quantification of distribution system resilience for an extreme event. Int. Trans. Electr. Energy Syst. 2022, 2022, 3838695. [Google Scholar] [CrossRef]
- Cai, S.; Xie, Y.; Zhang, M.; Jin, X.; Wu, Q.; Guo, J. A stochastic sequential service restoration model for distribution systems considering microgrid interconnection. IEEE Trans. Smart Grid 2023, 15, 2396–2409. [Google Scholar] [CrossRef]
- Zahraoui, Y.; Alhamrouni, I.; Basir Khan, M.R.; Mekhilef, S.; P. Hayes, B.; Rawa, M.; Ahmed, M. Self-healing strategy to enhance microgrid resilience during faults occurrence. Int. Trans. Electr. Energy Syst. 2021, 31, e13232. [Google Scholar] [CrossRef]
- Liu, S.; Chen, C.; Jiang, Y.; Lin, Z.; Wang, H.; Waseem, M.; Wen, F. Bi-level coordinated power system restoration model considering the support of multiple flexible resources. IEEE Trans. Power Syst. 2022, 38, 1583–1595. [Google Scholar] [CrossRef]
- Sabouhi, H.; Doroudi, A.; Fotuhi-Firuzabad, M.; Bashiri, M. Electricity distribution grids resilience enhancement by network reconfiguration. Int. Trans. Electr. Energy Syst. 2021, 31, e13047. [Google Scholar] [CrossRef]
- Wang, L.; Chen, B.; Ye, Y.; Chongfuangprinya, P.; Yang, B.; Zhao, D.; Hong, T. Enhancing distribution system restoration with coordination of repair crew, electric vehicle, and renewable energy. IEEE Trans. Smart Grid 2024, 15, 3694–3705. [Google Scholar] [CrossRef]
- Keshavarz Ziarani, H.; Hosseinian, S.H.; Fakharian, A. Providing a New Multiobjective Two-Layer Approach for Developing Service Restoration of a Smart Distribution System by Islanding of Faulty Area. Int. Trans. Electr. Energy Syst. 2024, 2024, 9687002. [Google Scholar] [CrossRef]
- Choopani, K.; Hedayati, M.; Effatnejad, R. Self-healing optimization in active distribution network to improve reliability, and reduction losses, switching cost and load shedding. Int. Trans. Electr. Energy Syst. 2020, 30, e12348. [Google Scholar] [CrossRef]
- Fan, B.; Liu, X.; Xiao, G.; Xu, Y.; Yang, X.; Wang, P. A Memory-Based Graph Reinforcement Learning Method for Critical Load Restoration With Uncertainties of Distributed Energy Resource. IEEE Trans. Smart Grid 2025, 16, 1706–1718. [Google Scholar] [CrossRef]
- Liu, W.; Ding, F. Hierarchical distribution system adaptive restoration with diverse distributed energy resources. IEEE Trans. Sustain. Energy 2020, 12, 1347–1359. [Google Scholar] [CrossRef]
- Taheri, B.; Safdarian, A.; Moeini-Aghtaie, M.; Lehtonen, M. Distribution system resilience enhancement via mobile emergency generators. IEEE Trans. Power Deliv. 2020, 36, 2308–2319. [Google Scholar] [CrossRef]
- Alobaidi, A.H.; Fazlhashemi, S.S.; Khodayar, M.; Wang, J.; Khodayar, M.E. Distribution service restoration with renewable energy sources: A review. IEEE Trans. Sustain. Energy 2022, 14, 1151–1168. [Google Scholar] [CrossRef]
- Sun, X.; Xie, H.; Bie, Z.; Li, G. Restoration of high-renewable-penetrated distribution systems considering uncertain repair workloads. Csee J. Power Energy Syst. 2022, 11, 150–162. [Google Scholar]
- Nazemi, M.; Dehghanian, P.; Lu, X.; Chen, C. Uncertainty-aware deployment of mobile energy storage systems for distribution grid resilience. IEEE Trans. Smart Grid 2021, 12, 3200–3214. [Google Scholar] [CrossRef]
- Zhao, J.; Wang, H.; Wu, Q.; Hatziargyriou, N.D.; Shen, F. Optimal generator start-up sequence for bulk system restoration with active distribution networks. IEEE Trans. Power Syst. 2020, 36, 2046–2057. [Google Scholar] [CrossRef]
- Erenoğlu, A.K.; Erdinç, O. Real-time allocation of multi-mobile resources in integrated distribution and transportation systems for resilient electrical grid. IEEE Trans. Power Deliv. 2022, 38, 1108–1119. [Google Scholar] [CrossRef]
- Li, G.; Yan, K.; Zhang, R.; Jiang, T.; Li, X.; Chen, H. Resilience-oriented distributed load restoration method for integrated power distribution and natural gas systems. IEEE Trans. Sustain. Energy 2021, 13, 341–352. [Google Scholar] [CrossRef]
- Zhang, L.; Wang, C.; Liang, J.; Wu, M.; Zhang, B.; Tang, W. A coordinated restoration method of hybrid AC/DC distribution network for resilience enhancement. IEEE Trans. Smart Grid 2022, 14, 112–125. [Google Scholar] [CrossRef]
- Long, Y.; Lu, Y.; Zhao, H.; Wu, R.; Bao, T.; Liu, J. Multilayer deep deterministic policy gradient for static safety and stability analysis of novel power systems. Int. Trans. Electr. Energy Syst. 2023, 2023, 4295384. [Google Scholar] [CrossRef]
- Chai, R.; Niu, H.; Carrasco, J.; Arvin, F.; Yin, H.; Lennox, B. Design and experimental validation of deep reinforcement learning-based fast trajectory planning and control for mobile robot in unknown environment. IEEE Trans. Neural Netw. Learn. Syst. 2022, 35, 5778–5792. [Google Scholar] [CrossRef] [PubMed]
- Bian, R.; Jiang, X.; Zhao, G.; Liu, Y.; Dai, Z. A Scalable and Coordinated Energy Management for Electric Vehicles Based on Multiagent Reinforcement Learning Method. Int. Trans. Electr. Energy Syst. 2024, 2024, 7765710. [Google Scholar] [CrossRef]
- Fan, B.; Liu, X.; Xiao, G.; Yang, X.; Chen, B.; Wang, P. Enhancing Adaptability of Restoration Strategy for Distribution Network: A Meta-Based Graph Reinforcement Learning Approach. IEEE Internet Things J. 2024, 11, 25440–25453. [Google Scholar] [CrossRef]
- Zhao, J.; Li, F.; Sun, H.; Zhang, Q.; Shuai, H. Self-attention generative adversarial network enhanced learning method for resilient defense of networked microgrids against sequential events. IEEE Trans. Power Syst. 2022, 38, 4369–4380. [Google Scholar] [CrossRef]
- Nikkhah, M.H.; Lotfi, H.; Samadi, M.; Hajiabadi, M.E. Energy hub management considering demand response, distributed generation, and electric vehicle charging station. Int. Trans. Electr. Energy Syst. 2023, 2023, 9042957. [Google Scholar] [CrossRef]
- Ye, Y.; Wang, H.; Chen, P.; Tang, Y.; Strbac, G. Safe deep reinforcement learning for microgrid energy management in distribution networks with leveraged spatial–temporal perception. IEEE Trans. Smart Grid 2023, 14, 3759–3775. [Google Scholar] [CrossRef]
- Alatawi, M.N. Optimization of Home Energy Management Systems in smart cities using bacterial foraging algorithm and deep reinforcement learning for Enhanced Renewable Energy Integration. Int. Trans. Electr. Energy Syst. 2024, 2024, 2194986. [Google Scholar] [CrossRef]
- Bedoya, J.C.; Wang, Y.; Liu, C.C. Distribution system resilience under asynchronous information using deep reinforcement learning. IEEE Trans. Power Syst. 2021, 36, 4235–4245. [Google Scholar] [CrossRef]
- Zhang, Y.; Qiu, F.; Hong, T.; Wang, Z.; Li, F. Hybrid imitation learning for real-time service restoration in resilient distribution systems. IEEE Trans. Ind. Inform. 2021, 18, 2089–2099. [Google Scholar] [CrossRef]
- Du, Y.; Wu, D. Deep reinforcement learning from demonstrations to assist service restoration in islanded microgrids. IEEE Trans. Sustain. Energy 2022, 13, 1062–1072. [Google Scholar] [CrossRef]
- Mocanu, E.; Mocanu, D.C.; Nguyen, P.H.; Liotta, A.; Webber, M.E.; Gibescu, M.; Slootweg, J.G. On-line building energy optimization using deep reinforcement learning. IEEE Trans. Smart Grid 2018, 10, 3698–3708. [Google Scholar] [CrossRef]
- Fan, B.; Liu, X.; Xiao, G.; Kang, Y.; Wang, D.; Wang, P. Attention-Based Multiagent Graph Reinforcement Learning for Service Restoration. IEEE Trans. Artif. Intell. 2024, 5, 2163–2178. [Google Scholar] [CrossRef]
- Thurner, L.; Scheidler, A.; Schäfer, F.; Menke, J.H.; Dollichon, J.; Meier, F.; Meinecke, S.; Braun, M. Pandapower—An Open-Source Python Tool for Convenient Modeling, Analysis, and Optimization of Electric Power Systems. IEEE Trans. Power Syst. 2018, 33, 6510–6521. [Google Scholar] [CrossRef]
- Chen, X.; Wu, W.; Zhang, B. Robust restoration method for active distribution networks. IEEE Trans. Power Syst. 2015, 31, 4005–4015. [Google Scholar] [CrossRef]
- Chen, K.; Wu, W.; Zhang, B.; Sun, H. Robust restoration decision-making model for distribution networks based on information gap decision theory. IEEE Trans. Smart Grid 2014, 6, 587–597. [Google Scholar] [CrossRef]
- Guan, W.; Tan, Y.; Zhang, H.; Song, J. Distribution system feeder reconfiguration considering different model of DG sources. Int. J. Electr. Power Energy Syst. 2015, 68, 210–221. [Google Scholar] [CrossRef]
- Luo, W.; Li, C.; Ju, S. Multisource cooperative restoration strategy for distribution system considering islanding integration. Power Syst. Technol. 2022, 46, 1485–1495. [Google Scholar]
- Liu, K.y.; Sheng, W.; Liu, Y.; Meng, X. A network reconfiguration method considering data uncertainties in smart distribution networks. Energies 2017, 10, 618. [Google Scholar] [CrossRef]
- Chakravorty, M.; Das, D. Voltage stability analysis of radial distribution networks. Int. J. Electr. Power Energy Syst. 2001, 23, 129–135. [Google Scholar] [CrossRef]


| Approach | Network Topology Modeling | Action Space Handling | Multi-Agent Cooperation | Reward Design | Learning Algorithm |
|---|---|---|---|---|---|
| Reference [28] | No | Discrete | No | Local | DQN |
| Reference [29] | No | Discrete | No | Local | DQN |
| Reference [30] | No | Continuous | No | Local | DDPG |
| Reference [31] | No | Continuous | Yes | Local | MADDPG |
| Our Paper | Yes | Action decomposition | Yes | Global | MADDPG + GCN |
| Node | Type | Capacity | Control Capability |
|---|---|---|---|
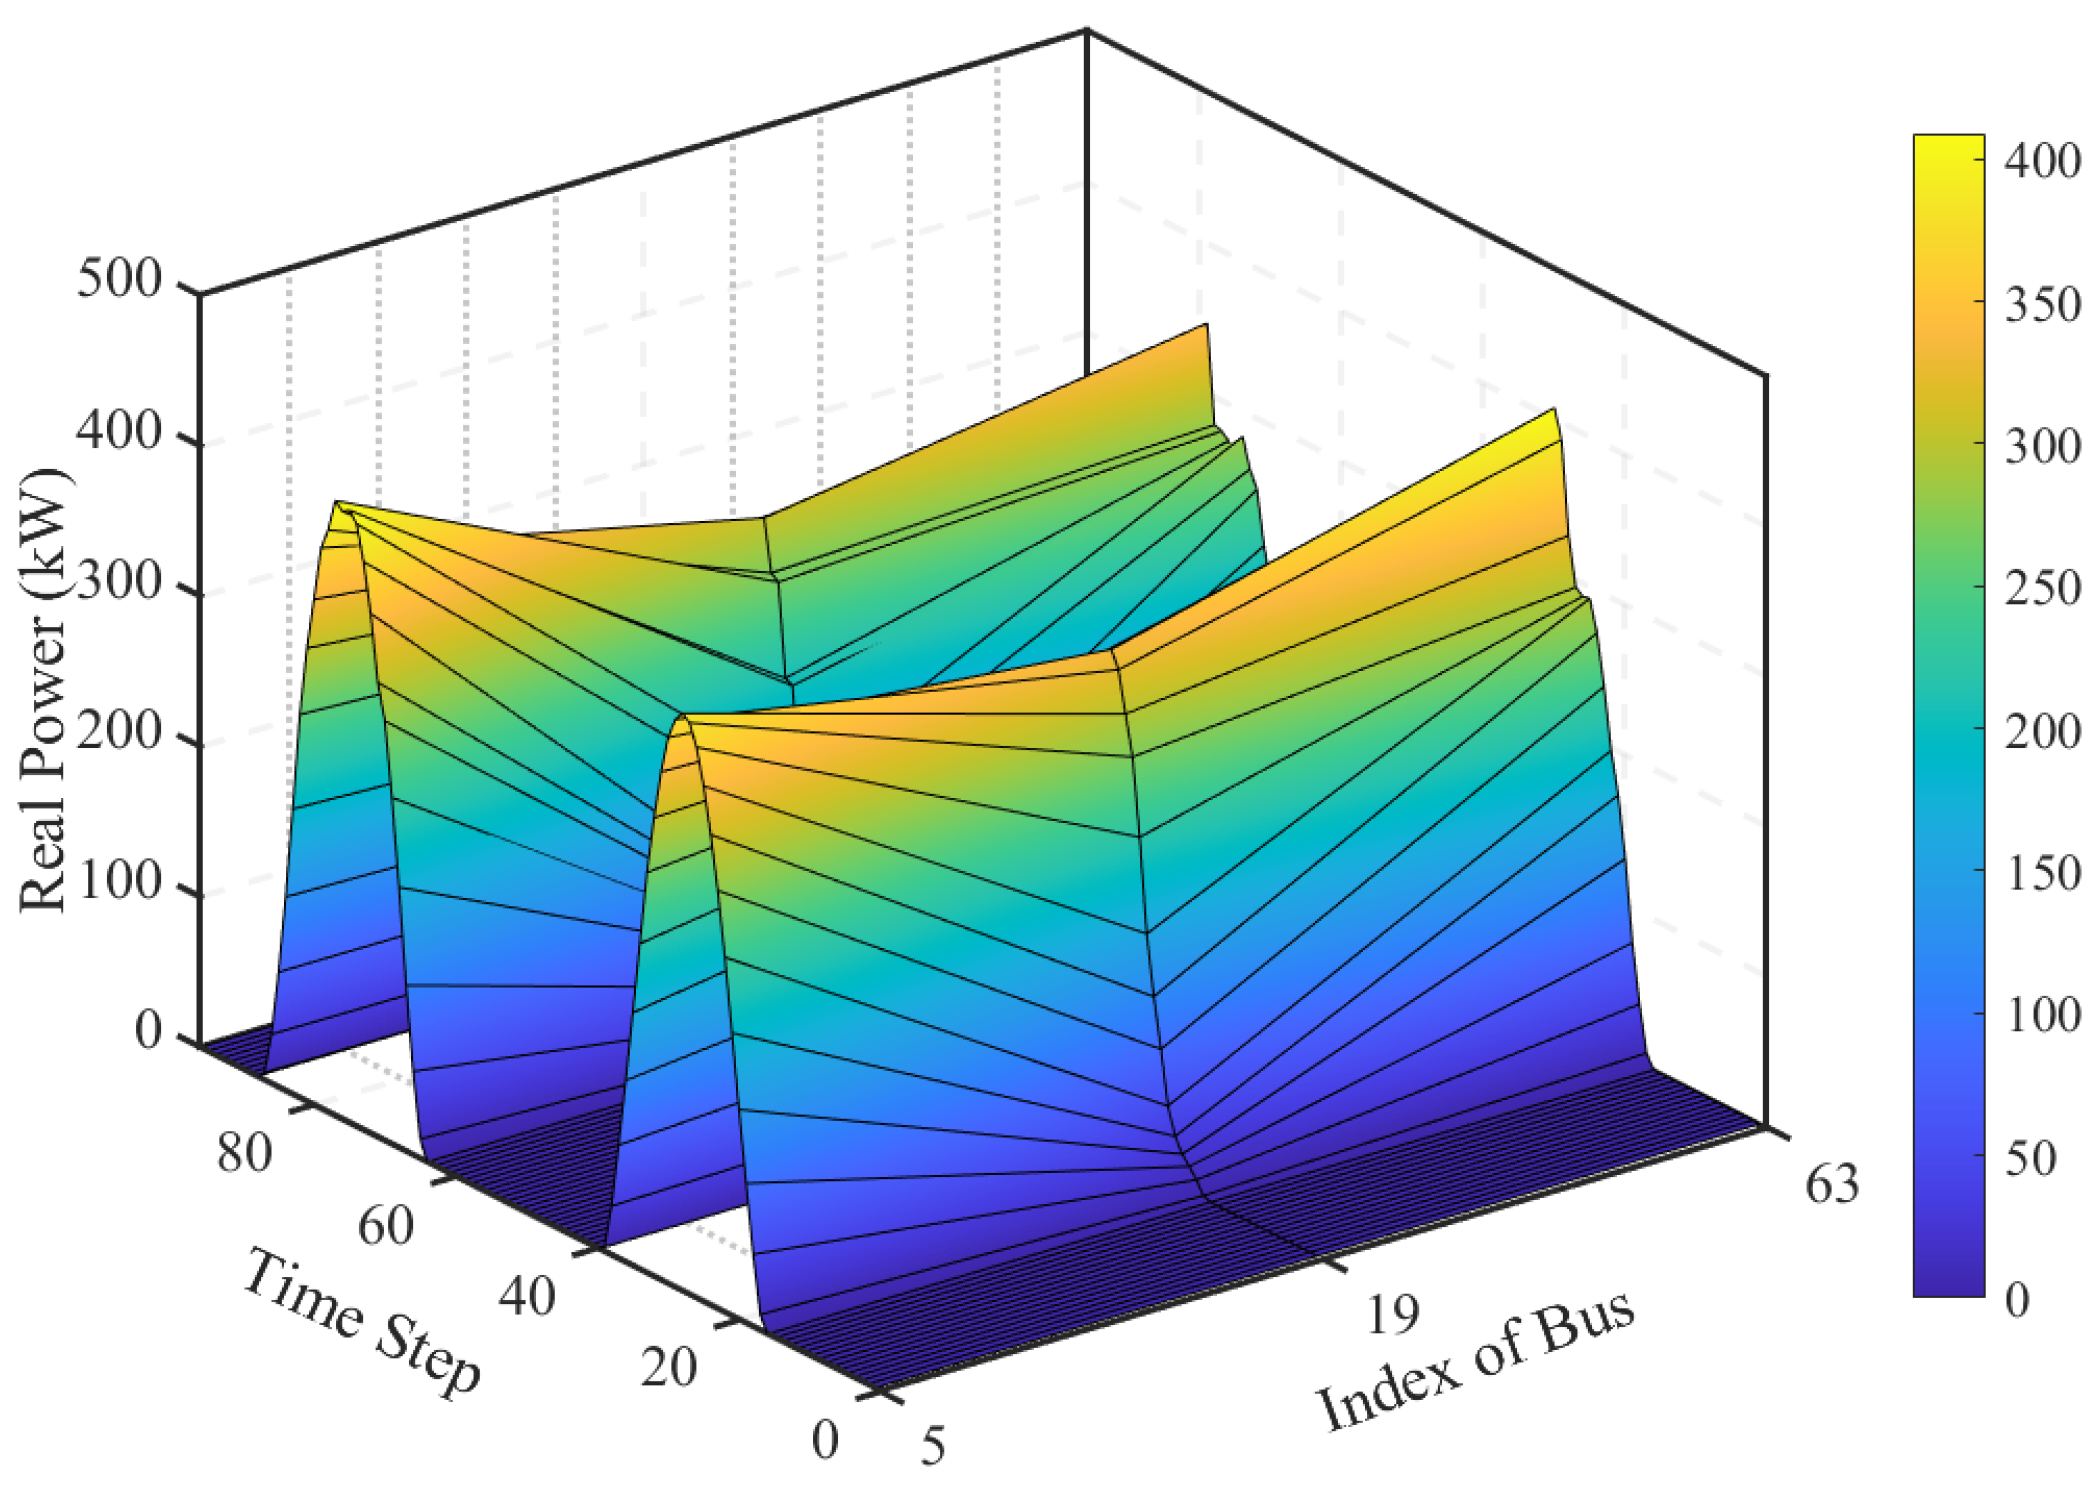
| 5 | PV1 | See Figure 6 | No |
| 19 | PV2 | No | |
| 63 | PV3 | No | |
| 23 | ESS1 | 300 kW | Yes |
| 44 | ESS2 | 250 kW | Yes |
| 47 | ESS3 | 150 kW | Yes |
| Parameter | Value |
|---|---|
| Learning rate of Actor | 1 × |
| Learning rate of Actor | 1 × |
| Discount factor | 0.9 |
| Replay buffer size | 5000 |
| Batch size | 64 |
| GCN layers | 2 |
| Time | Method | Load Recovery (%) | Cost (p.u.) | Switches Opened | Switches Closed | p-Value * |
|---|---|---|---|---|---|---|
| 08:00 | Proposed | 99.3 ± 0.4 | 0.42 ± 0.03 | 54–55, 14–15 | 50–59, 11–43 | <0.01 |
| MADDPG | 97.6 ± 0.6 | 0.49 ± 0.05 | 12–13, 55–56 | 11–43, 27–65 | ||
| 12:00 | Proposed | 100.0 ± 0.0 | 0.33 ± 0.02 | 09–53 | 50–59, 65–27 | <0.05 |
| MADDPG | 99.1 ± 0.5 | 0.35 ± 0.04 | 54–55 | 15–46, 65–27 | ||
| 18:00 | Proposed | 96.8 ± 0.3 | 0.45 ± 0.04 | 25–26, 64–65, 09–10 | 15–46, 50–59 | <0.01 |
| MADDPG | 94.2 ± 0.5 | 0.52 ± 0.06 | 54–55, 64–65 | 11–43, 50–59 |
| Metric | Value |
|---|---|
| Training Time | 47.21 min |
| Average Inference Time | 0.034 s per decision |
Disclaimer/Publisher’s Note: The statements, opinions and data contained in all publications are solely those of the individual author(s) and contributor(s) and not of MDPI and/or the editor(s). MDPI and/or the editor(s) disclaim responsibility for any injury to people or property resulting from any ideas, methods, instructions or products referred to in the content. |
© 2025 by the authors. Licensee MDPI, Basel, Switzerland. This article is an open access article distributed under the terms and conditions of the Creative Commons Attribution (CC BY) license (https://creativecommons.org/licenses/by/4.0/).
Share and Cite
Liu, Y.; Liao, P.; Wang, Y. Using Graph-Enhanced Deep Reinforcement Learning for Distribution Network Fault Recovery. Machines 2025, 13, 543. https://doi.org/10.3390/machines13070543
Liu Y, Liao P, Wang Y. Using Graph-Enhanced Deep Reinforcement Learning for Distribution Network Fault Recovery. Machines. 2025; 13(7):543. https://doi.org/10.3390/machines13070543
Chicago/Turabian StyleLiu, Yueran, Peng Liao, and Yang Wang. 2025. "Using Graph-Enhanced Deep Reinforcement Learning for Distribution Network Fault Recovery" Machines 13, no. 7: 543. https://doi.org/10.3390/machines13070543
APA StyleLiu, Y., Liao, P., & Wang, Y. (2025). Using Graph-Enhanced Deep Reinforcement Learning for Distribution Network Fault Recovery. Machines, 13(7), 543. https://doi.org/10.3390/machines13070543