1. Introduction
The fitting process is the core to the rolling bearing production process. This process has a great influence on the performance and longevity of the bearings [
1]. It involves grouping and fitting components such as inner rings, outer rings and balls according to certain criteria. Bearing fittings are selected by accurately measuring the raceway diameters of the inner and outer rings to ensure that their dimensions are within the specified tolerances. After the bearing fitting is completed, the interval between the inner ring, outer ring and ball, i.e., the clearance, is one of the important indexes of the bearing service performance. The dimension and distribution of the clearance has a significant impact on the smoothness of the bearing’s operation, noise level, load distribution and life [
2,
3,
4]. Therefore, the precise control of the bearing fitting selection on the system clearance is the key to ensure the service performance and reliability of the bearings.
At present, the rolling bearing fitting process in many factories is still based on manual sorting and fitting. However, this method causes high labor intensity and low efficiency. Due to the inability to optimize the overall clearance selection, it is easy to cause an unstable bearing quality and component waste [
5,
6]. Especially in the process of fitting, due to the lack of cage isolation of the steel balls, balls easily collide with each other, which leads to a larger fitting error. With the increase in the degree of automation of bearing fitting technology, the modern assembly lines of some bearing companies have been promoted [
7,
8,
9,
10]. At present, the traditional optimal selection method is commonly used in current automated bearing assembly lines. On the one hand, it improves the fitting accuracy. But on the other hand, it is easy to cause components with larger deviations to remain in the waiting area for a long time [
11]. As the automatic assembly line continues to run, these larger deviations in components may gradually fill up the waiting area, which ultimately leads to production interruption and affects the efficiency of the bearing fitting.
Several scholars have proposed innovative solutions to the bearing assembly optimization problem. Wang [
12] simulated the process of bearing fitting by computer and selected the optimal combination to maximize the number of inner and outer ring fittings. Liu [
13] has improved the assembly process of deep groove ball bearings and angular contact ball bearings by targeting the radial clearance, realized the group interchangeability or full interchangeability of the bearing components, reduced the dispersion of the bearing quality characteristic value, and made the rework products reduced significantly. Xu [
14] studied the rolling bearing selection optimization method with clearance and roller error as constraints and the bearing assembly qualification rate as the objective to establish the rolling bearing selection optimization algorithm based on the Hungarian algorithm. However, Xu did not put forward a solution for the large-volume component fitting method. Kannan et al. [
15] established a corresponding part selection model for the single-size chain part selection problem with the minimum assembly tolerance as the optimization objective and used the particle swarm algorithm to achieve the objective optimization. However, the performance of the particle swarm algorithm is more sensitive to the parameters, and it is easy to fall into the local optimum with improper parameter selection. Jeevanantham [
16] proposed a new hierarchical clustering method for group tolerance, which predicts the accuracy of assembly variations by pre-fitting calculations. So, the assembly is able to confirm the required clearance specifications and obtain a grouping method that satisfies the clearance specification. Jia [
17] addressed the difficulty of solving advanced tolerance design problems using traditional optimization techniques, using genetic algorithms to transform the nonlinear multivariate optimal tolerance design problem into a multimodal solution space that can generate combinations. However, the parameters are highly sensitive, and improper parameter selection does not optimize well and falls into a local optimum. Cong [
18] proposed a selective assembly method based on the genetic algorithm, aiming to improve the assembly success rate and reduce the number of remaining components by optimizing the grouping strategy and assembly process. Taking deep groove ball bearings as an example, one first considers the tolerance range of the components, sets the number of groups for different components, and then sets the upper and lower tolerance limits for each group according to the tolerance range of the components. If the measured tolerance is within the tolerance range of the group, the components will be grouped until all components are allocated. Zmarzły [
19] studied the measurement method and measuring device of the radial internal clearance of rolling bearings to achieve an accurate measurement of the radial clearance of bearings and provide basic data for subsequent research on its relationship to the vibration level. Oswald [
20] studied the influence of the internal clearance of rolling bearings on the load distribution and fatigue life of deep groove ball bearings and cylindrical roller bearings under radial load. Fang [
21] studied and discussed the influence of internal clearance on the stiffness and stiffness fluctuation of ball bearings under different working conditions. However, there are fewer studies on large-scale bearing grouping, and there is generally a problem of falling into local optimization, resulting in the actual production still adopting the traditional method.
Due to the increasingly widespread application of computer-aided manufacturing technology, computer-aided selection has become a commonly used method in product fitting processes [
22,
23]. Tuproposed an optimization method based on the genetic algorithm for the selective fitting of valve products and verified the effectiveness of the method through practical cases. Sun et al. [
24] studied optimization methods for complex mechanical assembly processes, combined with computer optimization for assembly processes of gasoline engine systems with different levels of complexity, which improved product quality and the assembly qualification rate. Ren et al. [
25] studied the selection of waveguide components in radar assembly under multiple quality requirements. Considering assembly accuracy and qualification rate, a unified selection information model with multiple quality requirements in three-dimensional space has been established. This model achieved optimization of waveguide components’ selection. Babu et al. [
26] analyzed the problem of selecting the number of assembly groups and used the Taguchi loss model to calculate the deviation between assembly tolerances and the mean value. An Artificial Immune System (AIS) algorithm was proposed to obtain the optimal combination with the minimum assembly tolerance. Wang [
27] and Geetha [
28] used genetic algorithms to minimize assembly tolerance changes in complex assemblies while avoiding the production of residual parts. However, there is relatively little research on the selection and matching of bearing fitting. So, this article proposes a grouping selection method for bearing fitting.
In response to the optimization selection problem of deep groove ball bearings, this article uses a large amount of measured data on the dimensional deviation of the inner and outer rings to perform normal estimation of the dimensional deviation and establish its dimensional deviation distribution model. Based on the dimensional deviation distribution model of the inner and outer rings of deep groove ball bearings, this paper proposes two grouping methods for dimensional deviation: the equidistant grouping method and the equal probability grouping method. The success rates of bearing fitting using two grouping methods were compared and analyzed through computer simulation and bearing fitting experiments.
2. Methodology and Theory
2.1. The Traditional Fitting Method
The radial clearance of the bearing after fitting is calculated by this formula:
where
is the outer ring raceway diameter,
is the inner ring raceway diameter and
is the bearing ball diameter.
The commonly used bearing fitting equipment is used to precisely measure the diameter of the inner and outer ring raceway of the bearing and then select the appropriate dimension of the ball according to the required clearance range of the bearing fitting to ensure that the radial clearance of the bearing after fitting is within the required clearance range of the product.
The traditional fitting method is based on the waiting area of the outer ring. The specific process is as follows: firstly, the first outer ring in the waiting area is matched with each inner ring and each group of steel balls. After the matching is completed, the second outer ring in the waiting area is matched with each inner ring and each group of steel balls in turn, and the process advances in this order according to this law. Assume that the inner and outer rings each have 6 waiting area lanes and that there are 2 sizes of steel balls. At this point, matching each set of outer rings to the inner ring produces 36 sets of data. Further, matching 2 more sets of balls expands the data to 72 sets. Out of these 72 data sets, the set with the tolerance within the specified range and the value closest to 0 is selected, and the fitting operation is performed based on this set of data. The specific process is shown in
Figure 1.
However, there are obvious drawbacks to this method. Due to the obsession with finding the optimum clearance value, bearing components with larger dimensional deviations remain in the waiting area for long periods of time, making it difficult to match them with the right components. This situation may directly lead to interruptions in the fitting process, affecting the overall production efficiency and increasing the uncertainty cost of the production process.
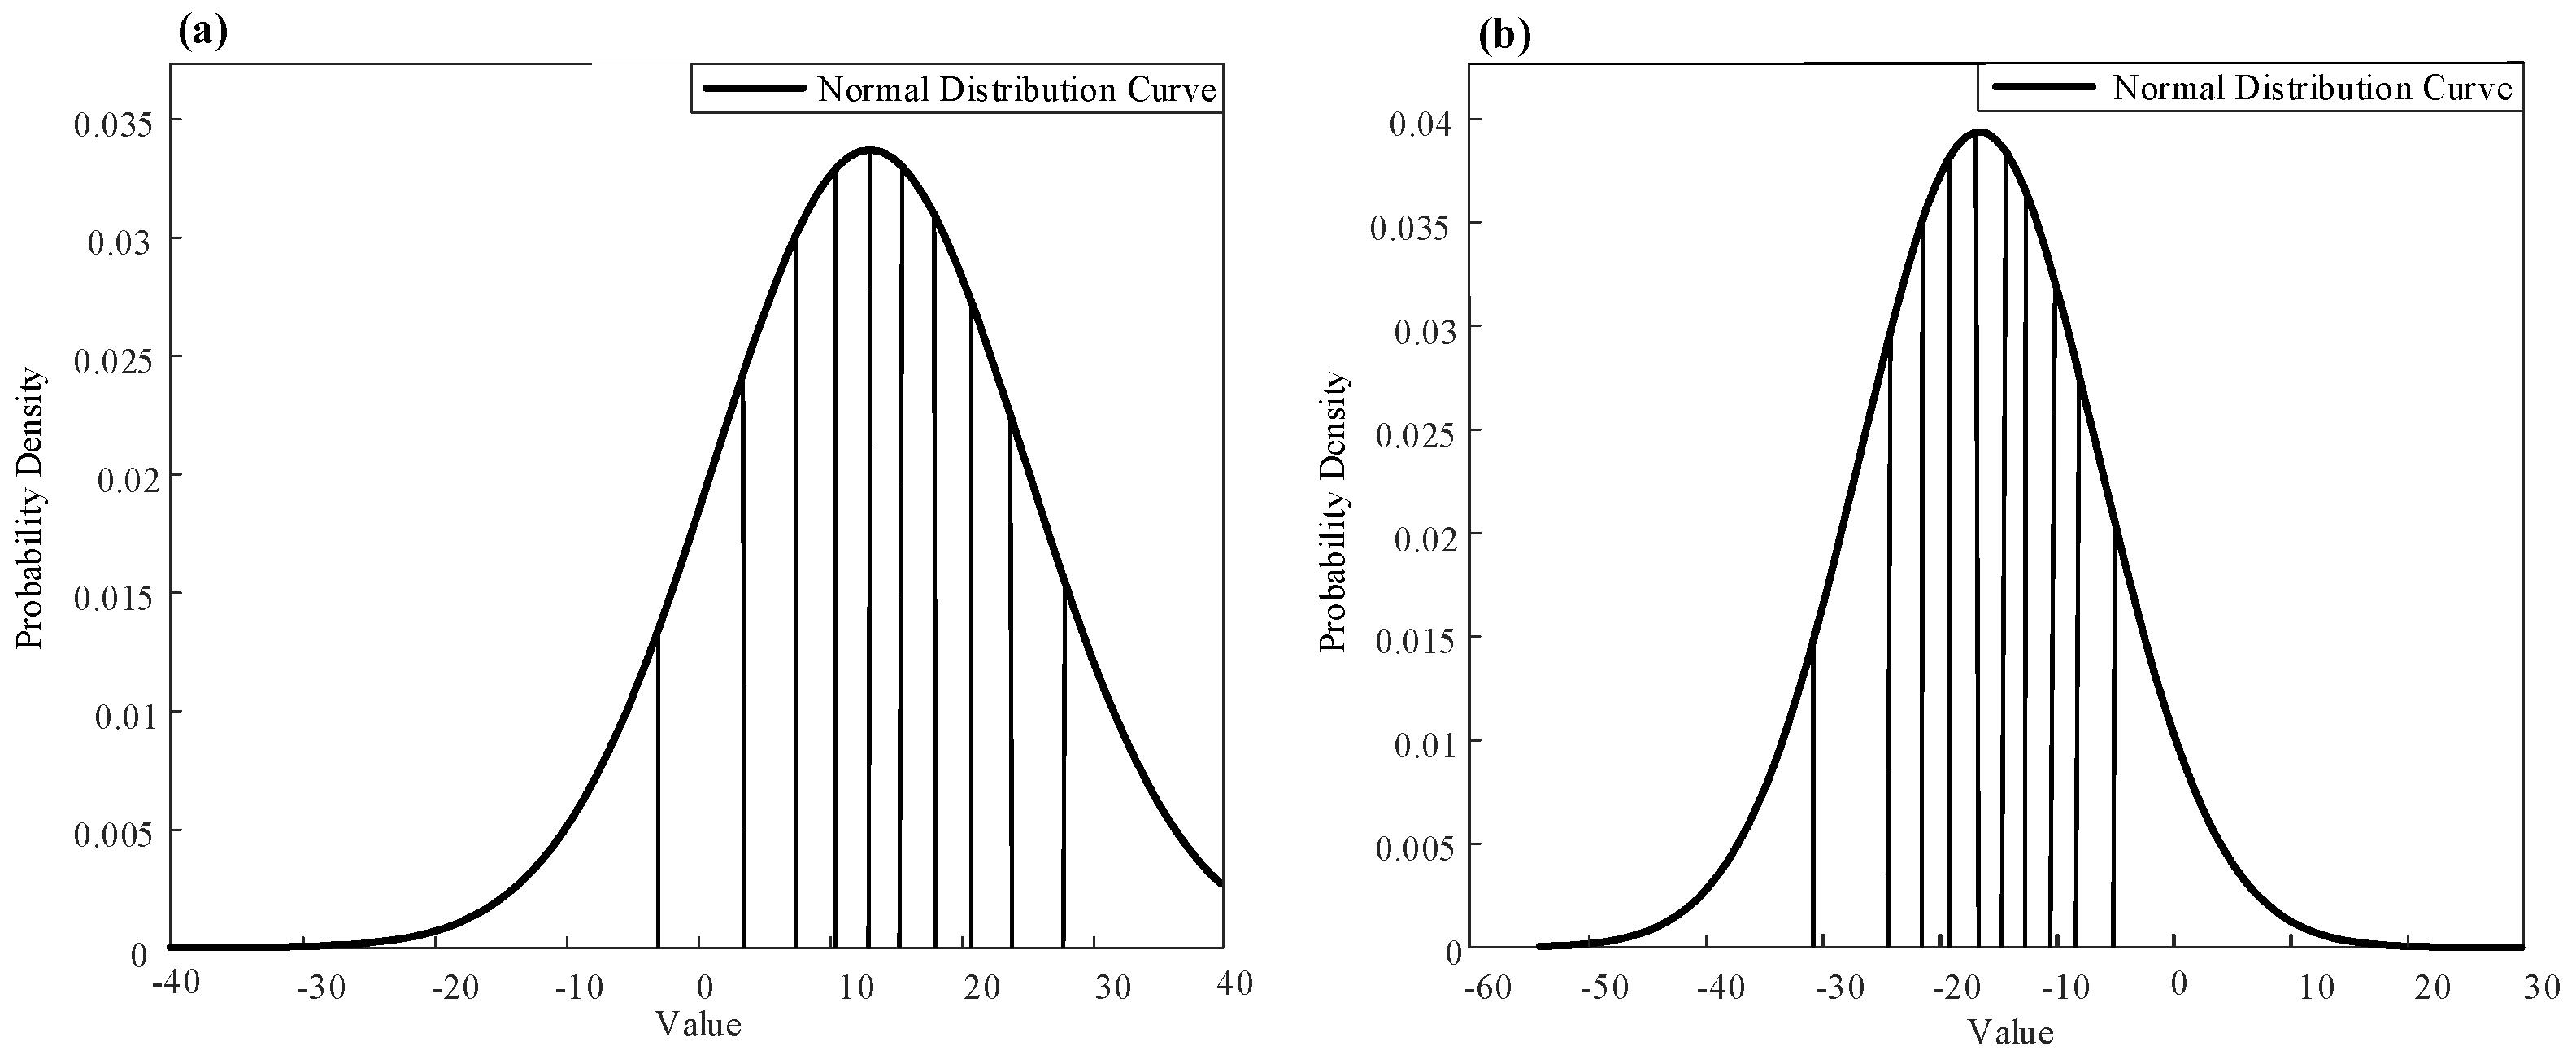
2.2. Equidistant Grouping Method for Bearing Component Dimensional Deviation
The core idea of the equidistant grouping method for bearing component dimensional deviation is to evenly divide the inner and outer rings of the bearing into n groups according to the dimensional deviation spacing. The inner ring in group i corresponds to the outer ring in group , . In the process of fitting, as long as there are inner and outer ring components with the same group number, the components can be selected and fitted. Regardless of the dimensional deviation of the inner and outer rings, it can be ensured that the clearance after fitting meets the production clearance standards.
Due to the fact that the diameter tolerance of the balls in actual products is generally smaller than the diameter tolerance of the inner and outer rings of bearings, this article mainly focuses on the selection and grouping method of the diameter tolerance of the inner and outer rings of deep groove ball bearings to ensure that the radial clearance meets the product requirements during bearing fitting. The deviation range of the inner and outer raceway diameter of deep groove ball bearings produced in the same batch basically follows a normal distribution, and the upper and lower deviations are basically symmetrical relative to the zero point. However, the clearance value standard for deep groove ball bearings is basically positive clearance, and the clearance value range is not symmetrical the zero point, causing inconvenience in grouping the inner and outer rings of the bearing.
Assuming the clearance value range of a certain bearing is
, the overall size deviation range of the outer ring of the bearing is
, and the overall size deviation range of the inner ring is
. Ignoring the ball deviation in Formula (1) can obtain
where
is the outer ring tolerance, and
is the inner ring tolerance.
For the equidistant grouping method of dimensional deviation, in order to ensure that the inner and outer rings can meet the required clearance range after fitting, when grouping the inner and outer rings of the bearing, Formula (2) can be obtained as follows:
where
is the overall outer ring upper tolerance, and
is the inner ring tolerance of the first group. Due to the known value of
, the range of tolerance for the first group of the inner rings can be obtained as follows:
In actual production, the value of
may not be equal to
but rather may be bigger than
. The first group of the bearing inner ring is
, the theoretical inner ring grouping width is
and the theoretical grouping number can be calculated as follows:
However, is not necessarily an integer. In order to ensure that the clearance meets the requirements, it is necessary to improve the grouping accuracy and increase the number of groups. The actual number of groups is rounded up.
For the outer ring component of the bearing, Formula (7) can be obtained from Formula (1) as follows:
where
is the outer ring tolerance of the first group, and
is the overall inner ring lower tolerance. Due to the known value of
, the range of tolerance for the first group of the outer rings can be obtained as follows:
In actual production, the value of
may not be equal to
, but rather may be smaller than
. The first group of the bearing outer ring is
, the theoretical outer ring grouping width is
and the theoretical grouping number can be calculated as follows:
Similarly, is not necessarily an integer. In order to ensure that the clearance meets the requirements, it is necessary to improve the grouping accuracy and increase the number of groups. The actual number of groups is rounded up.
If
, then the number of groups is
. If
, then the number of groups is the lager one of
and
, that is
. As shown in
Figure 2, the actual grouping width is as follows:
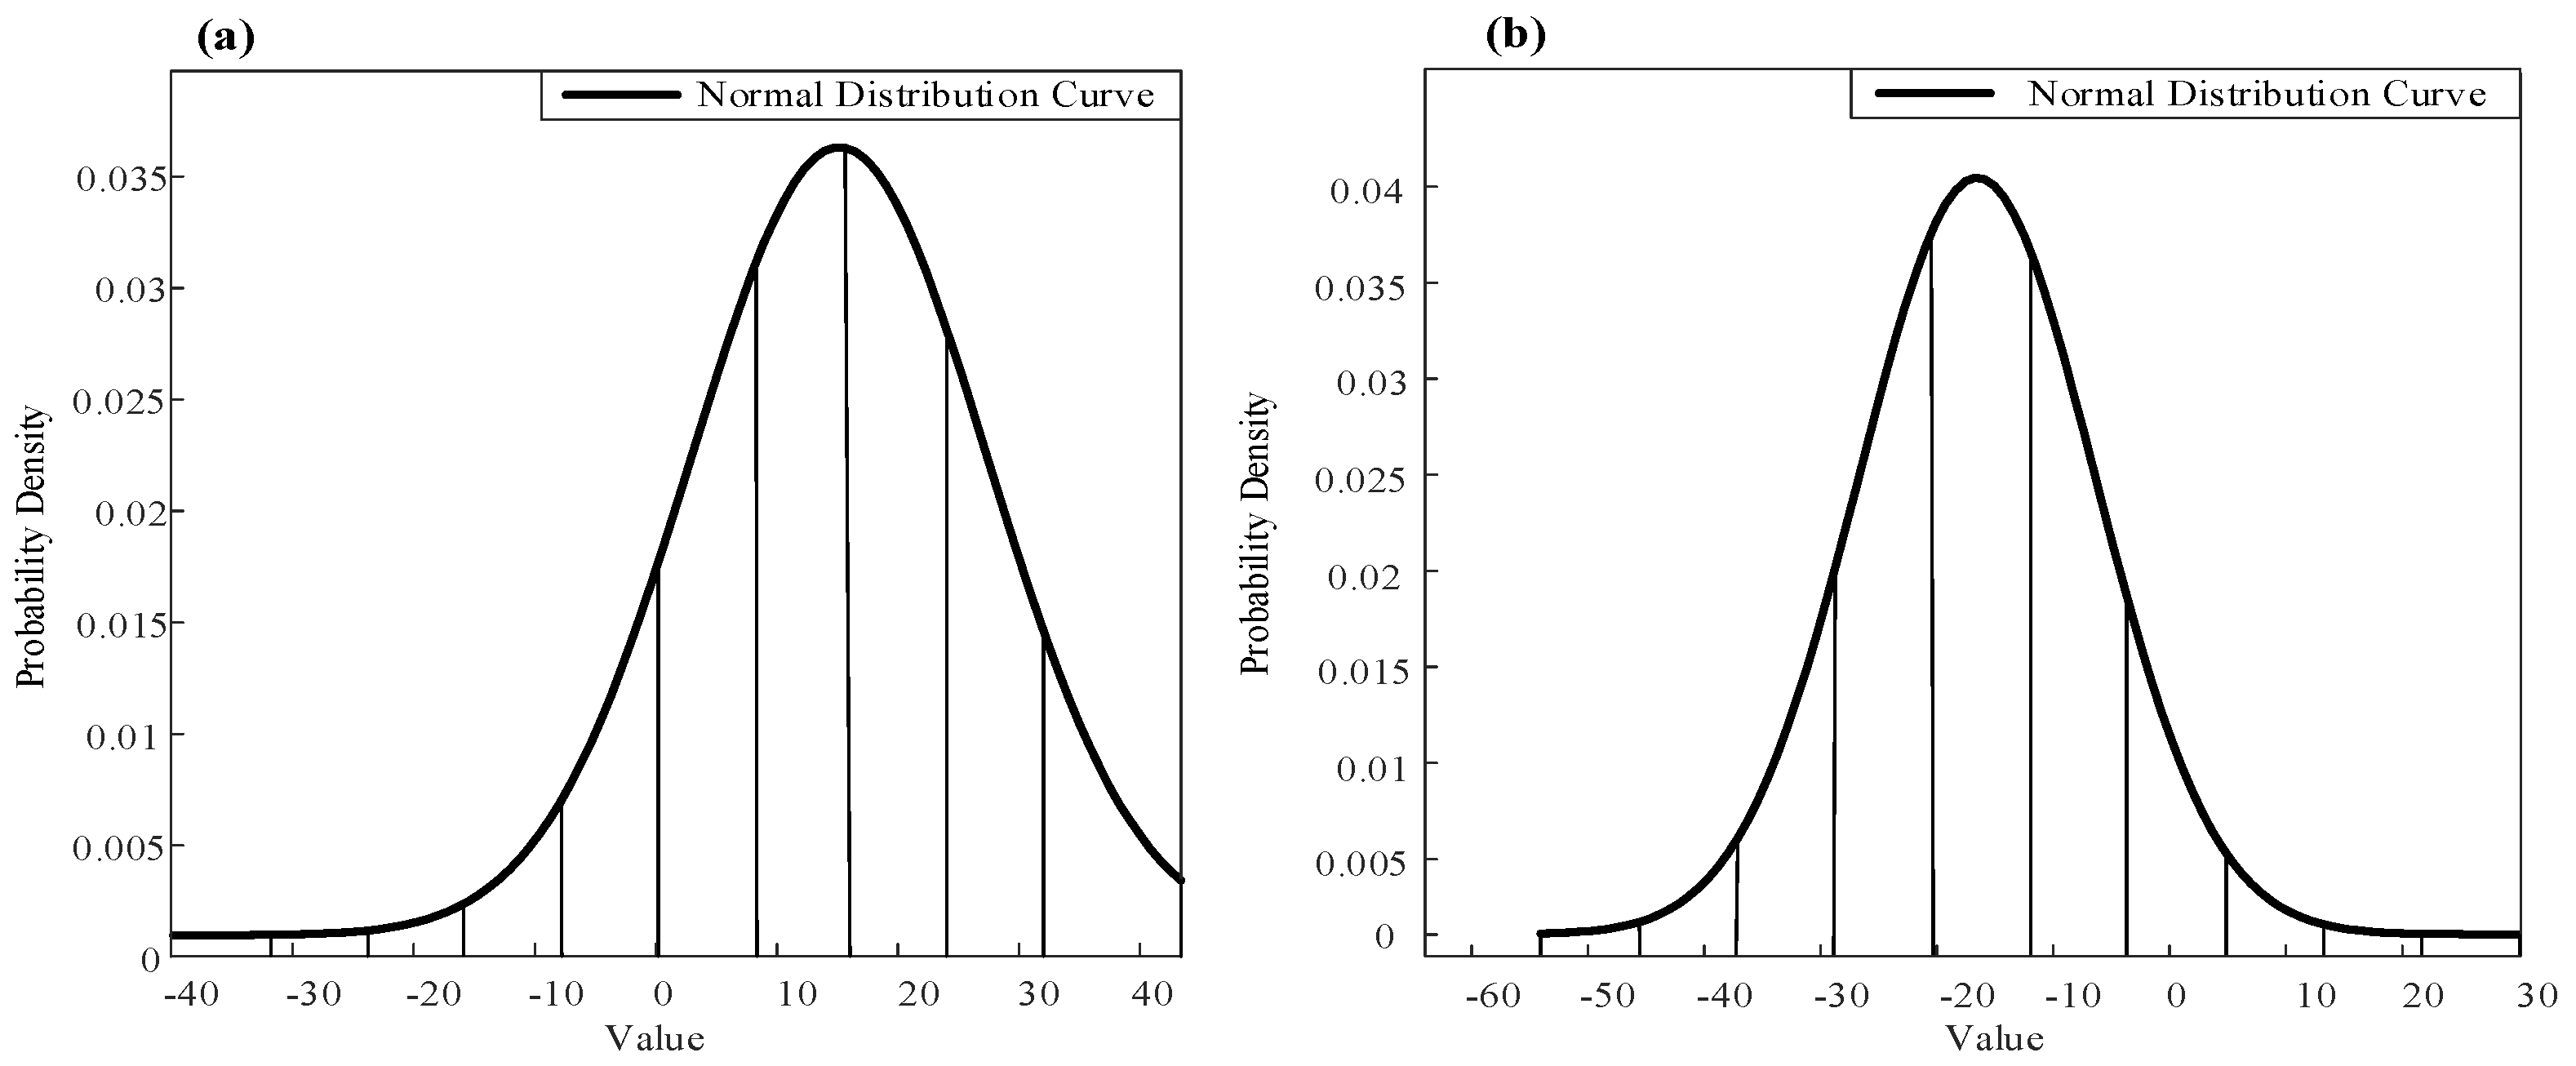
2.3. Equal Probability Grouping Method for Bearing Component Dimensional Deviation
The core idea of the equal probability grouping method for bearing dimensional deviation is to group the inner and outer ring dimensional deviations that meet the clearance requirements after fitting into n groups based on the probability of occurrence. The upper and lower limits of the dimensional deviation of each bearing component are obtained by dividing the probability density function curve of the overall bearing dimensional deviation into equal areas. The inner ring in group i corresponds to the outer ring in group i, . In the process of fitting, as long as there are inner and outer ring components with the same group number, the components can be selected and fitted.
Similar to equidistant grouping method, assuming the clearance value range of a certain bearing is
, the overall size deviation range of the outer ring of the bearing is
and the overall size deviation range of the inner ring is
. Ignoring the ball deviation in Formula (1) can obtain
where
is the outer ring tolerance, and
is the inner ring tolerance.
In order to ensure that the inner and outer rings can meet the required clearance range after fitting, when grouping the inner and outer rings of the bearing, Formula (2) can be obtained as follows:
where
is the overall outer ring upper tolerance, and
is the inner ring tolerance of the first group. Due to the known value of
, the range of tolerance for the first group of the inner rings can be obtained as follows:
In actual production, the value of
may not be equal to
, but rather may be bigger than
. The first group of the bearing inner ring is
, and the theoretical inner ring grouping width is
. However, for the equal probability grouping method, the overall integrated area
and the first group width integrated area
are calculated based on the probability density function curve of the overall dimensional deviation of the bearing inner ring. The theoretical number of groups for the equal probability grouping method is as follows:
Nevertheless, is not necessarily an integer. In order to ensure that the clearance meets the requirements, it is necessary to improve the grouping accuracy and increase the number of groups. The actual number of groups is rounded up.
Similarly, for the outer ring component of the bearing, Formula (7) can be obtained from Formula (1) as follows:
where
is the outer ring tolerance of the first group, and
is the overall inner ring lower tolerance. Due to the known value of
, the range of tolerance for the first group of the outer rings can be obtained as follows:
In actual production, the value of
may not be equal to
, but rather may be smaller than
. The first group of the bearing outer ring is
, and the theoretical outer ring grouping width is
. Now, for the equal probability grouping method, the overall integrated area
and the first group width integrated area
are calculated based on the probability density function curve of the overall dimensional deviation of the bearing outer ring. The theoretical number of groups for the equal probability grouping method is as follows:
Similarly, is not necessarily an integer. In order to ensure that the clearance meets the requirements, it is necessary to improve the grouping accuracy and increase the number of groups. The actual number of groups is rounded up.
If
, then the number of groups is
. If
, then the number of groups is the larger one of
and
, that is
. The actual grouping width is determined by dividing the probability density function curve of the dimensional deviation of the inner and outer rings into equal integral areas based on the number of groups, as shown in
Figure 3.
2.4. Ball Compensation Adjustment Mechanism
In the fitting process, the ball is the component used to fill the inner and outer rings of bearings, and the dimension directly affects the clearance. There are seven specifications for balls: −8, −4, −2, 0, 2, 4, 8 μm. During the grouping process, due to the normal distribution of the component dimension, the number of samples at both ends of the probability density curve significantly decreased. To ensure that components with extreme deviation values can participate in the fitting operation, it is usually necessary to expand the tolerance range of the first groups. However, this may result in a clearance deviation of the components within the group exceeding the process specification requirements after fitting. By selecting balls of different specifications, the clearance can be dynamically adjusted. The clearance value of the bearing after fitting can be obtained using Formula (1). If the clearance after fitting exceeds the specified clearance range, the ball should be replaced to ensure that the adjusted clearance meets the requirements.
4. Results and Discussion
4.1. Distribution Model of Bearing Components Dimensional Deviation
For the machining deviation of the outer and inner raceway dimensions, the normal distribution parameters can be estimated by collecting multiple bearing components’ diameter data. The assembly line has recorded several diameters of inner and outer rings which were fitted on. Statistical analysis was conducted on the dimensional deviation of the inner and outer rings of 3000 bearings, and the results are shown in
Figure 8.
Normal distribution fitting was performed on 3000 groups of outer and inner ring dimensional deviation which was collected by the assembly line. The calculated outer ring dimensional normal distribution parameters are = 13.22, = 12.07. The calculated inner ring dimensional normal distribution parameters are = −16.60, = 10.46, where is the mean value, and is the standard deviation.
4.2. Comparison of Two Grouping Methods
The outer ring raceway diameter dimensional deviation range is . The inner ring raceway diameter dimensional deviation range is . The clearance range of the 6210 deep groove ball bearing is .
Calculated by the equidistant grouping method, for the inner ring component, it can be obtained from Formula (9) that
, and the theoretical grouping width
. Then, the theoretical grouping number
, and the actual grouping number
10. Similarly, for the outer ring component, it can be obtained from Formula (11) that
, and the theoretical grouping width
. Then, the theoretical grouping number
, and the actual grouping number
10. So, the grouping number of the equidistant grouping method is 10. The grouping is shown in
Table 1 and
Figure 9.
Calculated by the equal probability grouping method, for the inner ring component, it can be obtained from Formula (9) that
, and the theoretical first grouping width
. The number of the grouping can be calculated from the proportion of the first group width integral area size to the total probability density curve integral area size. Then, the theoretical grouping number
. The actual grouping number
11. Similarly, for the outer ring component, it can be obtained from Formula (11) that
, and the theoretical grouping width
. The number of groupings can be calculated from the proportion of the first group width integral area size to the total probability density curve integral area size. Then, the theoretical grouping number
. So, the final grouping number
= 11. The grouping is shown in
Table 2 and
Figure 10.
Although each group of equidistant grouping method meets the clearance range, the probability of each group entering the fitting line is different. For example, the probability of the outer ring dimensional deviation group 7 is 27%. However, the probability of the outer ring dimensional deviation group 10 is 3%. When components with low probability of occurrence enter the fitting line, it is difficult to encounter components with the same group number entering the fitting line for assembly. This situation will cause the accumulation of bearing components in the waiting area of the fitting line and eventually lead to the termination of the fitting process.
While there are some dimensional deviations between the first group and the last group of components with the equal probability method that may not meet the clearance range, the ball compensation adjustment mechanism can be carried out during the fitting process. The equal probability grouping method can ensure that each bearing component group has the same probability of occurrence. There will be no component accumulation in the waiting area to ensure the continuous fitting process.
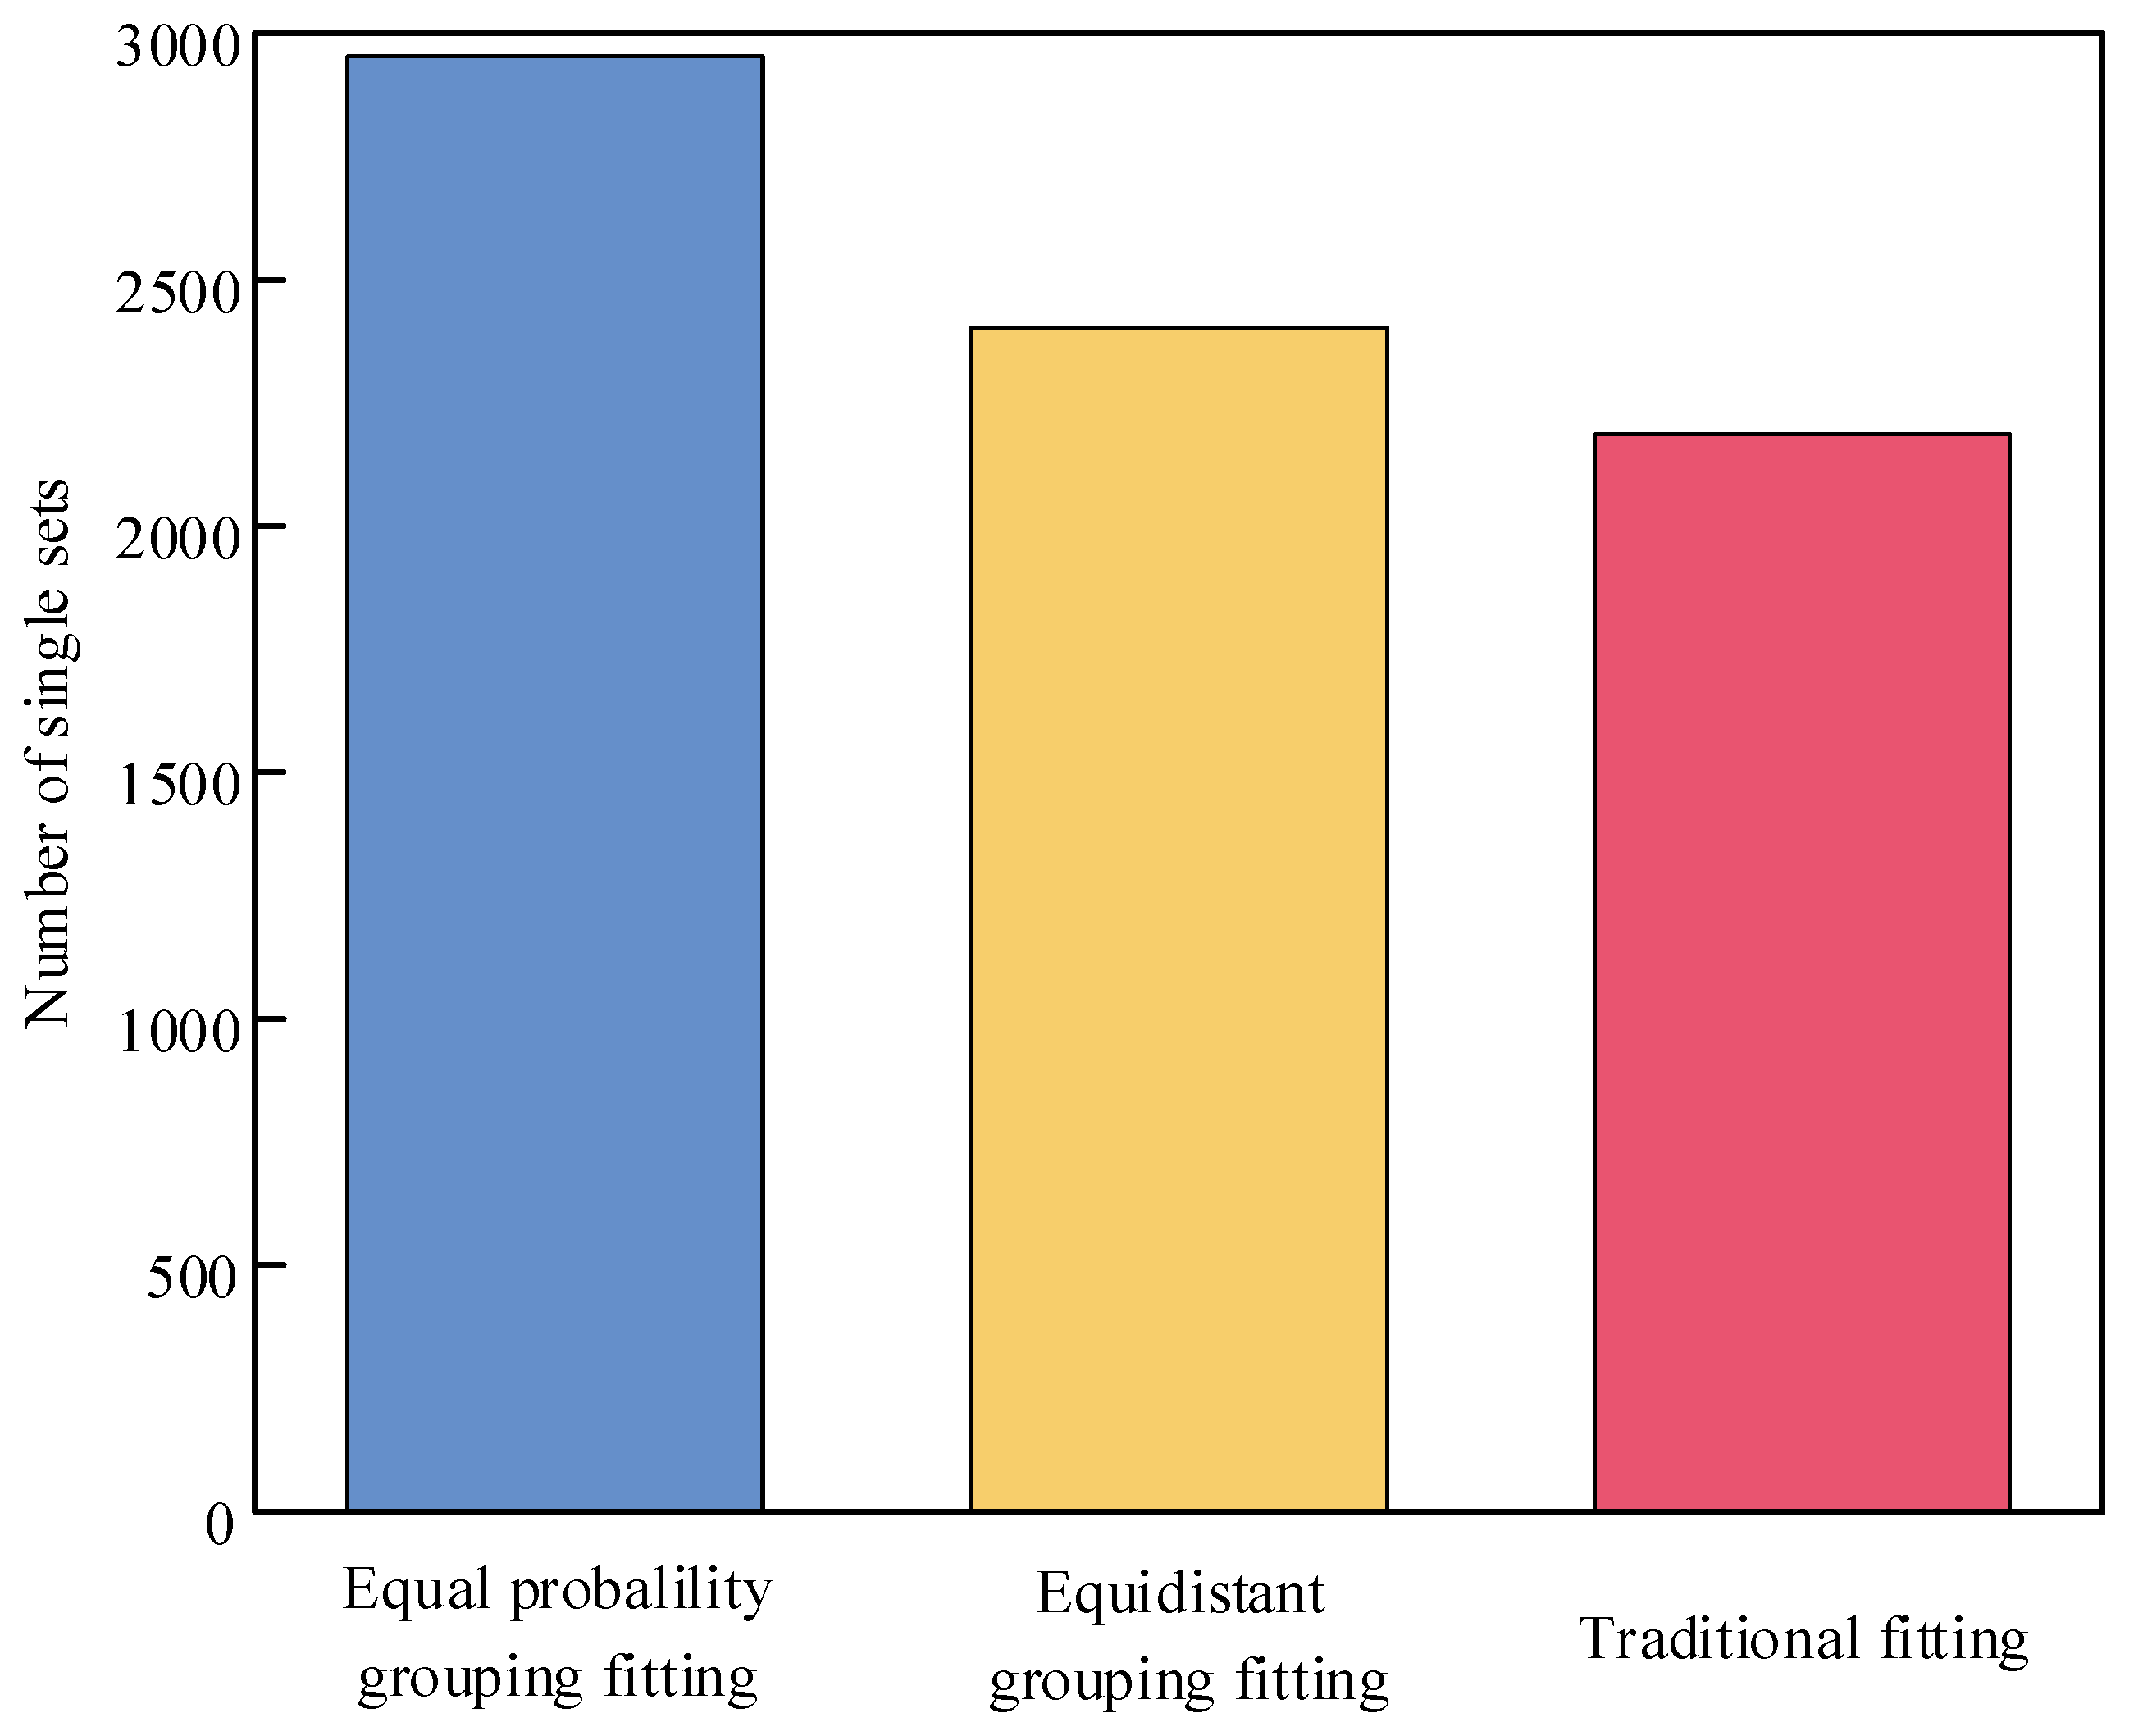
4.3. Experimental Analysis of Fitting Quantity
According to the comparison of the fitting quantity with the two grouping methods in
Figure 11, the fitting quantity with the equidistant grouping method is 2403, and the fitting quantity with the equal probability grouping method is 2953. It is shown in
Table 3 that for the equidistant grouping method, the components in the waiting area at the time of the fitting process termination were five components from the 10th group of the outer ring, while there were no components from the 10th group of the inner ring, resulting in production termination. However, for the equal probability grouping method, the components in the waiting area of the inner and outer ring were evenly distributed when the fitting process was terminated. Not only that, but even the number of groups with the equal probability grouping method is more than the number with the equidistant grouping method, and the number of successful fitting components with the equal probability grouping method is larger than that with the equidistant grouping method. It is shown that the component distribution of the equal probability grouping is more balanced, which reduces the process termination caused by an insufficiency of same group components. Thus, the equal probability grouping method can achieve a higher number of successful fittings.
4.4. Future Research Direction
As mentioned above, the dimensions of 3000 sets of 6210 deep groove ball bearing components used in the experiment were measured before the fitting process. The distribution model was constructed by using these bearing component dimensions’ measurement data. However, in actual production, it is impossible to measure all bearing component dimensions before the fitting process. This is a limitation of this method. In future research, a real-time measurement and dynamic modeling method should be developed to integrate the equal probability grouping method.


