4.2.3. Comparison of Diagnostic Results and Algorithmic Analysis
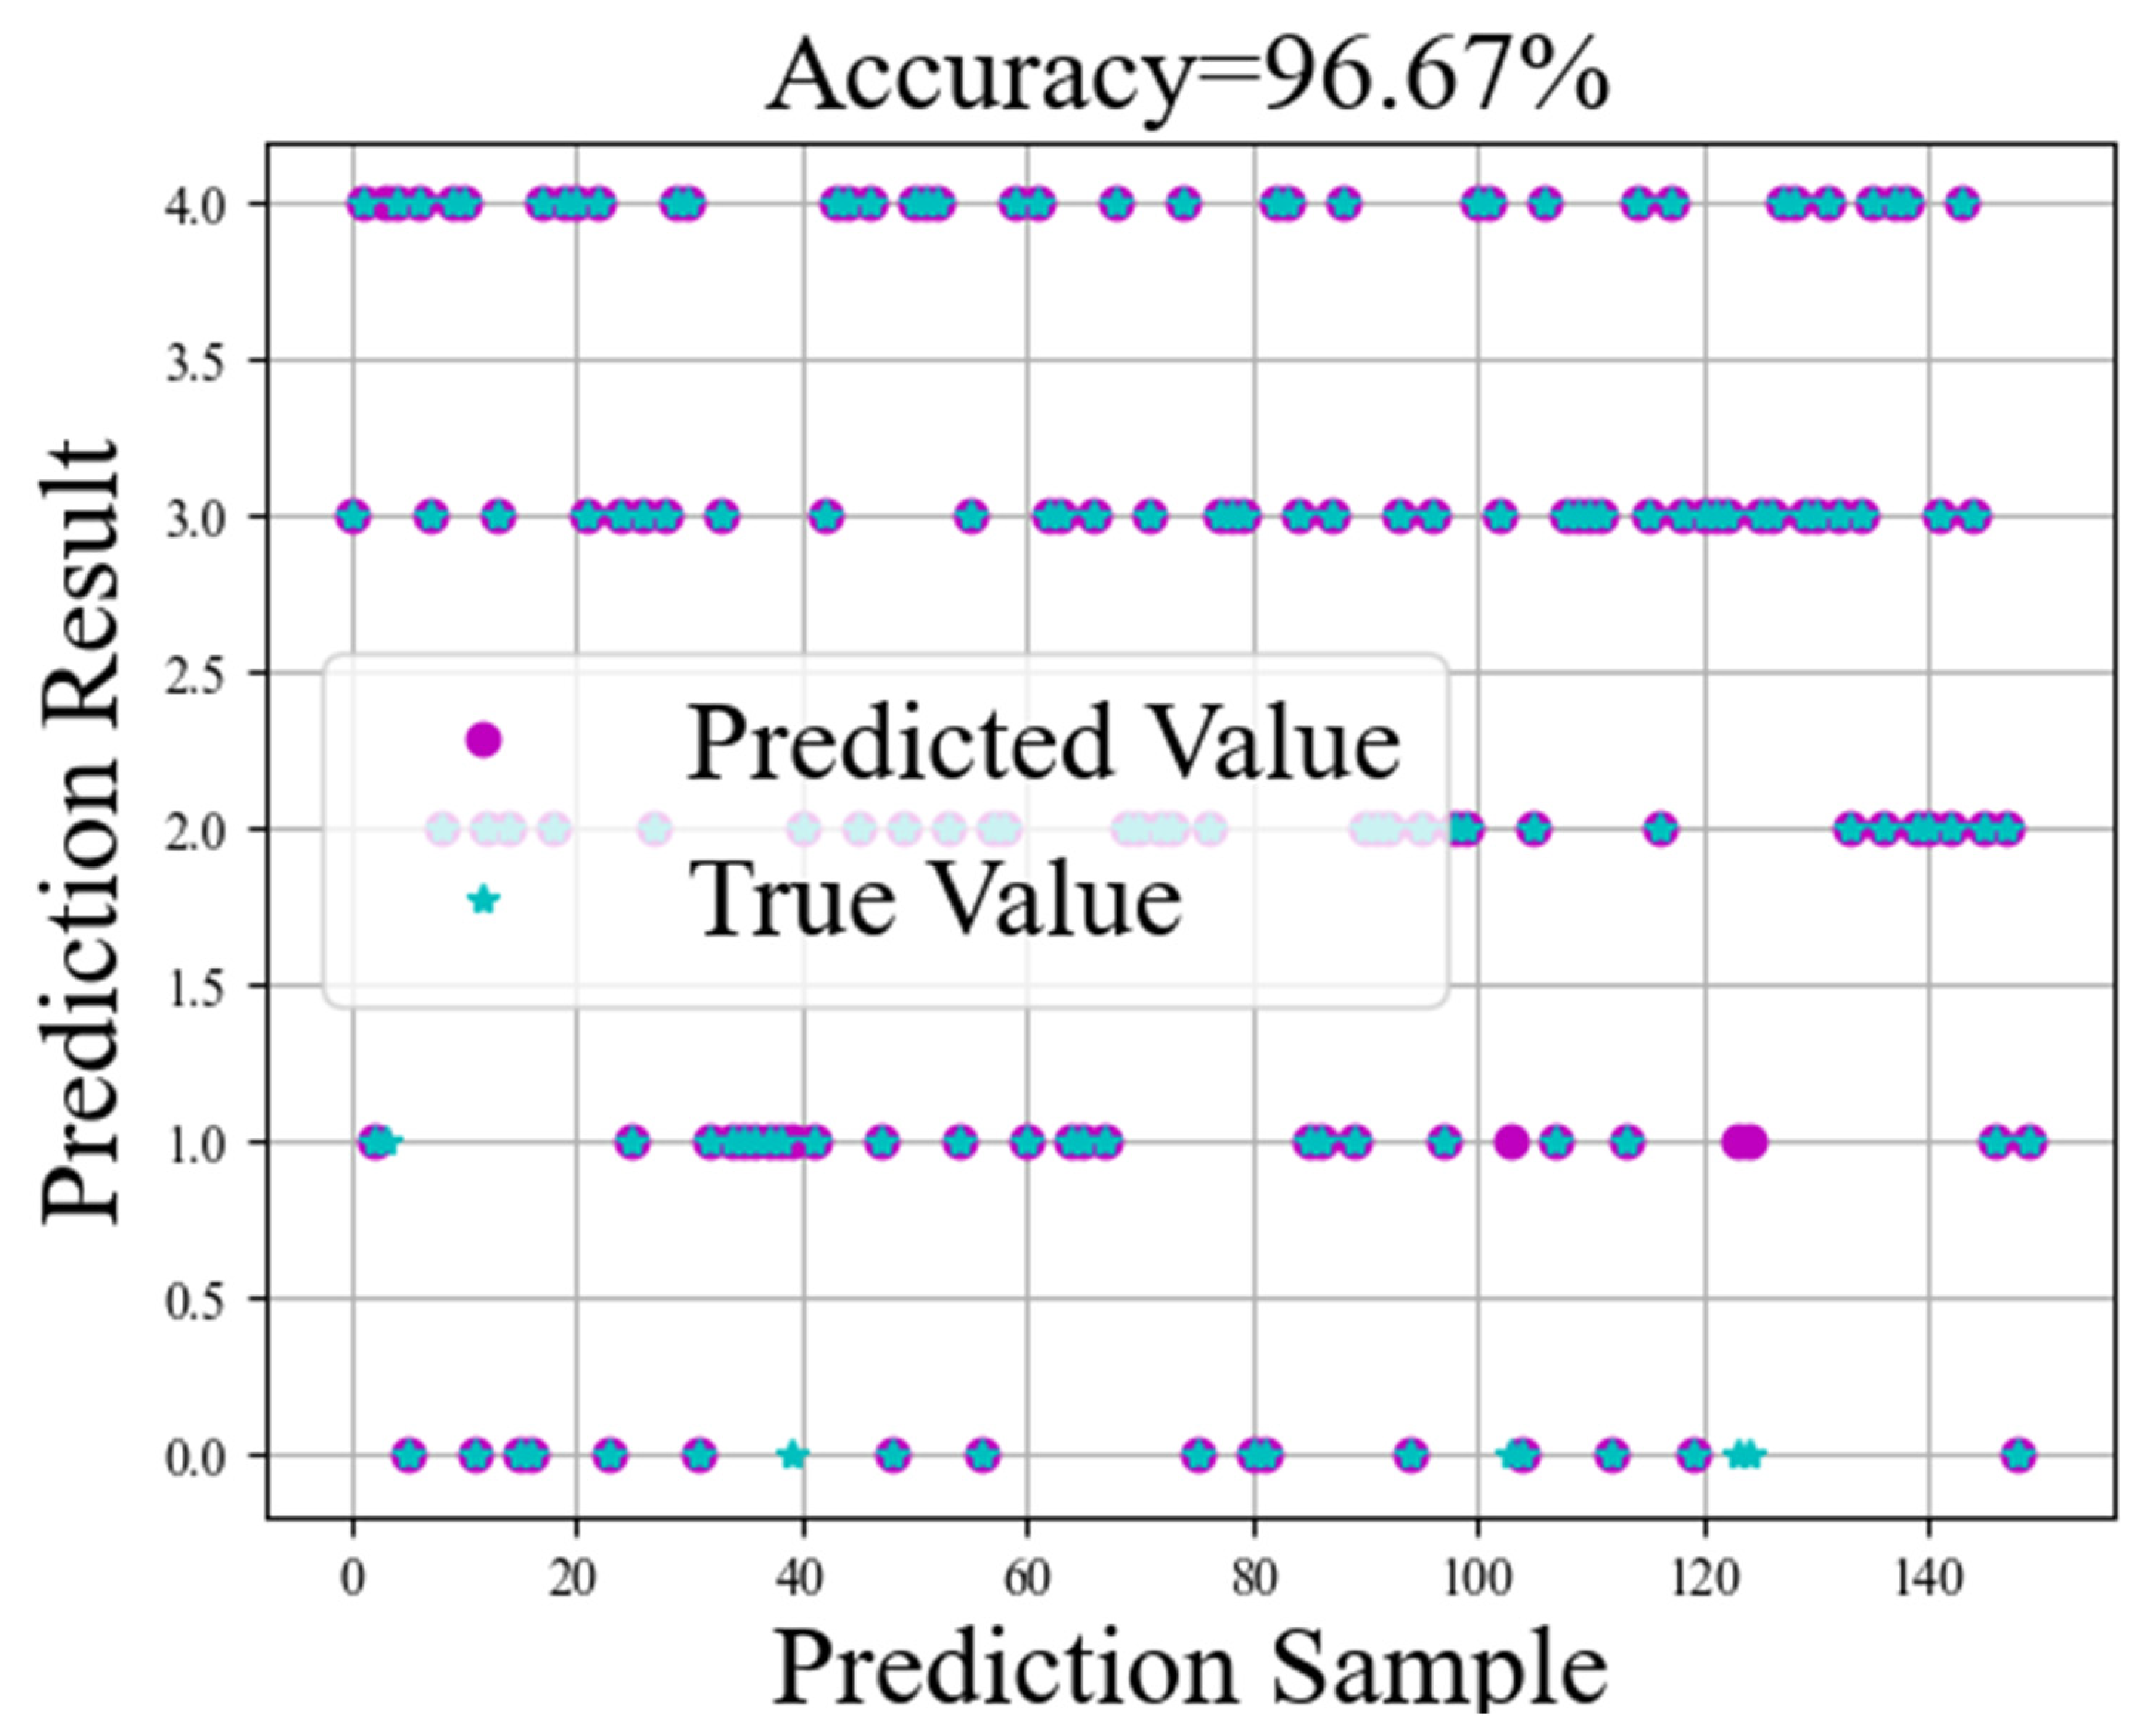
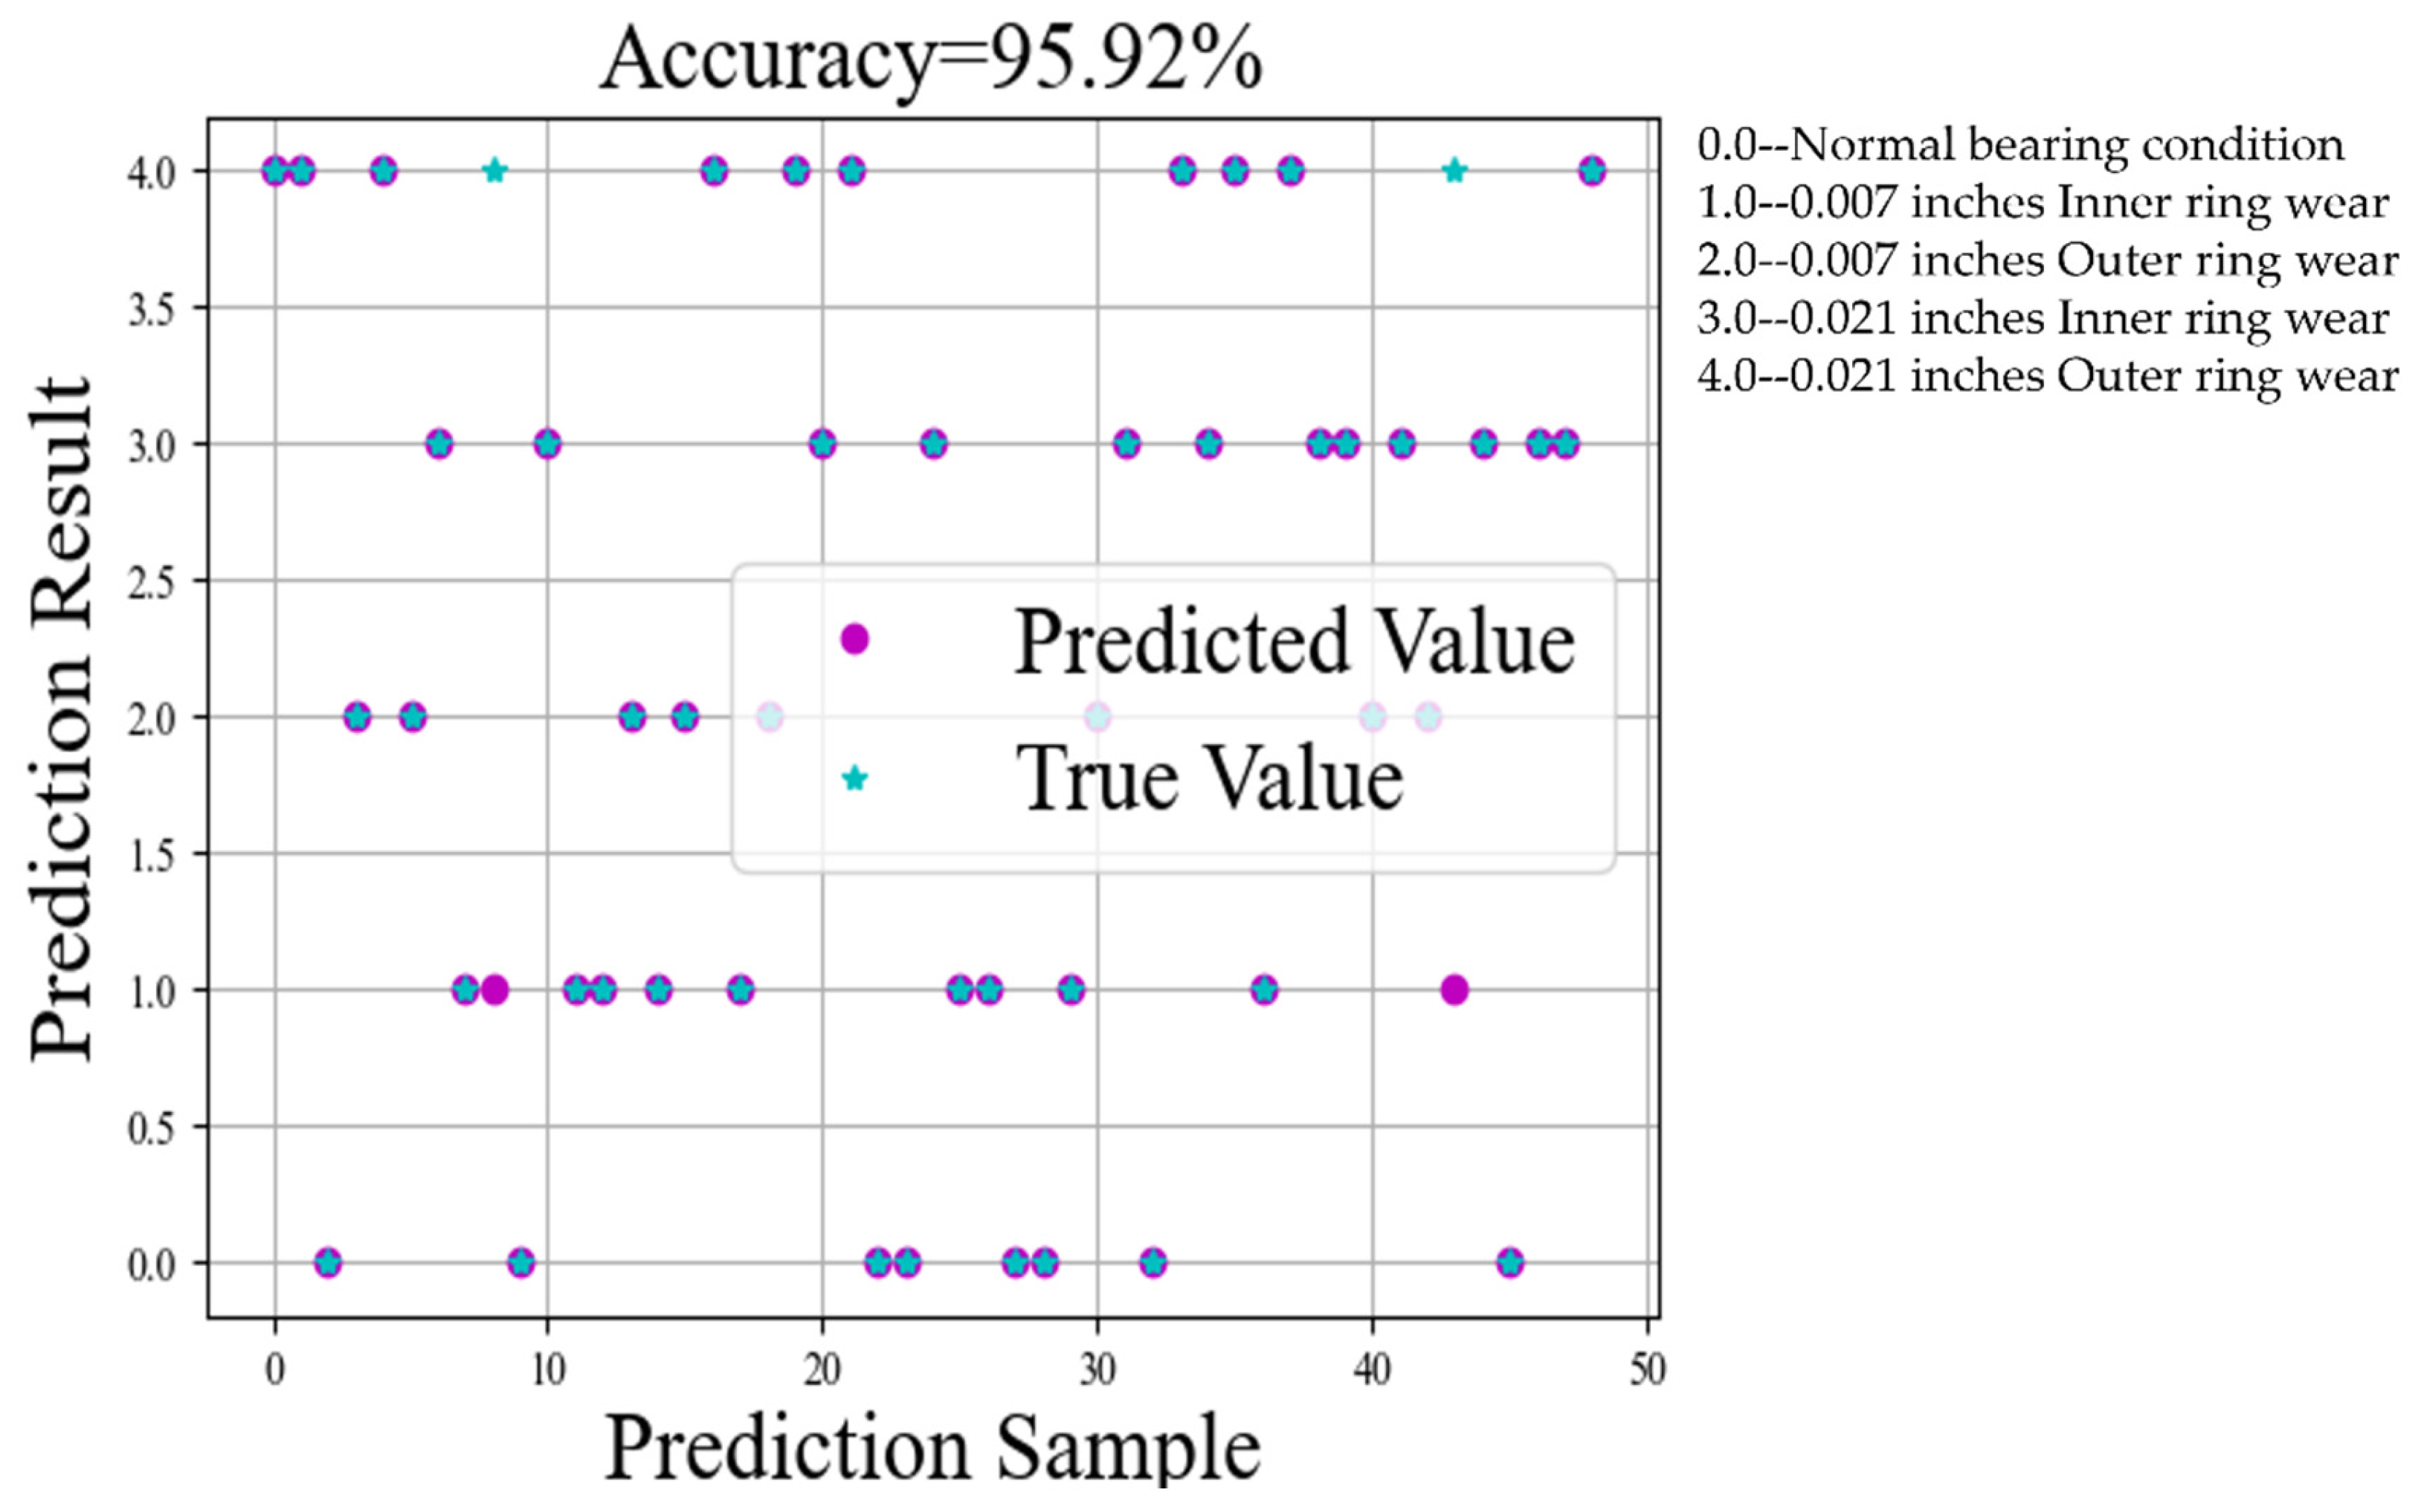
After training on the 600 sample data of the dataset, the CNN-LSTM model shows excellent prediction accuracy on the test set, as shown in
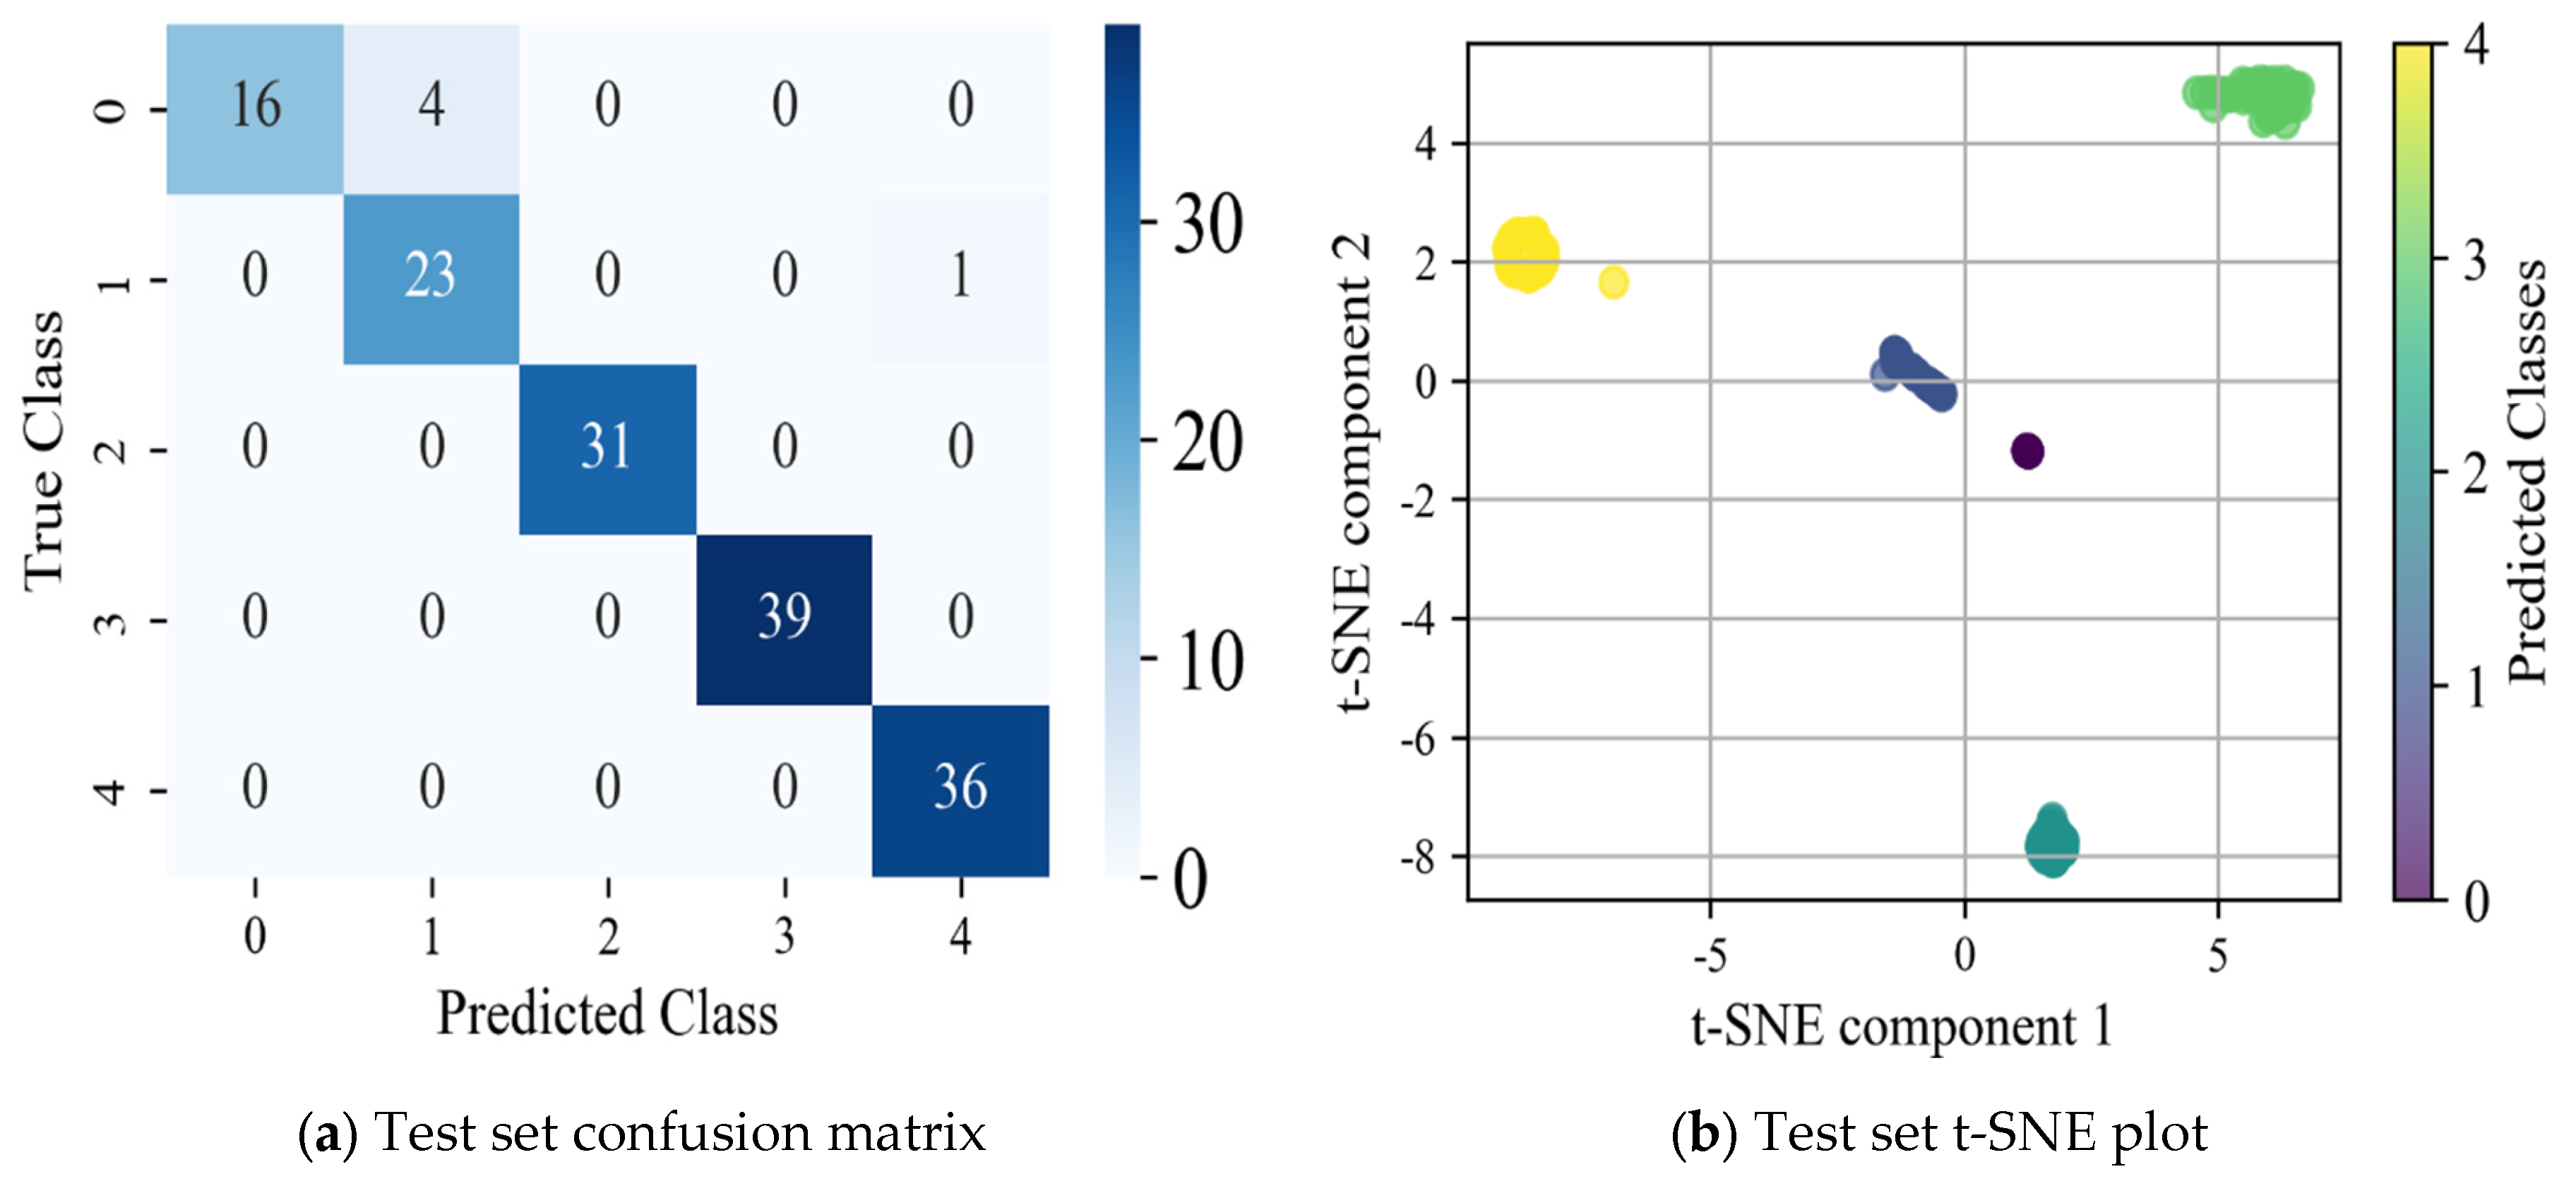
Figure 15. The confusion matrix and t-SNE downscaling visualization plots for the test set are illustrated in
Figure 16, offering a comprehensive evaluation of the model’s classification performance and feature distribution. The horizontal axis of the confusion matrix represents the bearing failure categories predicted by the model, i.e., the category numbers (0–4) predicted by the model, and the vertical axis represents the actual bearing failure categories, i.e., the real label numbers (0–4) of the data.
As shown in
Figure 15, the model achieves an accuracy of 96.67% on the test set, and successfully accomplishes the task of discriminating bearings in the categories of normal state, ball faults (including both severe and slight fault states), and cage faults (including both severe and slight fault states). Through the comparative analysis of the confusion matrix and t-SNE plots, shown in
Figure 16, the prediction effect and error of the model on different fault categories can be clearly observed. The confusion matrix demonstrates the relationship between the actual and predicted categories of the model, while the t-SNE plot reduces the high-dimensional features to two dimensions, visualizing the distribution of each fault category in the feature space, which can effectively reflect the model’s ability to discriminate different categories and the clustering effect. However, a certain number of samples are misidentified in the minor fault states (especially minor cage failure), which suggests that the model’s discriminative power is insufficient when dealing with minor faults. To address this issue, the Precision, Recall, and F1 Score are introduced to provide a more comprehensive evaluation of the model. These metrics help to more accurately assess the classification performance, stability, and robustness of the model [
43].
- (1)
Precision
Precision measures the proportion of samples predicted by the model to be positive that are truly in the positive category, i.e., the accuracy of the prediction, and is able to assess the model’s ability to reduce false positives, which is calculated by the following formula:
where
TP is the number of samples correctly predicted as positive classes;
FP is the number of samples that are actually negative classes but incorrectly predicted as positive classes. In general, a higher Precision means fewer false positives, i.e., most of the samples predicted as positive are correct.
- (2)
Recall
Recall measures the proportion of actual positive class samples that are correctly predicted by the model, i.e., the sensitivity of the model, calculated as
where
FN is the number of samples that are actually in the positive category but are incorrectly predicted to be in the negative category. A higher Recall means that the model is able to cover most of the samples in the positive category.
- (3)
F1 Score
The F1 Score is the reconciled average of Precision and Recall, and used to strike a balance between the two, especially for cases of uneven data, and is calculated as
The higher F1 Score indicates that the model has a better balance between Precision and Recall.
Table 7 lists the key performance metrics of the WPT-CEEMD-CNN-LSTM model under each fault state, including Precision, Recall, and the F1 Score, which are used to comprehensively evaluate the model’s classification ability and stability.
Table 7 demonstrates the outstanding performance of the WPT-CEEMD-CNN-LSTM model in bearing fault diagnosis. For minor ball fault detection, the model achieves an 80.00% Recall, 88.89% F1 Score, and 100.00% Precision, indicating solid classification capabilities. In detecting minor cage faults, the model performs even better, with a 95.83% Recall, 90.20% F1 Score, and 85.19% Precision, showcasing a particularly strong Recall performance. When identifying serious ball and cage faults, the model excels with a 100.00% Recall, F1 Score, and Precision, reflecting its high diagnostic accuracy. For normal state detection, the model also performs exceptionally well, achieving a 100.00% Recall, 98.63% F1 Score, and 97.30% Precision, demonstrating its ability to accurately distinguish between normal and faulty states, effectively minimizing the risk of misdiagnosis. Overall, the model’s high Recall, F1 Score, and Precision across different fault categories underscore its robustness and accuracy in fault diagnosis.
To further evaluate the diagnostic capability of the WPT-CEEMD-CNN-LSTM model on the dataset used in this study, we conducted a comparative analysis with conventional models, including CNN, LSTM, and CEEMD-CNN-LSTM. All of the models were trained and tested on the same dataset for the task of classifying and diagnosing the health condition of rotor motor bearings. To visually illustrate the classification performance of each model,
Figure 17,
Figure 18 and
Figure 19 present the t-SNE visualizations of their respective confusion matrices and training results. Additionally,
Figure 20 provides a quantitative comparison of the classification accuracies for all models after training.
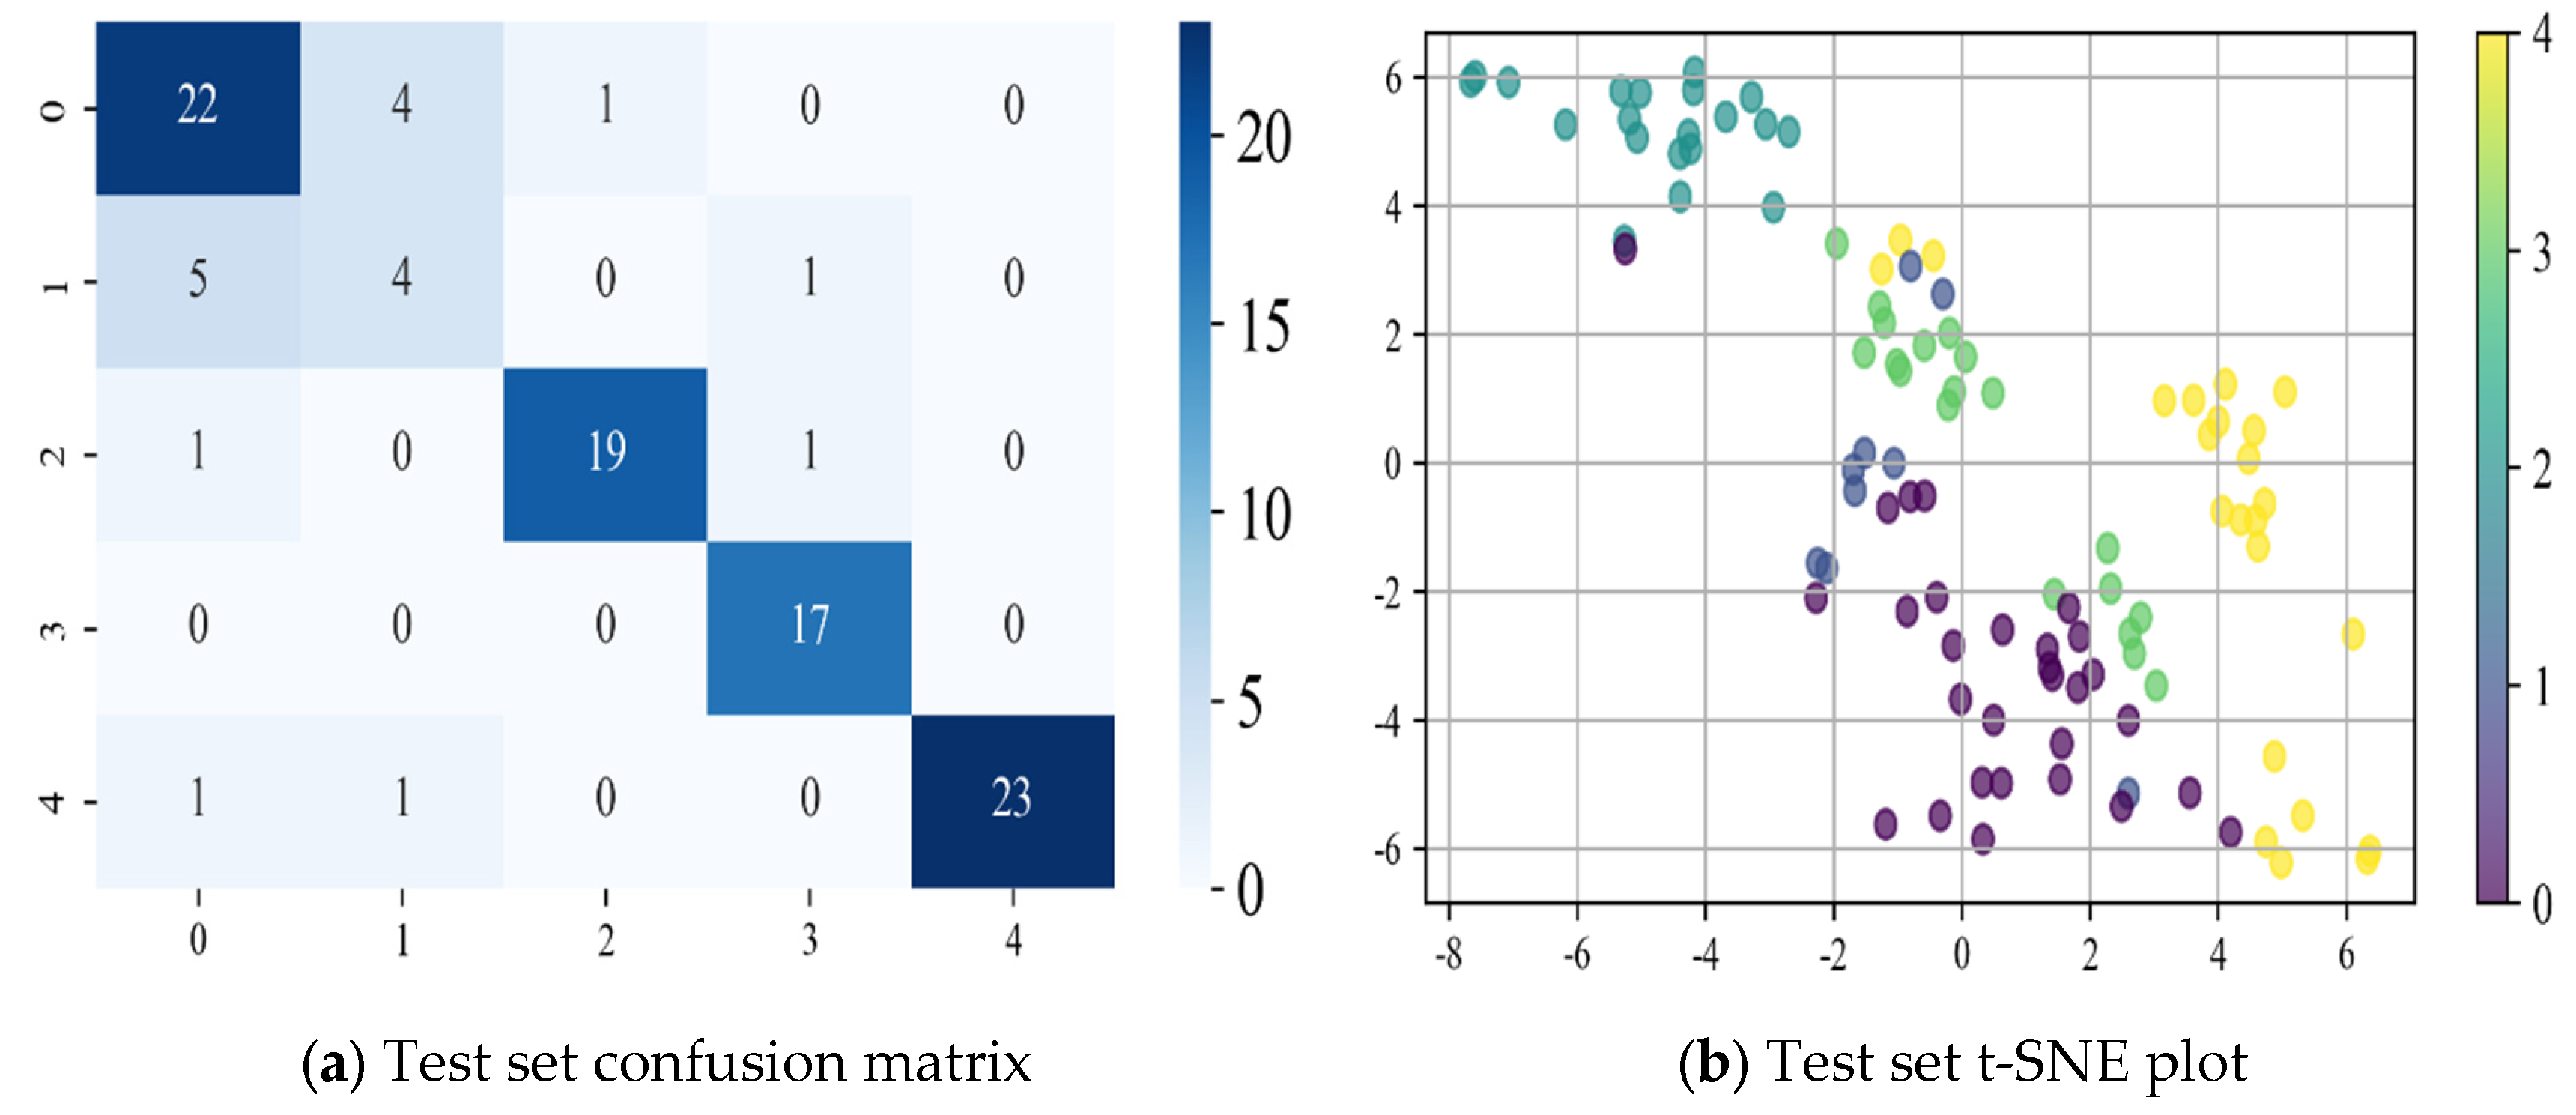
Based on the confusion matrix and t-SNE dimensionality reduction results of each neural network model presented in
Figure 17,
Figure 18 and
Figure 19, the following conclusions can be drawn:
- (1)
The CNN model extracts local spatial features through convolutional operations and successfully performs basic classification tasks. However, its inability to model temporal information results in significant category confusion. The t-SNE visualization reveals a highly dispersed data distribution with fuzzy category boundaries, further highlighting the limitations of CNN in temporal modeling.
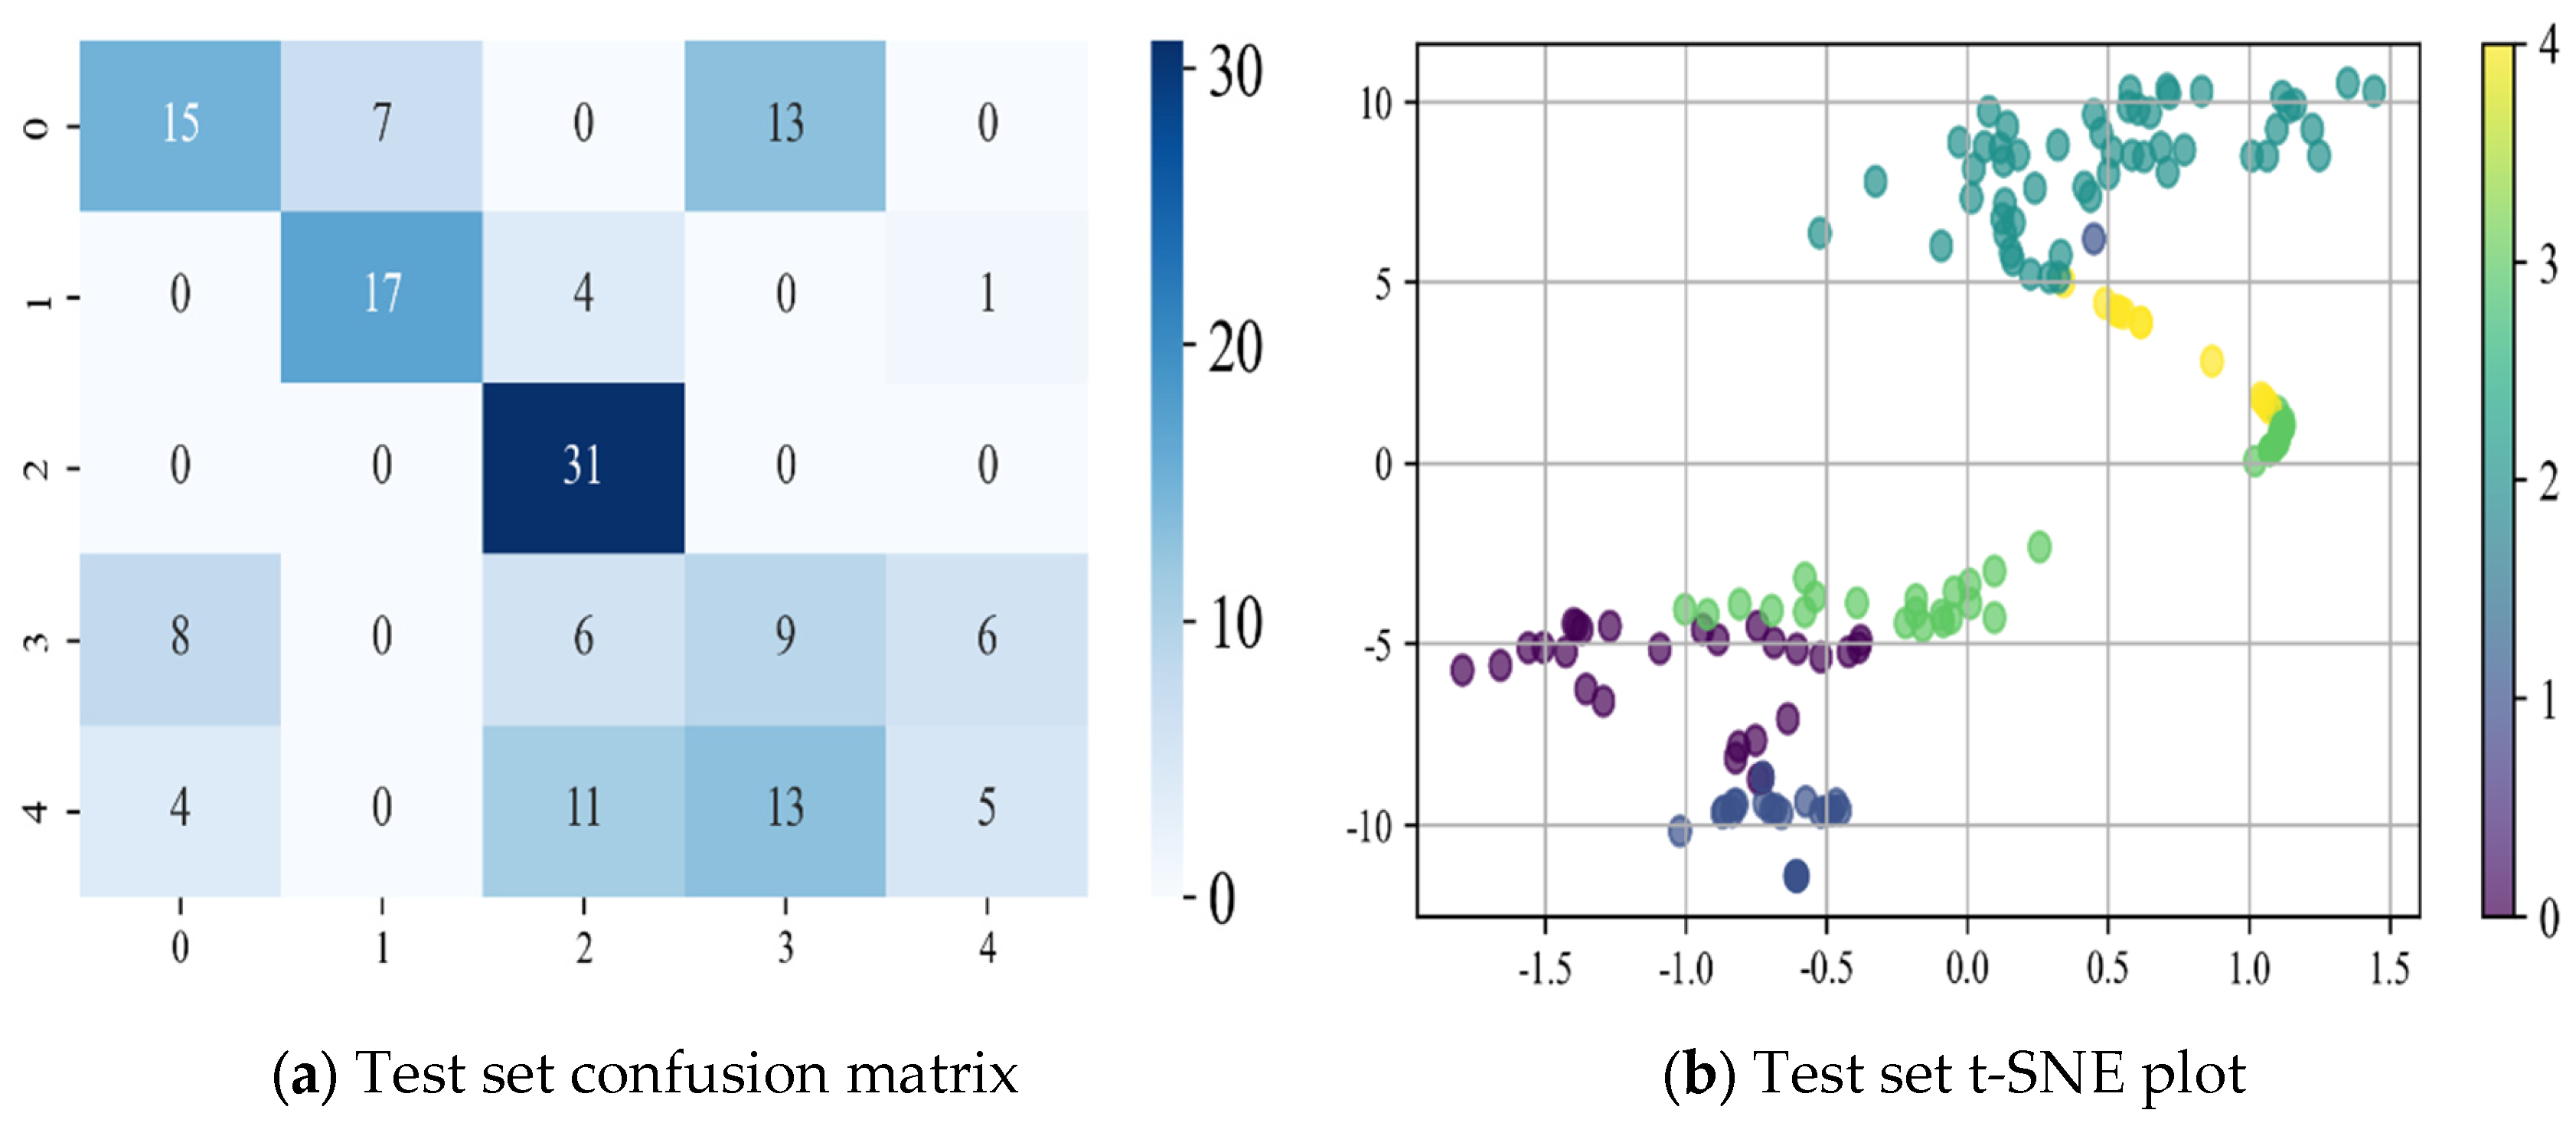
- (2)
The LSTM model effectively captures temporal dependencies through its memory mechanism, resulting in improved classification performance compared to the CNN. However, the confusion matrix reveals that the misclassification rate of LSTM is not significantly reduced, and its accuracy remains lower. The t-SNE results indicate that the data clustering is tighter and the category boundaries are clearer than with the CNN, demonstrating LSTM’s advantage in handling time-series data. Nevertheless, LSTM is highly sensitive to the quality of input data and may encounter issues such as gradient vanishing or explosion during training, leading to increased computational overhead and instability in the training process.
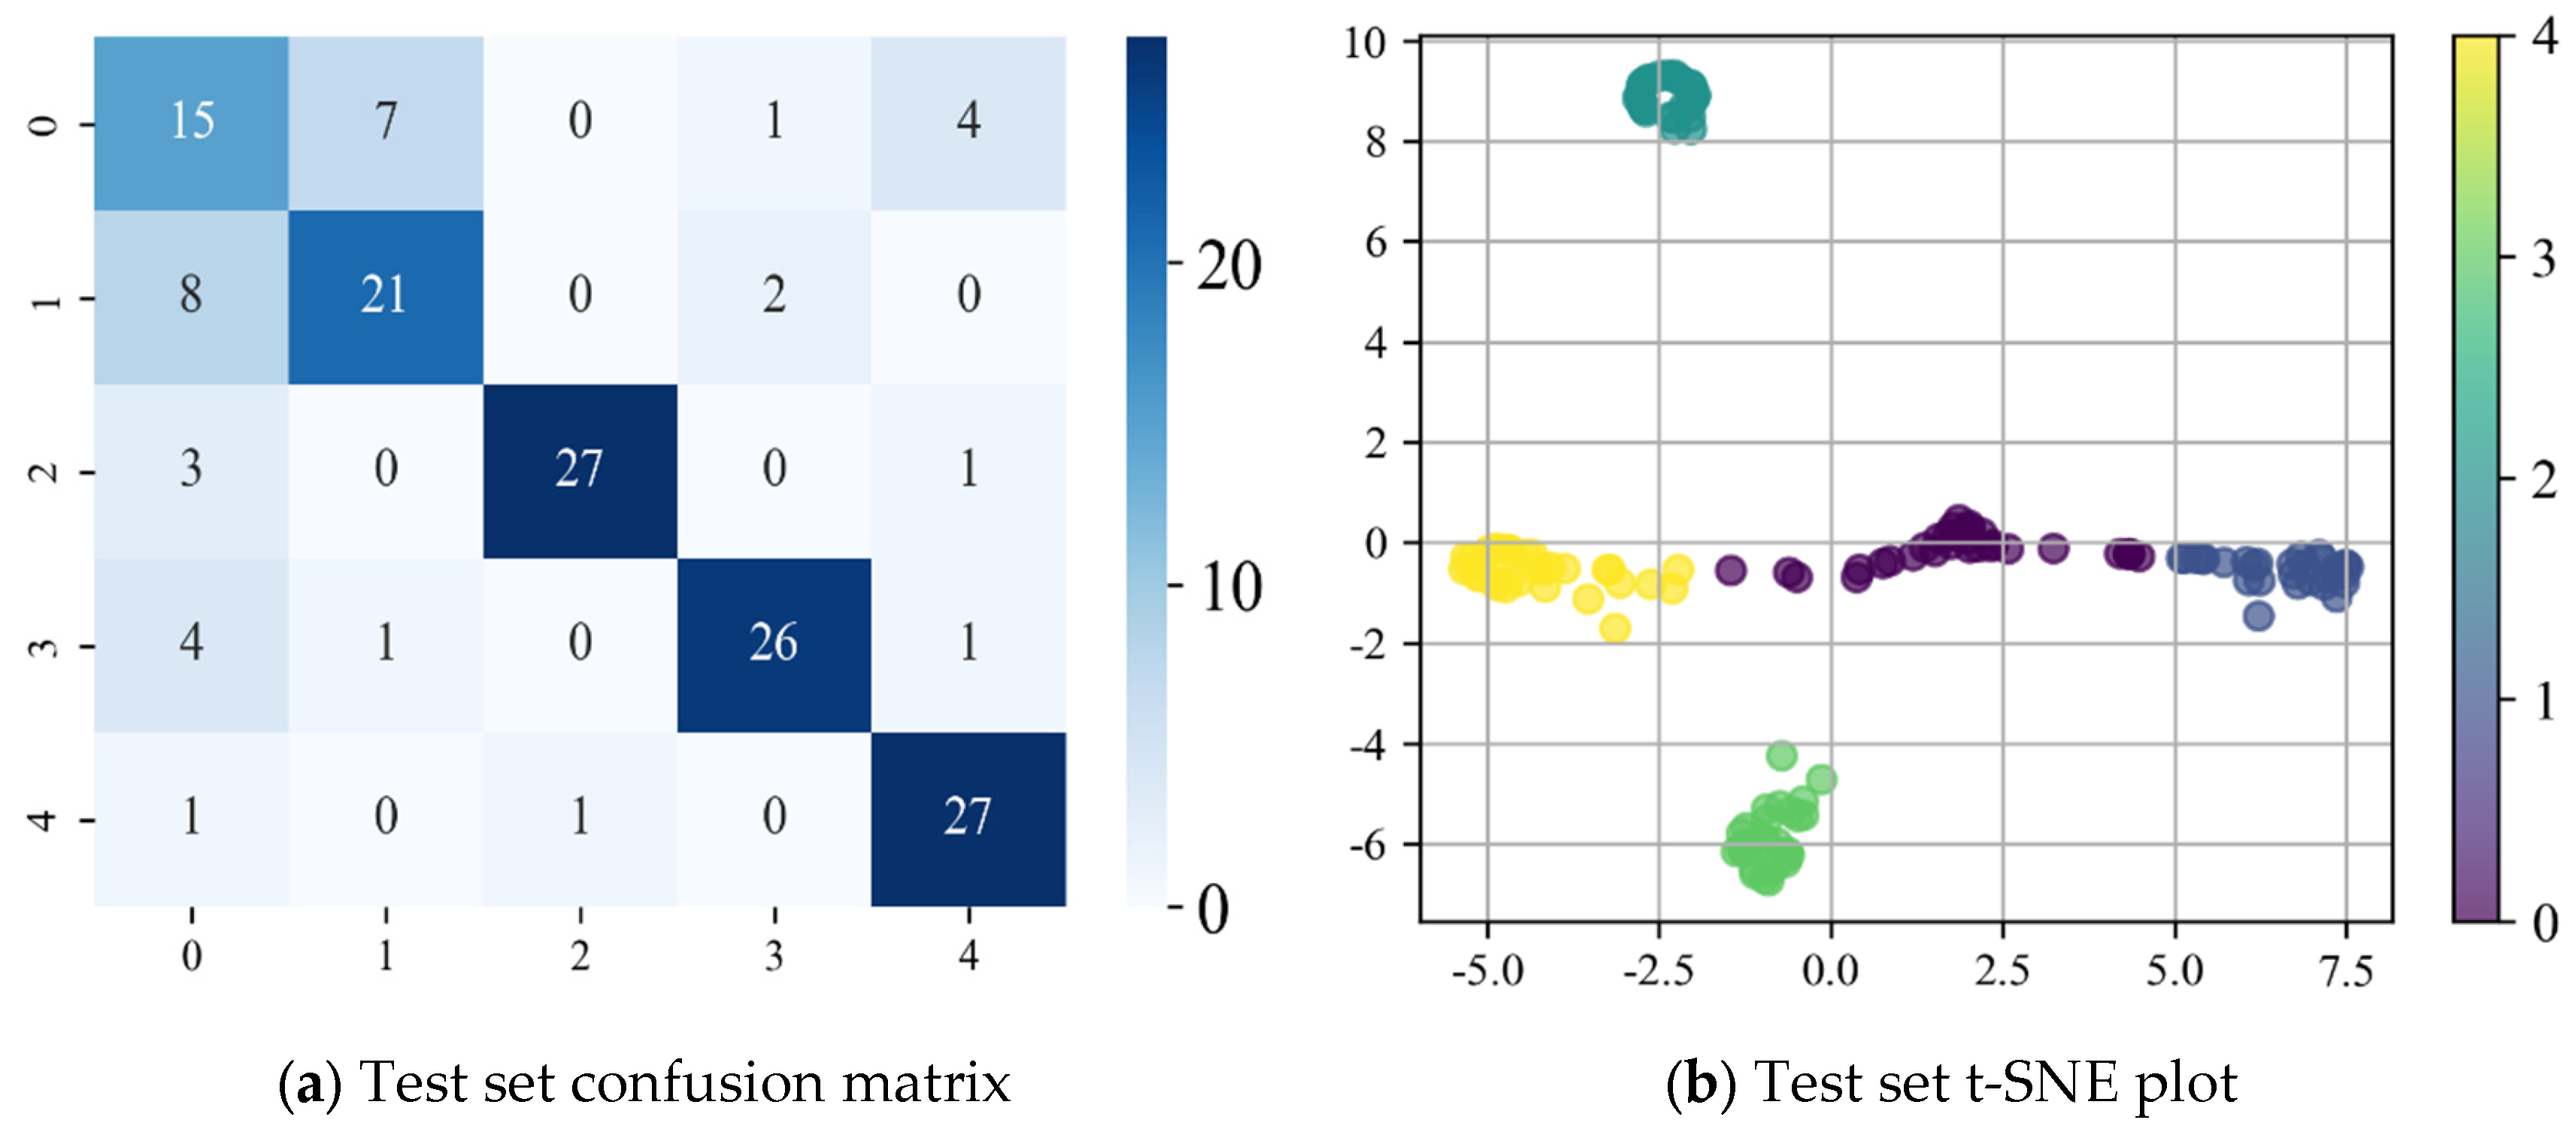
- (3)
The CEEMD-CNN-LSTM model combines the strengths of CEEMD signal decomposition, CNN spatial feature extraction, and LSTM temporal modeling, enabling it to consider both the spatial and temporal features of the data. While the model demonstrates some improvement in classification performance, as indicated by the confusion matrix and t-SNE visualization results, its accuracy is still insufficient to accurately distinguish between different fault types. Furthermore, the computational complexity of the CEEMD-CNN-LSTM model is high. The CEEMD signal decomposition process introduces additional computational overhead, and the combination of CNN and LSTM, increases the number of model parameters, leading to higher resource demands. Additionally, CEEMD signal decomposition may introduce noise, which can negatively impact both classification performance and model stability.
To more intuitively demonstrate the prediction accuracy of the proposed WPT-CEEMD-CNN-LSTM model in rolling bearing state estimation, and to comprehensively assess the overall performance of various neural network models, this paper introduces several detailed error metrics for evaluation. These include mean squared error (MSE), root mean squared error (RMSE), mean absolute error (MAE), and mean absolute percentage error (MAPE) [
44,
45]. These metrics provide a multi-dimensional view of the prediction error, allowing for a more comprehensive and accurate description of the model’s predictive performance.
- (1)
MSE: The MSE is used to measure the mean squared deviation between the predicted and true values, and can reflect the degree of accumulation of the overall model error. Its calculation formula is
where
n is the number of samples,
is the true value, and
is the corresponding predicted value.
- (2)
RMSE: The RMSE is the square root of the MSE, which can intuitively reflect the degree of deviation between the predicted value and the true value. Usually, the smaller the RMSE value, the higher the fit between the model’s prediction and the real value, and the smaller the overall error. Its calculation formula is
- (3)
MAE: The MAE is used to calculate the average absolute error between the predicted value and the true value, which can intuitively measure the overall error level of the model. Usually, the smaller the MAE value, the smaller the deviation between the predicted value and the true value, and the higher the accuracy of the model. Its calculation formula is
- (4)
MAPE: The MAPE is used to measure the percentage of prediction error relative to the true value, which can visualize the relative size of the error under different magnitudes of data. The smaller the value of the MAPE, the lower the relative error of the prediction result of the model, and the better the fitting effect. Its calculation formula is
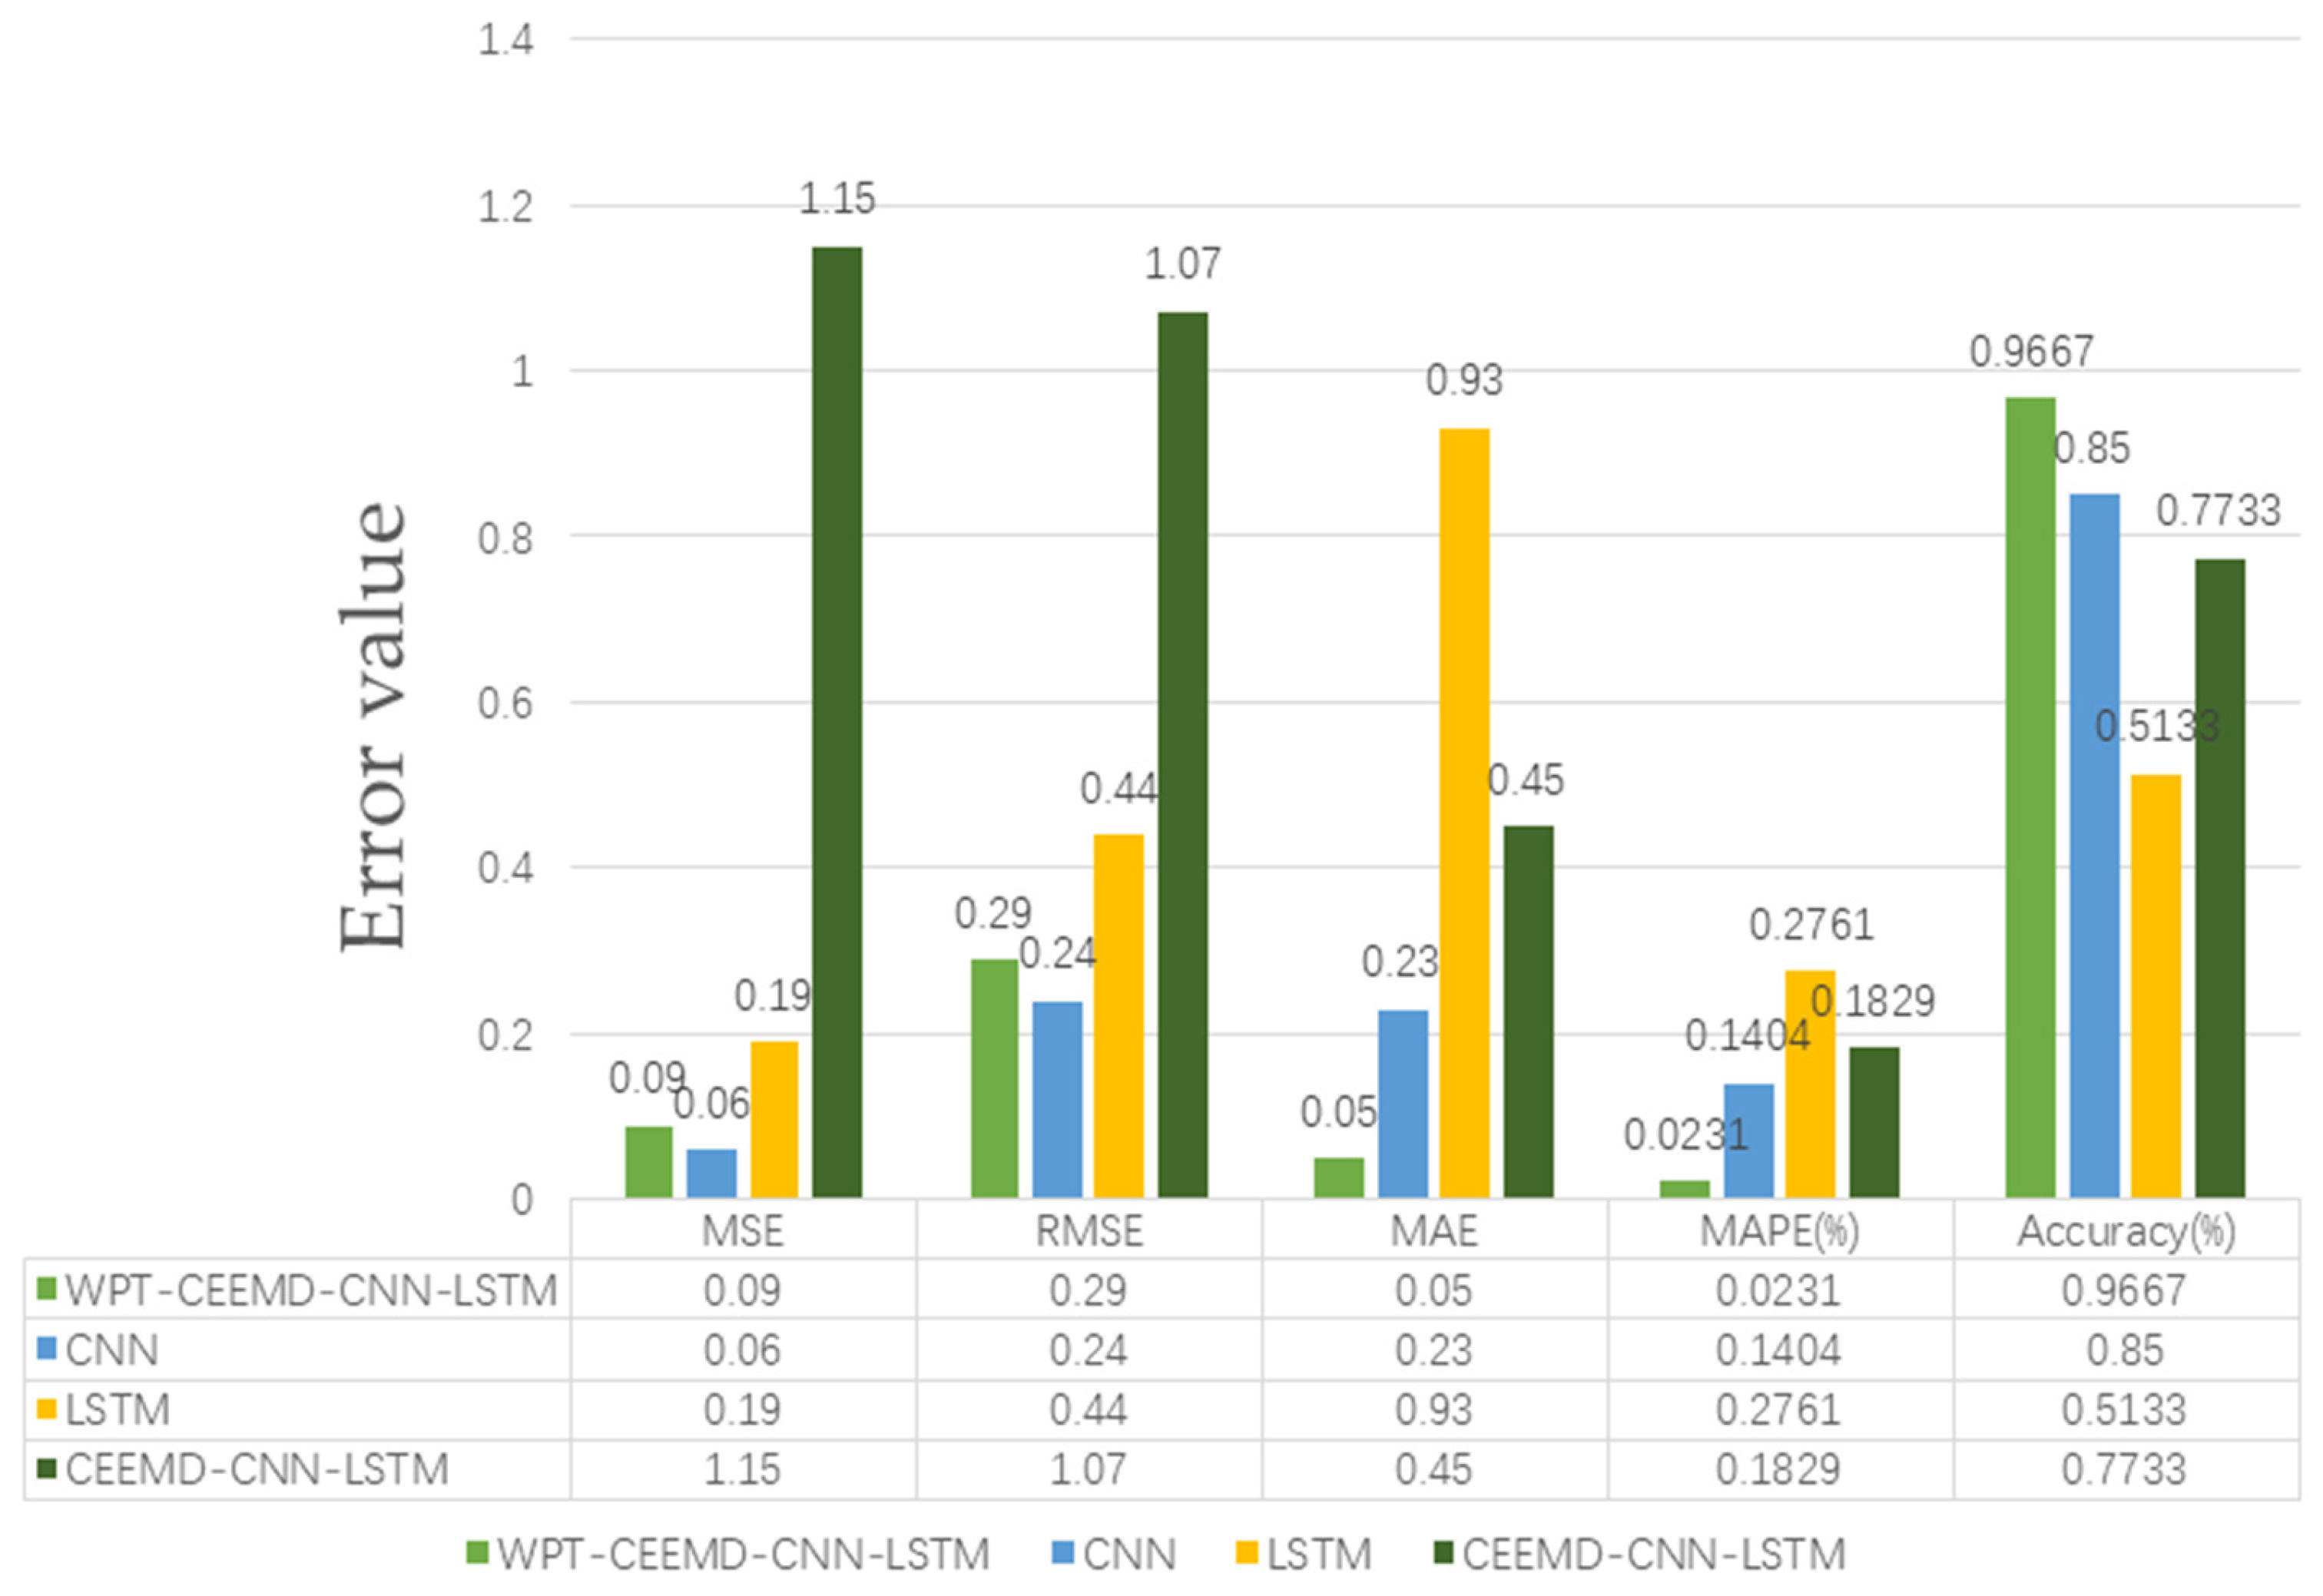
The results of the calculation of the indicators of the test set are shown in
Figure 20.
The performance of the four models (WPT-CEEMD-CNN-LSTM, CNN, LSTM, and CEEMD-CNN-LSTM) on the various error metrics (MSE, RMSE, MAE, and MAPE) and the accuracy (Accuracy%) is illustrated in
Figure 20. The details are analyzed as follows:
In terms of the error metrics, the WPT-CEEMD-CNN-LSTM model achieves the best overall performance, exhibiting the lowest MSE (0.09), RMSE (0.29), MAE (0.05), and MAPE (2.31%). These results indicate that this model has the lowest prediction error and the highest accuracy. The CNN model also performs well, with relatively low error values, outperforming LSTM and CEEMD-CNN-LSTM, but still being slightly inferior to WPT-CEEMD-CNN-LSTM. In contrast, the LSTM model demonstrates weaker performance, particularly in the MAE (0.93) and MAPE (27.61%), highlighting its significant prediction bias. Among all of the models, CEEMD-CNN-LSTM exhibits the highest error values, with MSE (1.15), RMSE (1.07), MAE (0.45), and MAPE (18.29%), indicating the lowest prediction accuracy.
Overall, the WPT-CEEMD-CNN-LSTM model outperforms all of the other models across the error metrics and accuracy, demonstrating its superiority in complex data processing and time-series prediction. Its ability to achieve a high accuracy while minimizing errors highlights its robustness and reliability. These advantages make it a highly effective solution for UAV rotor motor bearing fault diagnosis, ensuring precise and efficient fault detection.


