Article

Size Effect on Energy Characteristics of Axial Flow Pump Based on Entropy Production Theory

1
School of Mechanical Engineering, Changzhou Institute of Technology, Changzhou 213032, China
2
Shimge Pump Industry (Zhejiang) Co., Ltd., Wenling 317525, China
*
Author to whom correspondence should be addressed.
Machines 2025, 13(3), 252; https://doi.org/10.3390/machines13030252
Submission received: 9 February 2025 / Revised: 10 March 2025 / Accepted: 14 March 2025 / Published: 20 March 2025
(This article belongs to the Section Turbomachinery)

Abstract

:
To investigate the size effect on the energy characteristics of axial flow pumps, this study scaled the original model size based on the head similarity principle, resulting in four size schemes (Schemes 2–4 correspond to 3, 5, and 10 times the size of Scheme 1, respectively). By solving the unsteady Reynolds-averaged Navier–Stokes (URANS) equations with the Shear Stress Transport (SST) k-omega turbulence model, the external characteristic parameters and internal flow field structures were predicted. Additionally, the spatial distribution of internal hydraulic losses was analyzed using entropy generation theory. The results revealed three key findings: (1) the efficiency of axial flow pumps significantly improves with increasing size ratio, with Scheme 4 exhibiting a 6.1% efficiency increase compared to Scheme 1; (2) as the size ratio increases, the entropy production coefficients of all hydraulic components decrease, with the impeller and guide vanes in Scheme 4 showing reductions of 55.1% and 56.5%, respectively, compared to Scheme 1; (3) the high entropy generation coefficient regions in the impeller and guide vanes are primarily concentrated near the rim, with their area decreasing as the size ratio increases. Specifically, the entropy production coefficients at the rim of impeller and guide vanes in Scheme 4 decreased by 84.85% and 58.2%, respectively, compared to Scheme 1. These findings provide valuable insights for the selection and optimization of axial flow pumps in applications such as cross-regional water transfer, agricultural irrigation, and urban drainage systems.

1. Introduction

Axial flow pumps are characterized by their high flow rates (20–50 m3/s) and low heads (2–5 m), making them indispensable in large-scale hydraulic engineering applications such as urban flood prevention, agricultural irrigation, and inter-regional water transfer [1,2,3]. In practical engineering, the impeller diameter of axial flow pumps often exceeds 3 m, which poses significant challenges for direct energy performance testing on full-scale prototypes. To address this issue, designers typically rely on experiments conducted with geometrically scaled-down model pumps. The external characteristic parameters of the prototype pump are then derived using similarity laws. However, reducing the pump size amplifies the effects of centrifugal forces due to impeller rotation and increases the relative impact of wall roughness in hydraulic components, assuming the wall roughness requirements remain consistent between the model and the prototype. These factors can lead to deviations of prediction in hydraulic performance between the model and the full-scale pump. Therefore, understanding the size effect on energy characteristic is critical. Such insights not only help correct conversion errors arising from similarity principles but also enhance the design and application of axial flow pumps in large-scale hydraulic engineering projects.
The continuous advancement of Computational Fluid Dynamics (CFD) technology has established it as a reliable method for predicting the energy characteristics of axial flow pumps [4,5], making experimental measurements [6,7] no longer the sole approach for obtaining detailed insights into the internal flow structure. This has prompted an increasing number of scholars to employ CFD to investigate the influence of structure size of pump on energy characteristic parameters, and internal flow structure evolution. For instance, Kan et al. [8] demonstrated that increasing the radius of the blade tip gap leads to higher turbulent kinetic energy intensity and reduced pump efficiency. They also observed that the leakage vortex within the blade tip gap shifts from the leading edge to the trailing edge, providing valuable insights for optimizing blade tip gap design. Similarly, Pan et al. [9] explored the evolution of internal air bubbles in axial piston pumps, with their findings guiding the optimization of the valve plate structure and effectively mitigating outlet flow ripple. Additionally, Shi et al. [10,11] compared the internal flow structures of a novel full-flow pump (featuring backflow clearance) with those of traditional axial-flow pumps. Their results revealed that the backflow clearance significantly increases the amplitude of pressure pulsation at the main frequency near the hub region, necessitating higher blade strength requirements due to reduced internal flow field stability. Furthermore, Jiao et al. [12] found that the backflow clearance can cause a sharp rise in internal energy losses under runaway conditions and increase radial forces on the impeller during shutdown conditions. While these studies have advanced our understanding of how local geometric dimensions or structures influence the internal flow field, the size effect—that is, the effect of proportionally scaling the overall pump size on the energy characteristics—remains unexplored, representing a significant gap in current research.
Moreover, traditional energy loss analysis based on CFD technology is limited to obtaining the overall hydraulic loss of specific hydraulic components, failing to precisely identify regions of high energy loss. This limitation hinders a deeper understanding of the size effect on energy characteristics. Knock [13,14] and Herwig et al. [15] suggested that entropy production can be used as an evaluation index for energy losses, and proposed a simplified calculation formula for entropy production based on the Reynolds time averaged equation. This means that the spatial distribution of energy losses inside the pump can be obtained by calculating the local entropy generation [16,17,18]. For example, Wang et al. [19] used entropy production theory to find that under different cavitation conditions, the high-energy-loss areas of centrifugal pump blades are mainly located at the suction surface and outlet, and the hydraulic loss at the outlet of the blade pressure surface will increase with the deepening of cavitation. Yang et al. [20] found that the high-energy-loss zone inside the Slated Axial Flow Pump impeller is mainly located at the inlet of the impeller rim and hub, due to the influence of blade tip clearance leakage flow and wall effects. The high-hydraulic-loss zone inside the guide vanes is mainly located in the main flow area. Li et al. [21] compared the distribution of internal energy losses of axial flow pumps under different blade tip clearance radii under pump and turbine operating conditions. The results indicate that the blade rim and impeller inlet are high-entropy-production areas under pump conditions, while the blade rim and outlet are high-entropy-production areas under turbine conditions. And an increase in the tip clearance radius will lead to an increase in the area of the high-entropy-production-rate region. Zhang et al. [22] also found that under turbine operating conditions, the high-energy-loss zone at the suction surface head of axial flow pump blades is caused by inflow impact, while the high hydraulic loss zone at the trailing edge of the blades is affected by wake vortices. In summary, entropy production theory is an effective means of visualizing energy losses inside pumps [23,24], and establishing a physical connection between the spatial distribution of hydraulic losses and the internal flow field structure is crucial for elucidating the size effect on energy characteristics.
In this study, four axial flow pumps with different pump sizes were designed based on the principle of equal head similarity (Schemes 2–4 correspond to 3, 5, and 10 times the size of Scheme 1, respectively). The hydraulic characteristic parameters and internal flow field structures of these four pump designs were predicted by solving the unsteady Reynolds-averaged Navier–Stokes (URANS) equations. Furthermore, the spatial distribution of hydraulic losses within the axial flow pumps, resulting from size effects, was analyzed using entropy production theory. The findings of this study provide a theoretical foundation for the selection and design of axial flow pumps, offering valuable insights for optimizing their performance in practical engineering applications.

2. Research Methods

The hydraulic components of the original specific speed axial pump under study include the inlet channel, impeller, guide vanes, and outlet channel as shown in Figure 1. Original Scheme is designed based on the standard model pump size, with an impeller diameter of 300 mm and a tip clearance of 0.2 mm. The impeller has three blades, while the guide vane has five blades. The impeller rotates at a speed n of 1450 r/min, with a designed flow rate Qdes of 350 L/s and a specific rotational speed ns of 1179.29 (ns = 3.65nQdes0.5/H0.75). In this study, the original axial flow pump is designated as Scheme 1. To design a pump size capable of covering the range required for small, medium, and large pumping stations, Schemes 2, 3, and 4 were derived by scaling up Scheme 1 by factors of 3, 5, and 10, respectively, while maintaining geometric similarity. The design flow rate and rotational speed for all four schemes adhere to the principle of equal head similarity. Detailed parameters for each scheme are provided in Table 1.

2.1. Numerical Simulation

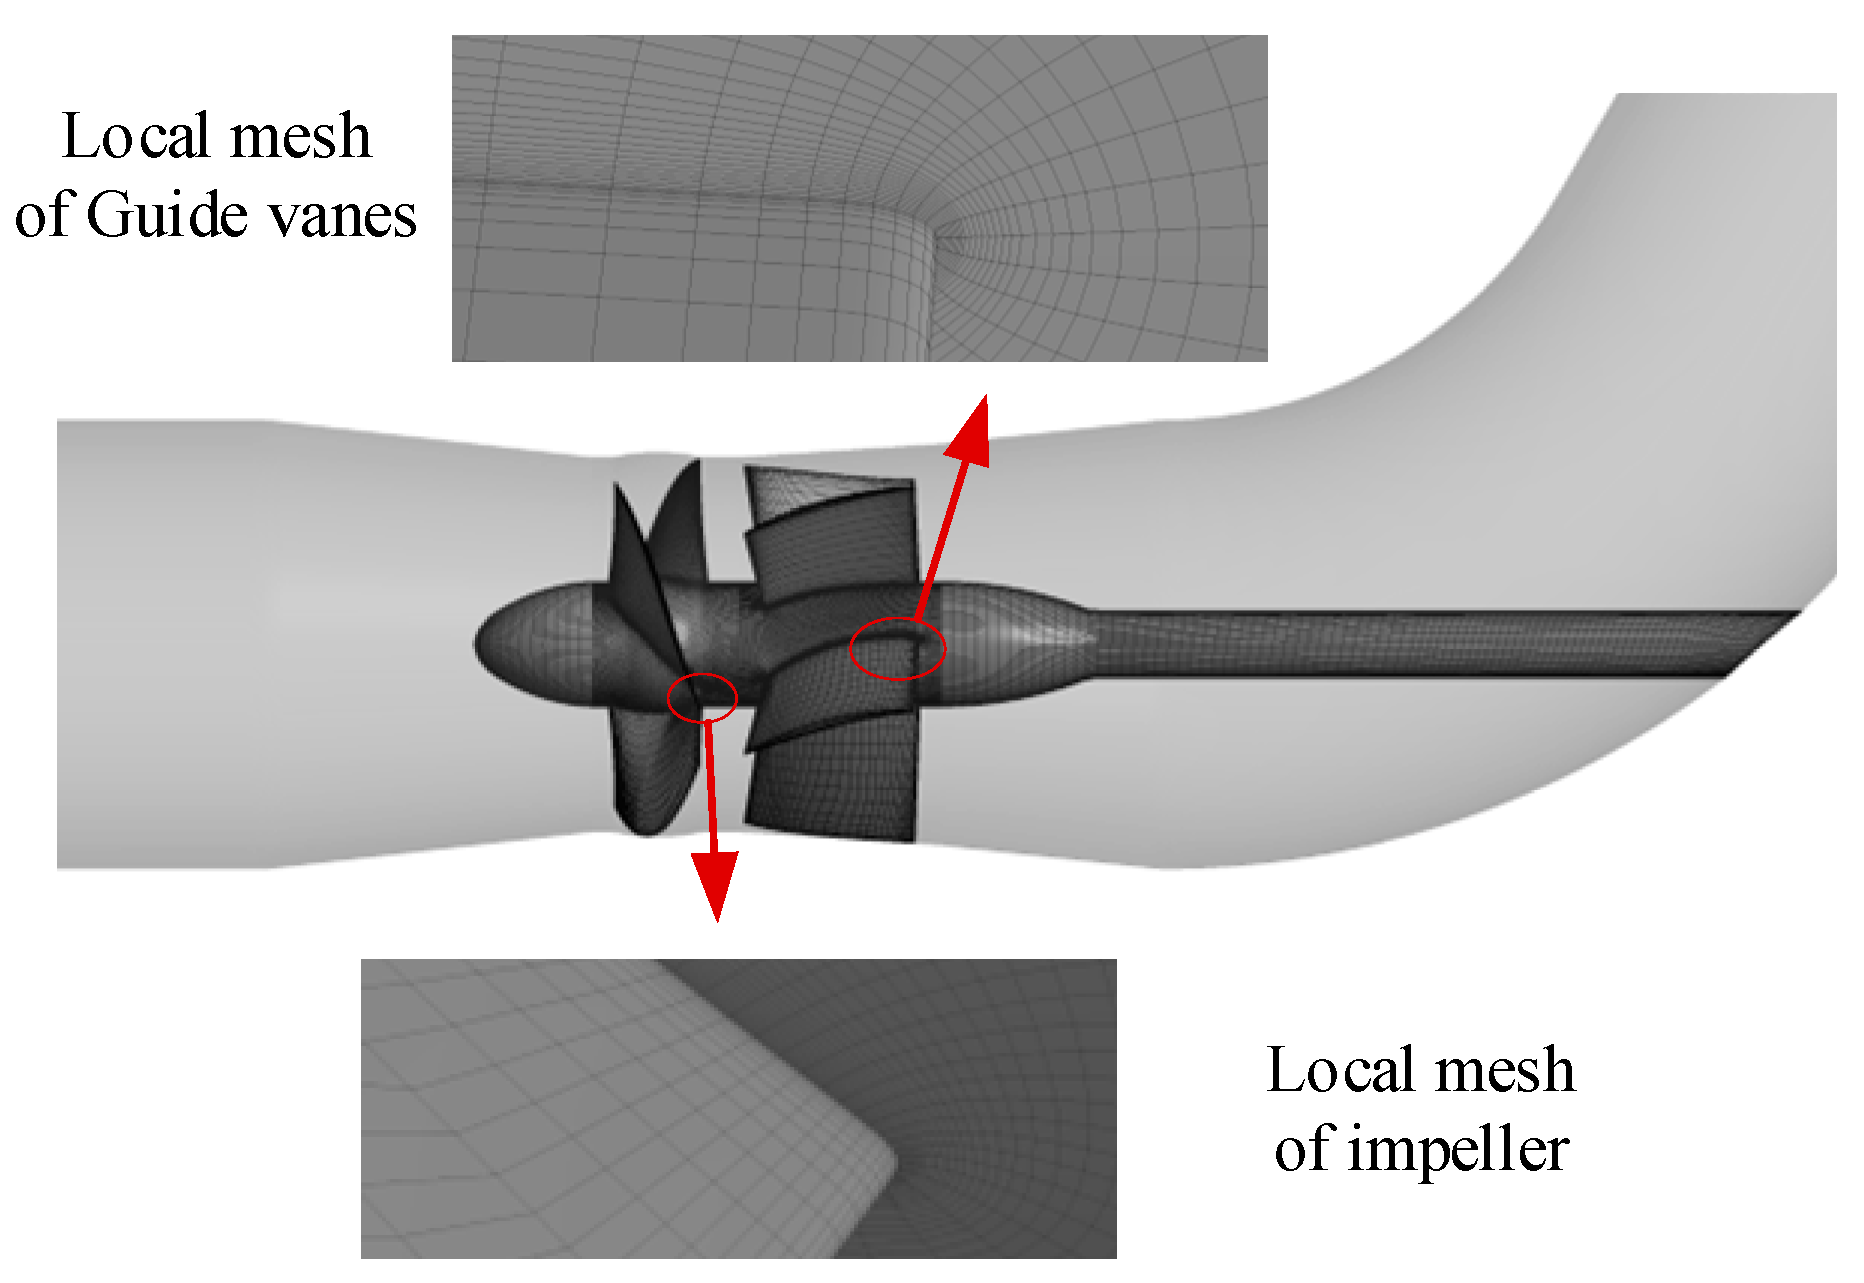
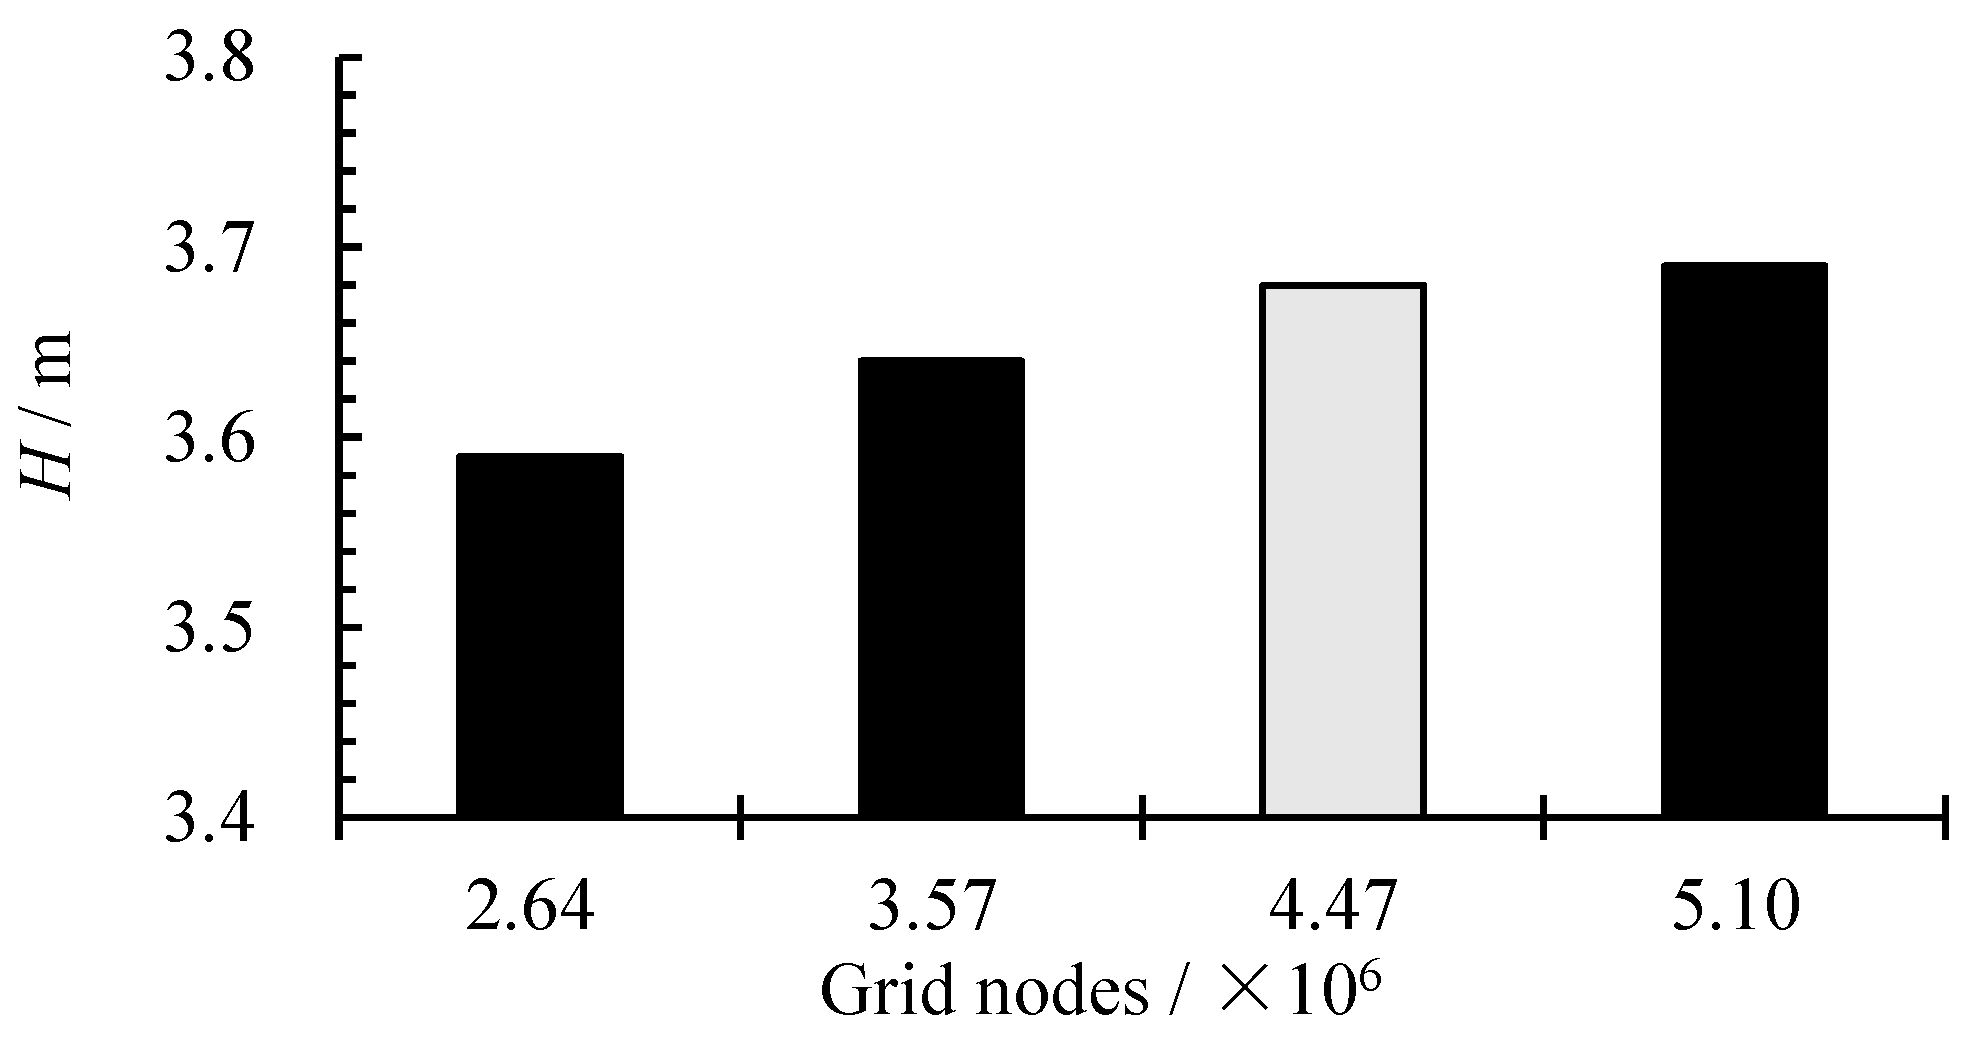
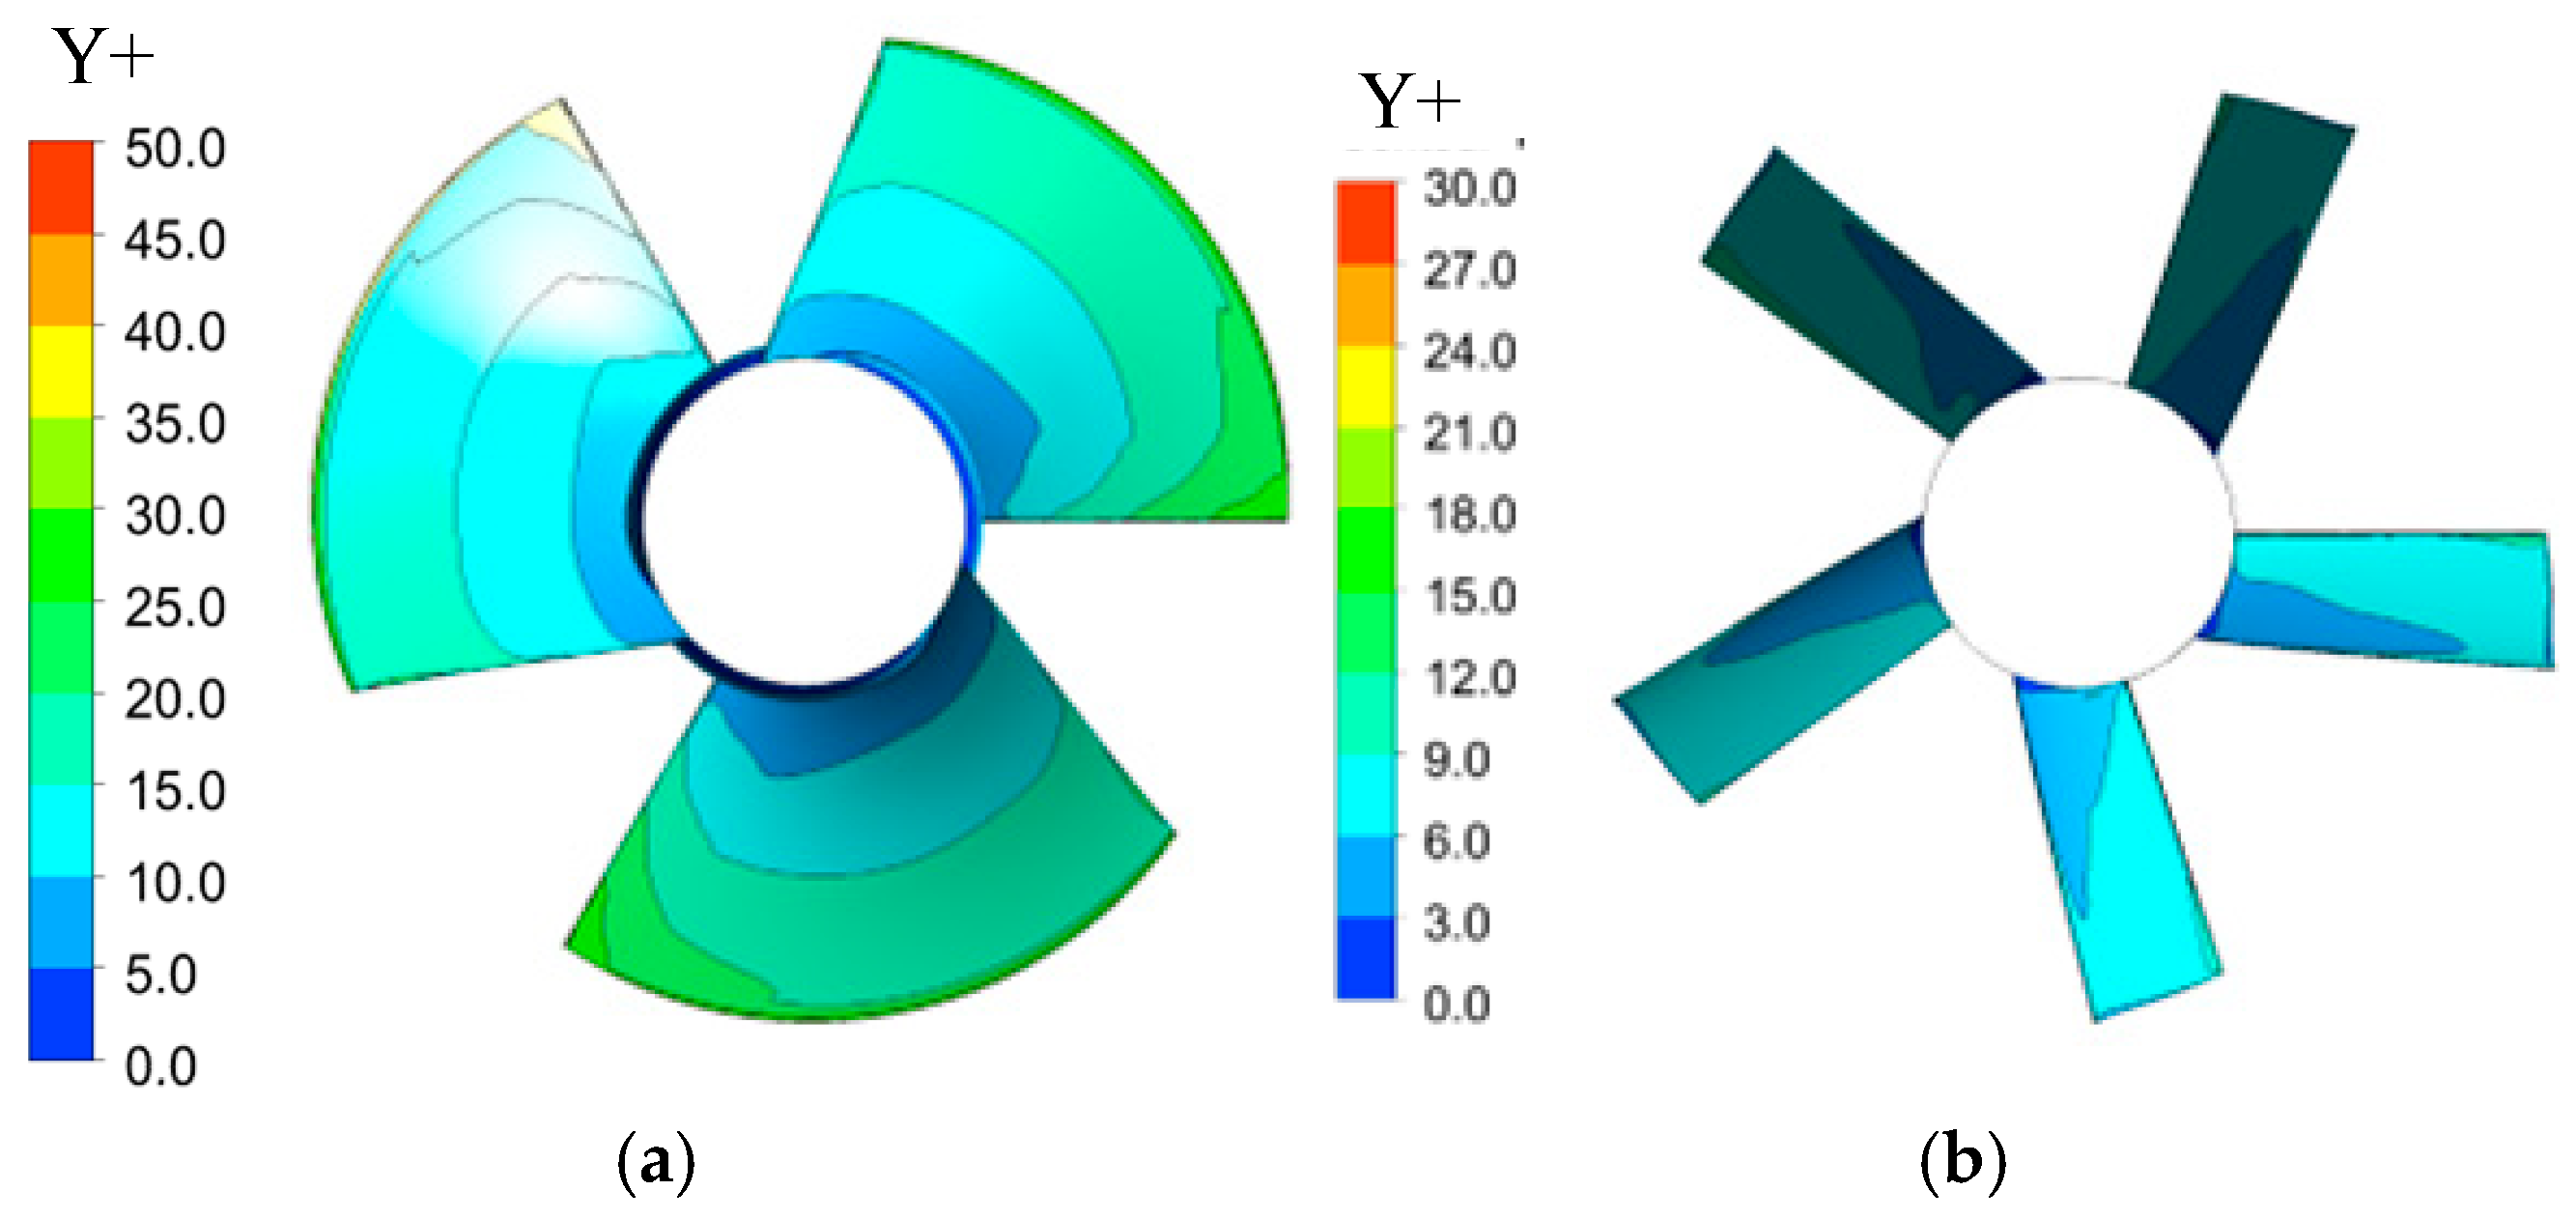
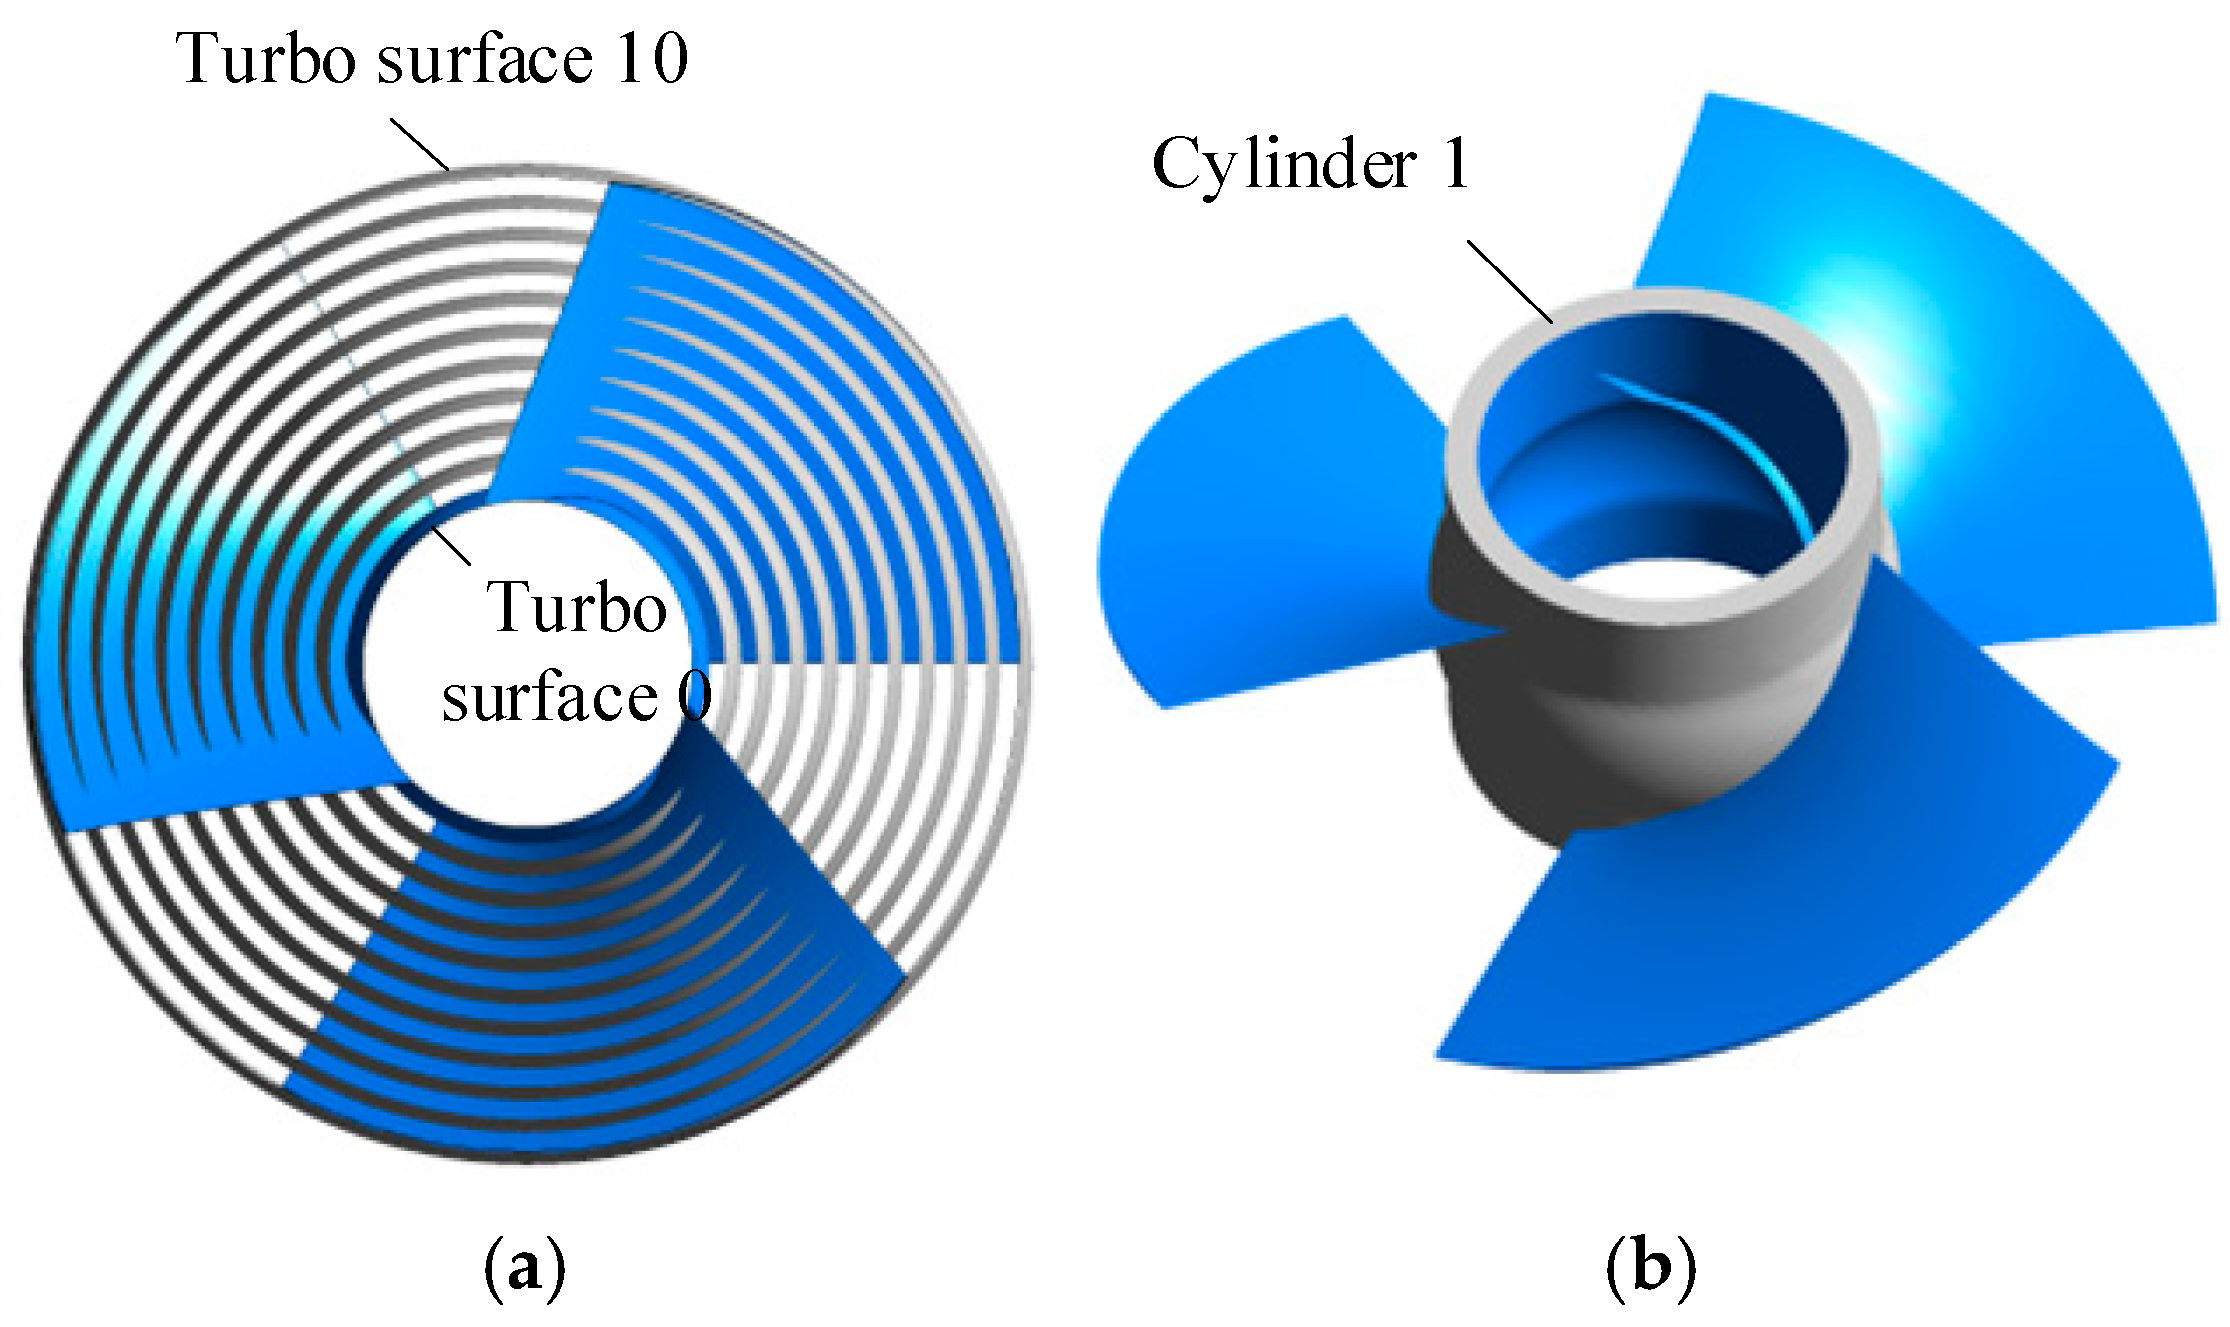
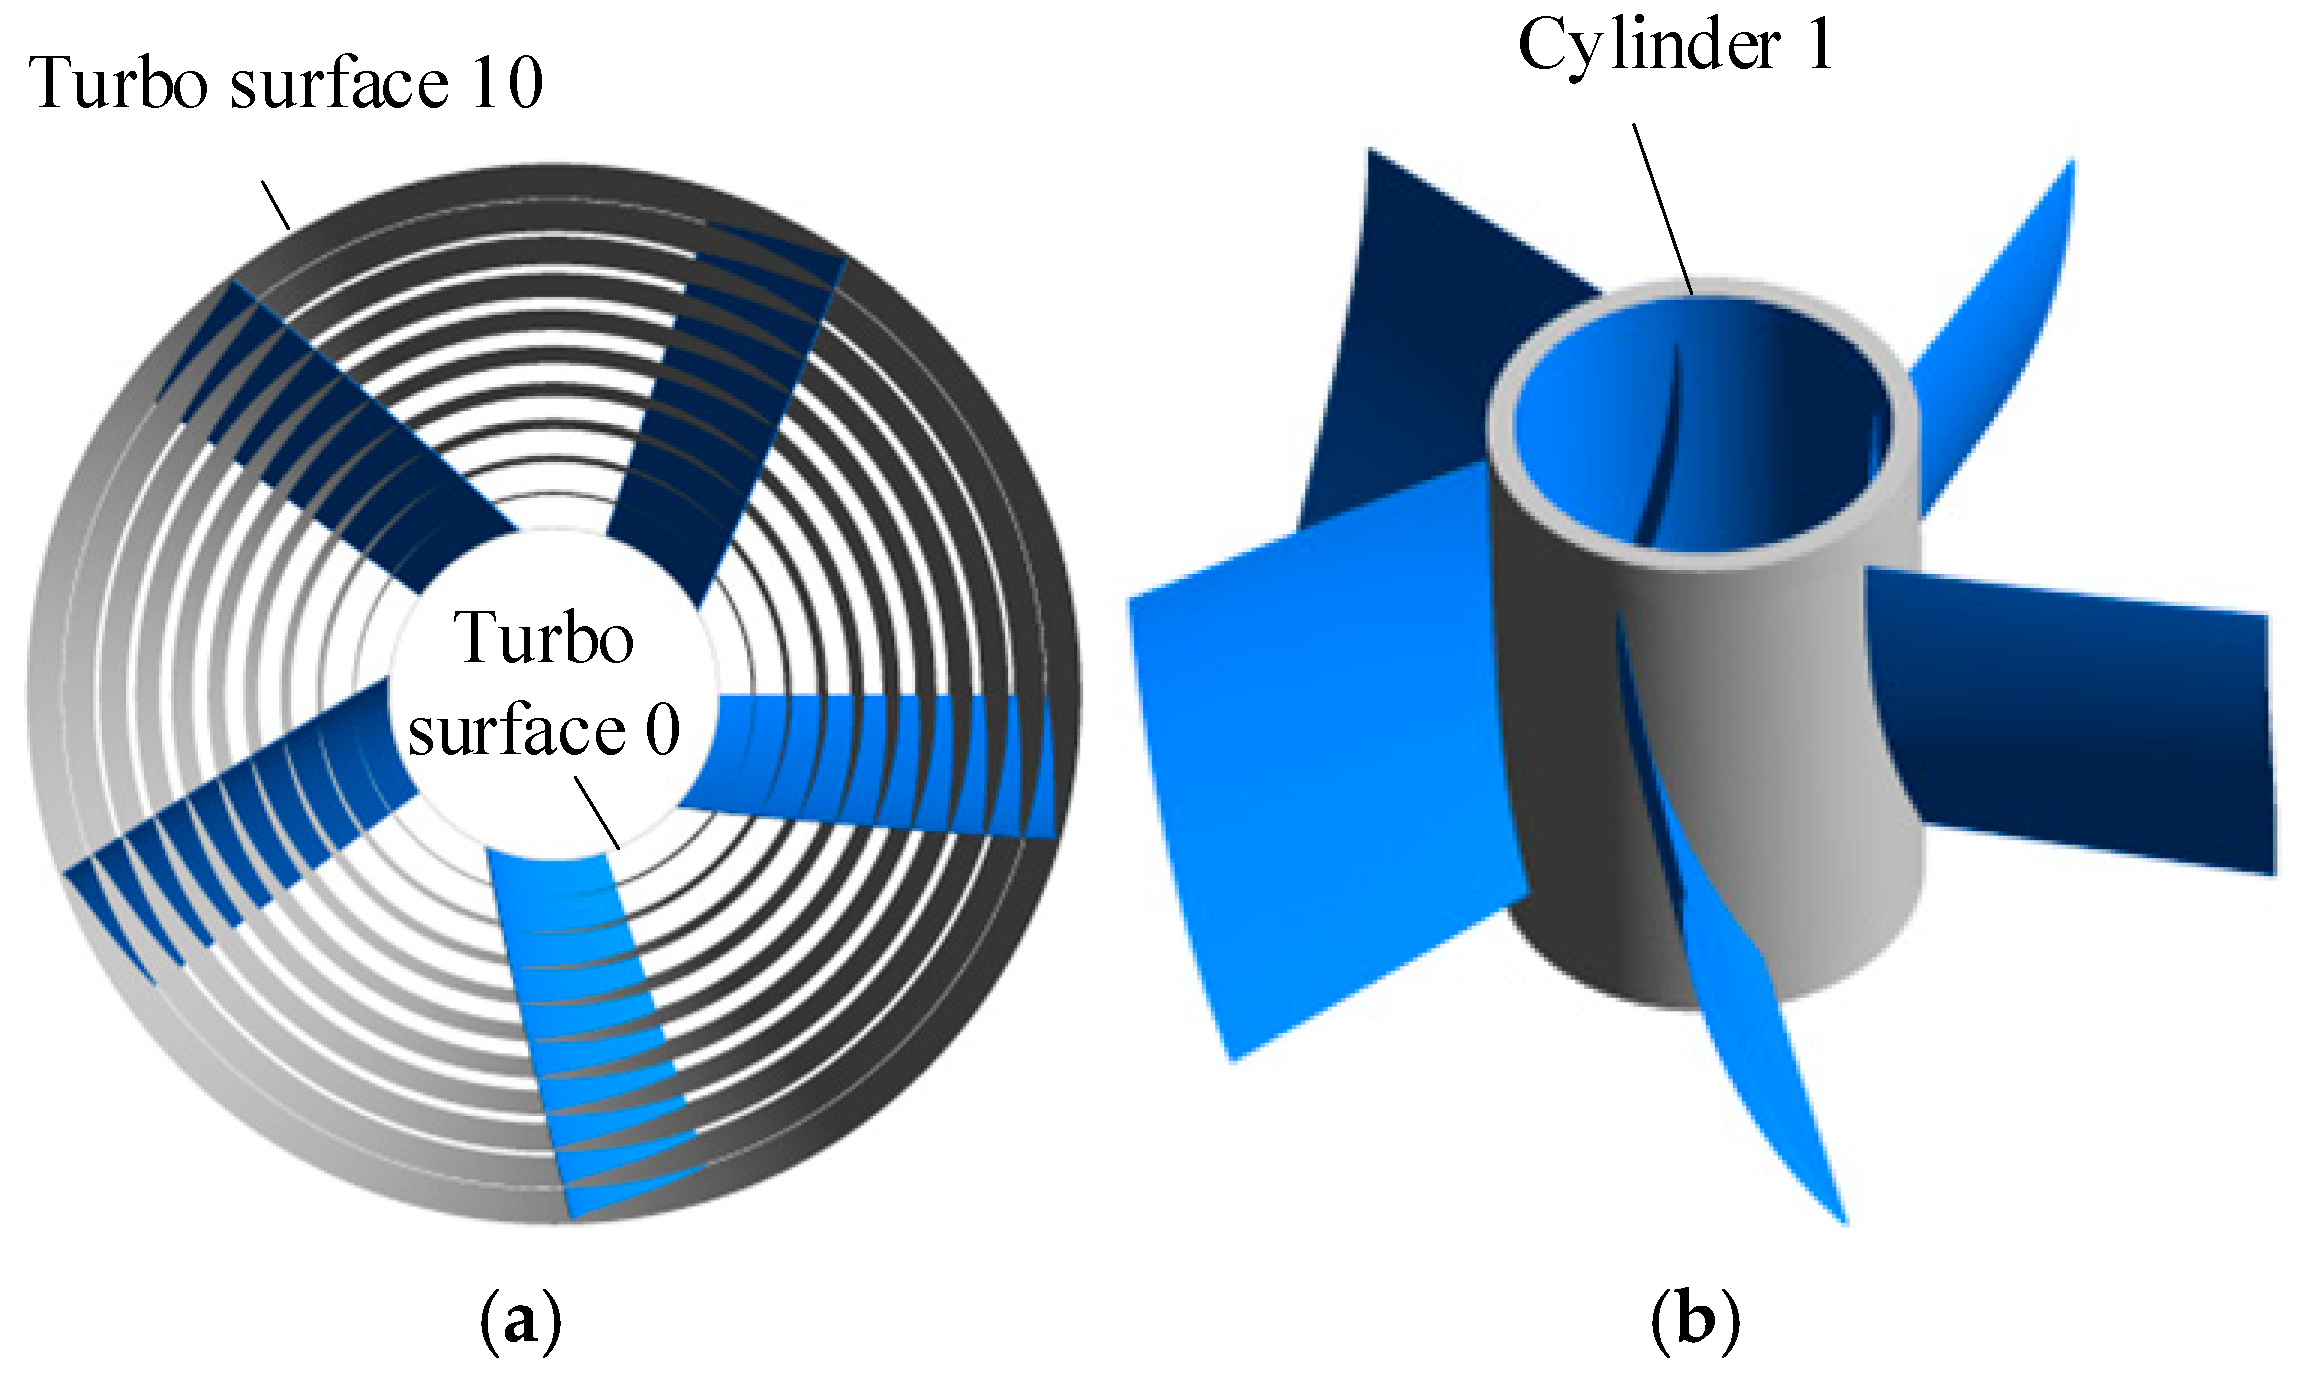
2.1.1. Mesh Generation

To accurately capture the internal flow field structure of the pump, all computational domains were discretized using structured hexahedral meshes. Figure 2 illustrates that all hydraulic components are discretized using hexahedral grids. The blade regions of the impeller and guide vanes were partitioned into an O-type mesh structure, with localized mesh refinement applied to enhance accuracy. Figure 3 presents the grid independence analysis. As illustrated in the figure, when the number of grids in the computational domain exceeds 4,469,203, the head exhibits significant changes, with further increases in grid density. Based on this analysis, the final number of grid nodes selected for each hydraulic component in the computational domain is as follows: 912,352 nodes in the outlet channel, 1,503,480 nodes in the guide vane, 1,369,620 nodes in the impeller, and 683,751 nodes in the inlet channel. The average Y+ values for the inlet channel, impeller, guide vanes, and outlet channel are 41.94, 20.59, 5.12, and 60.92, respectively. The distribution of Y+ values on the impeller and guide vanes is presented in Figure 4.

2.1.2. Boundary Condition

In the computational domain, the unsteady Reynolds-averaged Navier–Stokes (RANS) equations serve as the governing equations, and the Shear Stress Transport (SST) k-omega model [25,26] is selected for turbulence modeling due to its high accuracy in predicting separated flows and reverse pressure gradient flow fields. The inlet boundary condition is defined as ‘Mass Flow Rate’ [27], while the outlet boundary condition is specified as Opening [28]. The interface condition between the rotor and stator is set to ‘Transient Rotor Stator’, and the interface condition between stators is configured as ‘None’. The wall roughness values are set to 0.0125 mm [29] for the impeller and guide vane, and 0.05 mm [30] for the inlet and outlet channels. The time step is fixed at 0.000344828 s, corresponding to a total simulation duration of 0.413793 s.

2.2. Entropy Production Theory

Due to the viscosity and Reynolds stress of the working fluid within the pump, the kinetic and pressure energy of the internal flow field are partially converted into internal energy during operation, leading to an increase in overall entropy production. Therefore, local entropy production serves as an effective evaluation metric for determining the spatial distribution of internal hydraulic losses. For the working fluid inside the pump, which is modeled as a single-phase incompressible fluid, the time-averaged entropy production and transport equation is expressed as follows [13,14,15]:
ρ s ¯ t + v 1 ¯ s ¯ x + v 2 ¯ s ¯ y + v 3 ¯ s ¯ z + ρ v 1 s x ¯ + v 2 s y ¯ + v 3 s z ¯ = div q T ¯ + Φ ¯ T + Φ Θ ¯ T 2
where T and ρ are the temperature and density. s ¯ and s are the time-averaged entropy production and the fluctuation component of entropy production. v 1 ¯ , v 2 ¯ , and v 3 ¯ represent the time-averaged velocity components’ directions of the x, y, and z axes for the Cartesian coordinate system, respectively. v 1 , v 2 , and v 3 represent the velocity fluctuation components in three directions. The div q T ¯ , Φ T ¯ , and Φ Θ ¯ T 2 at the right end of the equation represent the local entropy production caused by reversible heat transfer, dissipation, and temperature difference transfer, respectively. Due to the fact that the internal flow field of the water pump is approximately in an irreversible adiabatic state during operation, the increase in entropy production is only related to Φ T ¯ , which is composed of entropy production rate induced by the indirect dissipation S Pr o , I and that induced by direct dissipation S Pr o , D , as shown below:
Φ T ¯ = S Pr o , T = S Pr o , D + S Pr o , I
S Pr o , D = μ T 2 × v 1 ¯ x 2 + v 2 ¯ y 2 + v 3 ¯ z 2 + v 1 ¯ y + v 2 ¯ x 2 + v 3 ¯ x + v 1 ¯ z 2 + v 2 ¯ z + v 3 ¯ y 2
S Pr o , I = μ T 2 × v 1 x ¯ 2 + v 2 y ¯ 2 + v 3 z ¯ 2 + v 1 y + v 2 x ¯ 2 + v 3 x + v 1 z ¯ 2 + v 2 z + v 3 y ¯ 2
However, the control equation (unsteady Reynolds time averaged equation) used in this study cannot obtain the velocity fluctuation components; that is, S Pr o , I cannot be calculated based on the numerical simulation results. To solve this problem, Kock proposed an approximate calculation formula for Equation (3) [13,14,15]:
S Pr o , I = ρ ε T
where ε is the turbulent dissipation rate. The overall entropy production S Pr o , T of hydraulic components is the volume fraction of local total entropy production S Pr o , T :
S Pr o , T = S Pr o , T d V
Entropy production serves as an indicator of energy loss, which is essentially the difference between input and output power. Given that input power varies with size ratio, the entropy production coefficient (EPC) ζ is used as a more appropriate metric for evaluating energy loss across different size ratios. The EPC is calculated as follows:
ζ = S Pr o , T × T P d V
To eliminate the influence of input power on entropy production rate comparisons, the entropy production rate coefficient (EPRC) τ is used as an evaluation metric. The EPRC is calculated as follows:
τ = S Pr o , T × T P

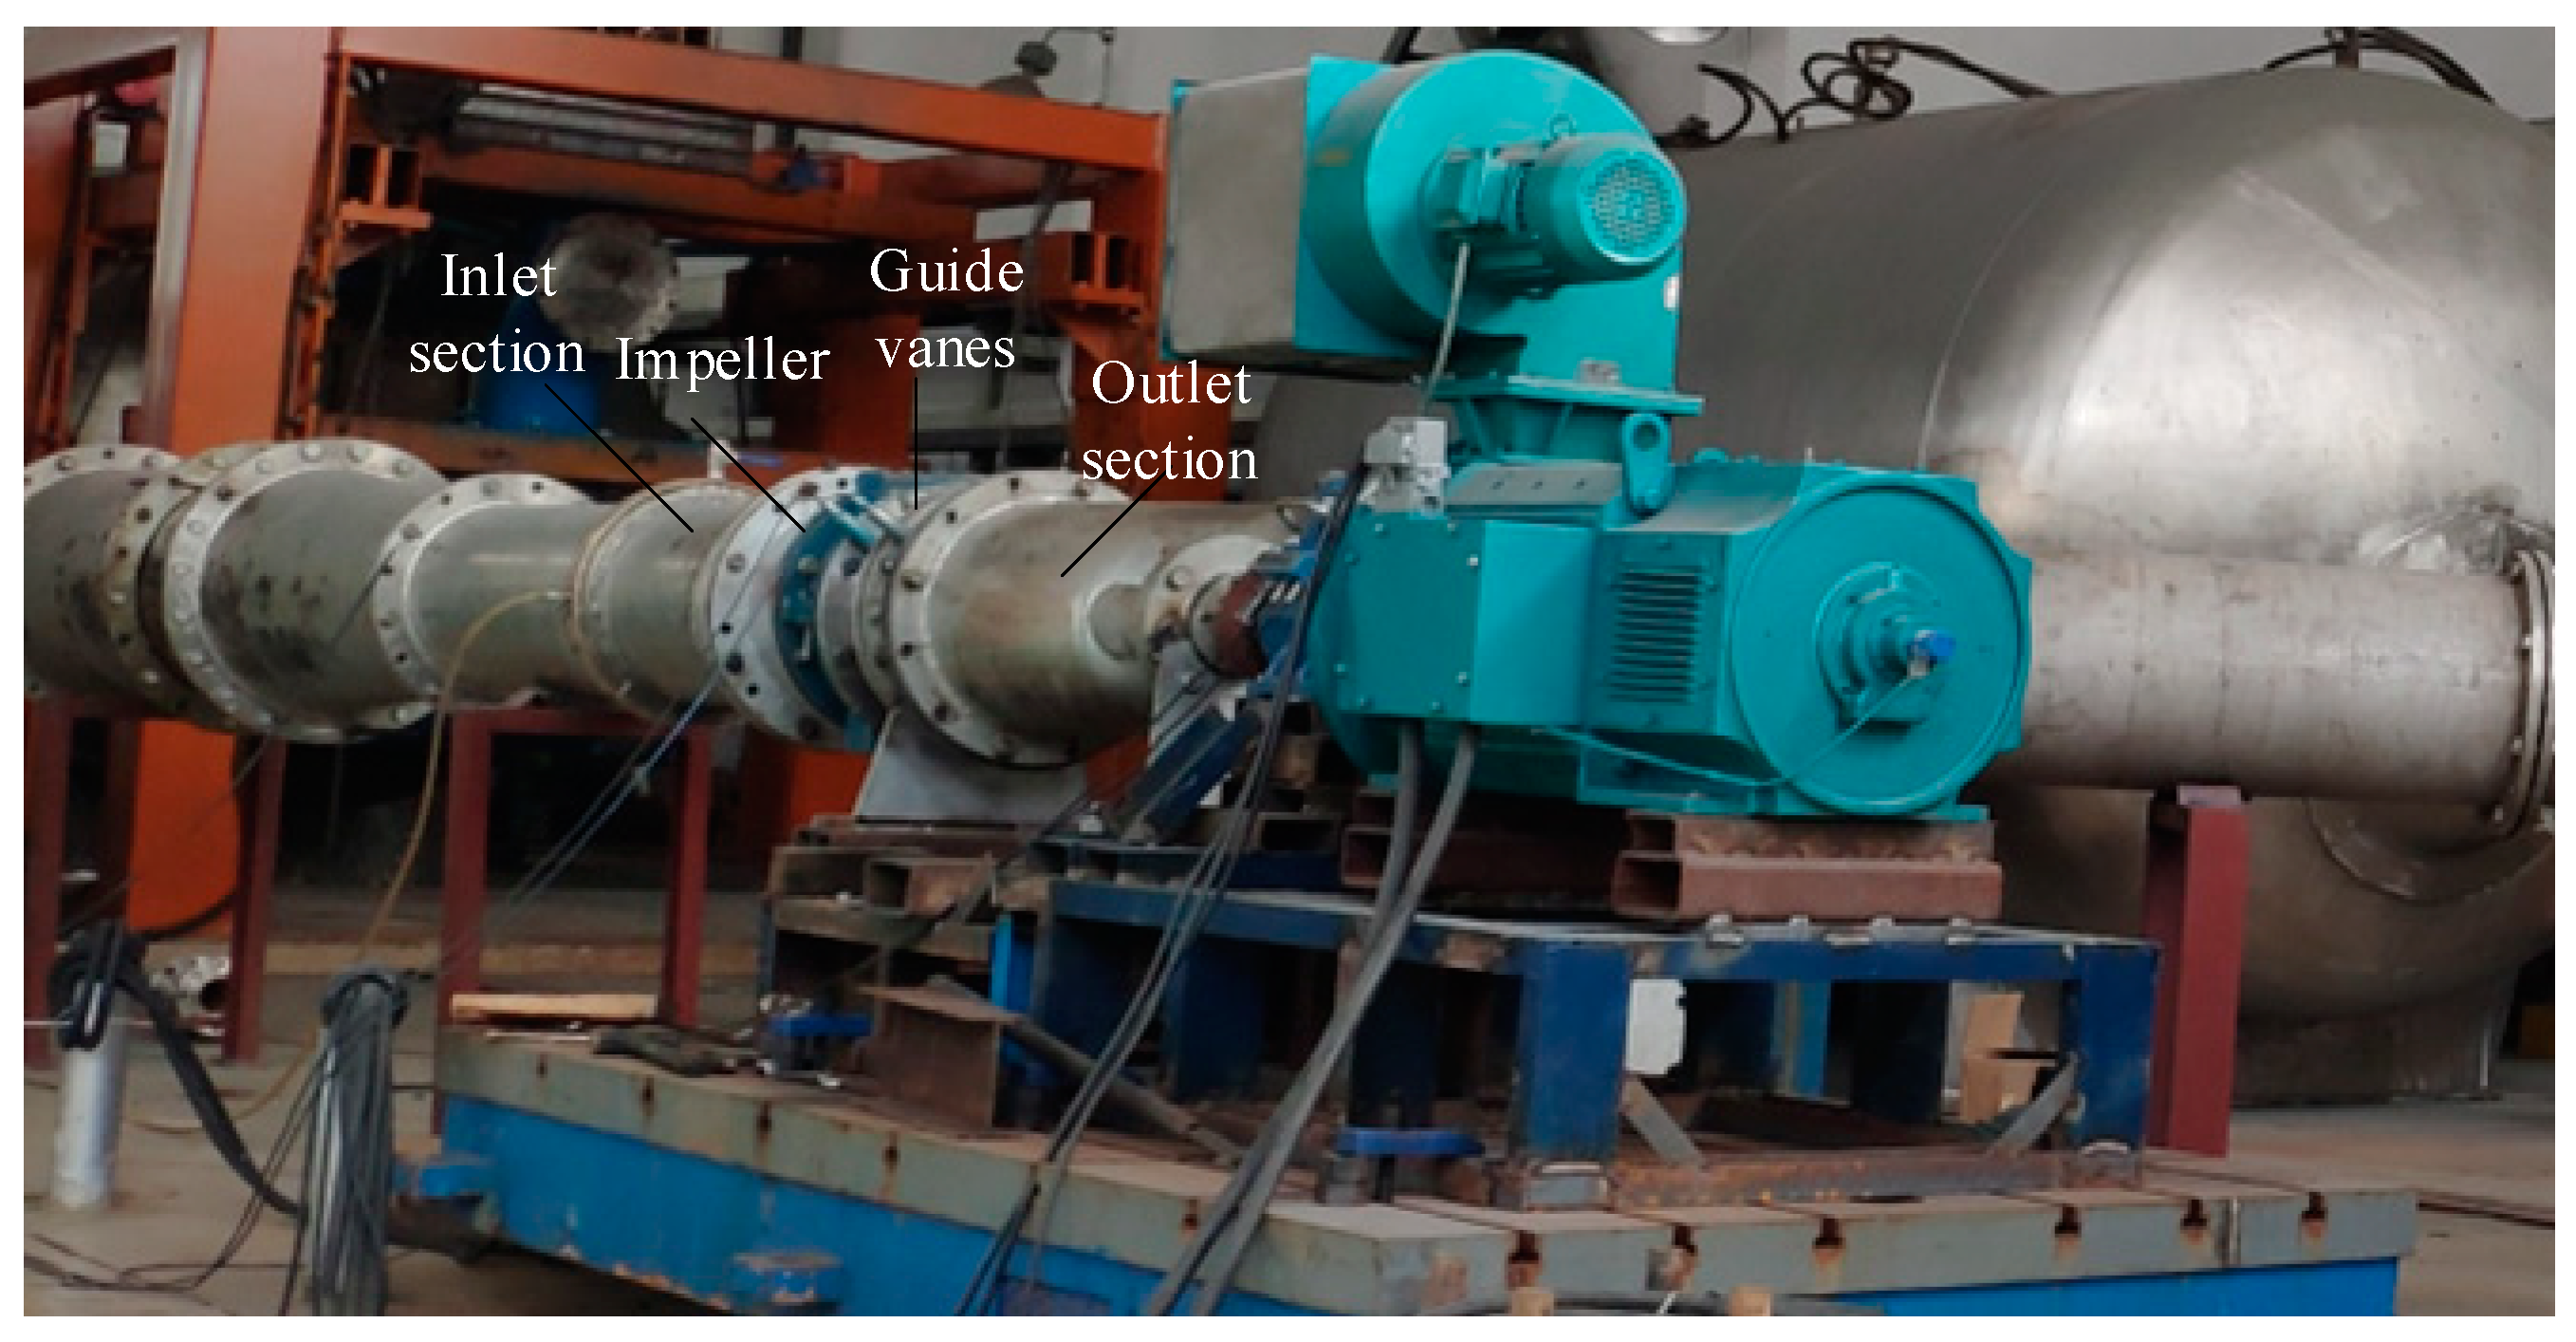
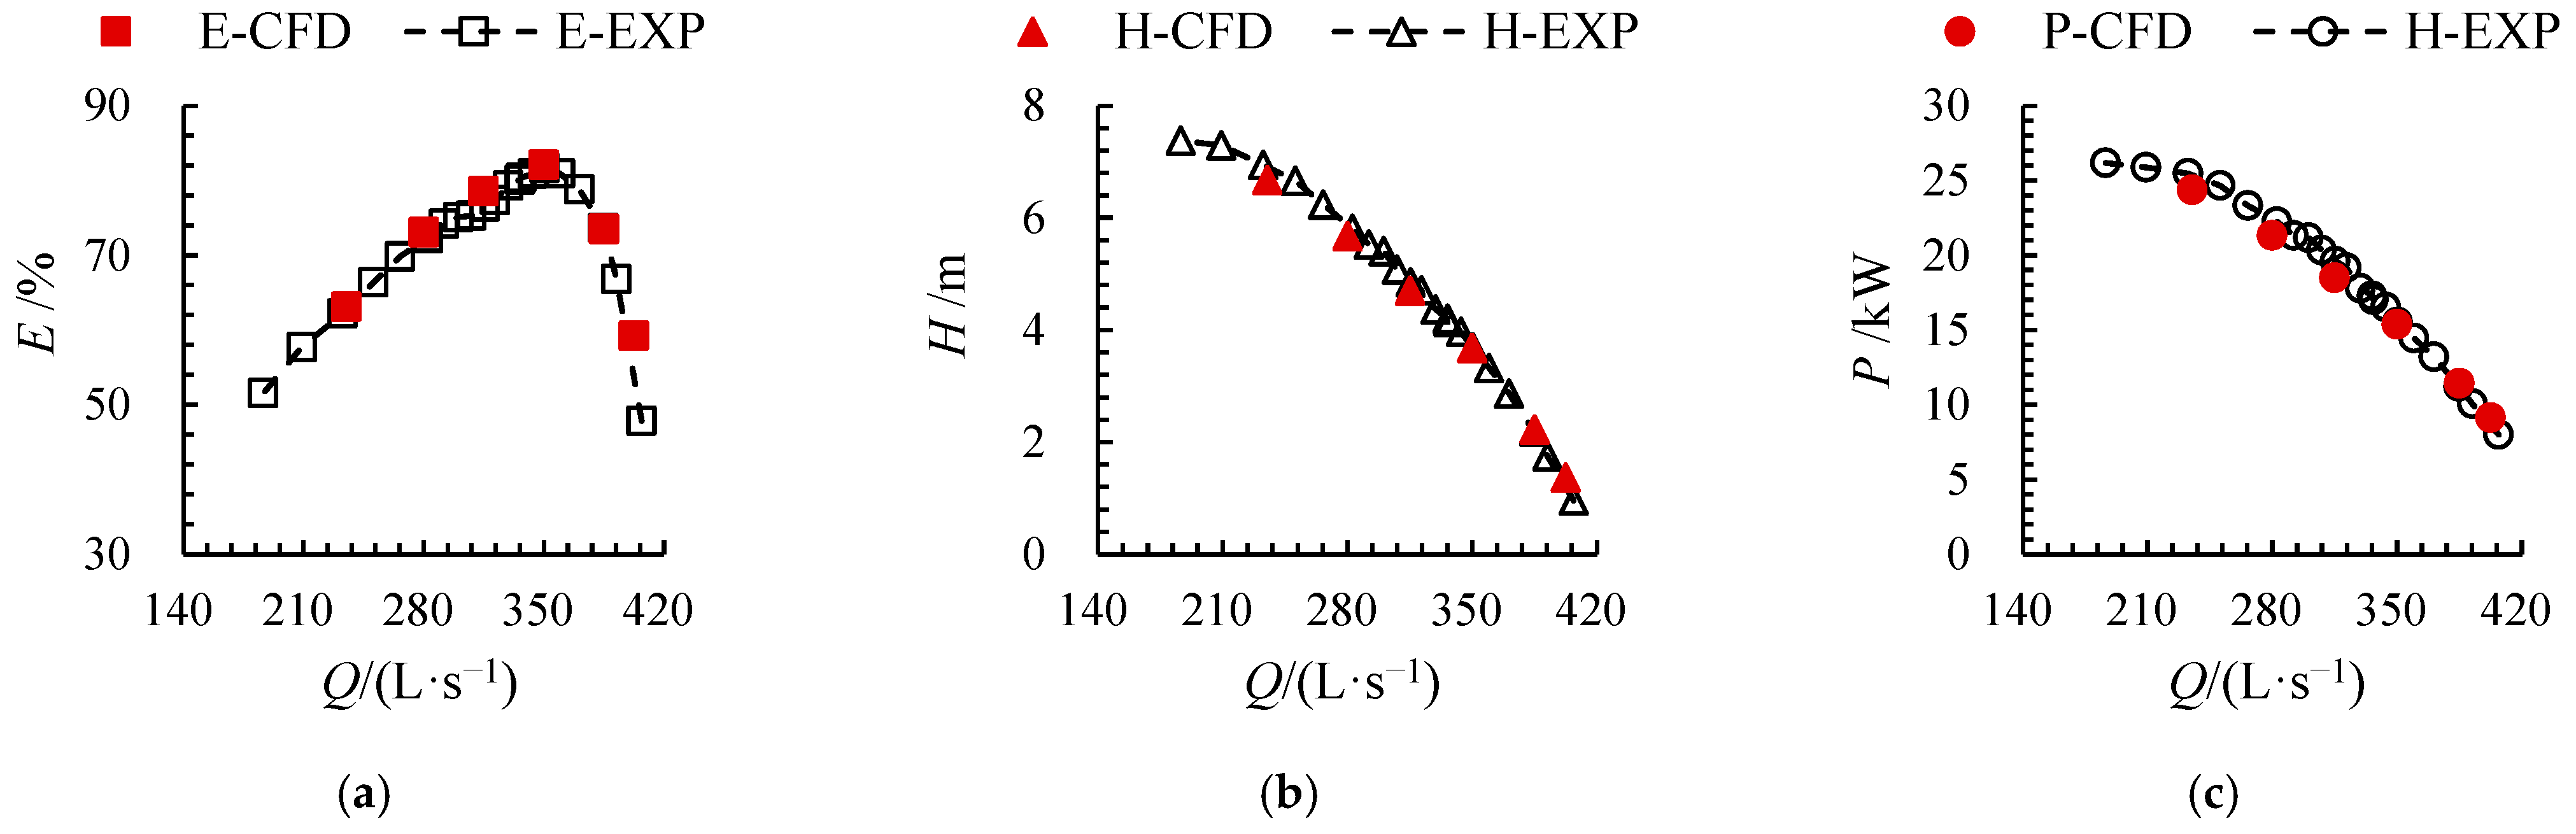
3. Test Verification

To verify the appropriateness of the numerical simulation boundary conditions and assess the accuracy of the simulation results, the external characteristic test for Scheme 1 was conducted on a closed hydraulic machinery test bench. As shown in Figure 5, the test bench is designed with a two-layer structure. The upper layer contains the JCL1 intelligent torque-speed sensor and the Yokogawa EJA intelligent differential pressure transmitter, which are utilized to measure power and head, respectively. The torque meter and differential pressure flowmeter have maximum measurement capacities of 200 N·m and 10 m, respectively. The lower layer is equipped with a German Krohne intelligent electromagnetic flowmeter for measuring the operating flow rate, with a maximum measurement capacity of 1800 m3/h. The measurement accuracies for power, head, and flow rate are better than 0.14%, 0.1%, and 0.2%, respectively. The overall measurement uncertainty of the test bench is determined by the combined uncertainties of these three instruments: ( 0.2 % ) 2 + ( 0.14 % ) 2 + ( 0.1 % ) 2 = 0.26 % .
The external characteristic curves obtained from numerical simulation and experimental measurements are presented in Figure 6. As shown in the figure, the efficiency, head, and power curves derived from numerical simulations closely align with those from experimental measurements. The head and power curves decrease with increasing flow rate, with deviations between the simulated and measured values of 0.36% for head and 0.89% for power under the design operating condition. Since pump efficiency is directly proportional to head and inversely proportional to input power, the efficiency curve demonstrates a trend of initially increasing and then decreasing as the flow rate rises, with peak efficiency occurring at the design flow rate. At the design flow point, the deviation between the simulated and measured efficiency values is 0.53%. These results demonstrate a high level of agreement between the numerical simulations and experimental data, confirming the reliability of the computational results.

4. Results and Discussion

This study investigates the impact of size effects on the internal flow field of axial flow pumps by analyzing the external characteristic parameters and the spatial distribution of hydraulic losses across four design schemes.

4.1. The Size Effect on External Characteristic Parameters

Figure 7 illustrates the power curves as a function of the size ratio (γ) at different flow rates. The input power of the axial flow pump increases with γ across all three flow rates. This is attributed to the increased inlet flow rate and enhanced water resistance as the pump size increases, requiring more power to overcome the resistance during impeller rotation. Notably, the power curve is non-linear, with a sharp upward trend observed when γ exceeds 5. At flow rates of 0.8Qdes, 1.0Qdes, and 1.15Qdes, the input power for γ = 10 increased by 9838.0%, 9853.8%, and 9824.0%, respectively, compared to γ = 1.
Figure 8 presents the head curves as a function of γ at different flow rates. Since the design flow rate for each size ratio is calculated based on the equal head similarity law, the head curve does not exhibit a significant upward trend with increasing γ. At 0.8Qdes, 1.0Qdes, and 1.15Qdes, the head for γ = 10 increased by 2.3%, 5.6%, and 16.5%, respectively, compared to γ = 1. Figure 9 illustrates the efficiency curves as a function of γ across various flow rates. The efficiency exhibits a positive correlation with the size ratio, attributed to two primary factors: (1) the constant wall roughness results in a diminished wall viscosity effect as both the size and flow rate escalate, and (2) the impeller’s rotational speed declines with an increasing size ratio, thereby mitigating the centrifugal force effect. Nonetheless, the efficiency enhancement becomes less significant when γ surpasses 5. Specifically, at flow rates of 0.8 Qdes, 1.0 Qdes, and 1.15 Qdes, the efficiency for γ = 5 demonstrates increments of 2.3%, 4.7%, and 13.5%, respectively, relative to γ = 1. In contrast, the efficiency for γ = 10 only marginally improves by 0.7%, 1.3%, and 3.4% compared to γ = 5. This phenomenon is ascribed to the fact that augmenting the size elevates the operational flow rate of the axial flow pump, consequently attenuating both the centrifugal force effect and the wall effect.

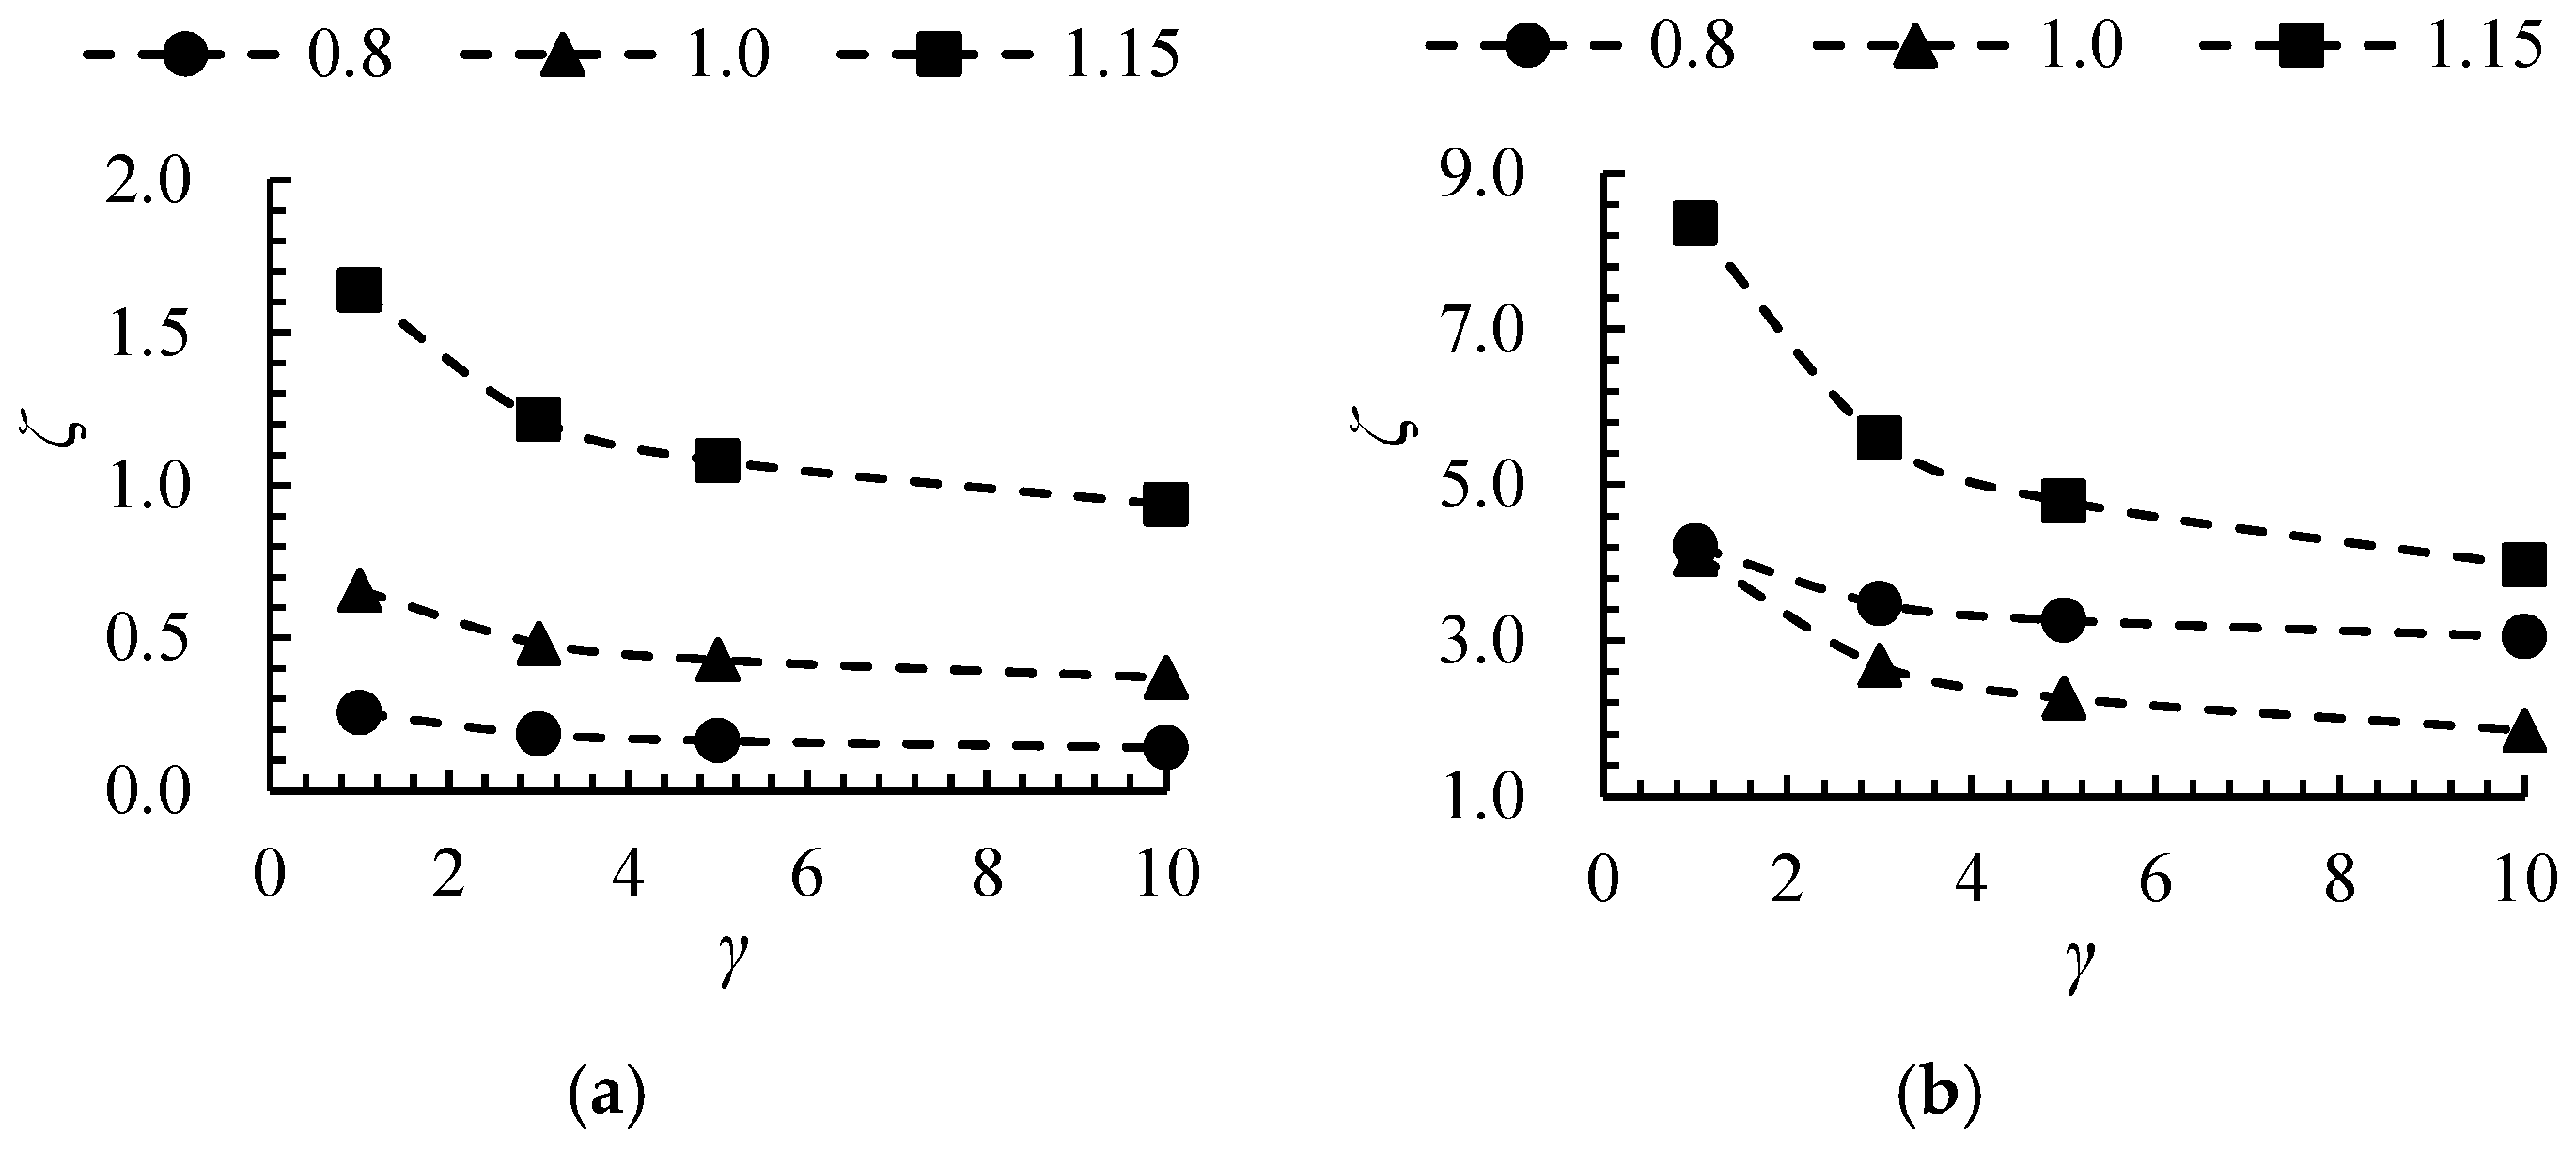
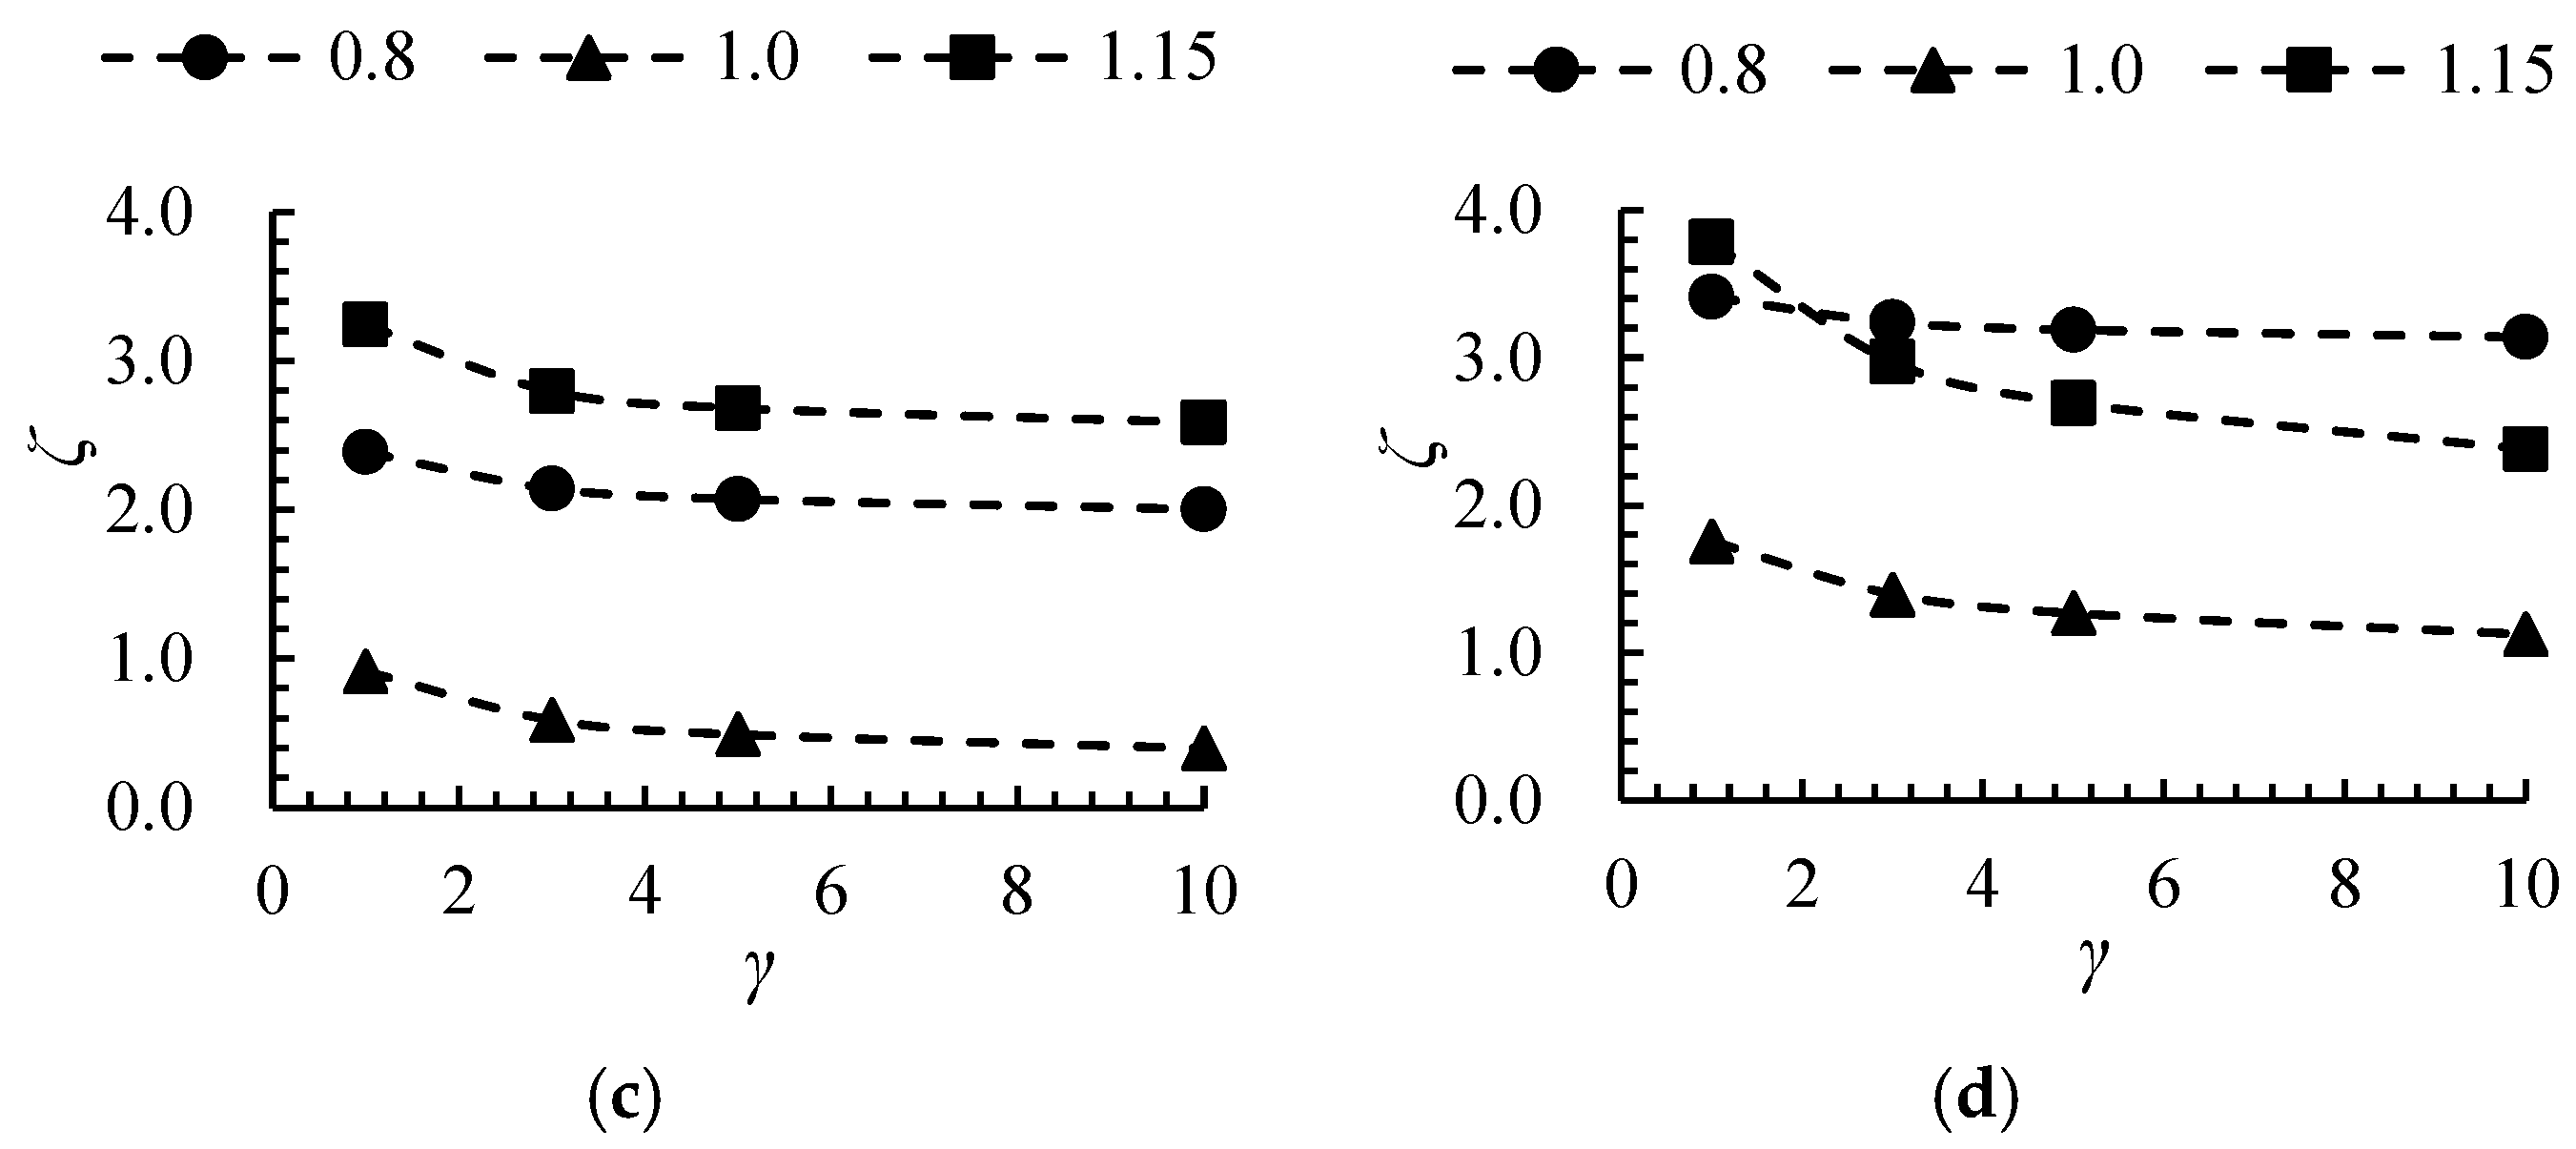
4.2. The Size Effect on Entropy Production

Figure 10 illustrates the distribution of the EPC across various hydraulic components as a function of the size ratio. As the size ratio increases, the EPC decreases uniformly across all components. Notably, the EPC within the impeller is substantially higher than in other components. Furthermore, the EPC inside the impeller reaches its minimum under the design flow condition, attributed to the optimal matching performance between the impeller outlet angle and the guide vane inlet angle at this flow rate. Specifically, at the design flow rate, the EPC for the impeller and guide vanes at γ = 10 decreased by 55.1% and 56.5%, respectively, compared to γ = 1. This significant reduction highlights that larger hydraulic components effectively mitigate losses associated with rotational kinetic energy and wall viscosity.
To analyze the radial distribution of the EPC within the impeller flow channel, the channel was divided into 10 cylindrical sections using 11 cylindrical surfaces, as shown in Figure 11. Figure 12 illustrates the radial distribution of the EPC within the impeller cylinder, revealing a trend where the EPC initially decreases and then increases from the hub towards the rim. This behavior is primarily driven by the leakage flow at the blade tip clearance and the wall effect near the hub, both of which contribute to higher EPC values in the regions adjacent to the hub and the rim. Specifically, for a size ratio = 1, the EPC growth rates for Cylinder 1 and Cylinder 10 are 138.6% and 1566.8%, respectively, when compared to Cylinder 2, highlighting the significant impact of these effects on energy loss distribution. As the size ratio increases, the EPC within each cylinder decreases, with the most significant reduction observed when γ increases from 1 to 3. For example, the EPC in cylinder 10 decreased by 78.21% when γ increased from 1 to 3, but only by 30.47% when γ increased from 3 to 10.
Similarly, the guide vane channel was divided into 10 cylindrical sections to study the radial distribution of EPC, as shown in Figure 13. Figure 14 shows that the EPC within the guide vane cylinders decreases and then increases along the radial direction, with the highest EPC observed near the rim due to high rotational kinetic energy and wall effects. Within cylinder 10, due to the increase in size ratio, the rotational kinetic energy and wall effect weaken, resulting in a decrease in the local entropy production coefficient as the size ratio increases. As the size ratio increases, the EPC decreases, with a 58.19% reduction observed for γ = 10 compared to γ = 1.

4.3. The Size Effect on Entropy Production Rate

Due to the high-EPC region being located at the impeller rim based on Figure 11, the cylindrical surface with a span = 0.95 was taken as the research object. The spatial distribution of the EPC inside the unfolded surface of the cylinder is shown in Figure 15. It can be seen that the EPRC with a size ratio of 1 is significantly higher than the other size ratios, and the high-local-EPRC region is located at the blade tip and trailing edge, mainly caused by the roughness of the blade surface wall and wake vortices. When the size ratio increases to 3, the area of high EPRC decreases sharply, and only a small area of high EPRC still exists at the trailing edge of the blade. As the size ratio continues to increase, the high EPRC inside the unfolded surface of the cylinder no longer exists. This phenomenon indicates that as the size of the axial flow pump increases, the wall effect and wake vortex intensity of the blades will significantly weaken.
Due to the viscosity of the blade wall, Figure 15 can only show the EPRC distribution of the blade surface at specific radial positions. Therefore, Figure 16 shows the EPRC distribution of the entire pressure side. As shown in the figure, the spatial distribution of the EPRC on the three blades is basically consistent, and their EPRC gradually decrease along the wheel rim towards the hub direction. As the size ratio increases, the EPRC on the entire pressure side will show a significant decrease. Among them, the trend of decreasing EPRC is most obvious when the size ratio increases from 1 to 3. This indicates that as the size ratio increases, the wall efficiency of the entire pressure side will decrease.
According to Figure 14, it can be seen that the EPC inside cylinder 10 is the highest. Therefore, the spatial distribution of the EPRC inside the cylinder surface with a span = 0.95 is shown in Figure 17. The primary function of the guide vanes is to convert the rotational kinetic energy of the inflow into compressive energy, though energy loss, quantified as the EPRC, is an inherent consequence of this process. As shown in the figure, at a size ratio of 1, the EPRC within the entire guide vane channel is relatively high, with only the region near the leading edge exhibiting lower values. However, when the size ratio increases to 3, the EPRC in the guide vane channel decreases significantly, leaving only a small area of high EPRC near the trailing edge due to the mixing of the trailing edge flow with the main flow. This trend indicates that an increase in the size ratio weakens the centrifugal force effect on the impeller, leading to a sharp reduction in the rotational kinetic energy of the inflow to the guide vanes. As the size ratio continues to rise, the rotational kinetic energy in the inflow further diminishes, and the area of the high-EPRC region gradually shrinks, with the high-EPC region virtually disappearing at a size ratio of 10.
Figure 18 shows the distribution of EPRC on the back of the guide vane. From the figure, it can be seen that the distribution of EPRC on the suction side of the five guide vanes is similar. Due to the role of the guide vanes in converting rotational kinetic energy into static pressure energy, the rotational kinetic energy of the internal fluid and the impact force on the guide vane surface gradually decrease along the axial direction, resulting in a gradual decrease in the EPRC of the guide vane surface along the leading edge and trailing edge of the flow channel. Moreover, an increase in the size ratio also attenuates the centrifugal force effect exerted by the impeller, leading to a reduction in the rotational kinetic energy of the fluid within the guide vanes. As the size ratio increases, the EPRC on the entire suction side of the guide vanes exhibits a corresponding decrease.

5. Conclusions

This study designs four hydraulic models with size ratios of 1 (original scheme), 3, 5, and 10 based on the equal head similarity law. Using RANS equations, the external characteristic parameters and internal flow field structures are predicted, and the spatial distribution of hydraulic losses is analyzed using entropy production theory. The main conclusions are as follows:
(1)
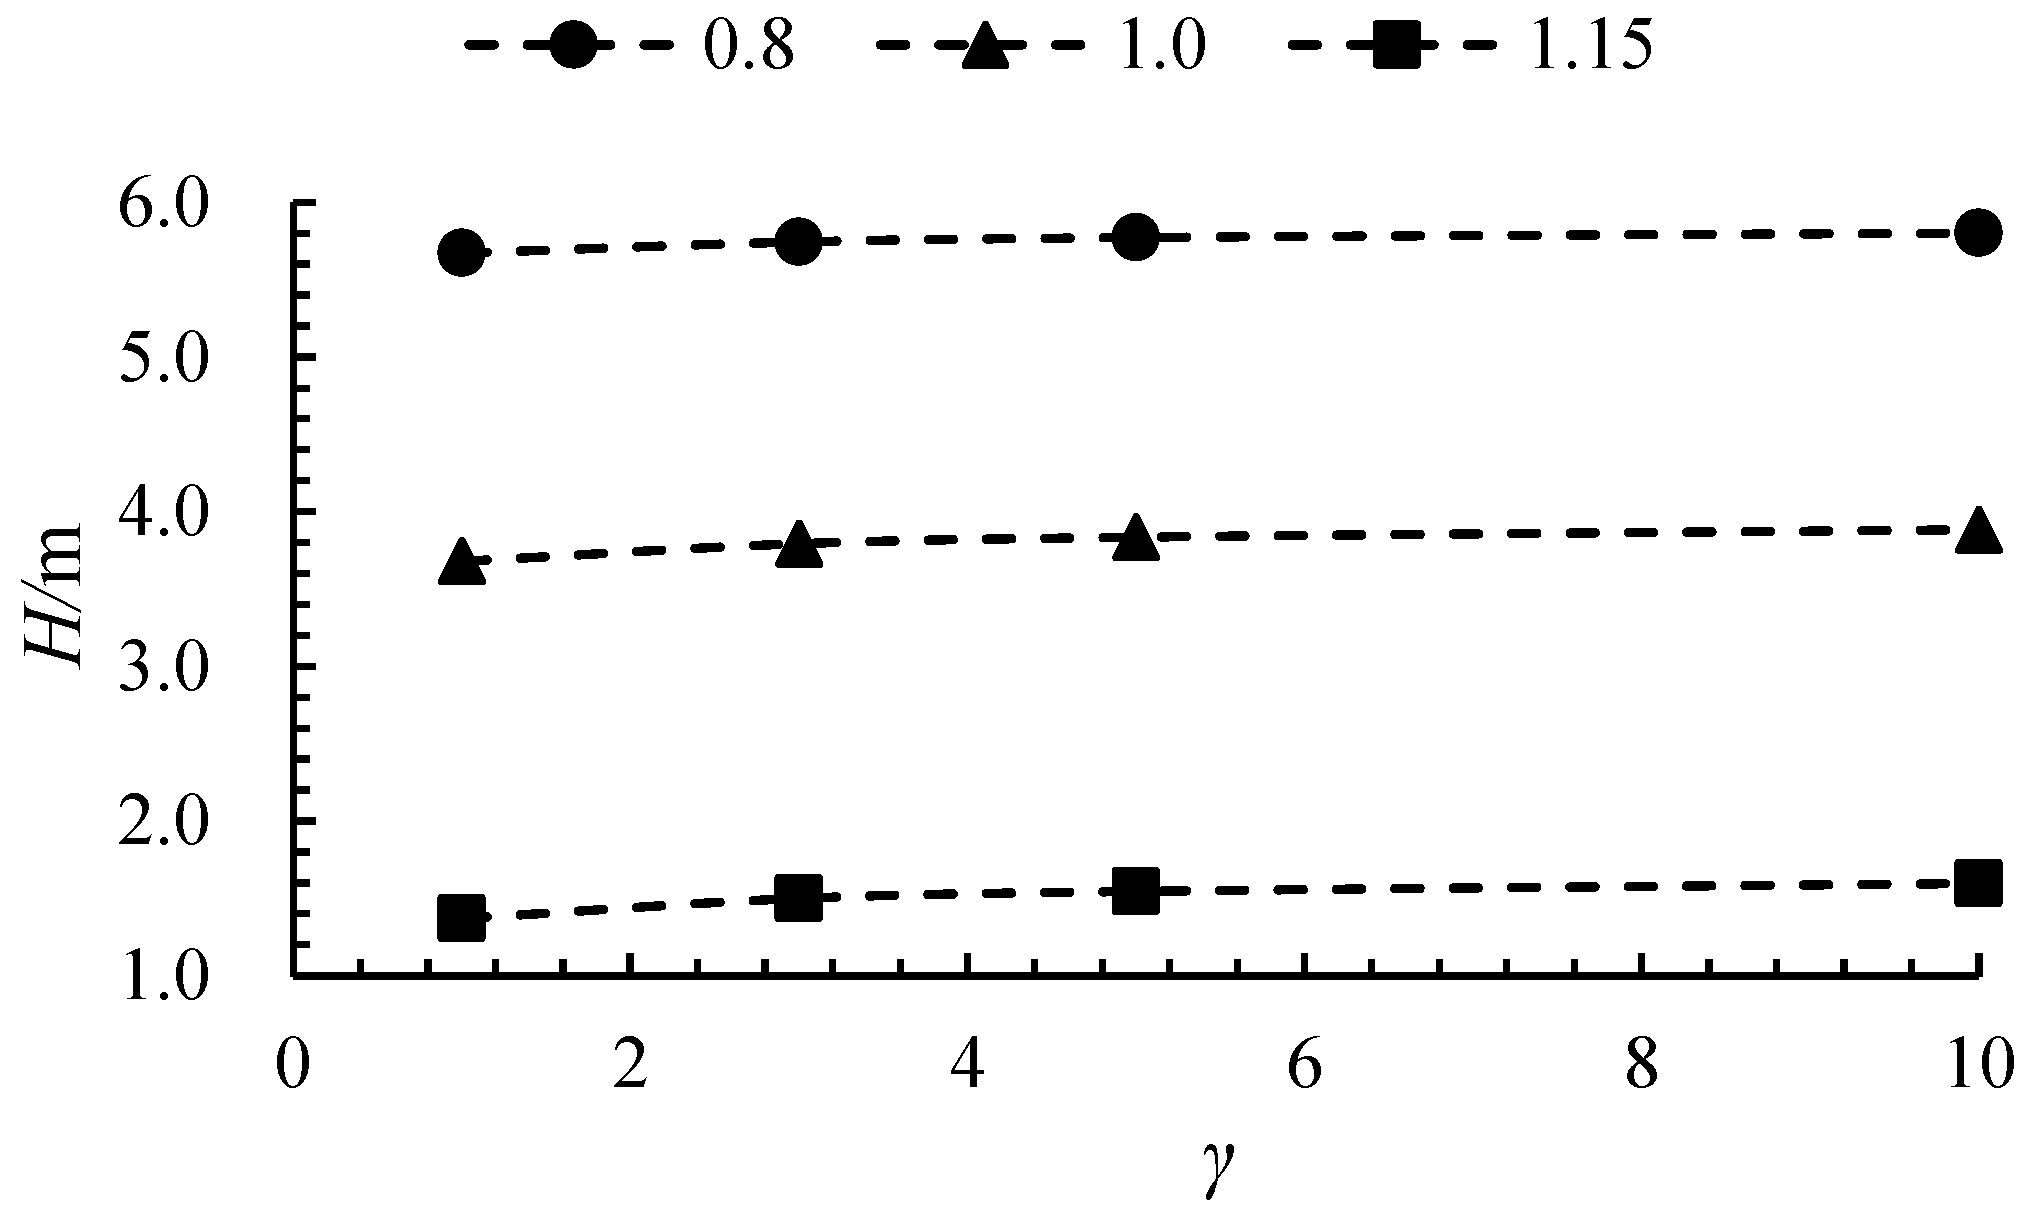
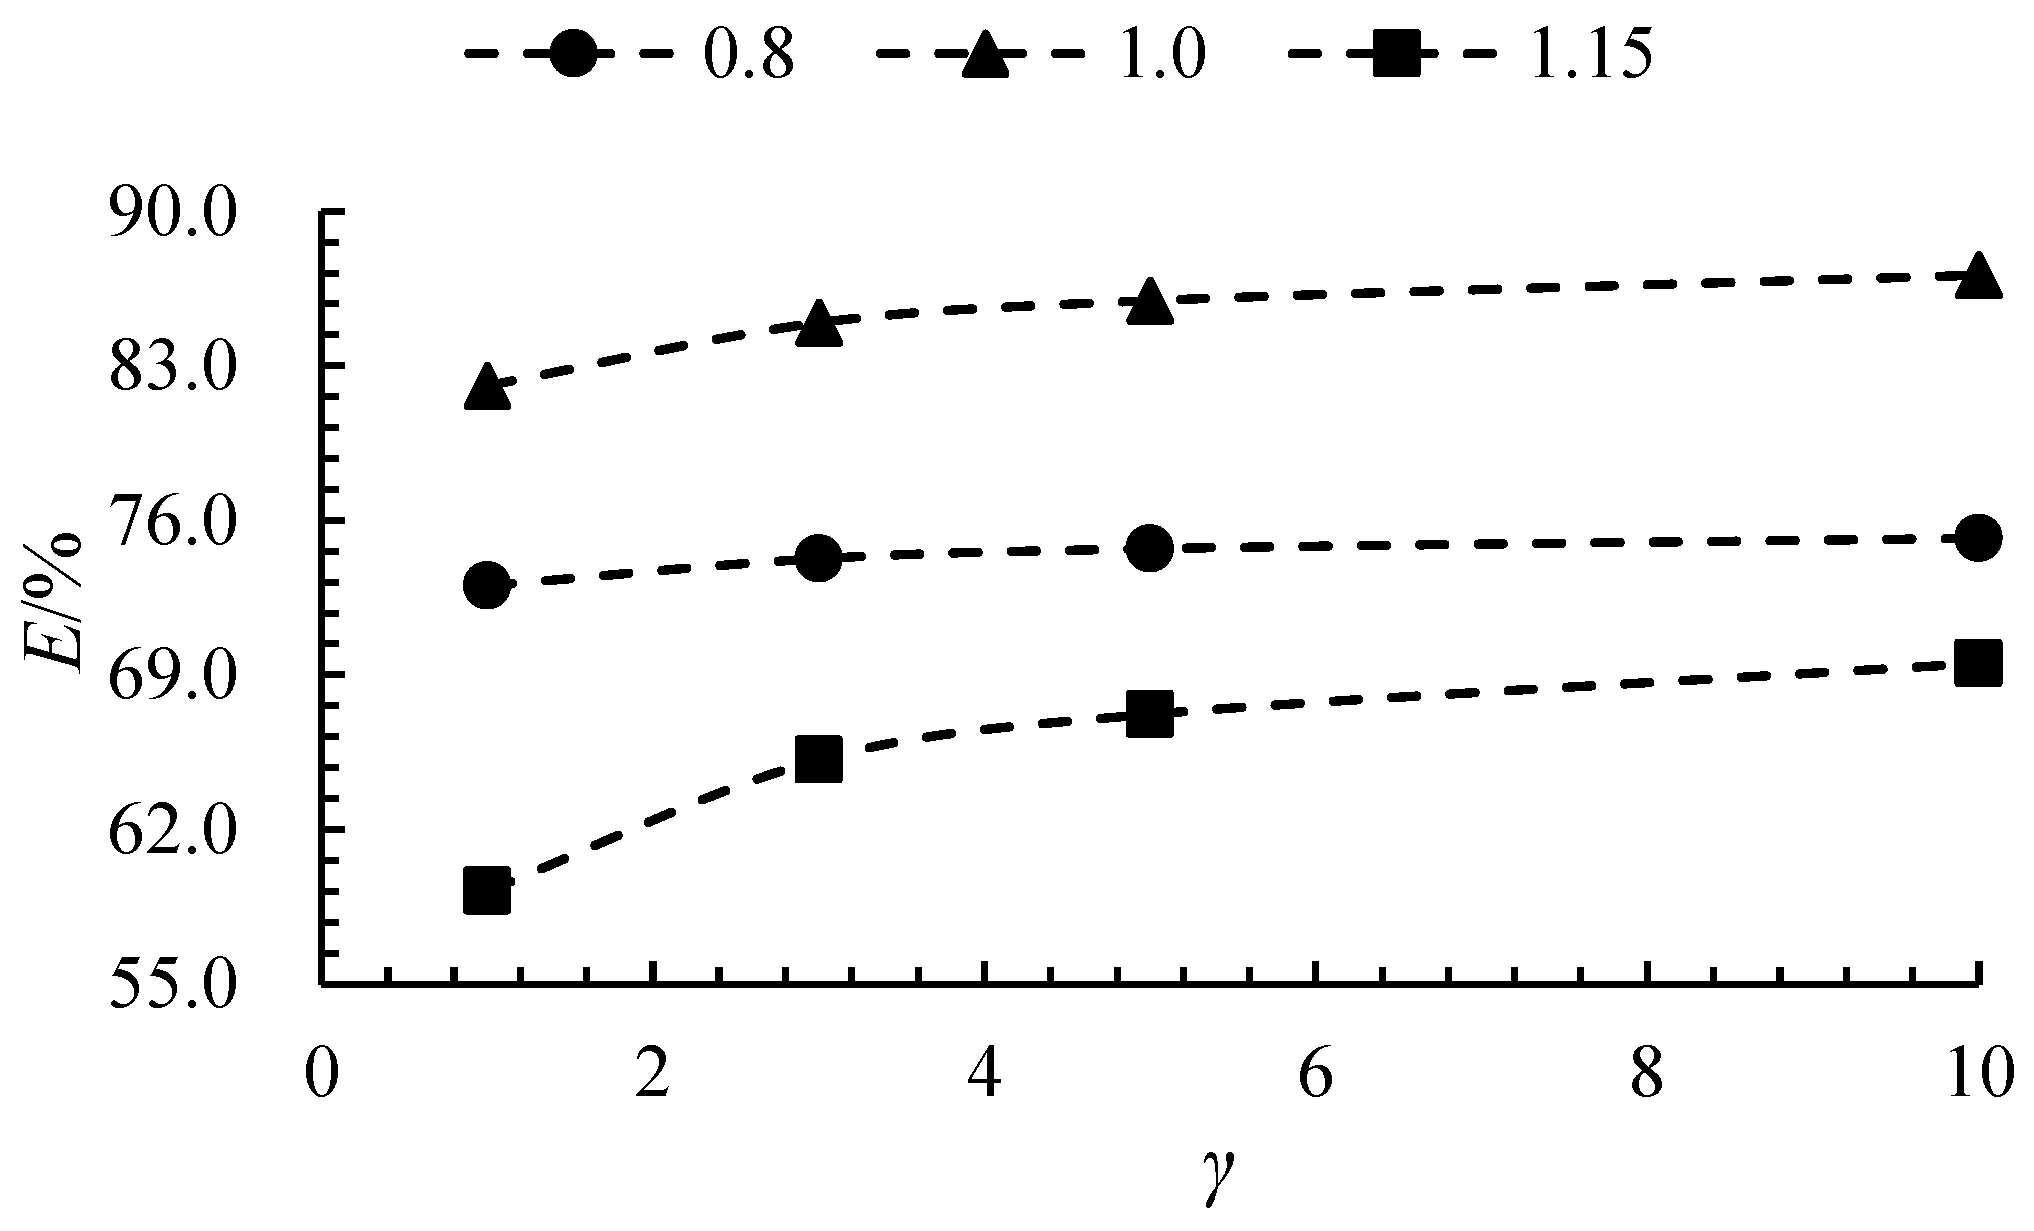
The efficiency of axial flow pumps increases with the size ratio, while the head shows a less pronounced upward trend. The efficiency increase is most significant when γ increases from 1 to 5, after which it stabilizes. At 0.8 Qdes, 1.0 Qdes, and 1.15 Qdes, the efficiency for γ = 10 increased by 2.95%, 6.1%, and 17.4%, respectively, compared to γ = 1.
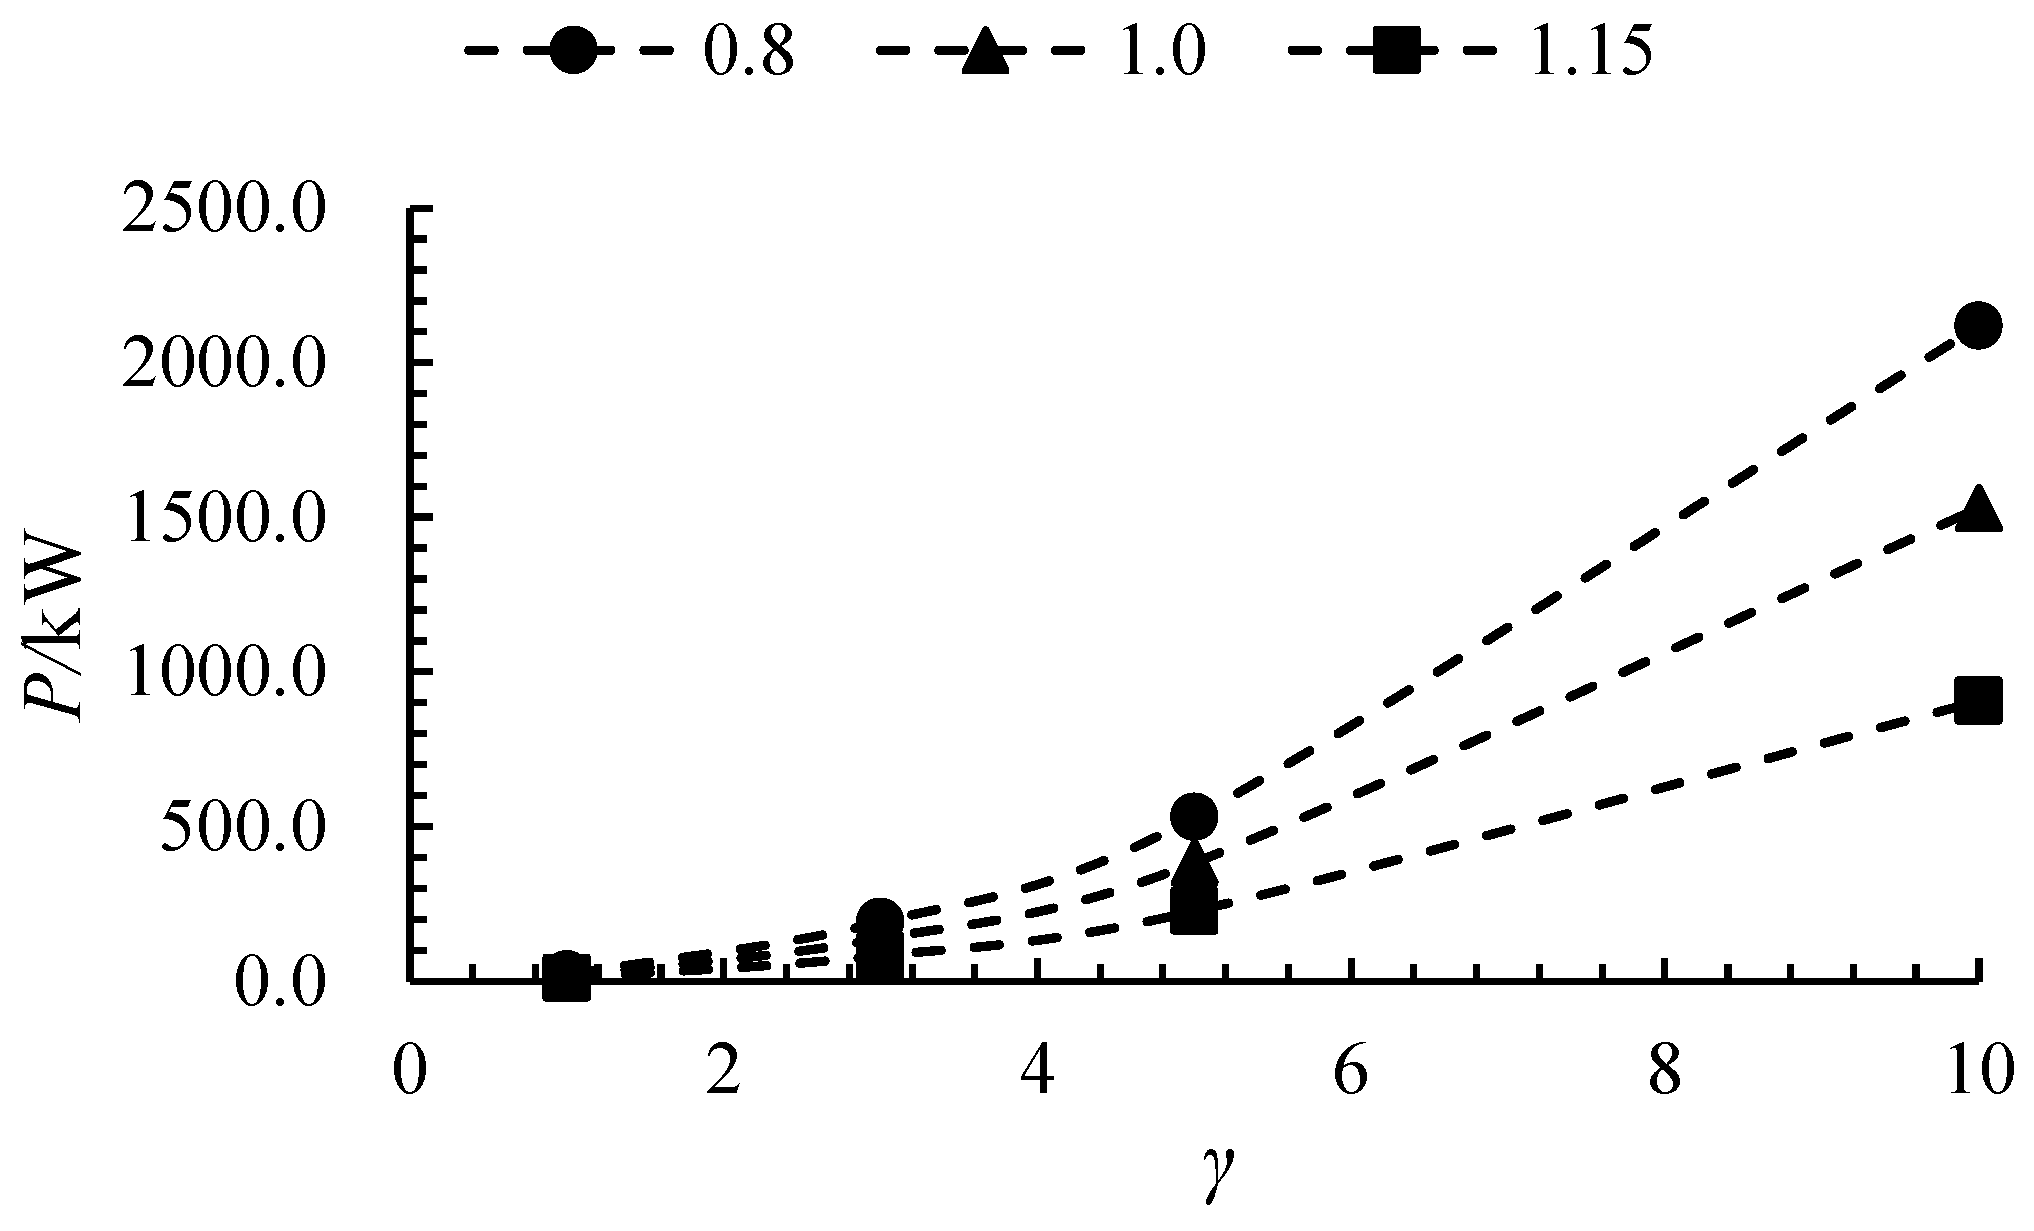
(2)
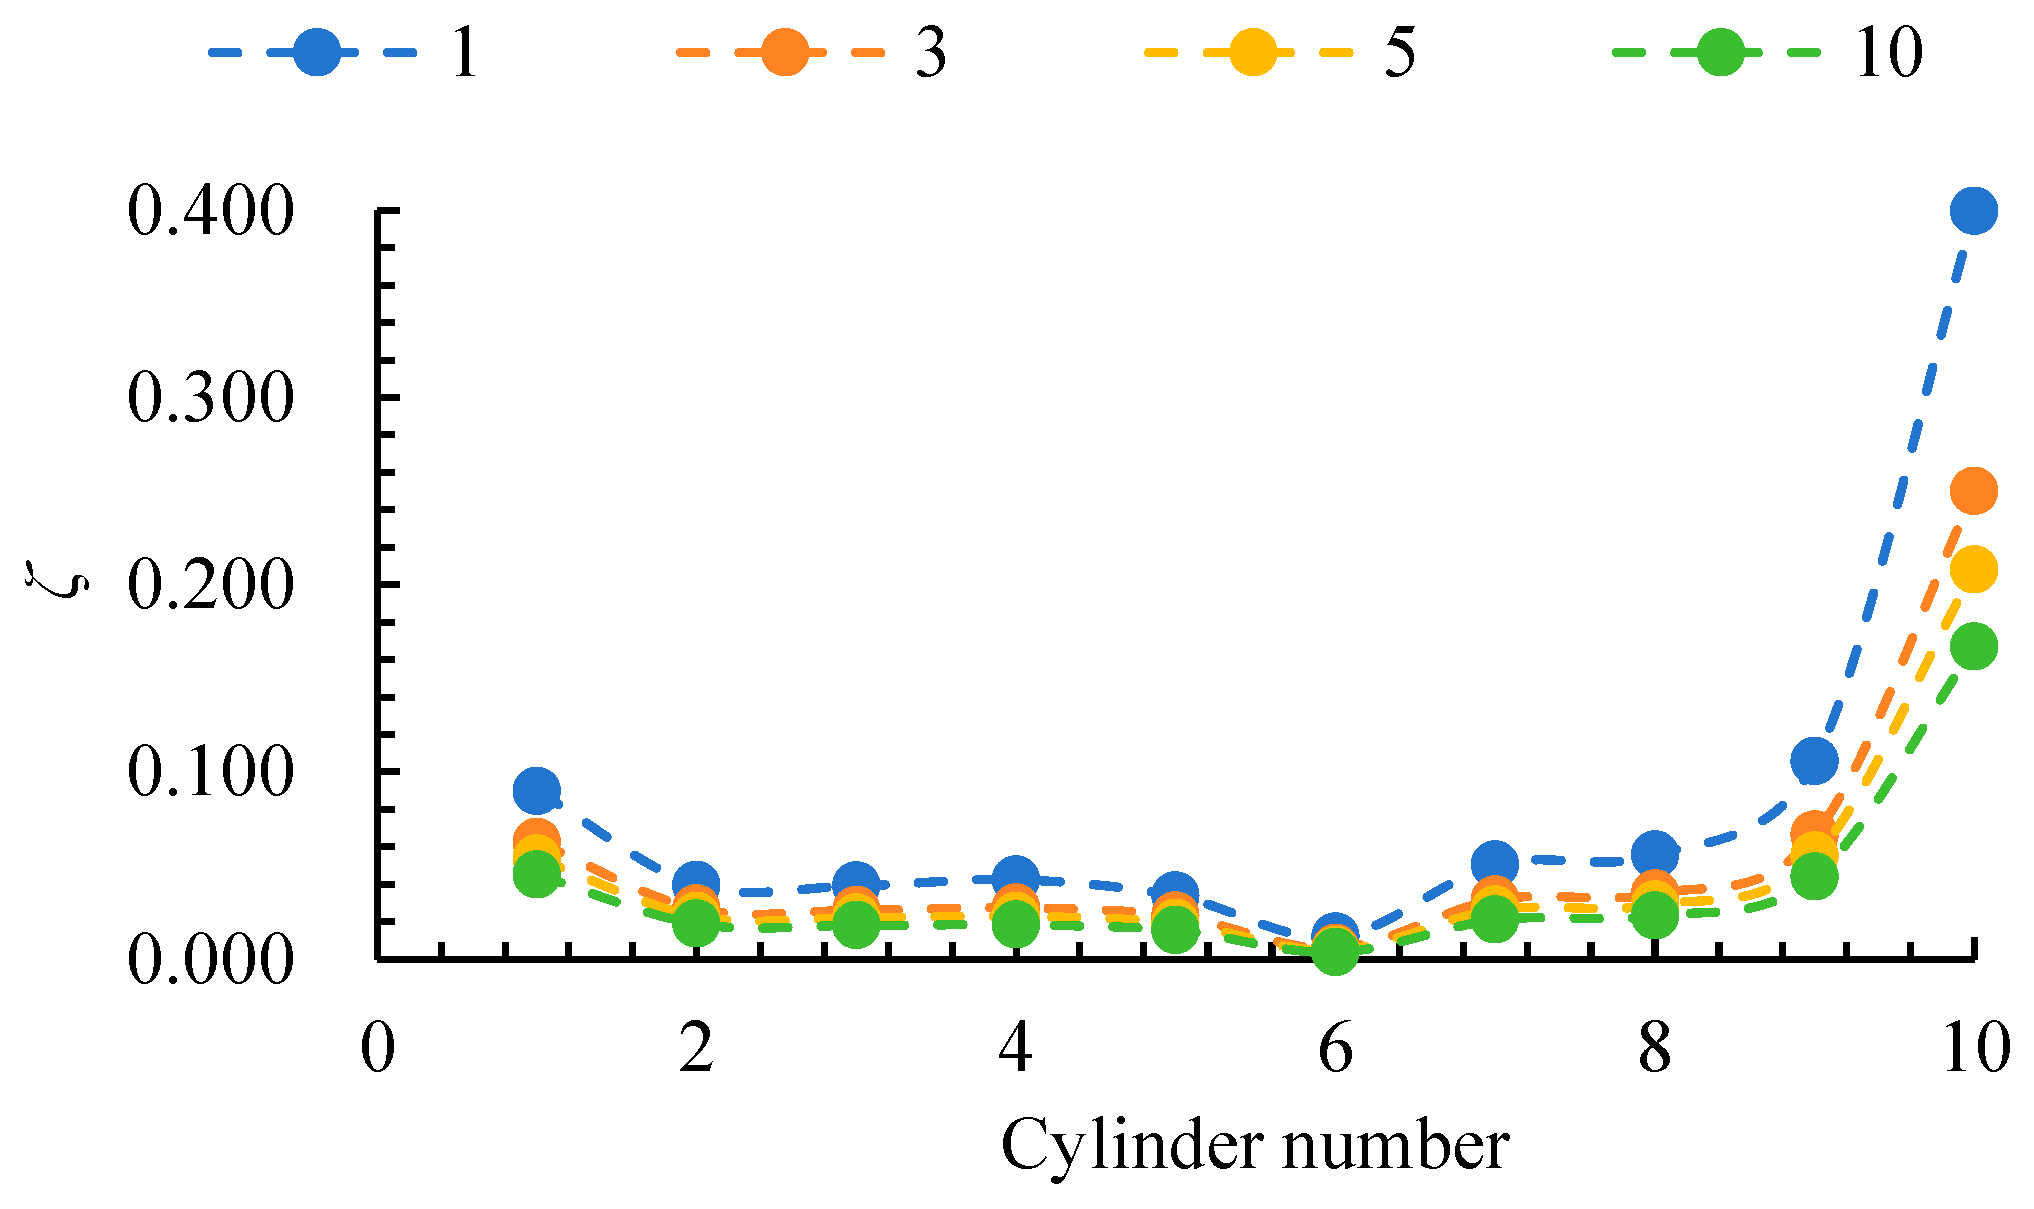
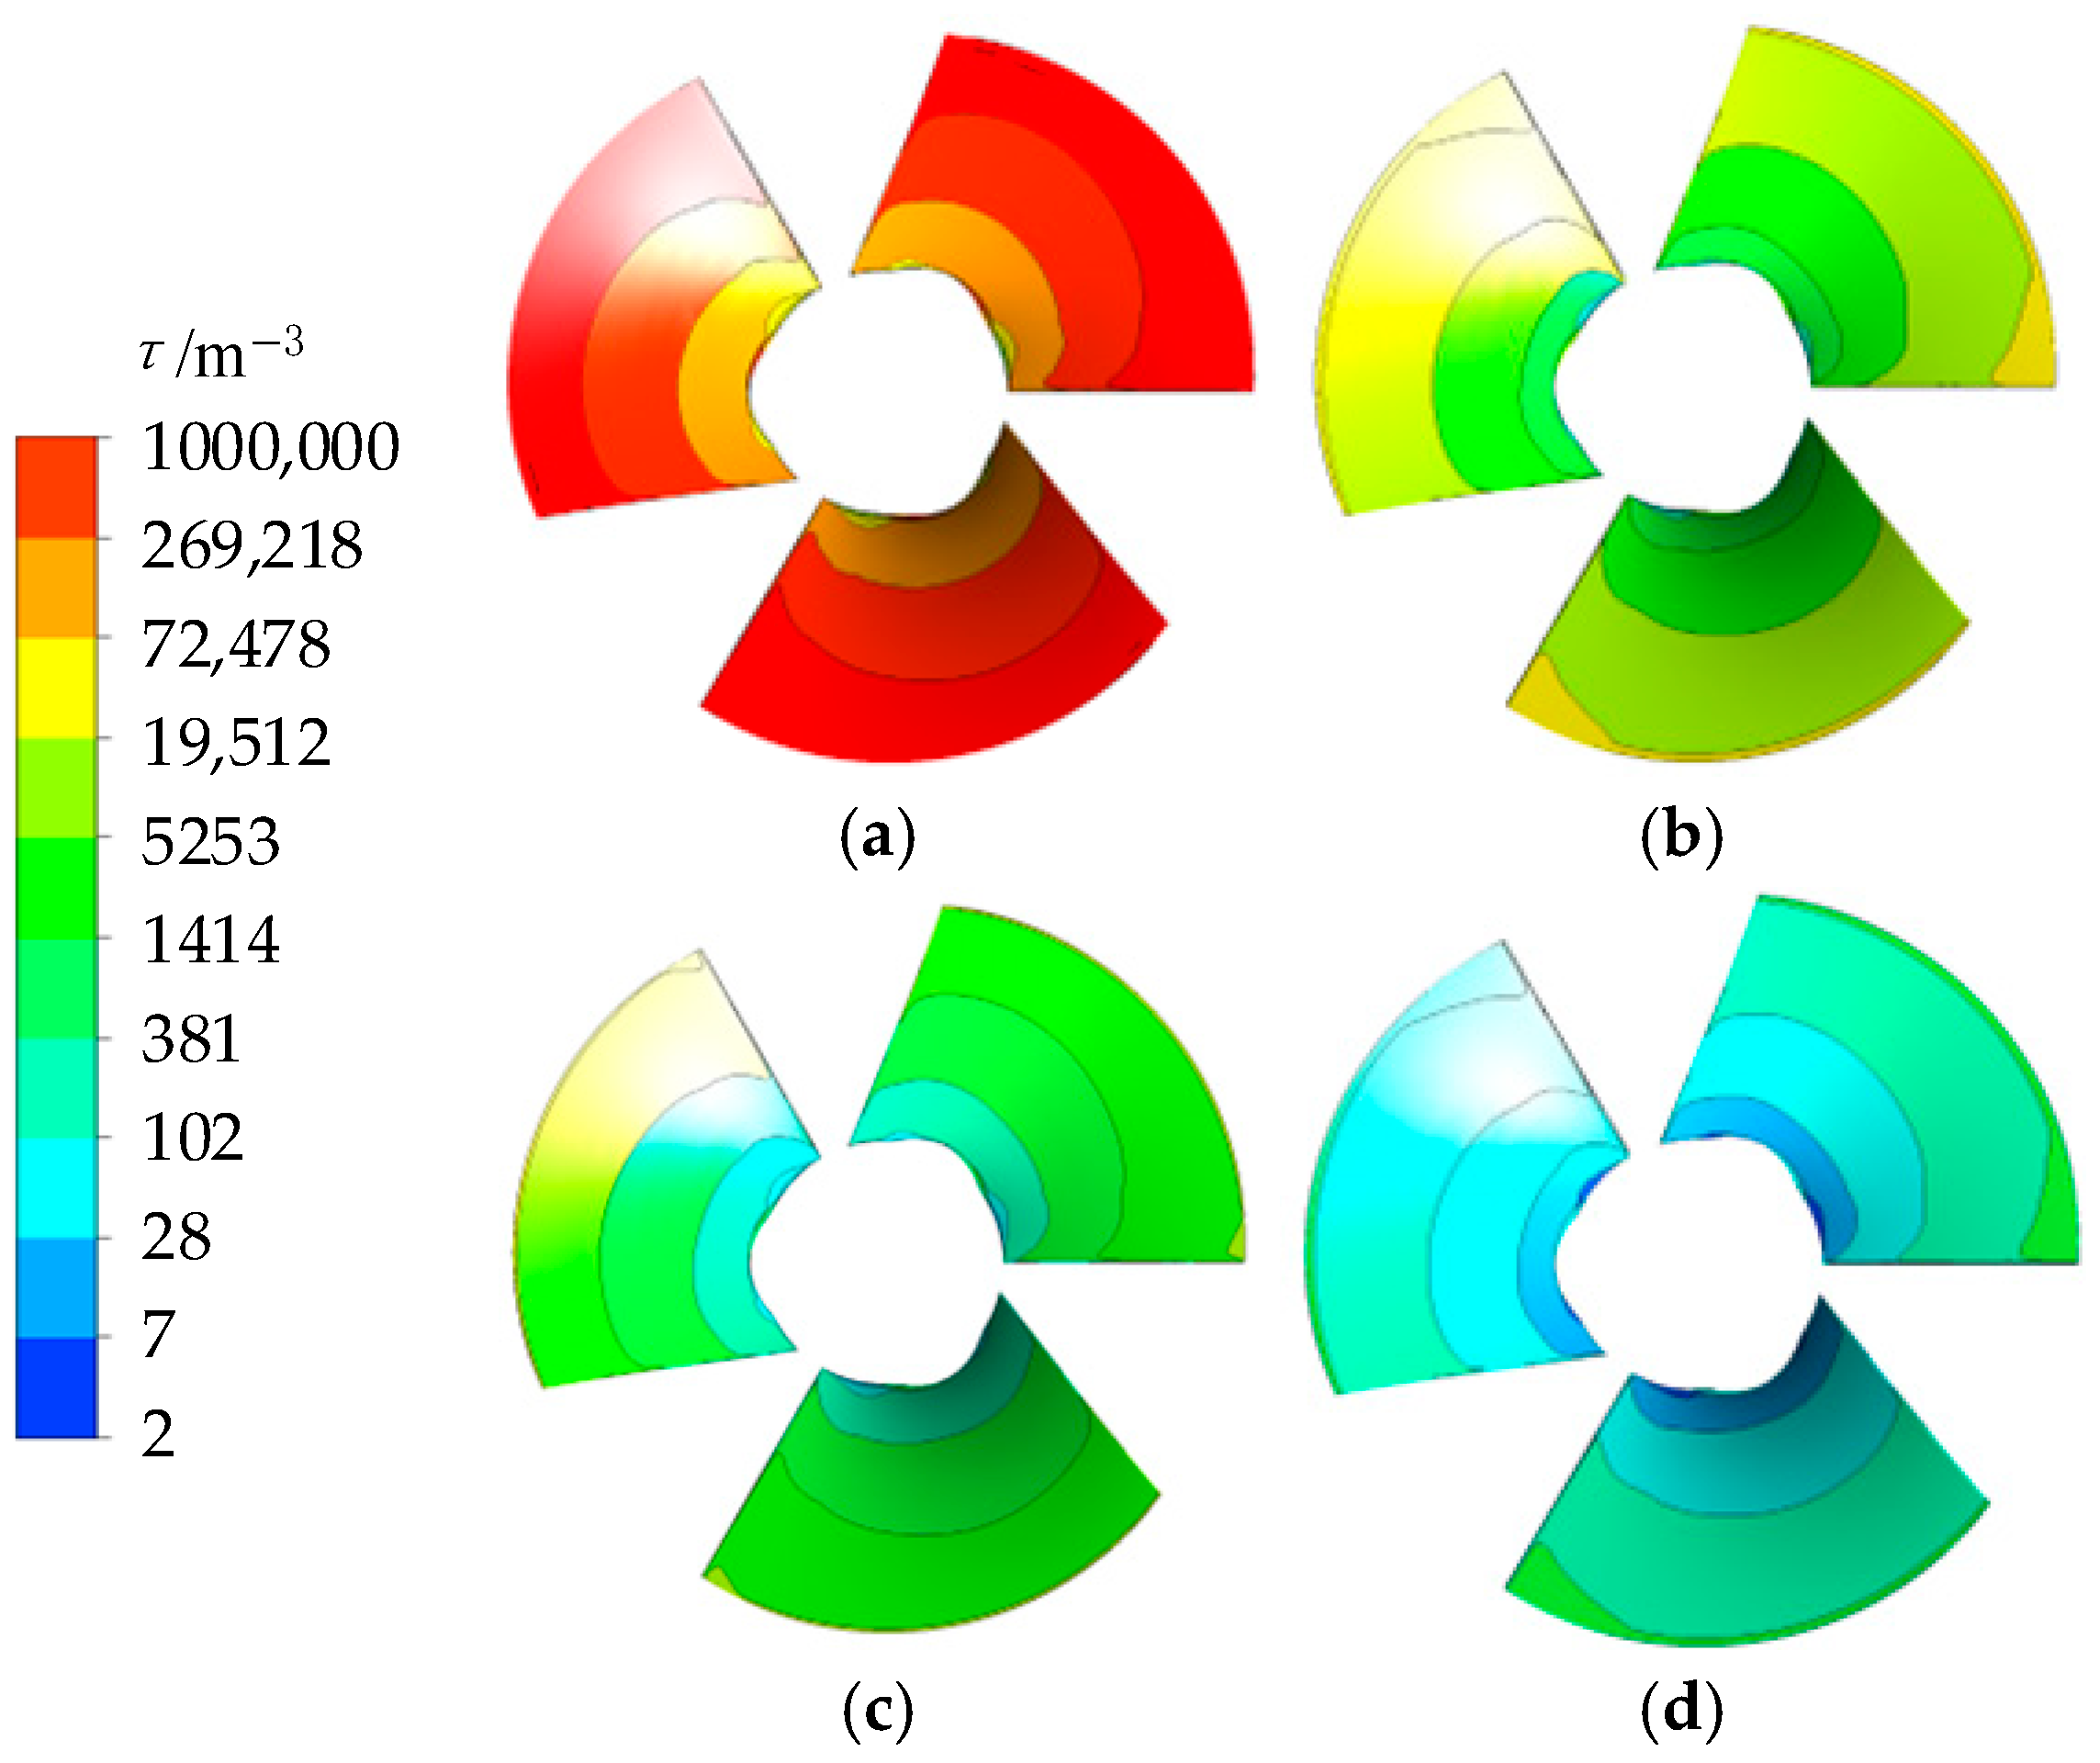
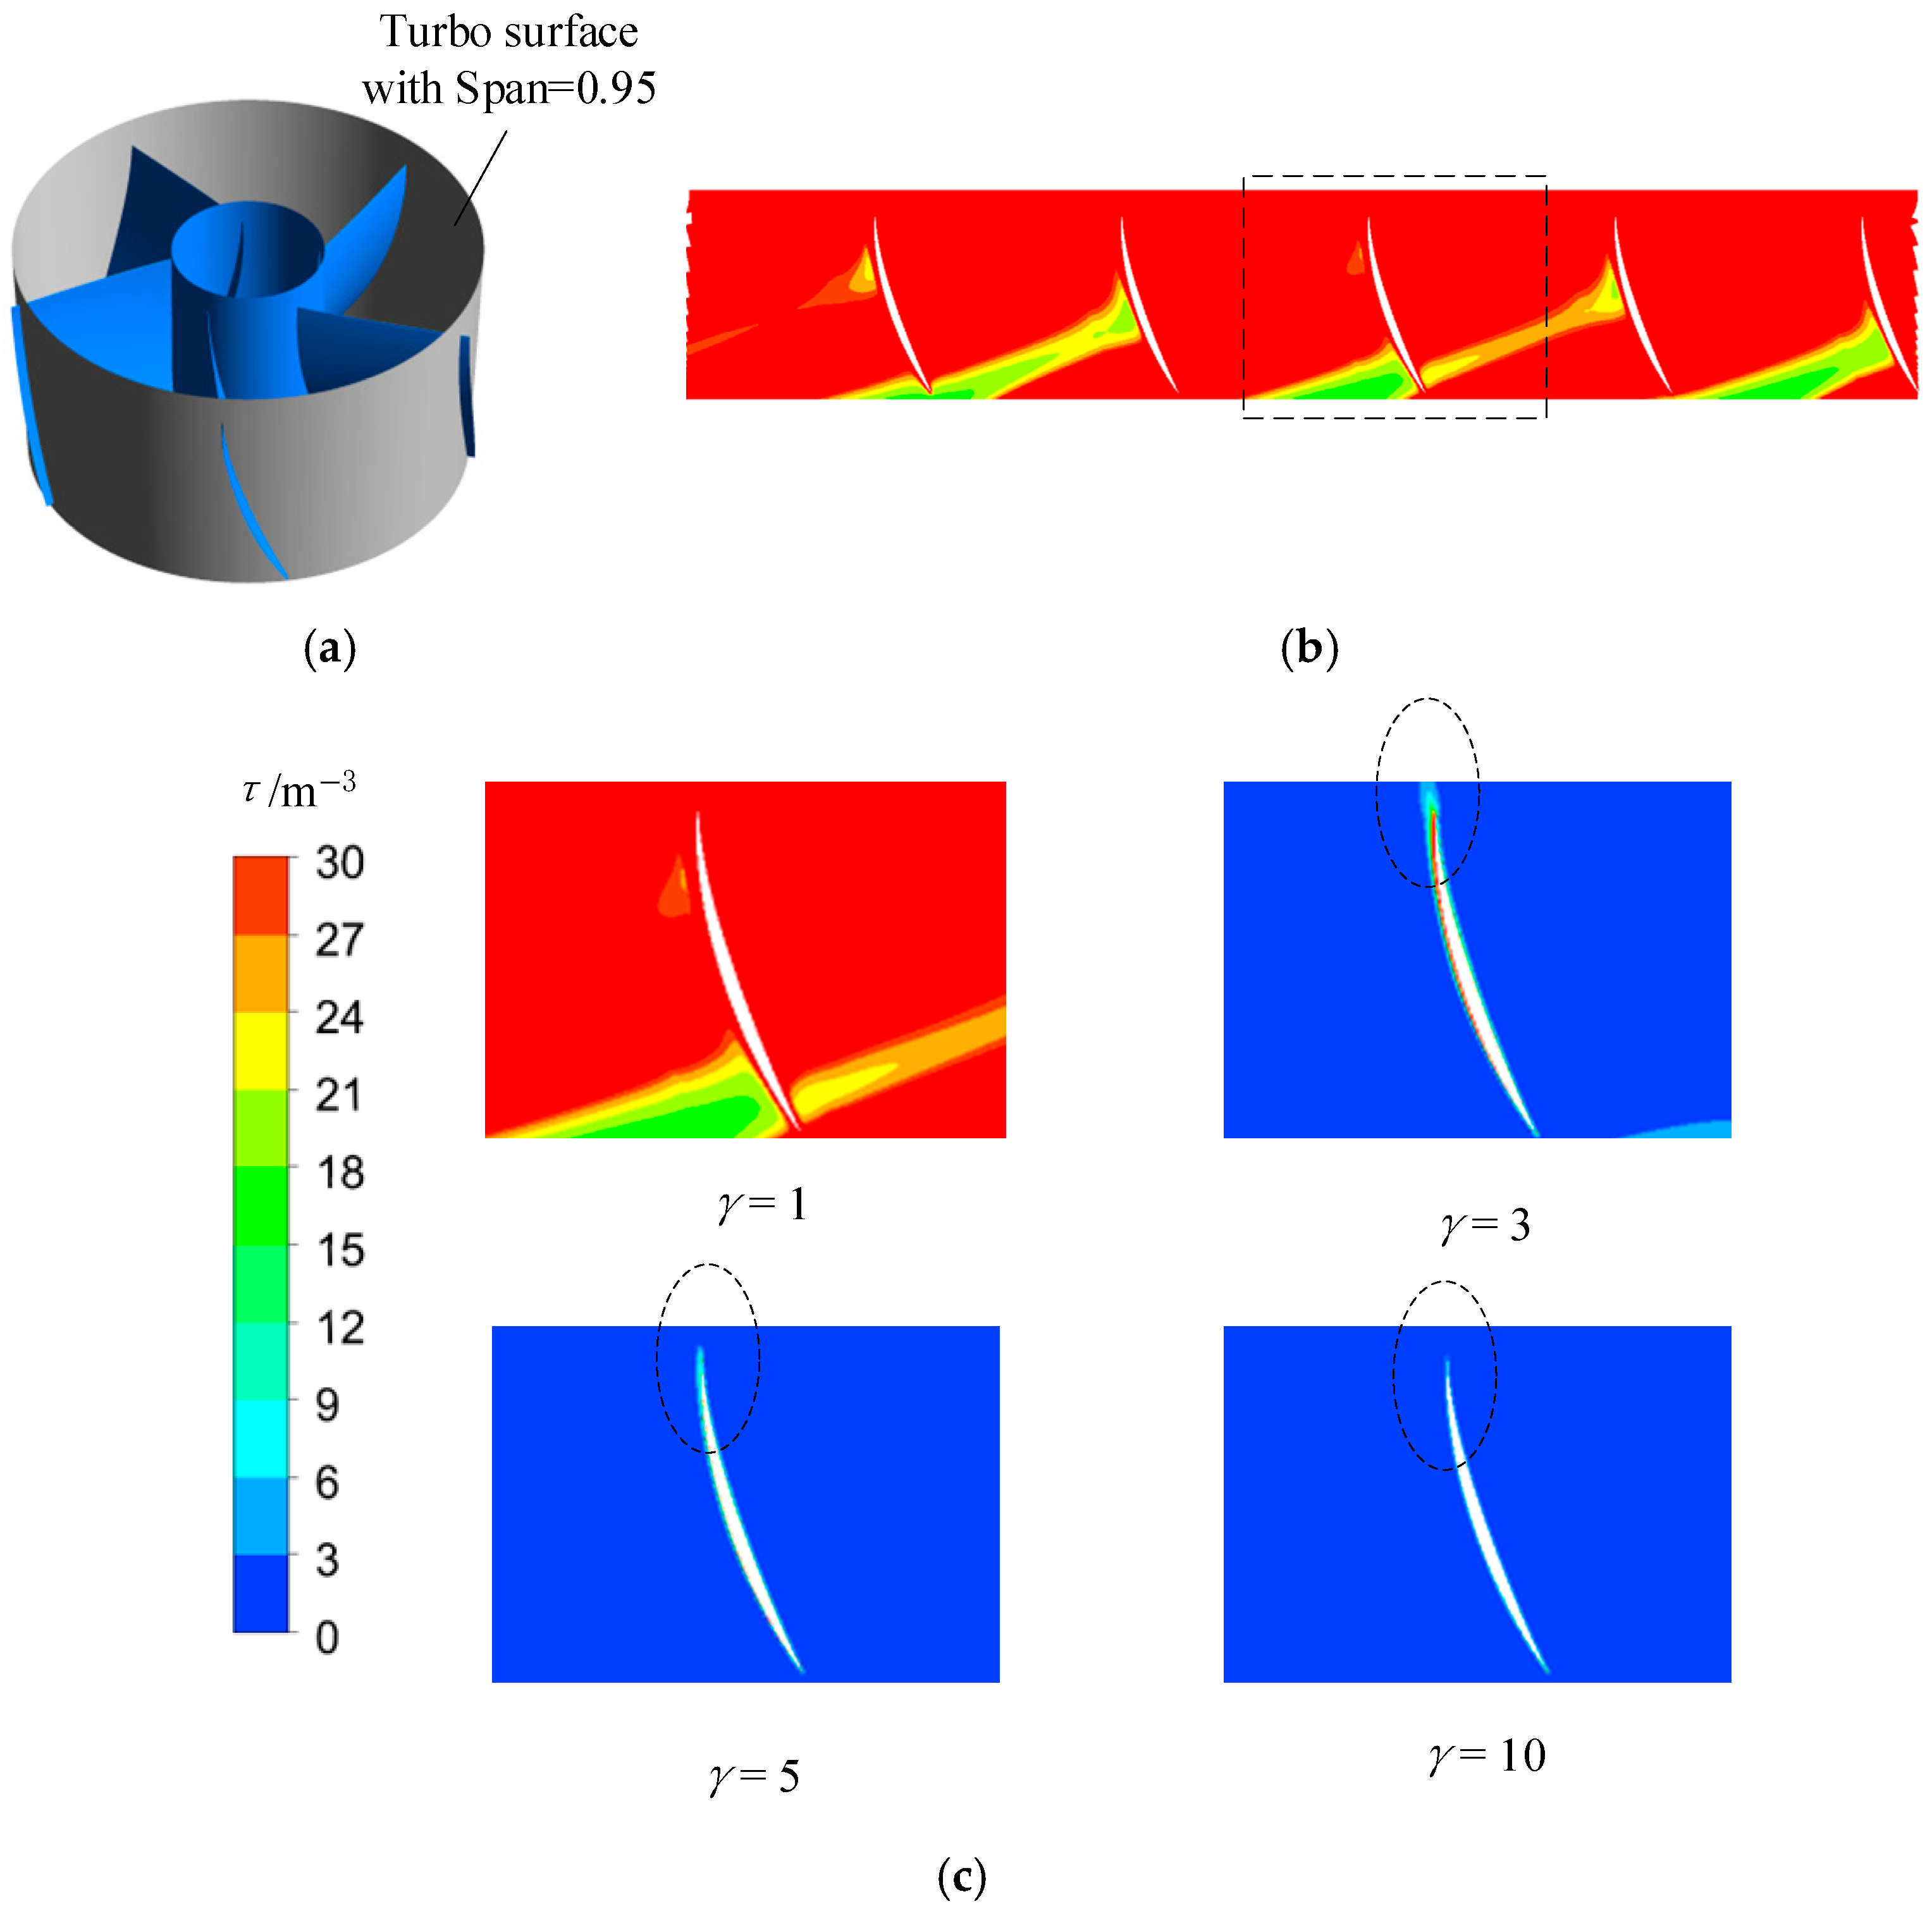
As the size ratio increases, the EPC of all hydraulic components demonstrates a consistent downward trend, with the impeller exhibiting the most pronounced reduction. At the design flow rate, the EPC of the impeller decreased by 55.1% at γ = 10 compared to γ = 1. Furthermore, the EPC inside the impeller increases rapidly in the radial direction from the hub to the rim, with the maximum flow near the rim primarily attributed to tip leakage. Notably, when γ = 10, the EPC near the rim of the impeller decreased by 84.85% compared to γ = 1.
(3)
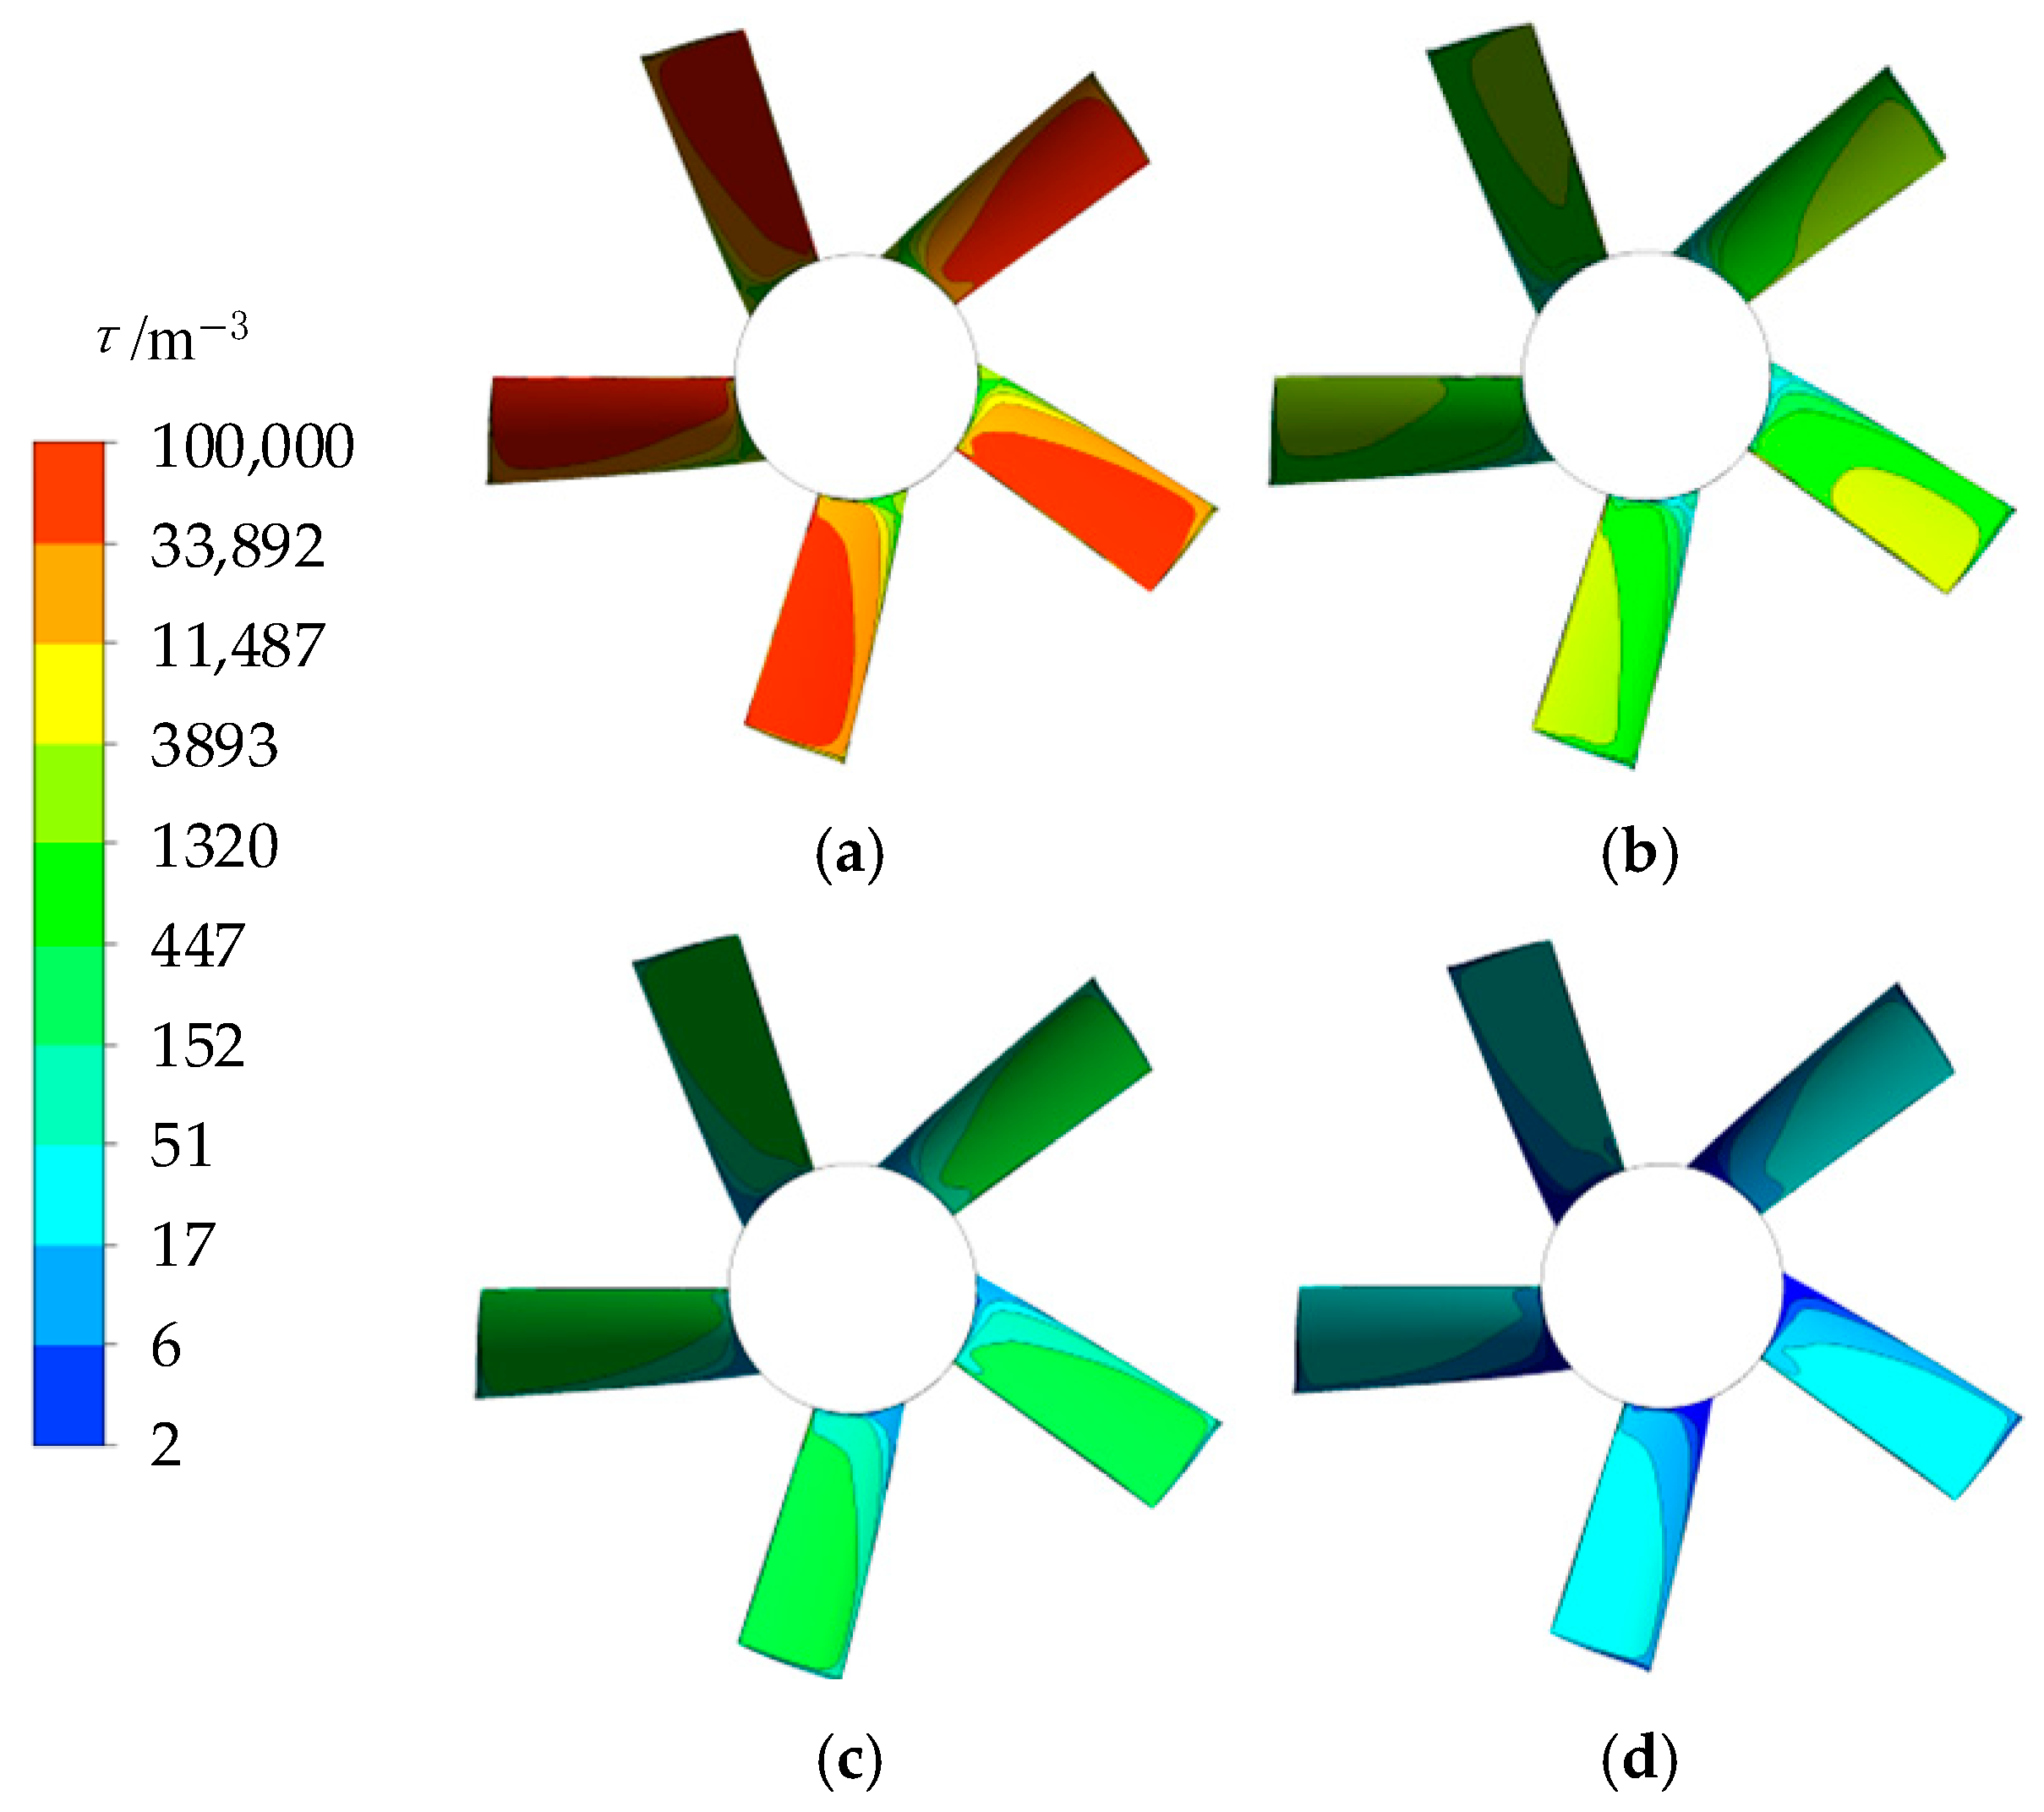
Due to the wall effect, the EPEC near the edges of the impeller and guide vanes is significantly higher. As the size ratio increases, the rotational speed of the impeller decreases, thereby weakening the centrifugal force effect. Consequently, this leads to a sharp reduction in the EPC within the high-EPC regions near the blade leading edge and the guide vane area.
These findings indicate that engineers can consider appropriately increasing the pump size to enhance overall efficiency while ensuring that flow and head requirements are met during the selection process. Additionally, during the design of impellers, particular emphasis should be placed on optimizing the rim region to minimize energy losses in this critical area. Future work could investigate the influence of size ratio on the cavitation performance of pumps, with a focus on exploring the evolution of internal cavitation bubbles under varying size ratios.

Author Contributions

Conceptualization, H.W. and X.W.; methodology, H.W. and X.X.; software, H.W., S.B. and F.M.; validation, H.W., S.B. and F.M.; formal analysis, H.W. and F.M.; investigation, H.W. and X.W.; resources, H.W. and X.X.; data curation, H.W. and X.W.; writing—original draft preparation, H.W. and X.X.; writing—review and editing, H.W., X.W. and S.B.; visualization, H.W.; supervision, H.W.; project administration, X.W.; funding acquisition, H.W. All authors have read and agreed to the published version of the manuscript.

Funding

This research was funded by Changzhou Science and Technology Project (grant number CJ20235074), National Natural Science Foundation of China (grant number 52009013) and the Basic Science (Natural Science) Research Project of Higher Education Institutions in Jiangsu Province (grant number 22KJA470001).

Data Availability Statement

The raw data supporting the conclusions of this article will be made available by the authors on request.

Conflicts of Interest

Author Xiao Xu was employed by the Shimge Pump Industry (Zhejiang) Co., Ltd. The remaining authors declare that the research was conducted in the absence of any commercial or financial relationships that could be construed as a potential conflict of interest.

Nomenclature

The following nomenclature are used in this manuscript:
nRotation speed
QdesDesign flow rate
nsSpecific rotational speed
EEfficiency
HHead
PInput power
TTemperature
ρ Density
s ¯ Time-averaged entropy production
s Fluctuation component of entropy production
v i ¯ Time-averaged velocity components directions of i (x, y, and z) for the Cartesian coordinate system
v i Velocity fluctuation components in the direction of i (x, y, and z) for the Cartesian coordinate system
ε Turbulent dissipation rate
S Pr o , I Entropy production rate induced by indirect dissipation
S Pr o , D Entropy production rate induced by direct dissipation
S Pr o , T Overall entropy production
S Pr o , T Overall entropy production rate
ζ Entropy production coefficient
τ Entropy production rate coefficient
URANSUsteady Reynolds-averaged Navier–Stokes
EXPExperiment
CFDComputational fluid dynamics
EPCEntropy production coefficient
EPRCEntropy production rate coefficient

References

  1. Zhang, D.; Shi, W.; Bin, C.; Guan, X. Unsteady flow analysis and experimental investigation of axial-flow pump. J. Hydrodyn. Ser. B 2010, 22, 35–43. [Google Scholar] [CrossRef]
  2. Shuai, Z.J.; Li, W.Y.; Zhang, X.Y.; Jiang, C.X.; Li, F.C. Numerical study on the characteristics of pressure fluctuations in an axial-flow water pump. Adv. Mech. Eng. 2014, 6, 565061. [Google Scholar] [CrossRef]
  3. Feng, J.; Luo, X.; Guo, P.; Wu, G. Influence of tip clearance on pressure fluctuations in an axial flow pump. J. Mech. Sci. Technol. 2016, 30, 1603–1610. [Google Scholar] [CrossRef]
  4. Zhang, X.; Tang, F. Investigation on hydrodynamic characteristics of coastal axial flow pump system model under full working condition of forward rotation based on experiment and CFD method. Ocean Eng. 2022, 253, 111286. [Google Scholar] [CrossRef]
  5. Kan, N.; Liu, Z.; Shi, G.; Liu, X. Effect of tip clearance on helico-axial flow pump performance at off-design case. Processes 2021, 9, 1653. [Google Scholar] [CrossRef]
  6. Ge, M.; Petkovšek, M.; Zhang, G.; Jacobs, D.; Coutier-Delgosha, O. Cavitation dynamics and thermodynamic effects at elevated temperatures in a small Venturi channel. Int. J. Heat Mass Transf. 2021, 170, 120970. [Google Scholar] [CrossRef]
  7. Ge, M.; Manikkam, P.; Ghossein, J.; Subramanian, R.K.; Coutier-Delgosha, O.; Zhang, G. Dynamic mode decomposition to classify cavitating flow regimes induced by thermodynamic effects. Energy 2022, 254, 124426. [Google Scholar] [CrossRef]
  8. Pan, Y.; Chen, A.H.; Wang, Z.N. Fluid Dynamic Characteristics and Flow Distribution Structure Optimization of Axial Piston Pump Considering Cavitation Bubble Evolution. J. Appl. Fluid Mech. 2021, 14, 1603–1616. [Google Scholar]
  9. Guo, Y.; Yang, C.; Wang, Y.; Lv, T.; Zhao, S. Study on inlet flow field structure and end-wall effect of axial flow pump impeller under design condition. Energies 2022, 15, 4969. [Google Scholar] [CrossRef]
  10. Shi, L.; Zhu, J.; Wang, L.; Chu, S.; Tang, F.; Jin, Y. Comparative analysis of strength and modal characteristics of a full tubular pump and an axial flow pump impellers based on fluid-structure interaction. Energies 2021, 14, 6395. [Google Scholar] [CrossRef]
  11. Shi, L.; Yuan, Y.; Jiao, H.; Tang, F.; Cheng, L.; Yang, F.; Jin, Y.; Zhu, J. Numerical investigation and experiment on pressure pulsation characteristics in a full tubular pump. Renew. Energy 2021, 163, 987–1000. [Google Scholar] [CrossRef]
  12. Jiao, H.; Shan, J.; Yang, G.; Wang, M.; Chen, S. Comparison of the shutdown transitions of the full-flow pump and axial-flow pump. J. Mar. Sci. Eng. 2023, 11, 2129. [Google Scholar] [CrossRef]
  13. Kock, F.; Herwig, H. Local entropy production in turbulent shear flows: A high-Reynolds number model with wall functions. Int. J. Heat Mass Transf. 2004, 47, 2205–2215. [Google Scholar] [CrossRef]
  14. Kock, F.; Herwig, H. Entropy production calculation for turbulent shear flows and their implementation in CFD codes. Int. J. Heat Fluid Flow 2005, 26, 672–680. [Google Scholar] [CrossRef]
  15. Herwig, H.; Kock, F. Direct and indirect methods of calculating entropy generation rates in turbulent convective heat transfer problems. Heat Mass Transf. 2007, 43, 207–215. [Google Scholar] [CrossRef]
  16. Liu, H.; Mao, Y.; Wang, Y.; Wang, X.; Jiang, L.; Li, M. Energy characteristic of cavitation in a centrifugal pump based on entropy generation analysis. J. Braz. Soc. Mech. Sci. Eng. 2024, 46, 609. [Google Scholar] [CrossRef]
  17. Pei, J.; Shen, J.; Wang, W.; Yuan, S.; Zhao, J. Evaluating hydraulic dissipation in a reversible mixed-flow pump for micro-pumped hydro storage based on entropy production theory. Renew. Energy 2024, 225, 120271. [Google Scholar] [CrossRef]
  18. Yu, A.; Tang, Y.; Liang, J.; Chen, P.; Zhang, Y.; Yang, C. Numerical investigation of the vorticity transportation and energy dissipation in a variable speed pump-turbine. J. Energy Storage 2024, 93, 112392. [Google Scholar] [CrossRef]
  19. Wang, X.; Wang, Y.; Liu, H.; Xiao, Y.; Jiang, L.; Li, M. A numerical investigation on energy characteristics of centrifugal pump for cavitation flow using entropy production theory. Int. J. Heat Mass Transf. 2023, 201, 123591. [Google Scholar] [CrossRef]
  20. Yang, F.; Li, Z.; Hu, W.; Liu, C.; Jiang, D.; Liu, D.; Nasr, A. Analysis of flow loss characteristics of slanted axial-flow pump device based on entropy production theory. R. Soc. Open Sci. 2022, 9, 211208. [Google Scholar] [CrossRef]
  21. Zhang, X.; Tang, F. Energy loss evaluation of axial flow pump systems in reverse power generation operations based on entropy production theory. Sci. Rep. 2022, 12, 8667. [Google Scholar] [CrossRef] [PubMed]
  22. Li, Y.; Lin, Q.; Meng, F.; Zheng, Y.; Xu, X. Research on the influence of tip clearance of axial-flow pump on energy characteristics under pump and turbine conditions. Machines 2022, 10, 56. [Google Scholar] [CrossRef]
  23. Yu, L.; Cheng, L.; Xu, W.; Lei, S. Study on the Influence of Tip Clearance on Cavitation Performance and Entropy Production of an Axial Flow Pump. J. Mar. Sci. Eng. 2024, 12, 101. [Google Scholar] [CrossRef]
  24. Miao, S.; Tan, X.; Luo, W.; Wang, X.; Yang, J. The mechanism of internal energy losses in double-suction centrifugal pumps under direct and reverse conditions. Energy 2024, 306, 132547. [Google Scholar] [CrossRef]
  25. Xu, R.; Long, Y.; Wang, D. Effects of rotating speed on the unsteady pressure pulsation of reactor coolant pumps with steam-generator simulator. Nucl. Eng. Des. 2018, 333, 25–44. [Google Scholar] [CrossRef]
  26. Luo, X.; Ye, W.; Huang, R.; Wang, Y.; Du, T.; Huang, C. Numerical investigations of the energy performance and pressure fluctuations for a waterjet pump in a non-uniform inflow. Renew. Energy 2020, 153, 1042–1052. [Google Scholar] [CrossRef]
  27. Zhang, L.; Wang, S.; Yin, G.; Guan, C. Fluid–structure interaction analysis of fluid pressure pulsation and structural vibration features in a vertical axial pump. Adv. Mech. Eng. 2019, 11, 1687814019828585. [Google Scholar] [CrossRef]
  28. Yang, F.; Chang, P.; Hu, W.; Mao, B.; Liu, C.; Li, Z. Numerical Study on Pressure Pulsation in a Slanted Axial-Flow Pump Device under Partial Loads. Processes 2021, 9, 1404. [Google Scholar] [CrossRef]
  29. Meng, F.; Li, Y.; Chen, J. Investigation of energy losses induced by non-uniform inflow in a coastal axial-flow pump. J. Mar. Sci. Eng. 2022, 10, 1283. [Google Scholar] [CrossRef]
  30. Meng, F.; Qin, Z.; Li, Y.; Chen, J. Investigation of transient characteristics of a vertical axial-flow pump with non-uniform suction flow. Machines 2022, 10, 855. [Google Scholar] [CrossRef]
Figure 1. Three-dimensional model of axial-flow pump.
Machines 13 00252 g001
Figure 2. Mesh of axial-flow pump.
Machines 13 00252 g002
Figure 3. Mesh independence analysis.
Machines 13 00252 g003
Figure 4. Y+ distribution of (a) impeller and (b) guide vanes.
Machines 13 00252 g004
Figure 5. Schematic diagram of test bench structure.
Machines 13 00252 g005
Figure 6. Comparison of numerical simulation and experimental measurement of (a) efficiency, (b) head, and (c) power for Scheme 1.
Machines 13 00252 g006
Figure 7. Power curves with size ratios at different Q/Qdes.
Machines 13 00252 g007
Figure 8. Head curves with size ratios at different Q/Qdes.
Machines 13 00252 g008
Figure 9. Efficiency curves with size ratios at different Q/Qdes.
Machines 13 00252 g009
Figure 10. The EPC curves with different size ratios of the (a) inlet channel, (b) impeller, (c) guide vanes, and (d) outlet channel at different Q/Qdes.
Machines 13 00252 g010aMachines 13 00252 g010b
Figure 11. Schematic diagram of (a) turbo surface and (b) cylinder of impeller flow channel.
Machines 13 00252 g011
Figure 12. Distribution of entropy production coefficient with four size ratios inside different impeller cylinder volumes.
Machines 13 00252 g012
Figure 13. A schematic diagram of (a) turbo surface and (b) cylinder of the guide vane channel.
Machines 13 00252 g013
Figure 14. Distribution of entropy production coefficient with four size ratios inside different guide vane cylinder volumes.
Machines 13 00252 g014
Figure 15. (a) The position of the impeller turbo surface, (b) the unfolded form of the impeller turbo surface, and (c) the spatial distribution of the internal entropy production coefficient at 1.0Qdes.
Machines 13 00252 g015
Figure 16. Spatial distribution of local entropy production coefficient of pressure side of impeller with (a) γ = 1, (b) γ = 3, (c) γ = 5, and (d) γ = 10 at 1.0 Qdes.
Machines 13 00252 g016
Figure 17. (a) The position of guide vanes’ turbo surface, (b) the unfolded form of guide vanes’ turbo surface, and (c) the spatial distribution of the internal entropy production coefficient at 1.0Qdes.
Machines 13 00252 g017
Figure 18. Spatial distribution of local entropy production coefficient of pressure side of guide vanes with (a) γ = 1, (b) γ = 3, (c) γ = 5, and (d) γ = 10 at 1.0 Qdes.
Machines 13 00252 g018
Table 1. Design parameters for different design schemes.
Scheme 1
(Original Scheme)
Scheme 2Scheme 3Scheme 4
Size ratio γ13510
Qdes/(L·s−1)3503150875035,000
n/(r·min−1)1450483.3290145
Disclaimer/Publisher’s Note: The statements, opinions and data contained in all publications are solely those of the individual author(s) and contributor(s) and not of MDPI and/or the editor(s). MDPI and/or the editor(s) disclaim responsibility for any injury to people or property resulting from any ideas, methods, instructions or products referred to in the content.

