Article

An Optoelectronic System for the Online Monitoring of the Chord Length of Steam Turbine Rotor Blades for Early Fault Detection

by
Valery V. Korotaev
1,
Liliana S. Rodikova
1,
Alexandr N. Timofeev
1,
Victoria A. Ryzhova
2,
Sergey N. Yarishev
2,
Todor S. Djamiykov
3 and
Marin B. Marinov
3,*
1
Higher School of Engineering and Technology, ITMO University, Kronverksky Pr. 49, Bldg. A, 197101 St. Petersburg, Russia
2
School of Physics and Engineering, Scientific and Educational Laboratory “Technical Vision”, ITMO University, Kronverksky Pr. 49, Bldg. A, 197101 St. Petersburg, Russia
3
Department of Electronics, Technical University of Sofia, 1756 Sofia, Bulgaria
*
Author to whom correspondence should be addressed.
Machines 2025, 13(3), 174; https://doi.org/10.3390/machines13030174
Submission received: 18 January 2025 / Revised: 14 February 2025 / Accepted: 18 February 2025 / Published: 22 February 2025
(This article belongs to the Section Turbomachinery)

Abstract

:
Research Subject: The research subject was the error of optoelectronic video endoscopy systems in measuring the chord length of low-pressure cylinder steam turbine blades during shaft rotation. Objective: The objective was to reduce the error of the optoelectronic system in measuring the chord length of turbine rotor blades on a closed cylinder during shaft rotation. Methodology: Analytical research and computer modeling of the information transformation process during blade image formation and processing were carried out. Theoretical and experimental evaluations of the system error were conducted. Main Results: The structure of the components contributing to the error in estimating the chord length of low-pressure turbine blades was analyzed. The contribution of individual components to the total error was identified, and methods for reducing the most significant error components were proposed. Practical Significance: The effectiveness of the proposed methods for error reduction was validated through computer simulations and experimental studies on two system prototypes. The results showed that the standard deviation of the random error component in chord measurement during dynamic operation did not exceed 0.27 mm.

1. Introduction

An important issue in the operation of power plant turbines is the prevention of damage to turbine components caused by the wear of the leading edges of their rotor blades (hereafter referred to as blades) [1].
The factors contributing to blade assembly wear include the turbine design features and operating mode, blade geometry, the structure and properties of blade materials, the kinetic parameters of the rotating turbine flow, and the composition, dispersion, and distribution of the liquid phase of the flow on the blade surface [2,3,4]. Also, difficult-to-account-for dynamic phenomena such as vibrations, dynamic stresses in the structure [5], and the constantly changing surface profile of deteriorating functional areas must be considered.
Optoelectronic systems for monitoring steam turbine blade wear and geometry have been developed to enable early fault detection and improve maintenance. These systems use various techniques, including video endoscopy, fiber Bragg grating sensors, and optical barriers, to accurately measure blade dimensions [6].
Shut et al.’s paper describes a video endoscopy system for monitoring the chord length of steam turbine rotor blades [7]. A method and an algorithm were developed for processing digital images from a video endoscopy system in order to monitor the size and shape of working steam turbine blades. The characteristics of a prototype video endoscopy system were experimentally evaluated using a physical model of a steam turbine. Approaches were proposed to reduce the error components associated with the video endoscopy system for monitoring the turbine blades.
Lee and Hwang present an optoelectronic system using FBG sensors and a rotary optical coupler that enables online monitoring of steam turbine rotor blade deformation [8]. Online strain measurement of rotating blades was achieved using fiber Bragg grating (FBG) sensors and a rotary optical coupler. An additional FBG sensor was used to compensate for light intensity loss due to shaft rotation. Strains were successfully measured along the rotating blades at five locations.
Pesatori et al. introduced an optical instrument for precise, contactless measurement of steam turbine blade length developed for online monitoring during turbine fabrication [9]. The optical instrument is very useful for high-accuracy online monitoring of the external palette radial length during turbine fabrication. The prototype instrument allows for a measurement accuracy of 3 μm over a dynamic range of 0.3 mm.
Recent research has focused on reducing measurement errors through improved parameter selection and image processing algorithms [7,10]. The papers present a methodology for selecting parameters of an optoelectronic system to monitor the wear of steam turbine rotor blades with reduced error.
A methodology was developed for selecting the parameters of optoelectronic systems to monitor the wear of steam turbine rotor blades and minimize the total error in measuring the blade chord. The methodology allows for the selection of key system parameters, such as the camera lens, illumination, and optical receiver, to achieve the desired field of view and measurement error. Our paper gives a specific example of the application of the methodology, demonstrating the selection of system parameters for monitoring the wear of the fifth-stage blades of a K-1200 turbine.
Optical instruments have been successfully applied for real-time monitoring during turbine grinding and rectification [11]. These systems can achieve measurement accuracies of 3–10 μm [9]. The optical sensor developed by the researchers measured the radial dimensions of turbine blades with an accuracy of more than 10 μm. The papers describe the design and development of the optical sensor and the results of using it to measure the turbine grinding process at Ansaldo Energia. The optical instrument was successfully used in the field to measure the radial dimensions of turbine blades.
Optoelectronic vibration measurement systems have also been developed for various applications, including aviation engine blade testing and rotor balancing [12]. The optoelectronic vibration measurement system was successfully created and used in various applications, such as vibration testing of aviation engine blades, rotor balancing, and vibration measurements of electronic devices. The system compensated for errors caused by different object sizes, shapes, and light emission/reflection, reducing the total error to less than 15%. The system was designed to be used indoors and outdoors, as confirmed by special climatic testing.
The study of P. Procházka et al. presents a new contactless diagnostic method for identifying steam turbine blade strain, vibration, and damage based on the “tip-timing” approach of measuring time differences in blade passages [13]. Using magneto-resistive sensors, the new method can measure axial and circumferential blade deflections, as well as blade untwisting and elongation. The contactless diagnostic system VDS-UT based on this method has been developed and deployed at power plants in the Czech Republic, where it has been used to detect blade damage.
A. Anisimov describes the design, implementation, and testing of an optoelectronic system for precise positioning of turbine unit elements relative to the shaft axis [14]. Optoelectronic alignment systems using an autoreflexive design can achieve high-precision measurements.
The paper of E. Pankov discusses the possibility of developing an autocollimational optoelectronic system to monitor the position of elements in turbine aggregates [15]. The paper presents the results of experiments that determined the relationship between the displacement of a reflected optical equisignal zone and the displacement of a control element, as well as the relationship between sensitivity and distance. The work concludes that it is possible to realize a similar kind of autocollimational optoelectronic system for monitoring the position of turbine elements.
It is particularly important to monitor the condition of steam turbines with sufficient accuracy and timeliness, as the rotor blades of low-pressure cylinders are subject to severe droplet erosion. This erosion reduces the operational lifespan of steam turbines and decreases their efficiency. Scheduled inspections of the blade assembly are essential to prevent turbine failures caused by erosion damage [16,17].
Existing systems [18] provide non-contact monitoring of blade geometric parameters, but only during turbine disassembly and with the rotor in a static position [19,20].
Optoelectronic video endoscopy systems for monitoring blade wear enable the measurement of blade chord lengths with an error not exceeding 0.7 mm during continuous rotor rotation at speeds of up to 1 rpm [21]. In this process, the steam turbine is taken out of the operational mode and switched to a shaft rotation mode without disassembly, and video probes of the optoelectronic system are inserted through specialized technological openings. However, this level of measurement error is insufficient to make decisions regarding the continued operation or the extent of repairs needed for steam turbine low-pressure cylinders. According to the requirements of RJSC “UES of Russia” [22], the error must not exceed 0.3 mm.
This work aims to reduce the error of an optoelectronic system for measuring the chord length of rotor blades on a closed cylinder during shaft rotation.

2. Operating Principle of the Optoelectronic System for Monitoring Rotor Blade Wear

The optoelectronic system designed for rotor blade wear monitoring [6,9] is a cohesive hardware–software platform [7,10]. The system operating principle was implemented using the experimental setup presented in Figure 1. Its hardware components include a video probe (SATEKO ME-0-FT2A2S-6.0, Sateco MTO LLC, Saint Petersburg, Russia—and the Megeon 3325, OOO NPP ANALYTROPROMPRIBOR, Moscow, Russia) with a positioning device (Standa 8MRB240-152-59, OOO TD Alliance Forest, Saint Petersburg, Russia), a synchro sensor (ODY A44A5-49N-25C2, JSC NPC TECO, Chelyabinsk, Russia), a reference marker for monitoring the angular position of the rotor shaft, and a computer for signal processing and system control, a reference marker for monitoring the angular position of the rotor shaft, and a computer for signal processing and system control.
Blade wear monitoring measures the blade chord length, defined as the distance between the blade’s leading and trailing edges. This measured value is then compared with the original blade parameters. This monitoring process is complicated in the confined working space of a turbine low-pressure cylinder because the trailing edge of the blade under inspection may be obscured by the leading edge of the adjacent blade in the video probe field of view. To address this, it is necessary to set the video probe tilt angle and the start time of video recording during frame formation [23,24].
However, as the probe approaches the blade root, it is not always possible to position the video probe so that its line of sight is perpendicular to the blade chord and so that the adjacent blade does not obscure the target blade. In such cases, measurements are conducted with the line of sight not perpendicular to the blade chord. This misalignment causes the image of the blade edges to not align with the plane of the optical sensor array (hereafter referred to as the photodetector), which leads to image defocusing of the blade edges.
The photodetector converts a defocused image of the blade on the plane into a digital signal proportional to the illumination distribution, referred to in this study as the blade representation.
The operating principle of the optoelectronic system for monitoring rotor blade wear is described below. During the first rotation of the turbine rotor, the synchro sensor in the optoelectronic system for monitoring rotor blade wear identifies the number of blades in the monitored stage. The specialized software [22] then processes the acquired data, determines the boundaries of the blade edges, and calculates the chord length in the blade cross-section.
The blade parameters are then compared with those recorded during the turbine inspection after assembly. Based on this comparison, the system assesses the degree of blade wear. It determines whether further operation of the turbine is viable or if repairs are necessary for the steam turbine low-pressure cylinder.

3. Sources of Error in the System for Evaluating Blade Chord Length

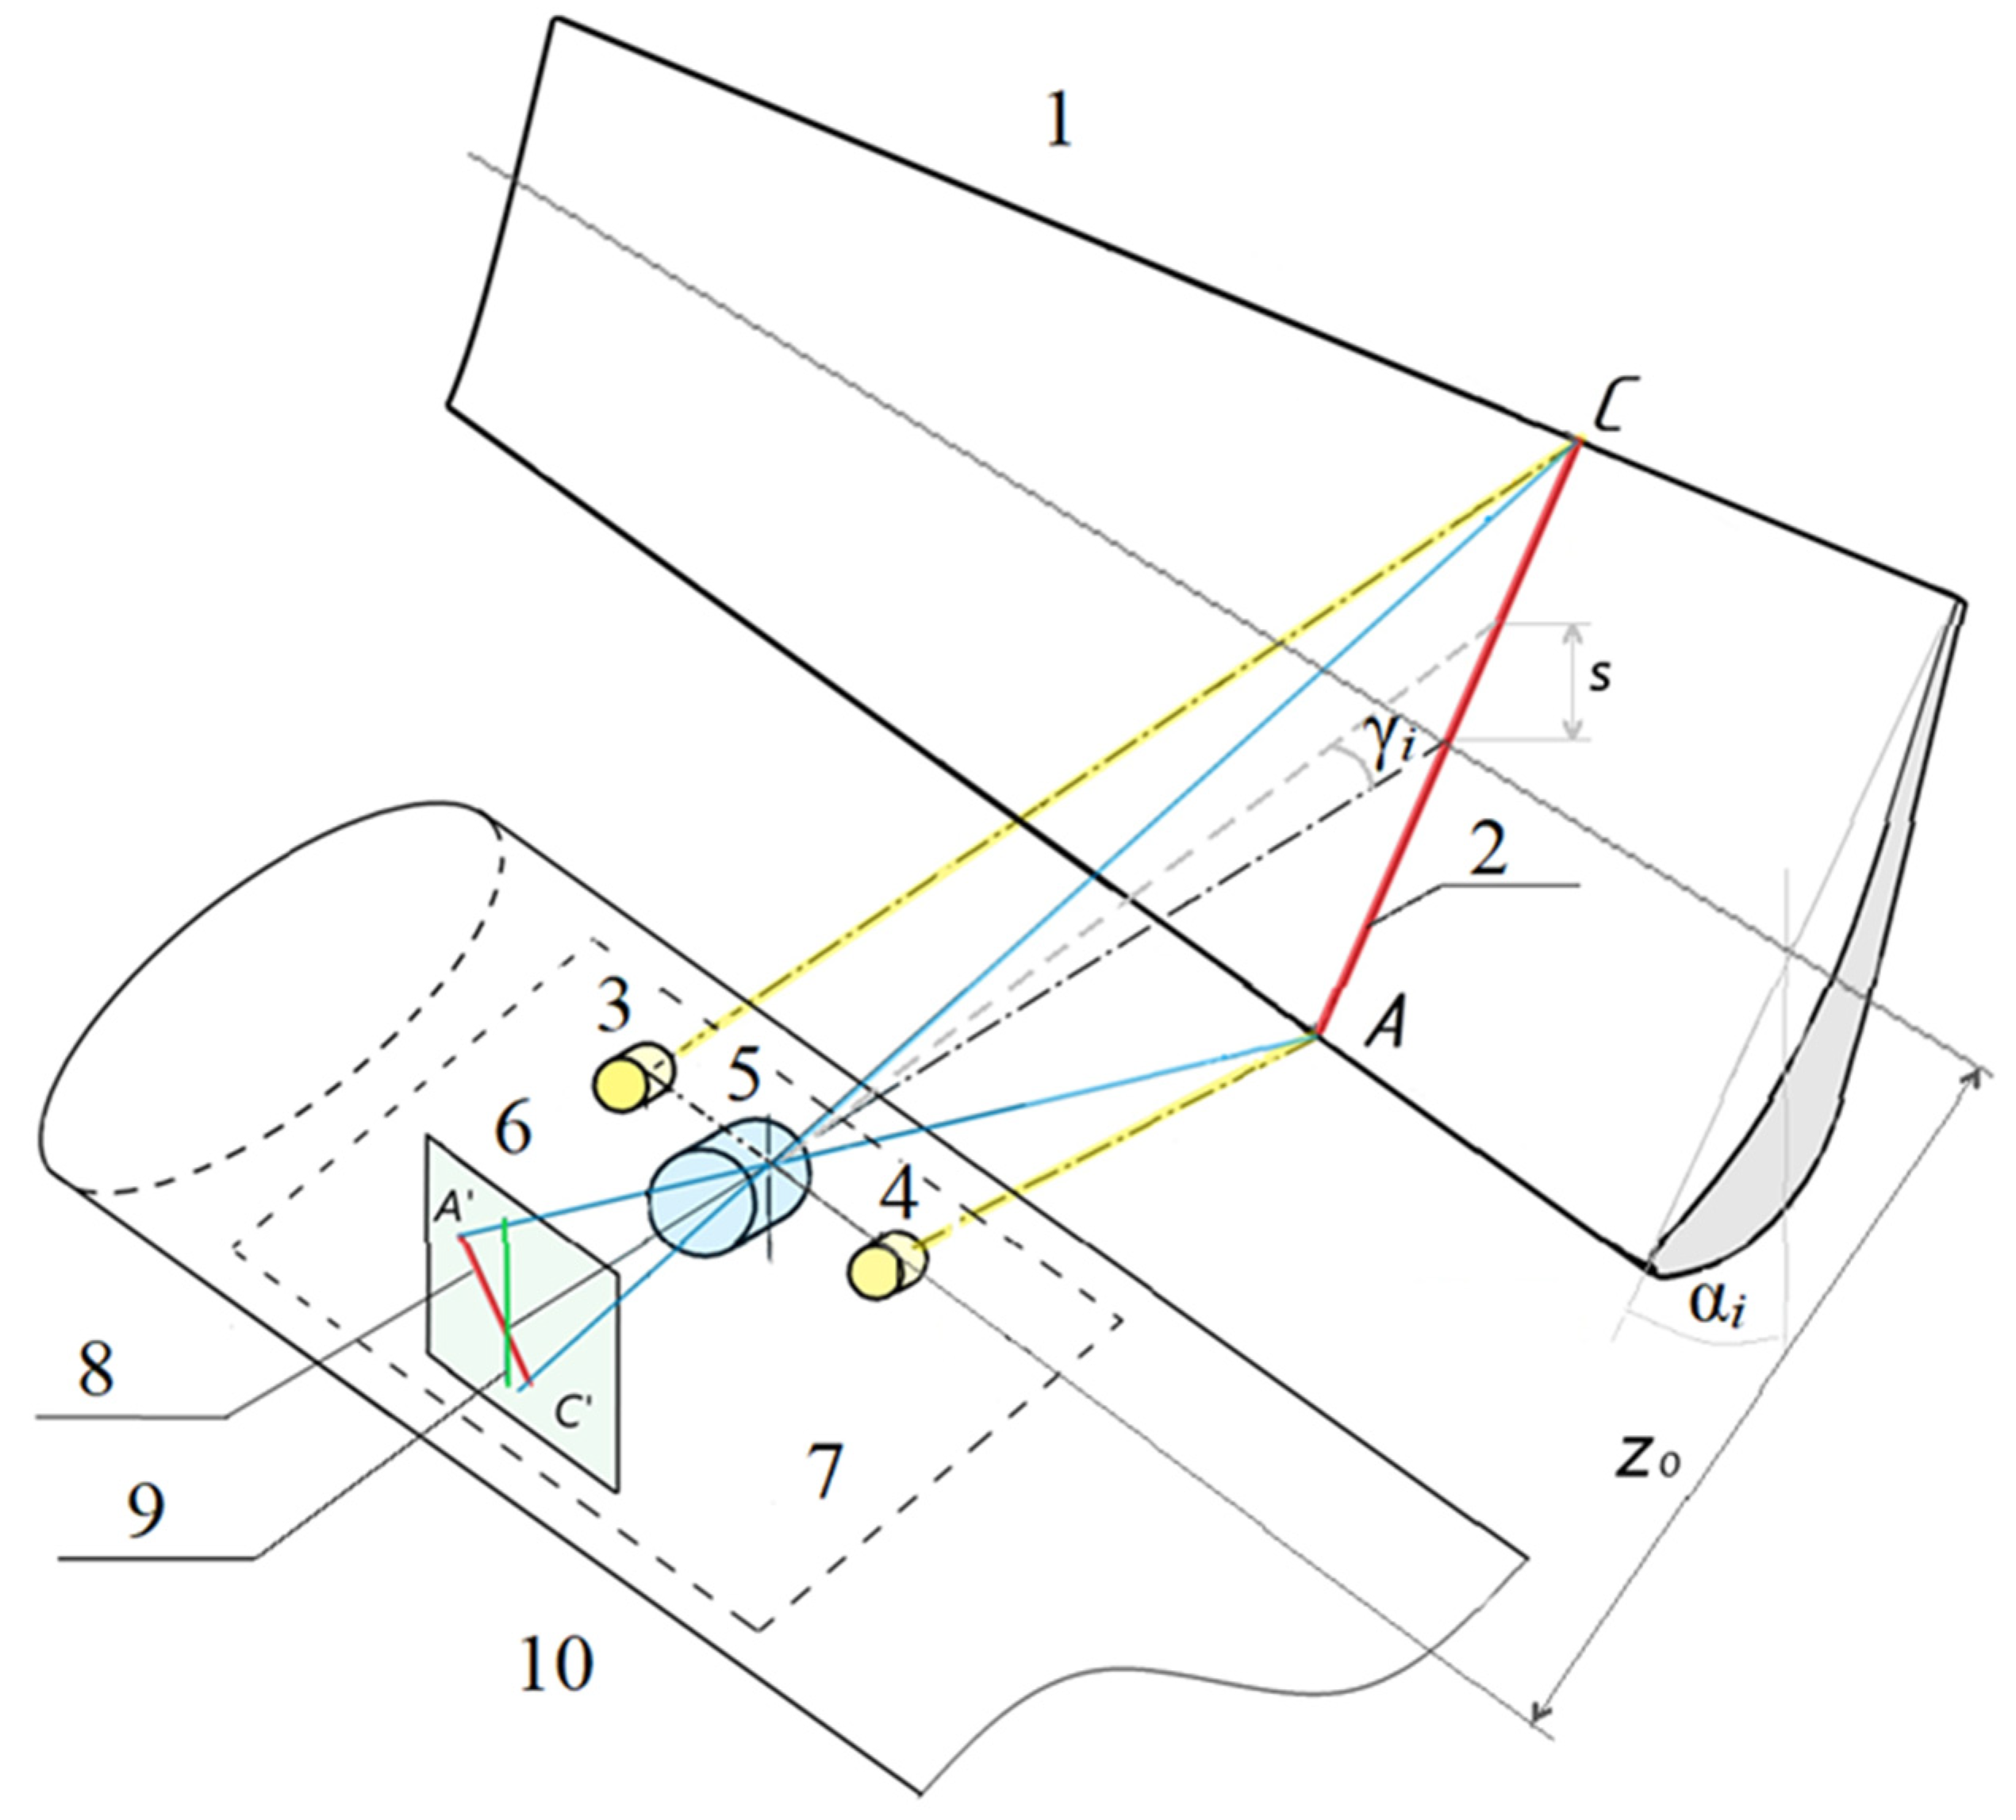
In the optoelectronic monitoring system, whose structure is described in [7,10], the key informative parameter is the segment B i , corresponding to the projection of the blade chord image on the photodetector surface (Figure 2). Using the projection size and the video probe parameters, the basic computer of the monitoring system calculates the blade chord length b i [25]. The error components contributing to the total resulting error δ b i are assumed to be statistically independent [26].

3.1. Previously Investigated Error Components

Earlier studies [7,10,27] analyzed error components caused by the following factors:
Error in determining the edges of the blade image projection on the matrix photodetector δ B D I S (Table 1).
Deviation in the focal length from the nominal value δ f .
Deviation in the distance between the principal point of the video probe lens and the blade axis from nominal value δ z 0 .
Deviation in the radius of the controlled cross-section from the nominal value δ R i .
Deviation in the twist angle of the chord in the controlled cross-section from the nominal value δ α .
Deviation in the exposure time from the nominal value δ t e x p .
Deviation in the video probe temperature from the nominal value Δ T .
Deviation in the shaft rotation frequency from the nominal value δν.
The table below includes mathematical expressions for quantifying each of the aforementioned error components, thus enabling a detailed evaluation of their contribution to the overall error.
Table 1. Formulas for assessing the components of the total error.
Influencing FactorComponent of the Total Error
Error in determining the projection boundaries of the blade edges on the matrix photodetector δ B D I S [10] δ b i D I S = ( z 0 f ) f δ B D I S 2 ( 1 + Q i 2 )
where Q i = 2 π R i b i n N sin α + π R i z 0 N D 2 z 0 ctg α
(1)
Deviation in the focal length from the nominal value δ f [7] δ b i f = z 0 b i n f ( z 0 f ) δ f (2)
Deviation in the distance between the principal point of the video probe lens and the blade axis δ z 0 [7] δ b i z 0 = [ 1 f z 0 + ( 2 π R i N D ) Q i 2 N z 0 2 ( 1 + Q i 2 ) ] δ z 0 (3)
Deviation in the radius of the controlled cross-section from the nominal value δ R i [7] δ b i R = ( π b i n sin α + 2 π z 0 ) Q i z 0 N sin α ( 1 + Q i 2 ) δ R i (4)
Deviation in the twist angle of the chord in the controlled cross-section from the nominal value δ α [7] δ b i α = ( b i n N 2 π R i cos α ) Q i N sin 2 α ( 1 + Q i 2 ) δ α (5)
Deviation in the exposure time from the nominal value δ t e x p [7] δ b i t e x p = 2 π ν R i f 1 + Q i 2 ( z 0 f ) δ t e x p (6)
Temperature change in the video probe housing Δ T [7] δ b i Δ T = b i n ( z 0 f ) l α A l z 0 f Δ T (7)
Deviation in the shaft rotation frequency from the nominal value δν [7] δ b i ν = [ 2 π R i f 1 + Q i 2 ( z 0 f ) t e x p ] δ ν (8)
Change in the blade surface reflection coefficient δρ δ b i ρ = ( z 0 f ) f δ B ρ 2 ( 1 + Q i 2 )
where δ B ρ = 0.9 p / ( μ δ ρ )
(9)
Defocusing of blade edge images on photodetector planes δ A and δ C [24] δ b i s l = ( δ A + δ C ) z 0 / cos γ + ( δ C δ A ) 0.5 b n sin ( α γ ) ( δ A + δ C ) f 2 f cos ( α γ ) (10)
Blade image distortion caused by lens distortion δ D δ b i D = ( z 0 f ) f δ D 2 ( 1 + Q i 2 ) (11)
Deviation in the video probe viewing line from the normal to the blade motion plane δ γ δ b i γ = ( b i n N 2 π R i cos α i ) Q i N sin 2 α i ( 1 + Q i 2 ) δ γ (12)
Error in determining the rotor rotation angle by the synchro sensor δ φ δ b i S S = ( b i n N 2 π R i cos α ) R i Q i z 0 N sin 2 α ( 1 + Q i 2 ) δ φ (13)
Description of Variables from the Formulas in Table 1:
z 0 : Distance from the principal point of the video probe lens to the blade axis.
f : Focal length of the video probe lens.
α : Chord tilt angle, defined as the angle between the chord of the controlled cross-section R i and the plane of the blade axes.
R i : Distance from the controlled cross-section of the blade to the rotor axis.
b n i : Nominal chord length in the controlled cross-section.
N : Number of rotor blades in the examined stage.
D : Diameter of the entrance pupil of the video probe lens.
p : Pixel size of the photodetector.
μ: Nominal signal-to-noise ratio.
δ b i f : Error caused by the uncertainty in setting the focal length.
δ b i z 0 : Error caused by the deviation in the distance between the principal point of the video probe lens and the blade axis from the nominal value.
δ b i DIS : Error caused by the uncertainty in determining the boundaries of the blade image on the photodetector.
δ b i R : Error caused by the deviation in the radius of the controlled cross-section from the nominal value.
δ b i α : Error caused by the deviation in the chord twist angle in the controlled section from the nominal value.
δ b i ν : Error caused by the deviation in the shaft rotation frequency from the nominal value.
δ b i Δ T : Error caused by the deviation in the video probe temperature from the nominal value.
α A l : Coefficient of linear expansion of the video probe housing.
l: Length of the video probe housing from the principal plane of the lens to the photodetector.
δ B ρ : Error in determining the edges of the blade projection image caused by variations in the blade surface reflection coefficient.
δ b i Δ t e x p : Error caused by the deviation in the photodetector exposure time from the nominal value.
δ b i s l : Error caused by defocusing blade edge images on the photodetector photosensitive plane.
δ b i D : Error caused by blade image distortion resulting from lens distortion in the video probe.
δ b i γ : Error caused by the video probe line of sight deviation from the normal to the blade motion plane.
δ b i S S : Error caused by the inaccuracy of determining the rotor rotation angle using the synchro sensor.
However, the list of error sources (1)–(8) is not exhaustive. Therefore, this study also considered the following error sources:
  • Variation in the reflection coefficient of blade surface δρ (9);
  • Defocusing of blade edge images on the photodetector photosensitive plane δ A and δ C (10);
  • Blade image distortion caused by the lens distortion of the video probe δ D (11);
  • Deviation in the video probe line of sight from the normal to the blade motion plane δ γ (12);
  • Error in determining the rotor rotation angle using the synchro sensor δφ (13).

3.2. Error Caused by Changes in the Blade Surface Reflection Coefficient

The diffuse reflection coefficient of the blade structural elements, which changes during operation, is difficult to predict and exhibits a non-uniform surface distribution due to varying degrees of corrosion, scratches, cracks, and other turbine defects. These factors must be taken into account when designing video endoscopy systems, as they contribute to an additional error in determining the edges of the projection δ B ρ of the blade chord image on the photodetector plane. Consequently, this also results in an error in measuring chord length b i ρ , as described by Equation (9).
The variation in the reflection coefficient δ ρ of the blade surface elements affects the illumination distribution created by light sources 3 and 4 (Figure 2) in the image, which forms the basis for the digital representation of the blade chord projection. Changes in illumination lead to variations in contrast and the signal-to-noise ratio at the output of the matrix photodetector, which affect the threshold selection for binarization during digital image processing. The assessment of the range of possible variations in the spectral characteristics of the diffuse reflectance coefficient depending on the position of the monitored sections on new and worn RL was conducted using an Ocean Optic QE 6500 Pro spectrometer Sens-Optik LLC, Saint Petersburg, Russia (spectral sensitivity range: 185–1100 nm) with a fiber-optic probe, a standard EcoVis light source, and the Ocean Insight OceanView software version 1.5.2.
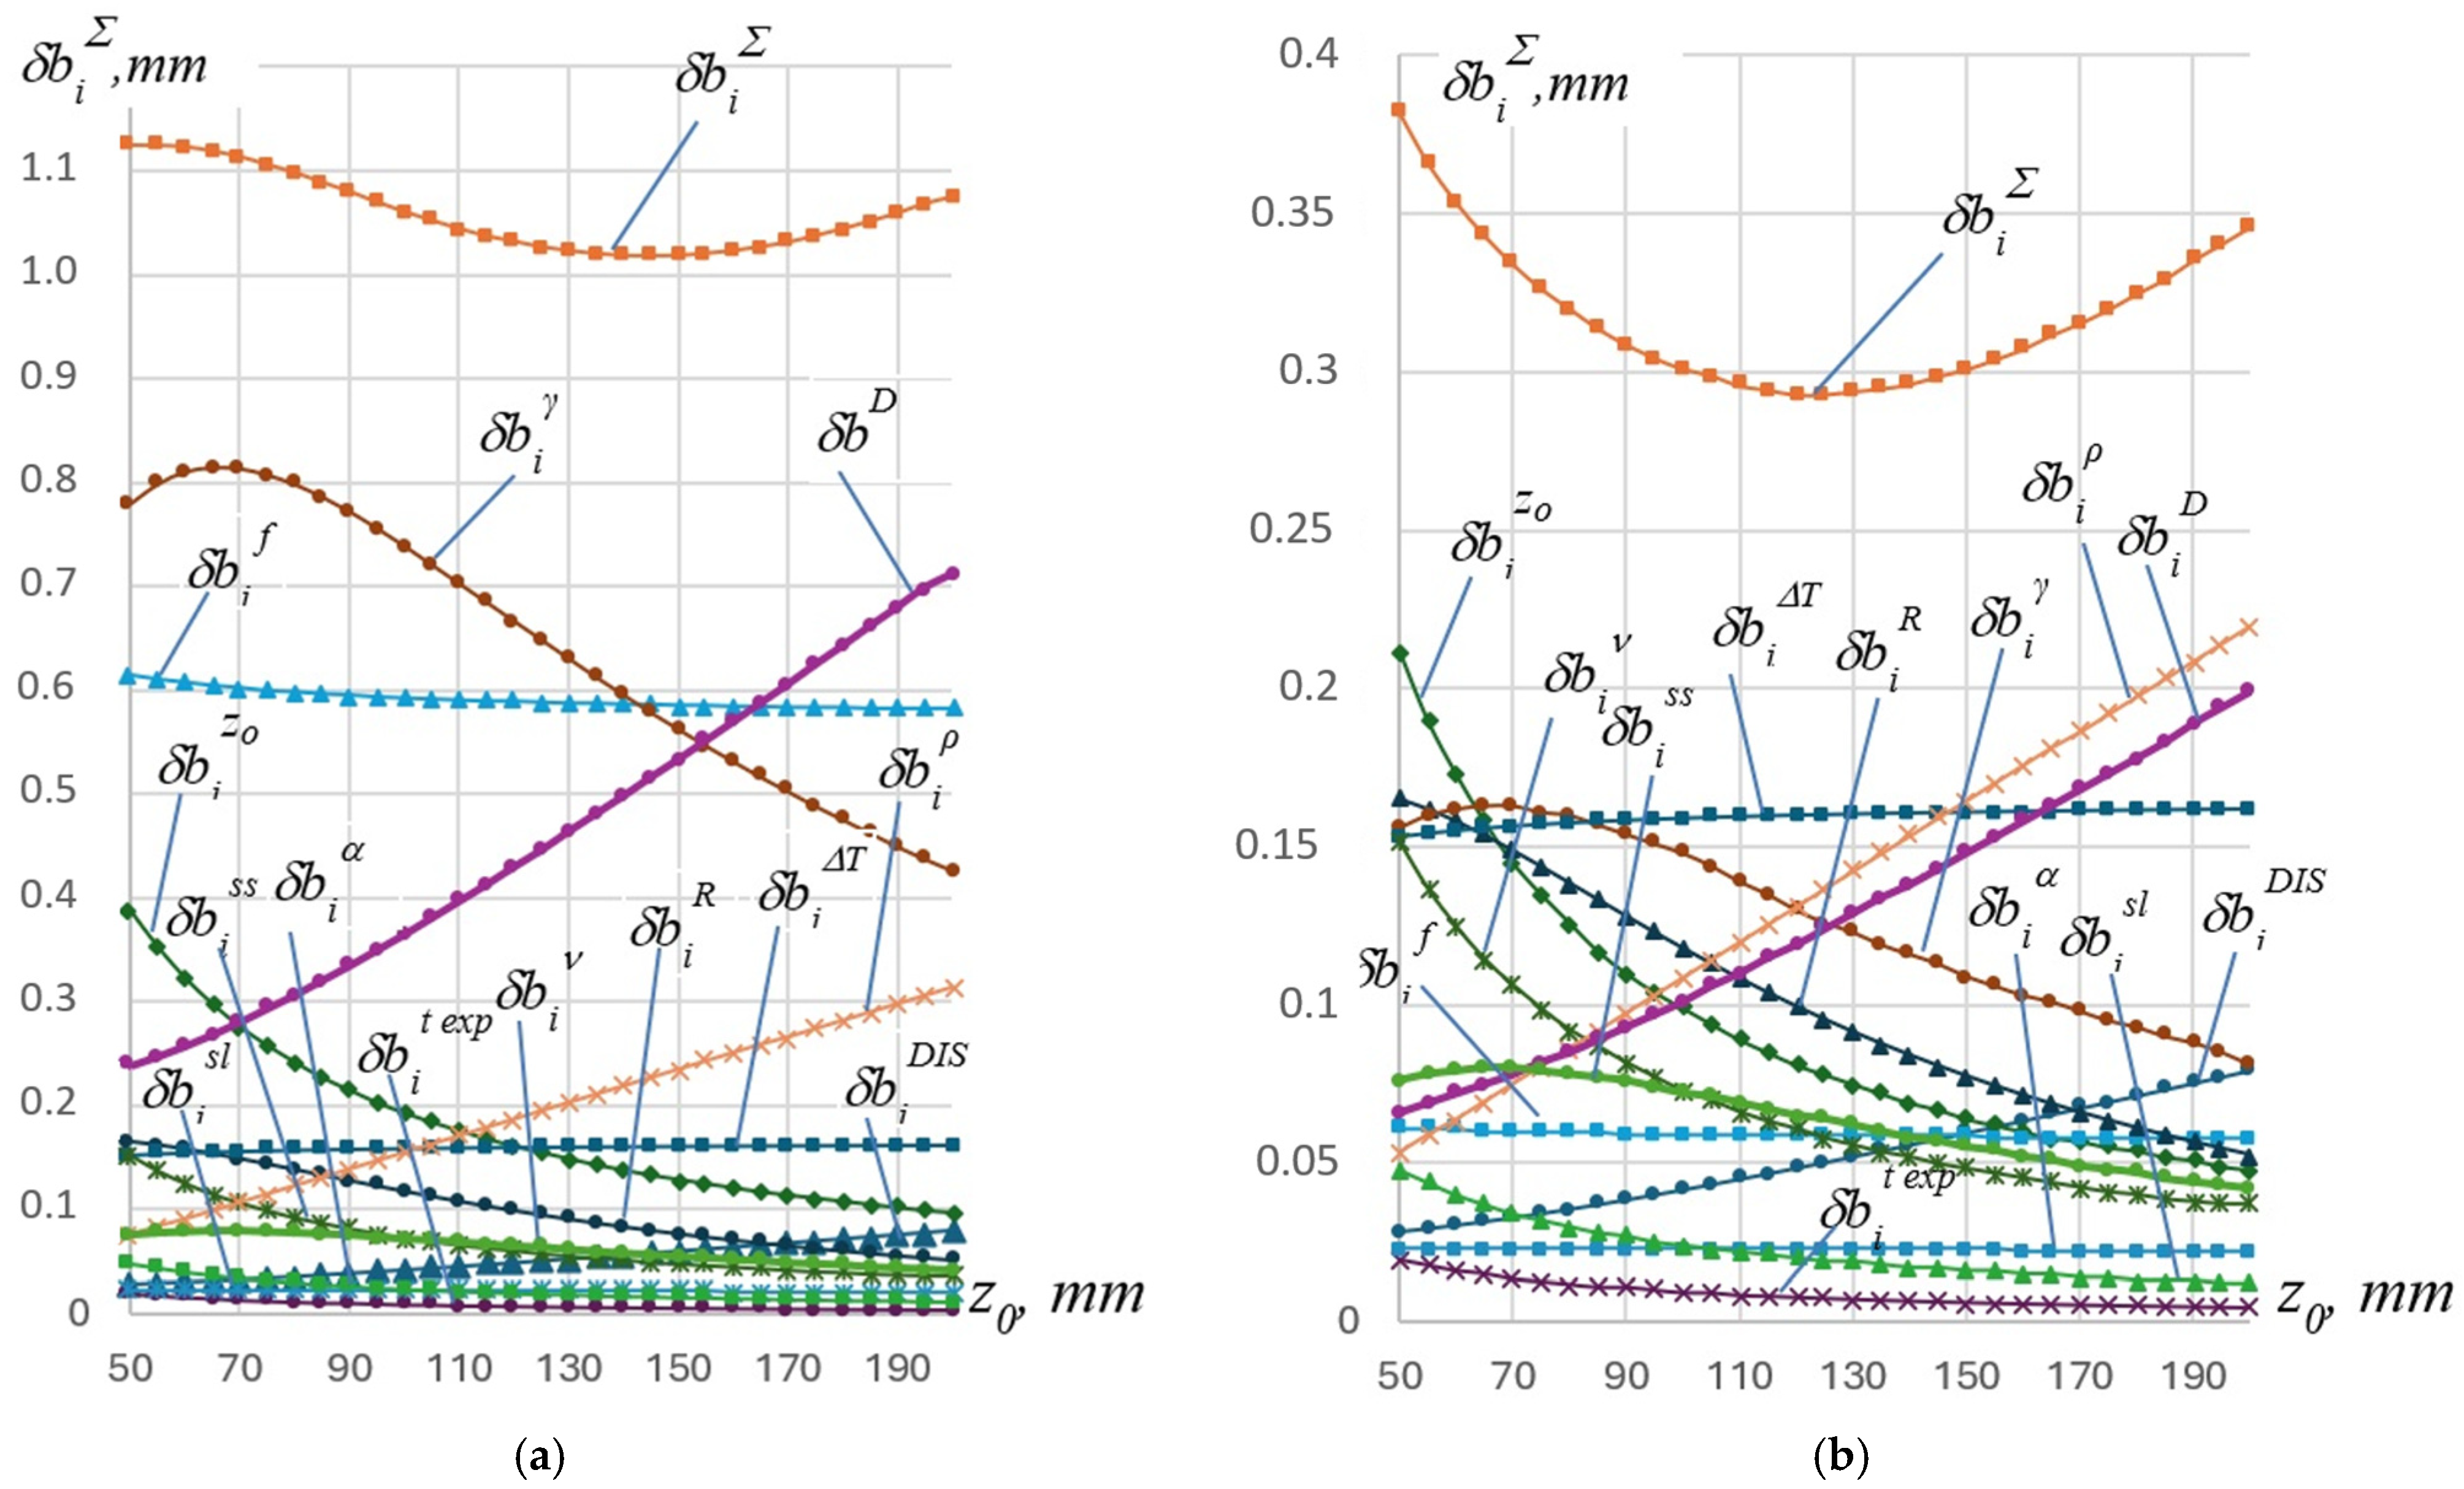
Estimates have shown that with a binarization threshold error of 10 units, an additional chord length determination error of up to 0.1 mm may occur. For the fifth-stage blade assembly of the K-1200-6.8/50 steam turbine, where the reflection coefficient may decrease by a factor of six, the illumination of the blade image projection on the photodetector also decreases sixfold. In this case, according to Equation (9), for a video probe lens with a focal length of 3.5 mm, the error component δ b i ρ reaches 0.3 mm (Figure 3a).
Computer modeling demonstrated that adjustment of the differential illumination levels for the blade leading and trailing edges effectively reduces the impact of variations in the reflection coefficient on the error in blade chord length measurement.
For the controlled sections of the blade where R i < R b , and for illumination sources with Lambertian spatial emission characteristics, the required power ratio between illumination sources P 1 e and P 2 e is described by the following expression [10]:
P 2 e = K a d j P 1 e ,    
where
K a d j i 2 = ρ i A ( z i C g z i C ) 2 [ z 0 / c o s γ i 0.5 b i s i n ( α i γ i ) f ] 2 c o s φ i A g c o s ε i A g ρ i C ( z i A g z i A ) 2 [ z 0 / c o s γ i + 0.5 b i s i n ( α i γ i ) f ] 2 c o s φ i C g c o s ε i C g ,
is the adjustment coefficient for the power of source 4 (Figure 2), which depends on the radius of the controlled section. Here, the following symbols are used:
  • ρ i A and ρ i   C —diffuse reflection coefficients of the surface element of edges A and C;
  • z i   g A —distances A = π r 2 from source 4 (Figure 2) to edges A;
  • z i   g C —distance from source 3 (Figure 2) to edge C;
  • z i A and z i C —distances from the entrance pupil of the lens to the surface of edges A and C;
  • φ i   g A and φ i   g C —angles between the direction to the edge and perpendicular to the surface of edges A and C, respectively;
  • ε i   g A —angle of incidence of rays from source 4 on the surface of edge A;
  • ε i   g C —angle of incidence of rays from source 3 on edge C.
For the range of controlled sections where R i > R b , the adjustment coefficient K a d j is directly proportional to the ratio of the reflection coefficients of the edges [10]:
K a d j = ρ i   A / ρ i   C .
The expressions enable the evaluation of the required adjustment range for light sources during the design phase and facilitate the justified selection of sources with the necessary characteristics.
The magnitude of the error component in determining the blade chord length, δ b i ρ , is determined by the error in adjusting the level of differential illumination, which, in modern electronic systems, does not exceed 0.1%. Under these conditions, the error component b i ρ , caused by variations in the diffuse reflection coefficient, will not exceed 0.22 mm at a distance of z 0 = 200   mm (Figure 3b).

3.3. Error Caused by Defocusing of Edge Images on the Photodetector Plane

The misalignment between the image plane and the photodetector plane, caused by the necessity to conduct inspections with the required viewing angle of the video probe γ , results in defocusing of the edge images on the photodetector plane. This defocusing impacts the accuracy of the chord length measurement of the blade.
An analysis of the ray paths based on the relationships in conjugate planes [28] demonstrated that diameters δ A and δ C of the defocusing spots for the images of points A and C on the photodetector plane can be expressed as follows:
δ A = D [ 0.5 b i n f sin ( α γ ) ( z 0 / cos γ f ) ( z 0 / cos γ 0.5 b n sin ( α γ ) ) ] , δ C = D [ 0.5 b i n f   sin ( α γ ) ( z 0 / cos γ f ) ( z 0 / cos γ + 0.5 b n sin ( α γ ) ) ] .
The error in chord measurement δ b i s l , when utilizing an algorithm that estimates the maximum irradiance spot in the blade image projection on the photodetector, is expressed by Equation (10) in Table 1 [24].
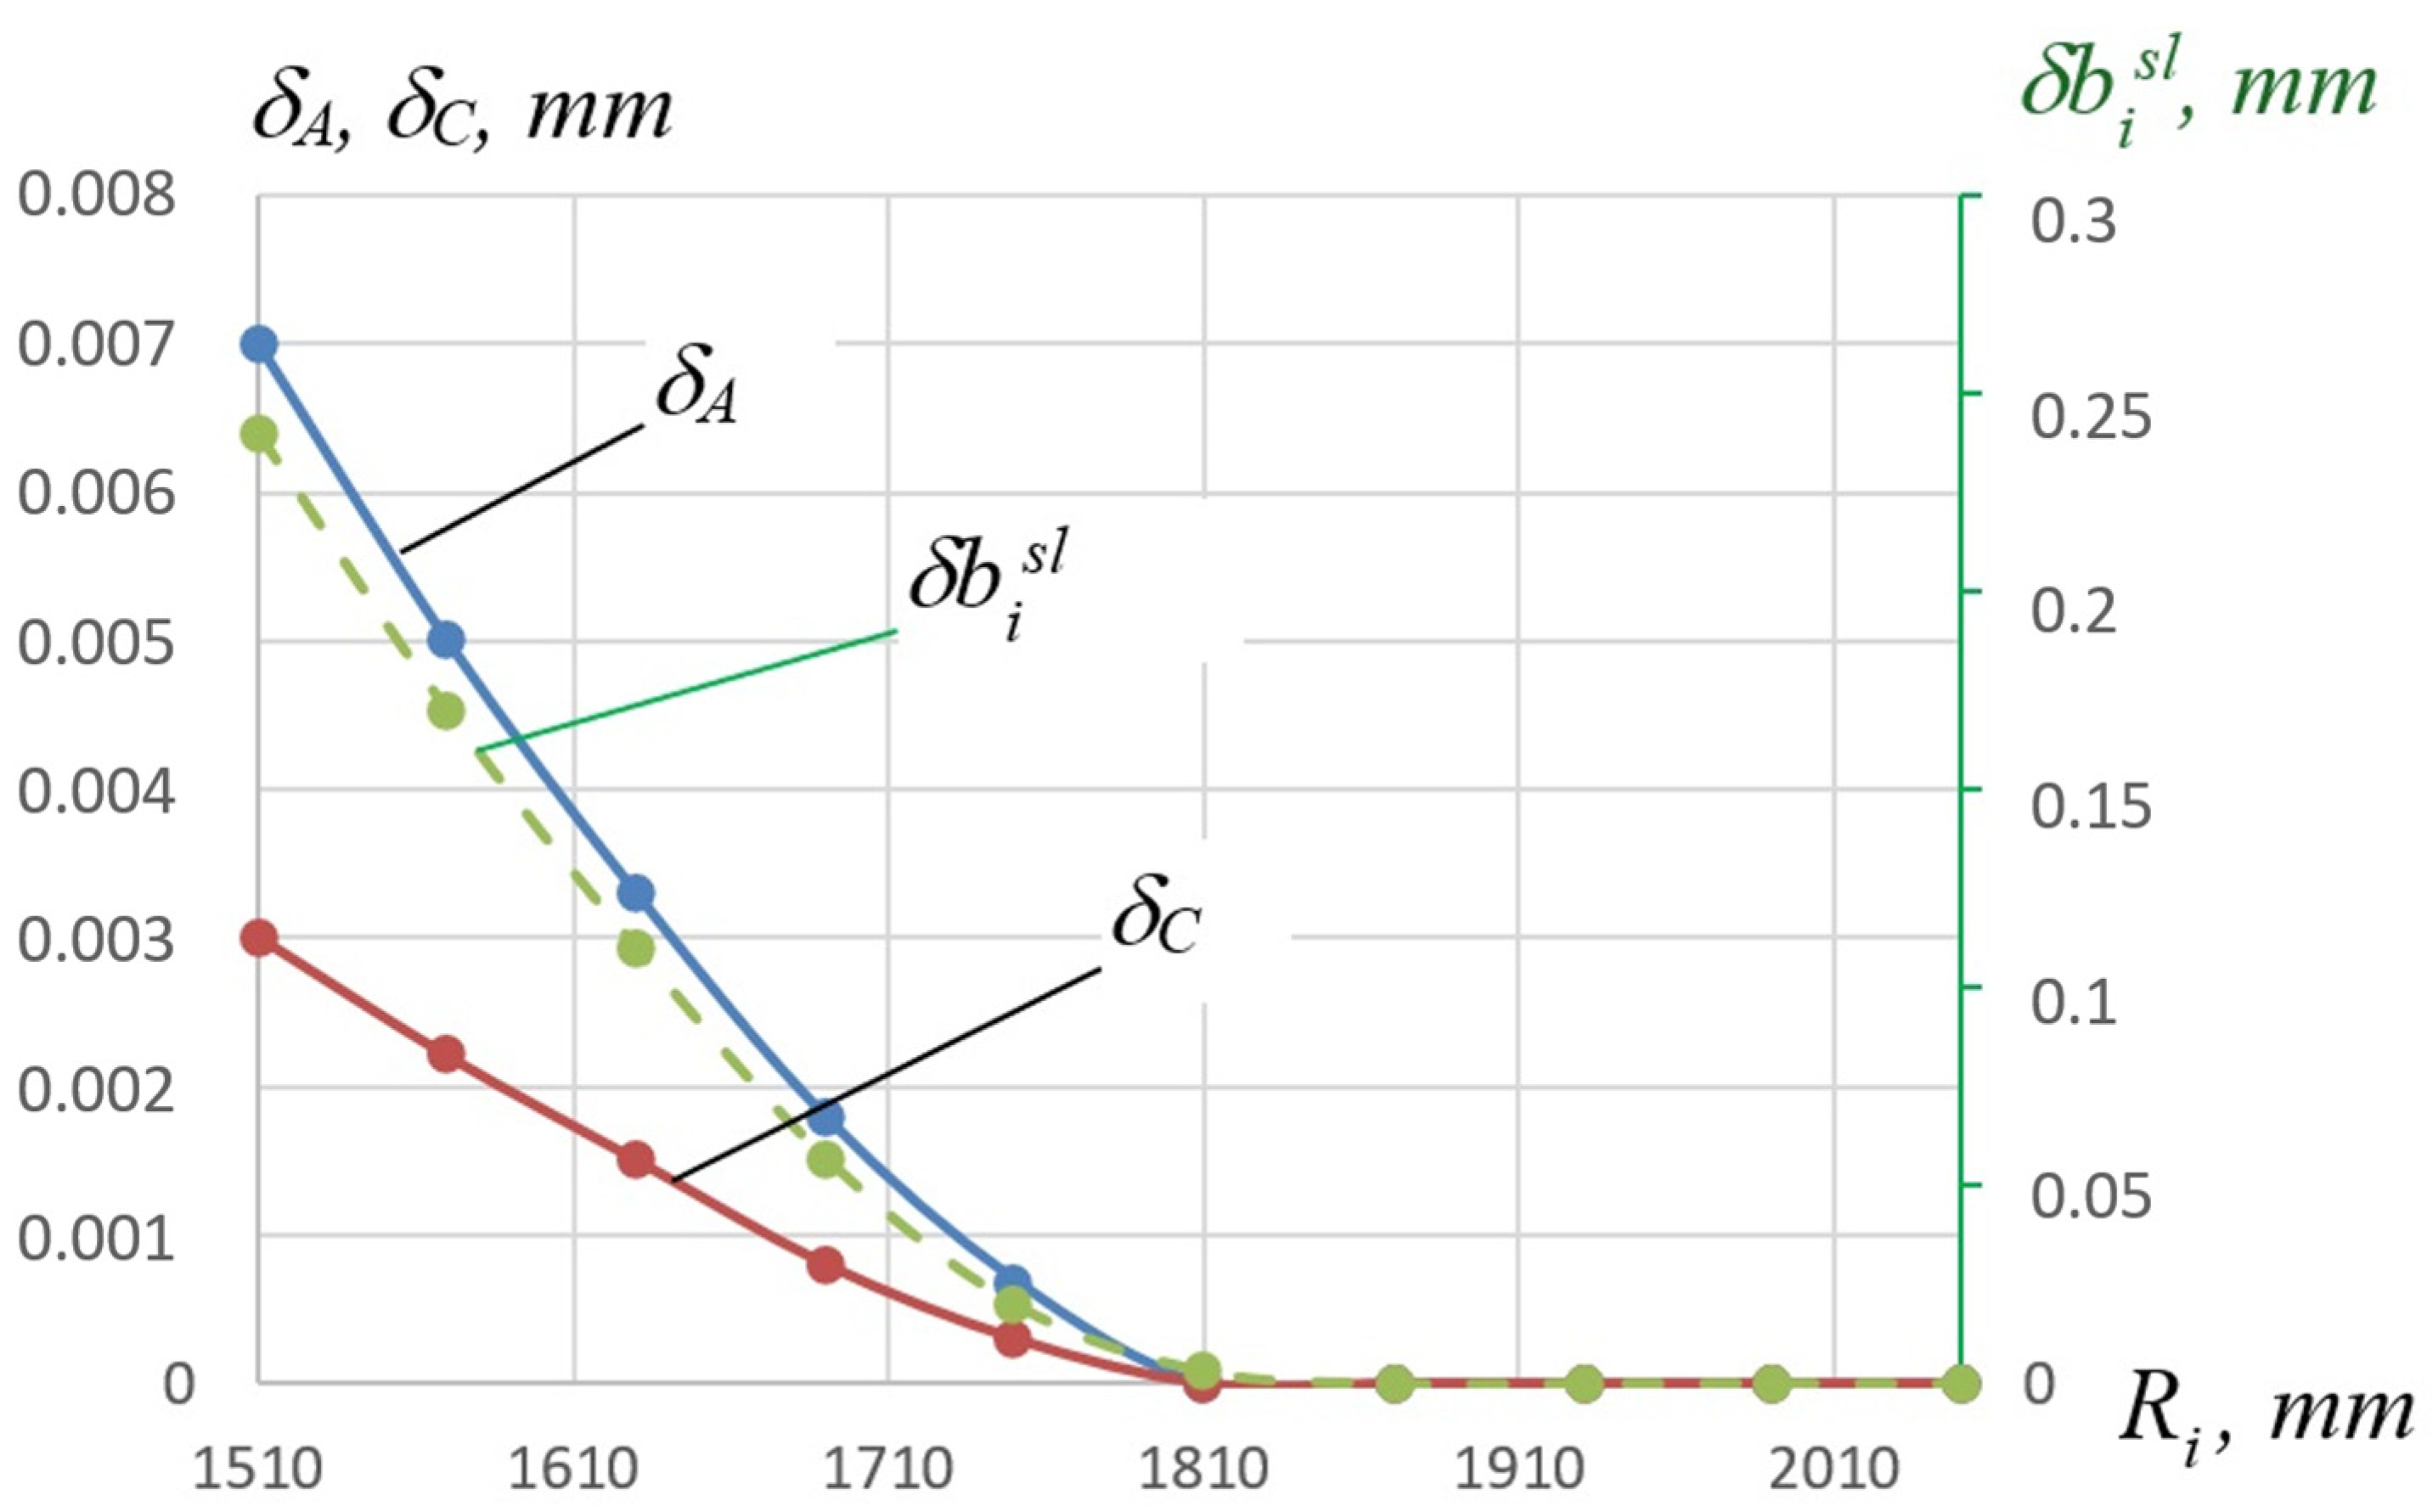
For an aberration-free video probe lens with a focal length of 3.5 mm, the system is applied to the fifth stage of the flow section in the low-pressure cylinder of the K-1200-6.8/50 steam turbine. Figure 4 illustrates the diameters δ A and δ C of the defocusing spots, along with the corresponding chord measurement error b i s l , as a function of R i .
The graphs indicate that error δ b i s l can reach up to 0.25 mm. Consequently, the algorithm for boundary position estimation based on the maximum irradiance in the blade image projection does not ensure the required measurement accuracy.
A promising approach for determining the blade chord projection on the photodetector involves an algorithm that identifies the connected components of points on the leading and trailing edges of the blade chord based on the half-maximum irradiance level in the binarized irradiance distribution of the blade image [24].
The dependence of the defocusing-induced error δ b i s l on distance z 0 is shown in Figure 3a. This analysis demonstrates that the value of δ b i s l decreases with an increase in z 0 . Therefore, it is preferable to conduct chord measurements at larger distances. However, the control distance is constrained by the turbine design.

3.4. Error Caused by Distortion of the Video Probe Lens

Lens distortion results in spatial image deformation, significantly affecting the control of the chord length, especially at short distances z 0 , which may be less than the chord length b i .
Spatial distortion of the irradiance distribution on the photodetector due to lens distortion introduces an error δ b i D in positioning the projected edges A and C on the photodetector (refer to Figure 2). Consequently, the error δ b i D caused by the video probe lens distortion can be estimated using Equation (11).
When measuring a chord with a maximum length of 200 mm at a distance z 0 = 115   mm using a Red Edmund Optics lens with a distortion of 1%, the error δ b i D exceeds 1.5 mm, which is unacceptable.
Reducing the distortion-induced error δ b i D is achieved through system pre-calibration and pixel-by-pixel software processing of the acquired blade images [29,30].
Calibration of the optoelectronic system for monitoring rotor blade wear is performed using a test object in the form of a transparent grid, ensuring a positional error for the image points on the photodetector of no more than δ D = 0.03 pixels [21]. After system calibration, the distortion-induced error δ b i D does not exceed the permissible value of 0.2 mm (refer to Figure 3b).

3.5. Error Caused by Deviation of the Line of Sight from the Normal to the Blade Motion Plane

Previous studies have investigated errors resulting from inaccuracies in the video probe orientation [7], including the following:
  • The error δ b i z 0 caused by a deviation δ z 0 in the distance between the principal point of the video probe lens and the blade axis from its nominal value (3).
  • The error δ b i R caused by a deviation δ R in the radius of the blade section from its nominal value (4).
However, during repeated probe installations, it is also necessary to account for the error δ b i γ caused by a deviation in the video probe line of sight from the normal to the blade motion plane δ b i γ .
Based on the analysis in Figure 2 and considering the relationships of the geometric parameters of image elements in conjugate planes of optical systems [28], the magnitude of the error δ b i γ can be described by Equation (12). Equation (12) shows that the error δ b i γ is multiplicative relative to the chord length.
For the video probe lens of the optoelectronic system for monitoring rotor blade wear with a focal length of 3.5 mm, at a blade section radius of 1750 mm and an angular misalignment error of the video probe of 0.5 ° , the error δ b i γ at a distance z 0 = 115   mm can reach 0.68 mm (Figure 3a), which is unacceptable.
Analysis of Equation (12) and potential video probe designs showed that reducing this error can be achieved by using a specially designed probe mounting system. This design must ensure the following:
  • Setting the viewing angle with an error of no more than 0.1 ° .
  • Defining the blade section radius with no more than a 1 mm error.
  • Setting distance z 0 with an error of no more than 0.05 mm.
Under these conditions, the error δ b i γ at distance z 0 = 115   mm remains within the acceptable limit, not exceeding 0.13 mm (Figure 3b).

3.6. Error Caused by Rotor Angle Measurement Inaccuracy by the Synchro Sensor

The synchro sensor information is crucial for controlling the video probe camera and lighting sources. The measurement error of the rotor angle by the synchro sensor δ φ causes the blade image to shift on the photodetector, leading to an error in the viewing angle δ γ .
Considering the relationships of the geometric parameters of image elements in conjugate planes of the lens [18], the magnitude of the error δ b i S S can be described by Equation (13).
From Equation (13), the following can be said about the error δ b i S S :
  • It is directly proportional to the radius R i of the controlled blade section.
  • It is inversely proportional to the distance z 0 .
An analysis of the standard deviation of the error δ b i S S as a function of distance z 0 , with a rotor angle measurement error φ = 0.05 , showed that its magnitude decreases with increasing z 0 . The error does not exceed 0.08 mm (Figure 3).

4. Analysis of the Impact of Components on the Total Error in Determining the Blade Chord Length

4.1. Model for Information Processing

A numerical model for processing information in the optoelectronic system for blade chord monitoring was implemented in Matlab v6.1 using Equations (1)–(13). This model enables the computation of the total error δ b i in the system and the contribution of the random error components, as listed in Table 1, assuming they are normally distributed and uncorrelated [26]:
δ b i Σ = ( ( δ b i D I S ) 2 + ( δ b i z 0 ) 2 + ( δ b i f ) 2 + ( δ b i α ) 2 + ( δ b i R ) 2 + ( δ b i Δ T ) 2 + ( δ b i exp ) 2 + ( δ b i v ) 2 + ( δ b i D ) 2 + ( δ b i γ ) 2 + ( δ b i Δ ρ ) 2 + ( δ b i s l ) 2 + ( δ b i S S ) 2 ) 1 / 2
Computer simulations indicate that the total error δ b i at a distance z 0 = 115 can be up to 1.05 mm (Figure 3a), which does not meet the required accuracy specifications [22].
The system also includes the following error components:
  • Changes in the measured value during measurement transformations;
  • Geometric noise of the photodetector;
  • Variations in the brightness of the illumination sources due to changes in ambient temperature;
  • Changes in the sensitivity of the photodetector with temperature variations;
  • Changes in the power of the illumination sources due to temporal degradation.
Estimates of these error components, obtained from a computer model, do not exceed 0.01 mm, allowing them to be excluded from the design calculations of the system’s total error.
Figure 3a shows that significant contributors to the total error δ b i include the following:
  • Error due to the deviation in δ b i z 0 .
  • Error due to the deviation in the controlled section radius δ b i R .
  • Error due to the video probe line of sight deviation from the normal to the blade motion plane δ b i γ .
Reducing these contributions is feasible by employing a positioning device for the probe that ensures the following:
  • z 0 distance setting accuracy of no more than 0.05 mm.
  • An angle orientation accuracy for the video probe of no more than 0.1 ° .
Comprehensive measures to mitigate the overall error include the following:
  • Implementation of software-adaptive and differential illumination of the leading and trailing edges.
  • The system can be calibrated using a test object as a transparent grid.
  • Compensation techniques that account for temperature-induced deformation of the system casing.
These improvements collectively reduce the impact of the individual error components on the total measurement error.

4.2. Results of Total Error Reduction Procedures and Analysis

Figure 3b shows the dependencies of the error components after implementing reduction procedures, along with the total error δ b i as a function of distance z 0 . The graph indicates that total error δ b i , within the range of z 0 from 115 mm to 130 mm, was reduced to 0.29 mm, meeting the requirements of RAO “UES of Russia” [22].
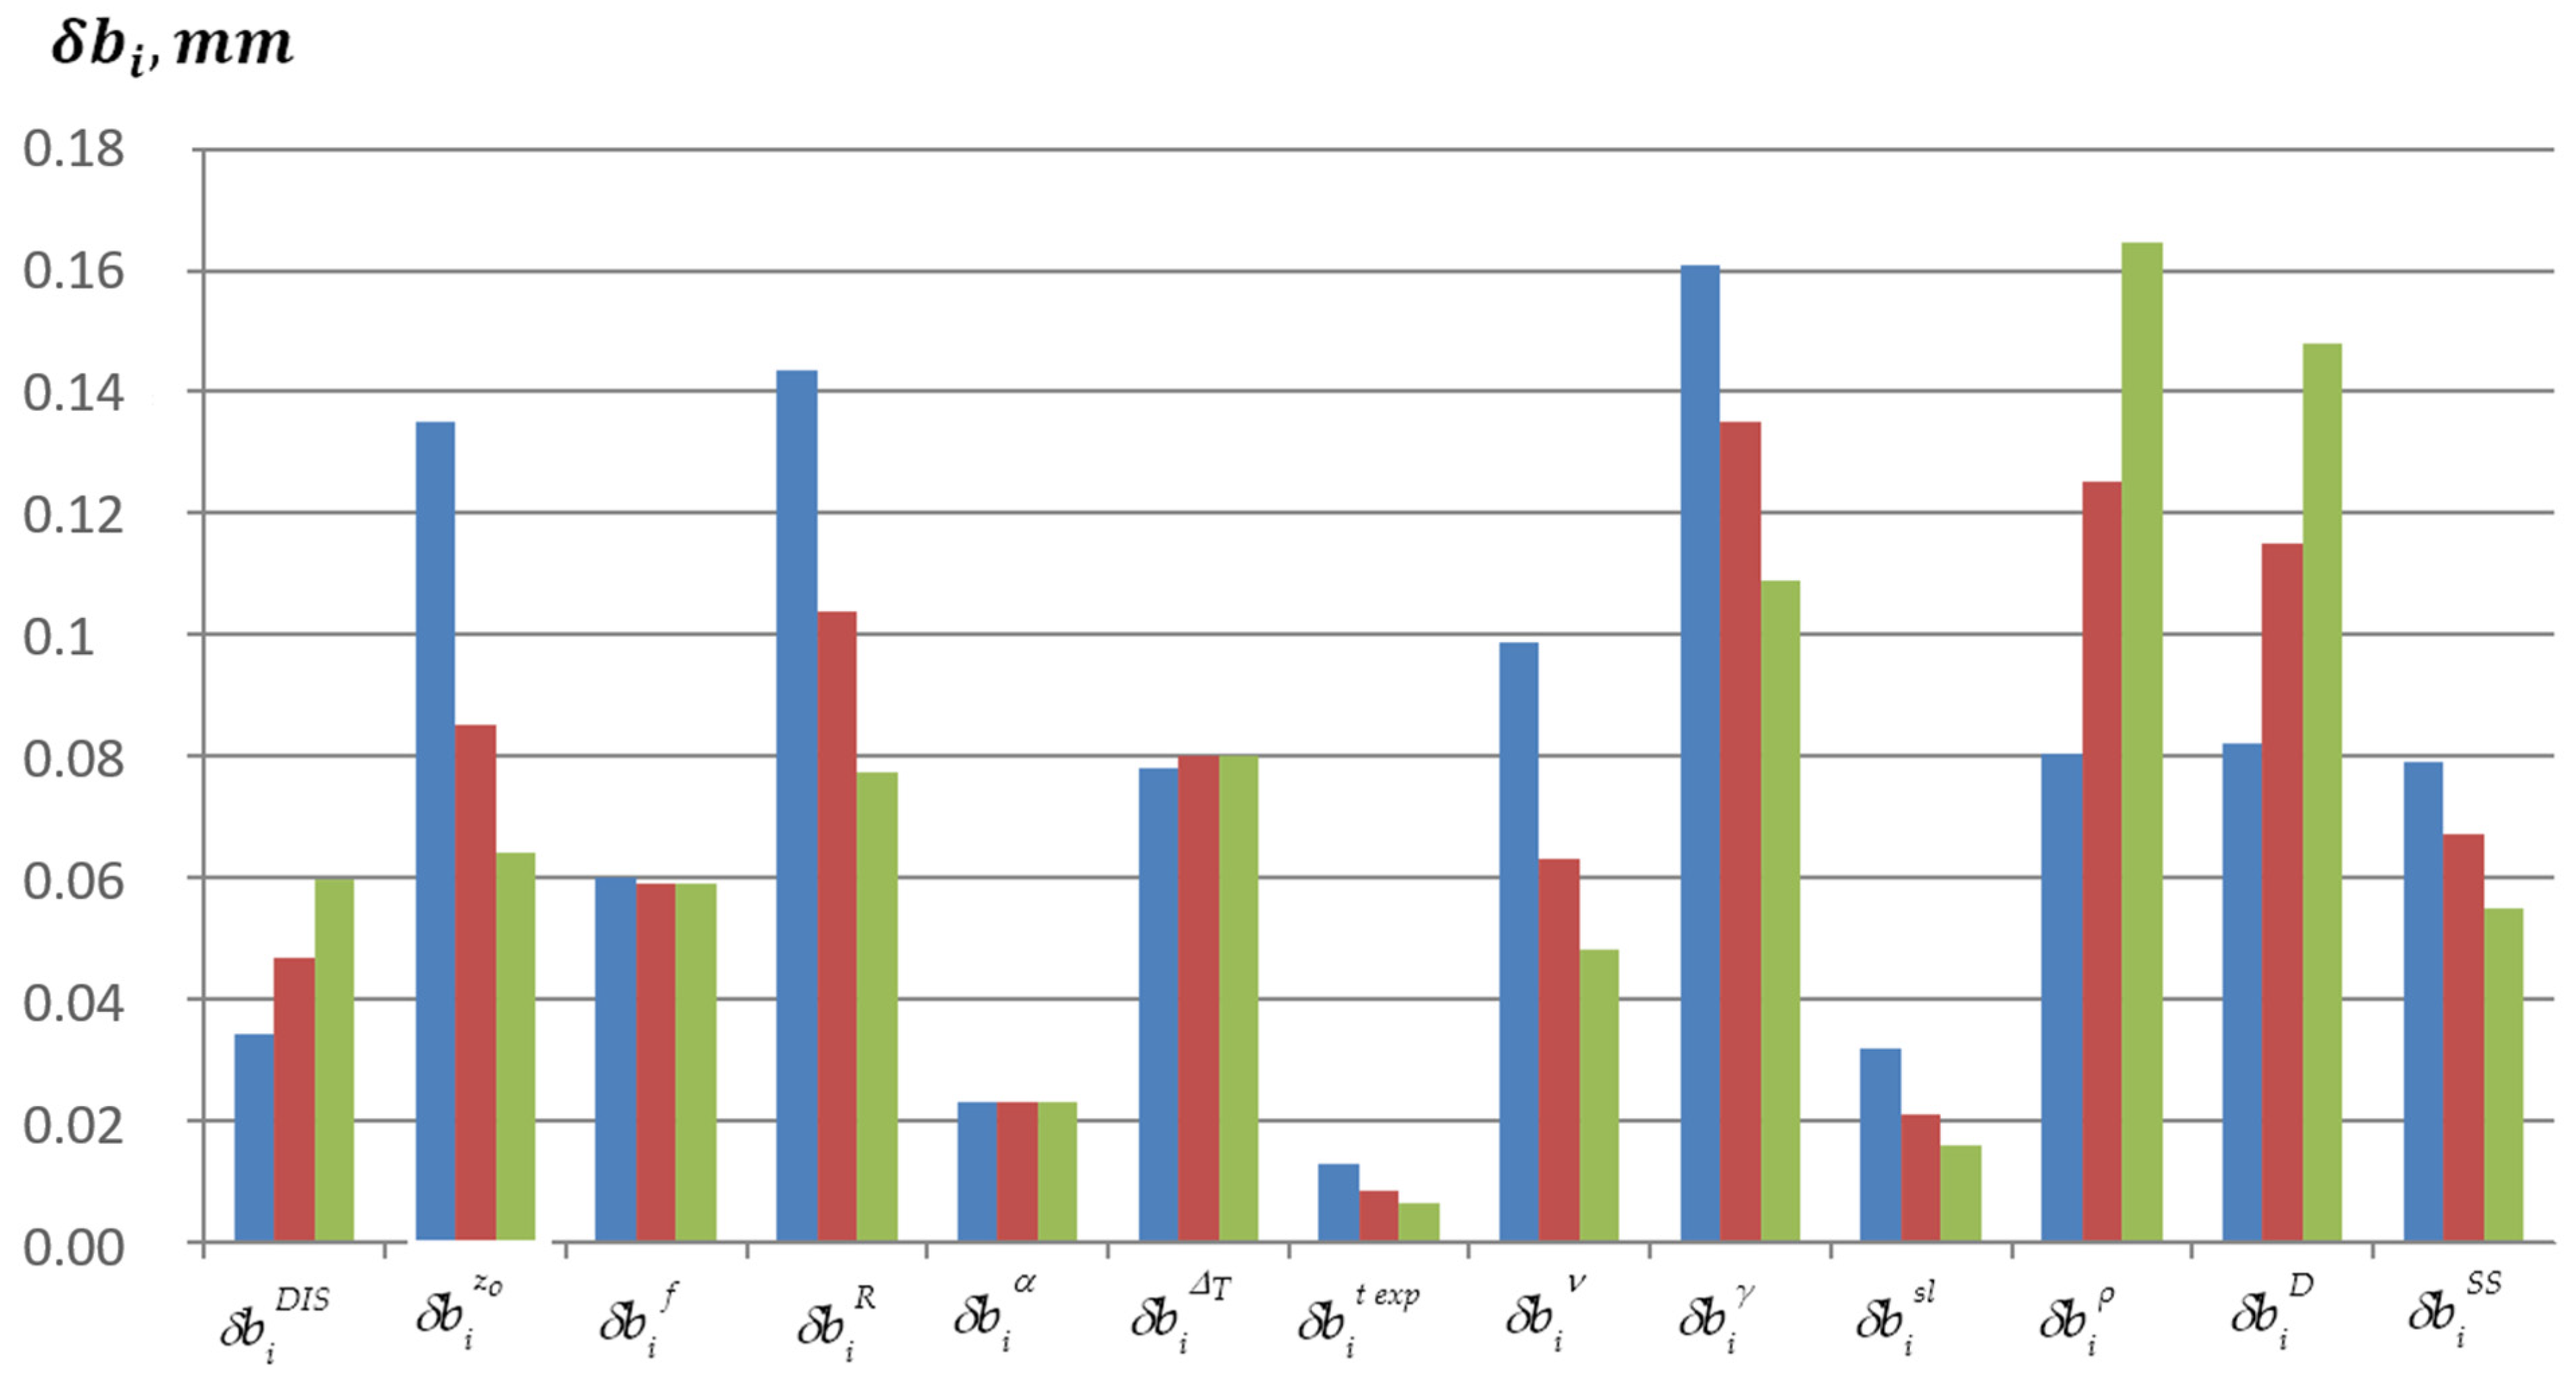
Figure 5 presents diagrams of the magnitudes of the total error components for three different distances z 0 , considering the calibrated system parameters with nominal values:
  • Focal length: f = 3.5   mm .
  • Nominal chord length: b n = 200   mm .
  • Exposure time: t e x p = 0.8 t f r a m e .
  • Controlled section radius: R i = 1750   mm .
  • Viewing angle: = 45 ° .
  • Rotational speed: v = 1.1   rpm .
  • Pixel size: 2.25   μ m .
  • Frame rate: 30   Hz .
  • Signal-to-noise ratio: 300 .
The calculations also accounted for the technological accuracy of component manufacturing:
  • Focal length error: δ f = 0.1 % .
  • Rotational speed error: δ ν = 1 % .
  • Distance z 0 deviation: δ z 0 = 0.1   mm .
  • Controlled section radius deviation: δ R i = 1   mm .
The diagrams in Figure 5 reveal the contributions of the individual components to the total error δ b i . After compensating for the most influential factors, the error components can be ranked in descending order in terms of their impact as follows:
  • Error due to the video probe line of sight deviation from the normal to the blade motion plane ( δ b i γ ).
  • Error caused by changes in the reflection coefficient of the blade surface ( δ b i ρ ).
  • Error caused by lens distortion of the video probe ( δ b i D ).
  • Error due to the deviation in the controlled section radius ( δ b i R ).
  • Error due to distance deviation ( δ b i z 0 ).
  • Error due to temperature deformation of the video probe casing ( δ b i Δ T ).
This analysis demonstrates that a systematic approach to calibrating and compensating for key factors ensures compliance with stringent accuracy requirements.

5. Experimental Studies of the System Prototype

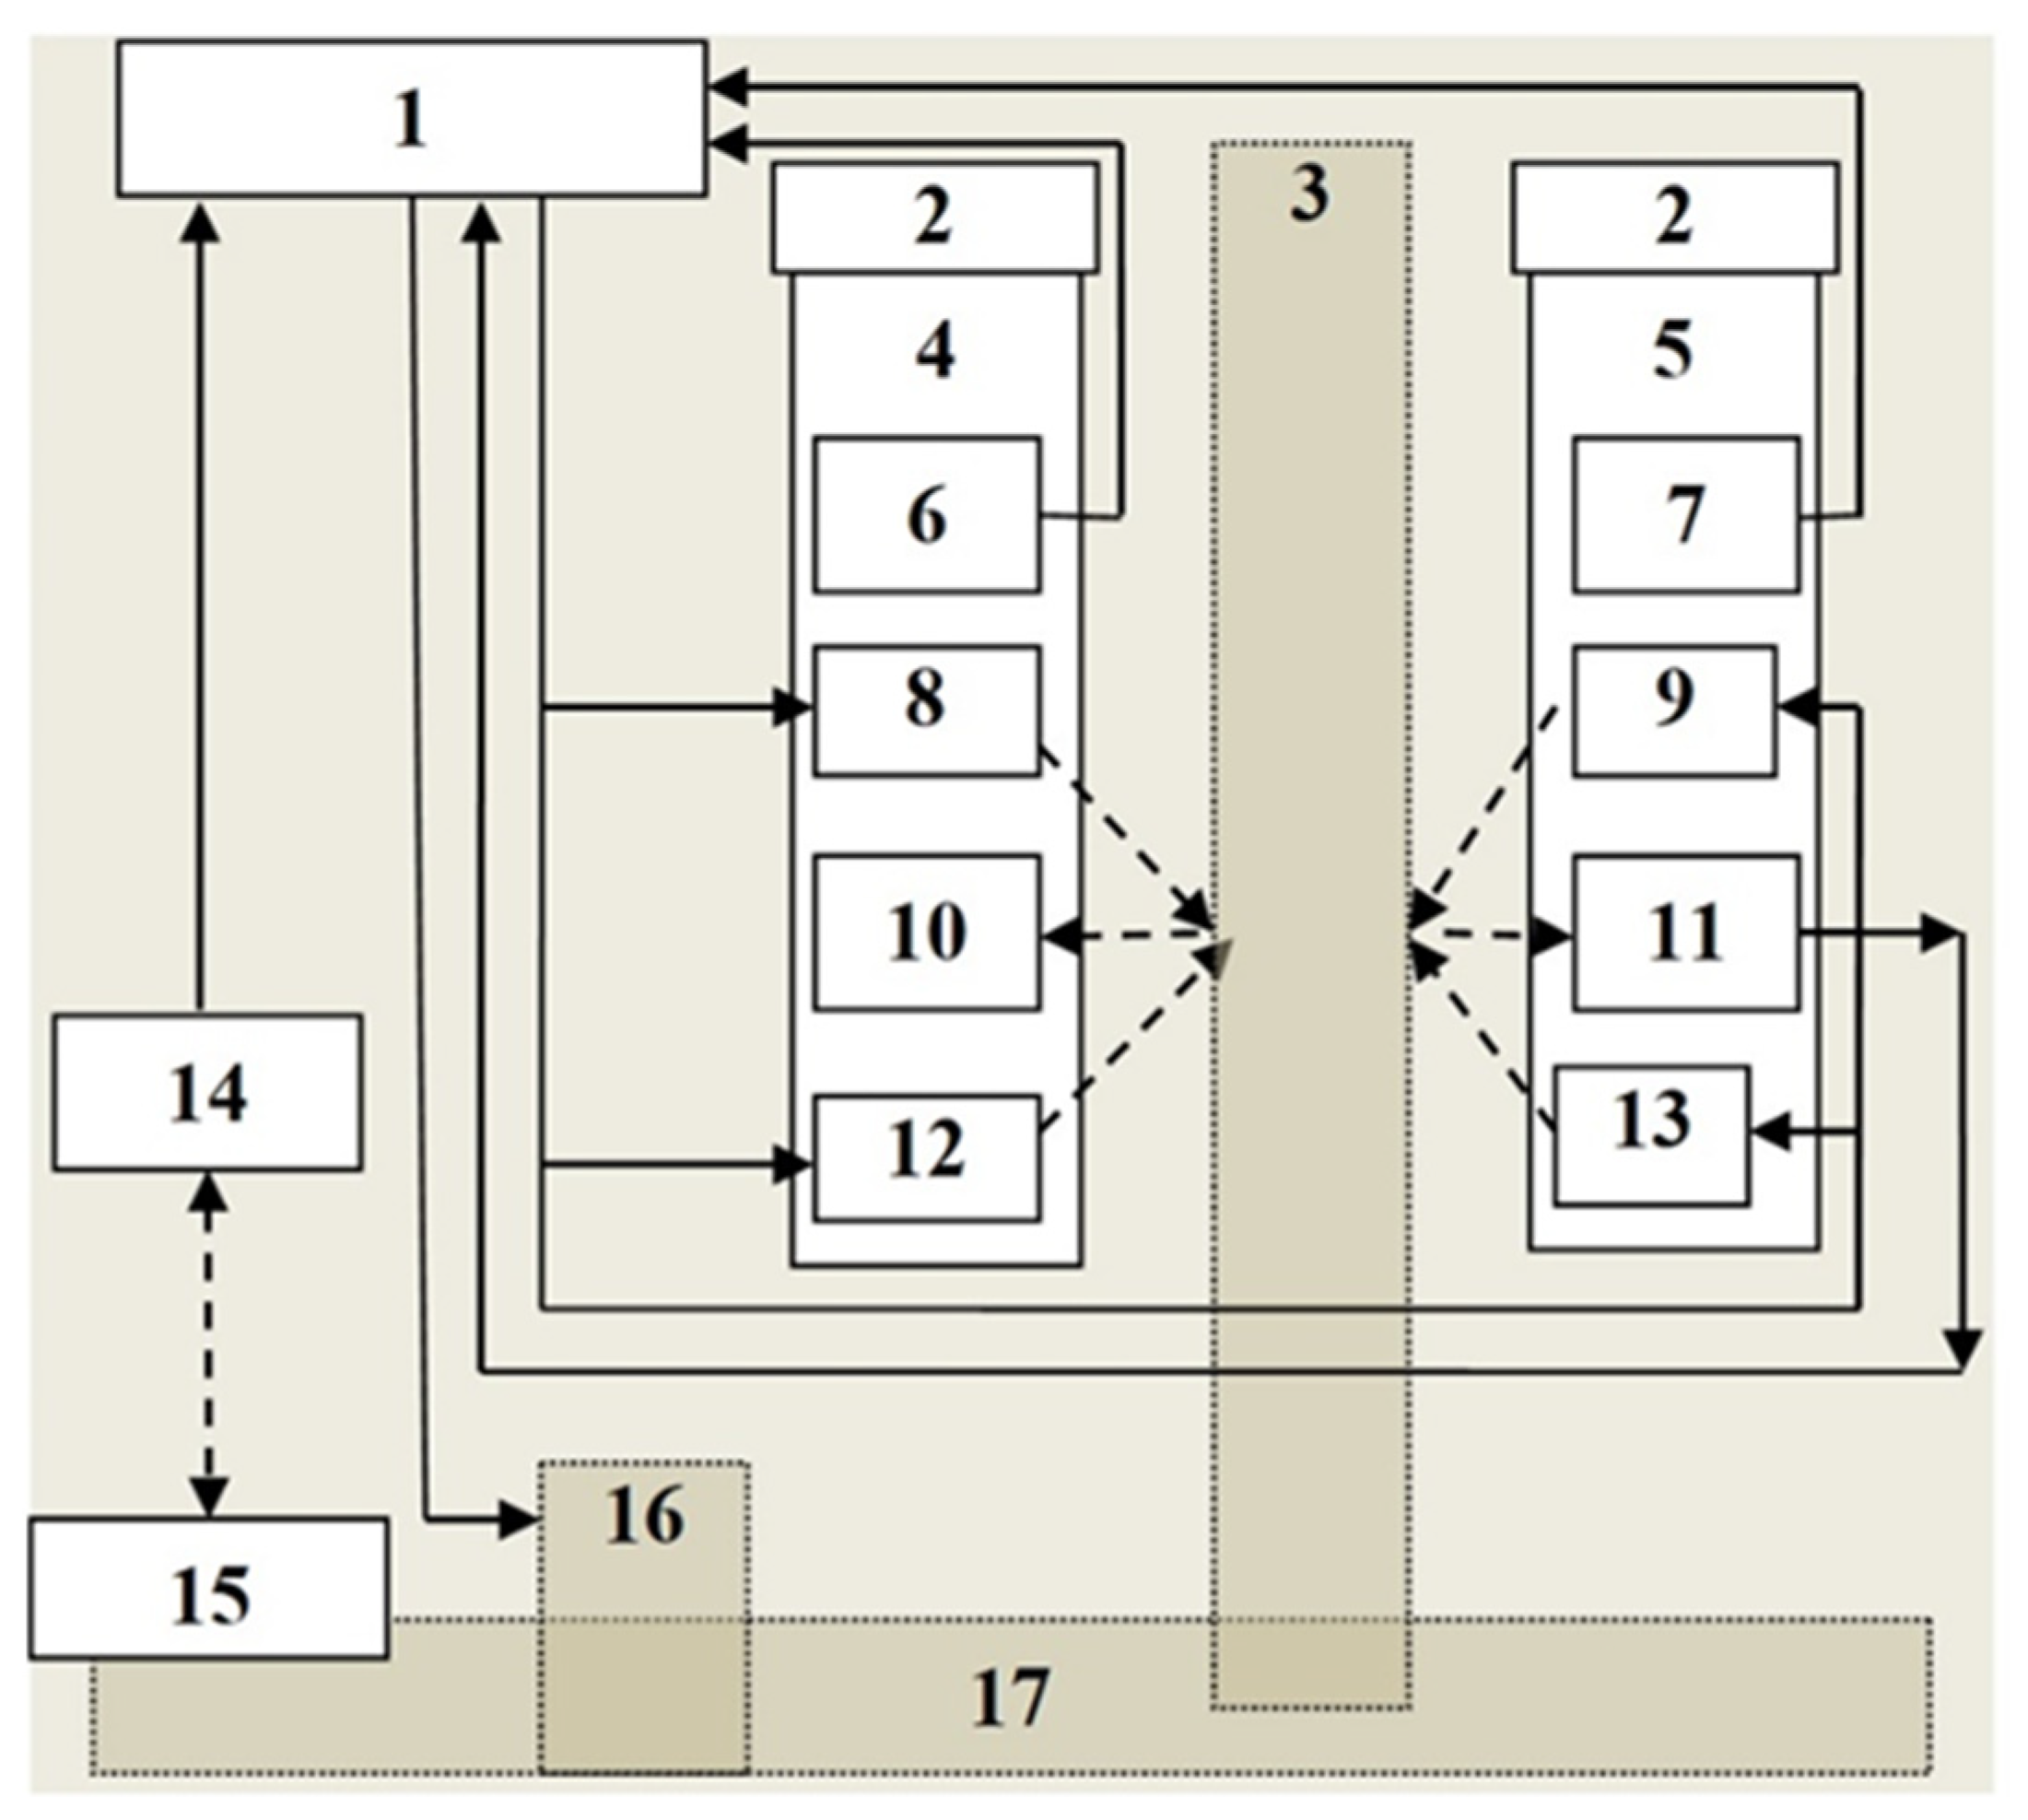
To validate the effectiveness of the proposed methodology for evaluating the total chord measurement error δ b i and the measures taken to mitigate the effects of temperature and changes in the blade surface reflection coefficient, comprehensive experimental studies were conducted on the characteristics of the prototype of the optoelectronic chord monitoring system using the test bench described in [7].
The prototype and test bench (Figure 6) were configured to simulate its application in the flow path of the fifth stage of the low-pressure cylinder of a K-1200-6.8/50 steam turbine.
The blade apparatus prototype consisted of the following:
  • A total of 36 mock blades (3) with a nominal chord length of b i = 102.1 ± 0.1   mm , uniformly mounted on a mock rotor shaft (17).
  • The rotor shaft was coupled with the rotary part of a Standa 8MRB240-152-59 (OOO TD Alliance Forest, Saint Petersburg, Russia) stage (16).
The prototype parameters were selected using the methodology proposed in [10], with the implementation of compensation rotor blade wear including two video probes:
  • A flexible video probe (4) based on a SATEKO ME-0-FT2A2S-6.0-X endoscope (Sateco MTO LLC, Saint Petersburg, Russia).
  • A rigid video probe (5) based on a Megeon 3325 endoscope (OOO NPP ANALYTROPROMPRIBOR, Moscow, Russia) without articulation capability.
These configurations allowed for evaluating the system’s ability to measure blade chords accurately while compensating for environmental and system-specific impacts. Further analysis and validation of the measurement accuracy were performed to ensure compliance with the stringent requirements of turbine operation.
  • Computer: Acer Nitro 5 AN515-54-52N7 laptop, Intel Core i5 9300H 2400 MHz.
  • Video probe positioning devices: enabled accurate placement and alignment of the video probes.
  • Blade mock-up: simulated the geometry and dimensions of the turbine blades.
  • Flexible video probe: SATEKO ME-0-FT2A2S-6.0-X endoscope.
  • Rigid video probe: Megeon 3325 endoscope without articulation.
  • Thermal sensor 1: DS18B20, used for temperature measurement.
  • Thermal sensor 2: DS18B20, positioned to monitor environmental or system-specific temperature variations.
  • Pulse illumination source 1: Cree XLamp XQ-E High-Density LED for blade edge imaging.
  • Pulse illumination source 2: Cree XLamp XQ-E High-Density LED.
  • Camera of flexible video probe: captured images transmitted by the flexible probe.
  • The camera of the rigid video probe: captured images transmitted by the rigid probe.
  • Pulse illumination source 3: Cree XLamp XQ-E High-Density LED.
  • Pulse illumination source 4: Cree XLamp XQ-E High-Density LED.
  • Synchrodetector: ODY A44A5-49N-25C2 synchronized video probe imaging and illumination timing.
  • Mirror marker: assisted with calibration and alignment of the imaging system.
  • Rotational stage: Standa 8MRB240-152-59 facilitated precise rotation of the mock rotor.
  • Mock rotor shaft: represented the shaft structure in the turbine blade apparatus.
This setup was specifically designed to evaluate the optoelectronic chord measuring system under simulated operational conditions, including rotational dynamics, thermal impacts, and illumination variability. The structural design and component integration ensured high-precision validation of the measurement methodology and system robustness.
The basic computer of the system [7] was used as Computer 1, which processed information coming from the flexible (4) and rigid (5) video probes. Computer 1 also controlled the rotary slide (16) and set the prototype rotation with an angular frequency of 4 rpm, simulating the blade tip twist regime with the linear velocity of the controlled sections of the blades equal to the blade speed in the fifth stage of the K-1200-6.8-50 steam turbine. The distance z 0 from the video probes (4 and 5) to the blade model (3) was 70 mm, and the exposure time for the video cameras (10 and 11) was 0.014 s.
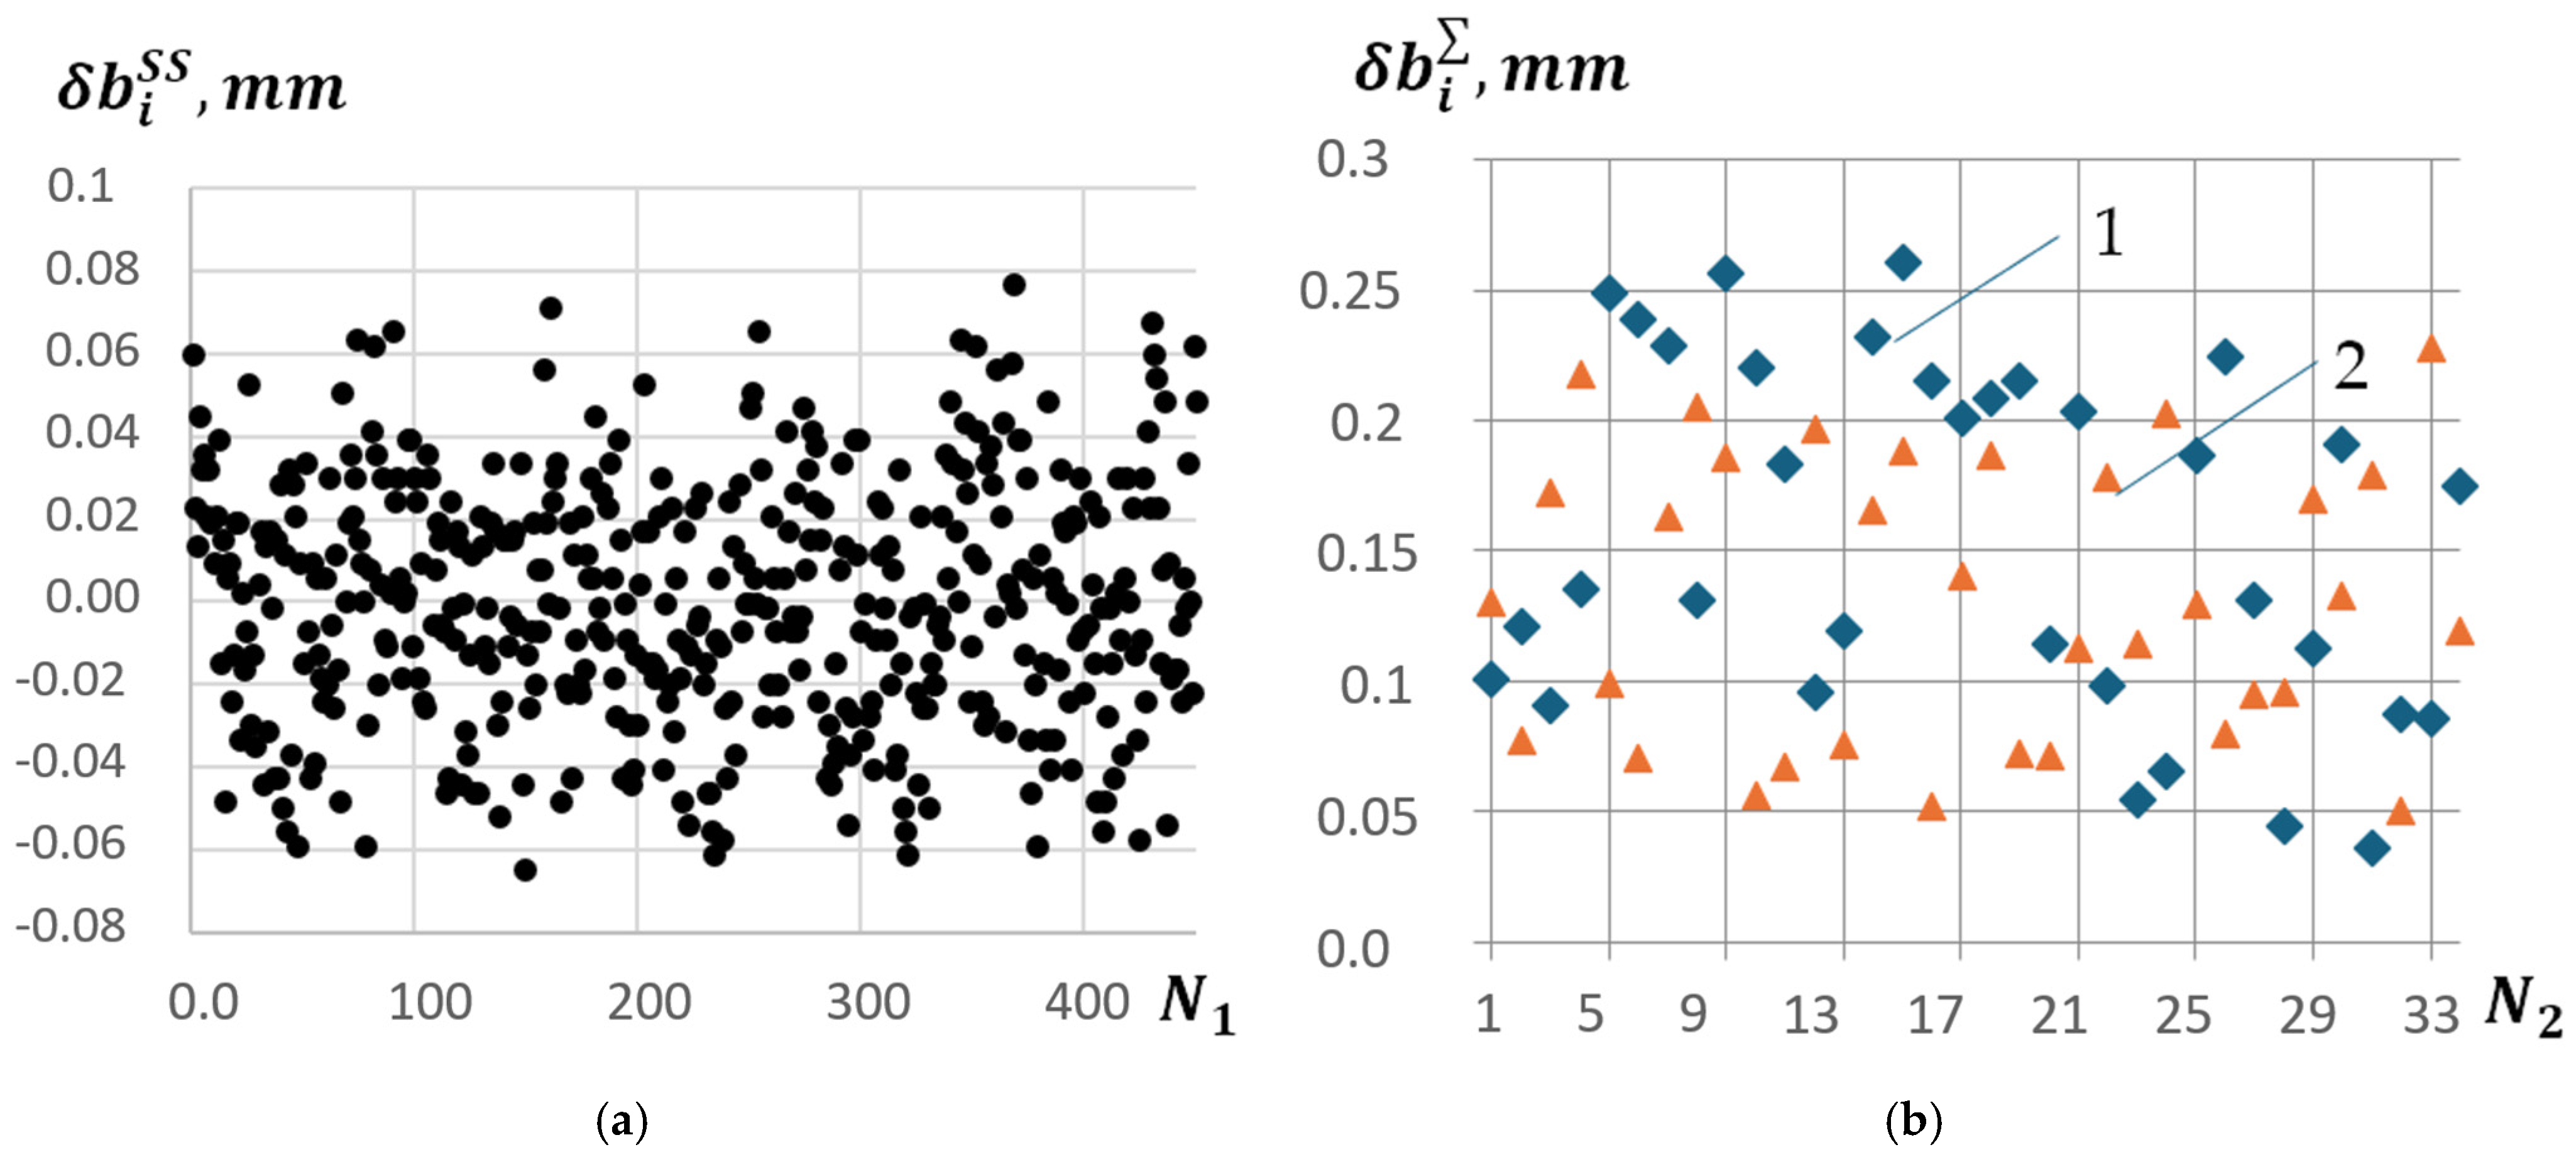
An assessment of the error in determining the chord length as a function of the angular position error of the shaft measured by the synchro transducer was performed using the rigid video probe after the device simulating the shaft twist completed five full revolutions, recording the position every 4 degrees. The readings of the synchro transducer (14) and the chord length at these positions were then compared.
The experiment showed that the variation in the readings followed a random pattern with an average value equal to zero (Figure 7a). The standard deviation of the synchro transducer random error component was 0.02 ° , which resulted in the standard deviation of the chord length estimate (excluding prototype manufacturing errors) not exceeding 0.08 mm.
Subsequent tests involved comprehensive investigations of the model characteristics using 30 test series. The standard deviation of the chord length measurement δ b i was simultaneously assessed using both video probes for each of the prototype 36 blades.
The standard deviation of the chord measurement error δ b i was assessed as follows:
  • In static conditions on the model with the Megion 3325 video probe, δ b i = 0.23   mm , and on the model with the SATEKO ME-0-FT2A2S-6.0-X video probe, δ b i = 0.26   mm ;
  • In dynamic conditions at a rotation speed of 4   rpm with the Megion 3325 video probe, δ b i = 0.25   mm (Figure 7b), and on the model with the SATEKO ME-0-FT2A2S-6.0-X video probe, δ b i = 0.27   mm .
The experimental results indicate that the Megion 3325 probe, without articulation, had a smaller error due to the more stable position of the video camera.
As a result, the total error component of the system δ b i , excluding the manufacturing error of the prototype blades, was less than 0.20   mm in static conditions and less than 0.24   mm in dynamic conditions. These values are not significantly different from the design specifications. They are 20% better than those of the previously developed system [7], with an error of 0.39   mm in static and 0.88   mm in dynamic conditions.
Comprehensive experiments confirmed the effectiveness of the proposed methods for compensating for certain error components and applying the approach for assessing the total error in chord measurement control using the optoelectronic system for monitoring rotor blade wear methodology for selecting system parameters, proposed in [10], was also validated.

6. Conclusions

It was shown in this paper that among the components of the error in controlling the chord length of turbine blades, the largest contributions, in decreasing order, have error components caused by the deviation of the video probe line of sight relative to the normal blade movement plane δ b i γ , the change in the reflection coefficient of the blade surface δ b i ρ , the distortion of the video probe lens δ b i D , the deviation of the radius of the controlled section δ b i R , the deviation of the distance δ b i z 0 , and the thermal deformation of the video probe housing δ b i Δ T .
It was theoretically proven that the integrated use of programmatically adaptive backlighting of the blade leading and trailing edges, system calibration using a transparent grid test object, the use of a probe positioning device, and the correction of results accounting for the thermal deformation of the housing allowed for a reduction in the total error δ b i from 1.05   mm to 0.29   mm , which meets the requirements of RJSC “UES of Russia”.
Experimental studies of the prototype of the optoelectronic system for monitoring rotor blade wear, which uses special positioning devices for the video probes, adaptive adjustment of the edge backlighting level, and result correction accounting for the probe housing temperature, showed that the standard deviation of the total chord measurement error δ b i in dynamic conditions (considering a prototype blade manufacturing error of 0.1   mm ) did not exceed 0.27   mm .
The results of this work form the basis for the development of the next generation of optoelectronic systems for online monitoring.

Author Contributions

Conceptualization, V.V.K., A.N.T., V.A.R. and M.B.M.; methodology, A.N.T., V.V.K., L.S.R. and T.S.D.; software, L.S.R., T.S.D. and S.N.Y.; investigation, L.S.R., V.A.R., S.N.Y. and A.N.T.; resources, V.V.K., M.B.M. and A.N.T.; writing—original draft preparation, L.S.R., T.S.D., V.A.R. and S.N.Y.; writing—review and editing, T.S.D. and M.B.M.; visualization, L.S.R., A.N.T. and V.A.R.; funding acquisition, V.V.K., A.N.T. and M.B.M. All authors have read and agreed to the published version of the manuscript.

Funding

This research was carried out within the state assignment of the Ministry of Science and Higher Education of the Russian Federation (project No. FSER-2024-0006) and was partially supported by NextGenerationEU under project No. BG-RRP-2.004-0005 at the Technical University of Sofia.

Data Availability Statement

Data are contained within the article.

Conflicts of Interest

The authors declare no conflicts of interest.

References

  1. Nazolin, A. Prevention of Accidents and Catastrophes in Rotating Equipment of Critical and Strategically Important Technosphere Facilities; Russian Academy of Sciences: Moscow, Russia, 2017. (In Russian) [Google Scholar]
  2. Liu, X.; Han, X.; Yin, G.; Song, X.; Cui, L. Design and Processing of Gas Turbine Blades Based on Additive Manufacturing Technology. Micromachines 2023, 14, 1675. [Google Scholar] [CrossRef] [PubMed]
  3. Yang, L.-J.; Tasupalli, C.; Wang, W.-C.; Lee, C.-Y.; Lee, C.-Y.; Athikary, K.G.; Wu, J.-X. Initial Study of the Onsite Measurement of Flow Sensors on Turbine Blades (SOTB). Micromachines 2024, 15, 877. [Google Scholar] [CrossRef] [PubMed]
  4. Peng, Y.; Xu, G.; Luo, X.; He, J.; Liu, D. Particle Deposition in the Vicinity of Multiple Film Cooling Holes. Micromachines 2022, 13, 523. [Google Scholar] [CrossRef] [PubMed]
  5. Bolat, F.C.; Sivrioglu, S. Active Control of a Small-Scale Wind Turbine Blade Containing Magnetorheological Fluid. Micromachines 2018, 9, 80. [Google Scholar] [CrossRef] [PubMed]
  6. Berci, G.; Forde, K.A. History of endoscopy. Surg. Endosc. 2000, 14, 5–15. [Google Scholar] [CrossRef] [PubMed]
  7. Shut, G.A.; Korotaev, V.V.; Puzyrev, E.I.; Ryzhova, V.A.; Timofeev, A.N.; Akhmerov, A.K.; Rodikova, L.S. Videoendoscopy of working blades of steam turbines and control of their geometrical parameters. J. Opt. Technol. 2020, 87, 677–683. [Google Scholar] [CrossRef]
  8. Lee, J.M.; Hwang, Y. A novel online rotor condition monitoring system using fiber Bragg grating (FBG) sensors and a rotary optical coupler. Meas. Sci. Technol. 2008, 19, 065303. [Google Scholar] [CrossRef]
  9. Pesatori, A.; Norgia, M.; Svelto, C. Optical Instrument for Real Time Monitoring of Steam Turbine Grinding. In Proceedings of the IEEE Instrumentation and Measurement Technology Conference, Ottawa, ON, Canada, 16–19 May 2008; pp. 1952–1955. [Google Scholar]
  10. Rodikova Liliana, S.; Viktorovich, K.V.; Timofeev, A.N.; Ryzhova, V.A.; Maraev, A. Selection of parameters of optoelectronic systems for monitoring the wear for steam turbine rotor blading based on the value of the total error. J. Sci. Tech. Inf. Technol. Mech. Opt. 2024, 24, 171–181. (In Russian) [Google Scholar] [CrossRef]
  11. Pesatori, A.; Norgia, M.; Svelto, C.; Pignone, E. Optical barrier and 4-quadrant imaging for contact-less detection of geometrical dimension of a steam turbine. In Proceedings of the IEEE International Workshop on Imaging Systems and Techniques, Chania, Greece, 10–12 September 2008; pp. 119–122. [Google Scholar]
  12. Simonov, V.; Kuzin, A. Optoelectronic vibration measurement system. In Proceedings of the 20th International Congress on Instrumentation in Aerospace Simulation Facilities, ICIASF’03, Gottingen, Germany, 25–29 August 2003; pp. 105–109. [Google Scholar]
  13. Procházka, P.; Vaněk, F. Contactless Diagnostics of Turbine Blade Vibration and Damage. J. Phys. Conf. Ser. 2011, 305, 011001. [Google Scholar] [CrossRef]
  14. Anisimov, A.; Gorbachyov, A.; Krasnyashchikh, A.; Pantushin, A.; Timofeev, A. Design and test of optoelectronic system of alignment control based on CCD camera. In Proceedings of the Fifth International Symposium on Instrumentation Science and Technology, Shenyang, China, 15–18 September 2008; SPIE: Bellingham, WA, USA; Volume 7133. [Google Scholar] [CrossRef]
  15. Pankov, E.; Prokofiev, A.; Tymofeev, A. Autocollimational optoelectronic system for monitoring of the position of elements of turbine aggregates. In Proceedings of the Second International Conference on Lasers for Measurement and Information Transfer, St. Petersburg, Russia, 6–8 June 2001; SPIE: Bellingham, WA, USA, 2002; Volume 4680. [Google Scholar]
  16. Leiner, D. Digital Endoscope Design; SPIE: Bellingham, WA, USA, 2015; Volume SL10. [Google Scholar]
  17. Geng, J.; Xie, J. Review of 3-D Endoscopic Surface Imaging Techniques. IEEE Sens. J. 2014, 14, 945–960. [Google Scholar] [CrossRef]
  18. Chichigin, B.; Groo, I. Development of a Compact High-Speed Measuring Defectoscopy System and Its Testing on Mock-Up Objects. Radiotekhnika Elektron. Radioengineering Electron. 2022, 67, 668–675. (In Russian) [Google Scholar]
  19. Lei, Y.; Cheng, Y.; Miller, S. A Flexible Endoscopic Machining Tool. Energy Procedia 2012, 16, 1033–1040. [Google Scholar] [CrossRef]
  20. Yong, Y.; Guiju, S.; Kevin, H. 3D Tracking for borescope inspections. In Proceedings of the SPIE Sensing Technology + Applications, Baltimore, MD, USA, 20–24 April 2015; SPIE: Bellingham, WA, USA, 2015. [Google Scholar] [CrossRef]
  21. Khaimov, V.; Kokin, E.; Puzyrev, E. Implementation of an Operational Monitoring and Diagnostic System for Erosion Wear of Blades in Powerful Steam Turbines. Energeticheskiye Stantsii Power Plants 2006, 12, 32–36. (In Russian) [Google Scholar]
  22. UES of Russia RAO. RD 153-34.1-17.462-00 Procedural Guidelines Assessment of Serviceability of Steam Turbine Blades in the Process of Manufacturing, Operation, and Repair; UES of Russia RAO: Moscow, Russia, 2000. [Google Scholar]
  23. Khaimov, V. Low-Flow Operating Modes of the Low-Pressure Cylinder of the T-250/300-240 Turbine; BHV-Petersburg: St. Petersburg, Russia, 2007; p. 240. (In Russian) [Google Scholar]
  24. Shut, G.; Puzyrev, E.; Vasiliev, V.A.A.; Nekrylov, I.; Akhmerov, A.; Timofeev, A. Comprehensive Endoscopy System for Monitoring Erosion Wear of Steam Turbine Blades. Izv. Vuzov. Priborostroenie High. Educ. Inst. Bull. Instrum. 2020, 63, 228–237. [Google Scholar]
  25. Leach, R. Abbe Error/Offset. In The International Academy for Production Engineering, CIRP Encyclopedia of Production Engineering; Laperrière, L.R.G., Ed.; Springer: Berlin/Heidelberg, Germany, 2014. [Google Scholar]
  26. Yakushenkov, Y. Theory and Calculation of Optoelectronic Devices: Textbook; Logos: Moscow, Russia, 2018. (In Russian) [Google Scholar]
  27. Salzenstein, P.; Pavlyuchenko, E. Uncertainty Evaluation on a 10.52 GHz (5 dBm) Optoelectronic Oscillator Phase Noise Performance. Micromachines 2021, 12, 474. [Google Scholar] [CrossRef] [PubMed]
  28. Sarvin, A. Systems for Contactless Measurement of Geometric Parameters; Leningrad State University: St. Petersburg, Russia, 1983. (In Russian) [Google Scholar]
  29. Bouguet, J.-Y. Camera Calibration Toolbox for Matlab. Available online: http://www.vision.caltech.edu/bouguetj/calib_doc/index.html (accessed on 7 January 2025).
  30. Shavrygina, M.; Konyakhin, I.; Timofeev, A.; Verezhinskaia, E. Optical-electronic system controlling the position of a railway track with the help of reference marks. In Proceedings of the Optical Modelling and Design IV, Brussels, Belgium, 5–7 April 2016; SPIE: Bellingham, WA, USA, 2016. [Google Scholar] [CrossRef]
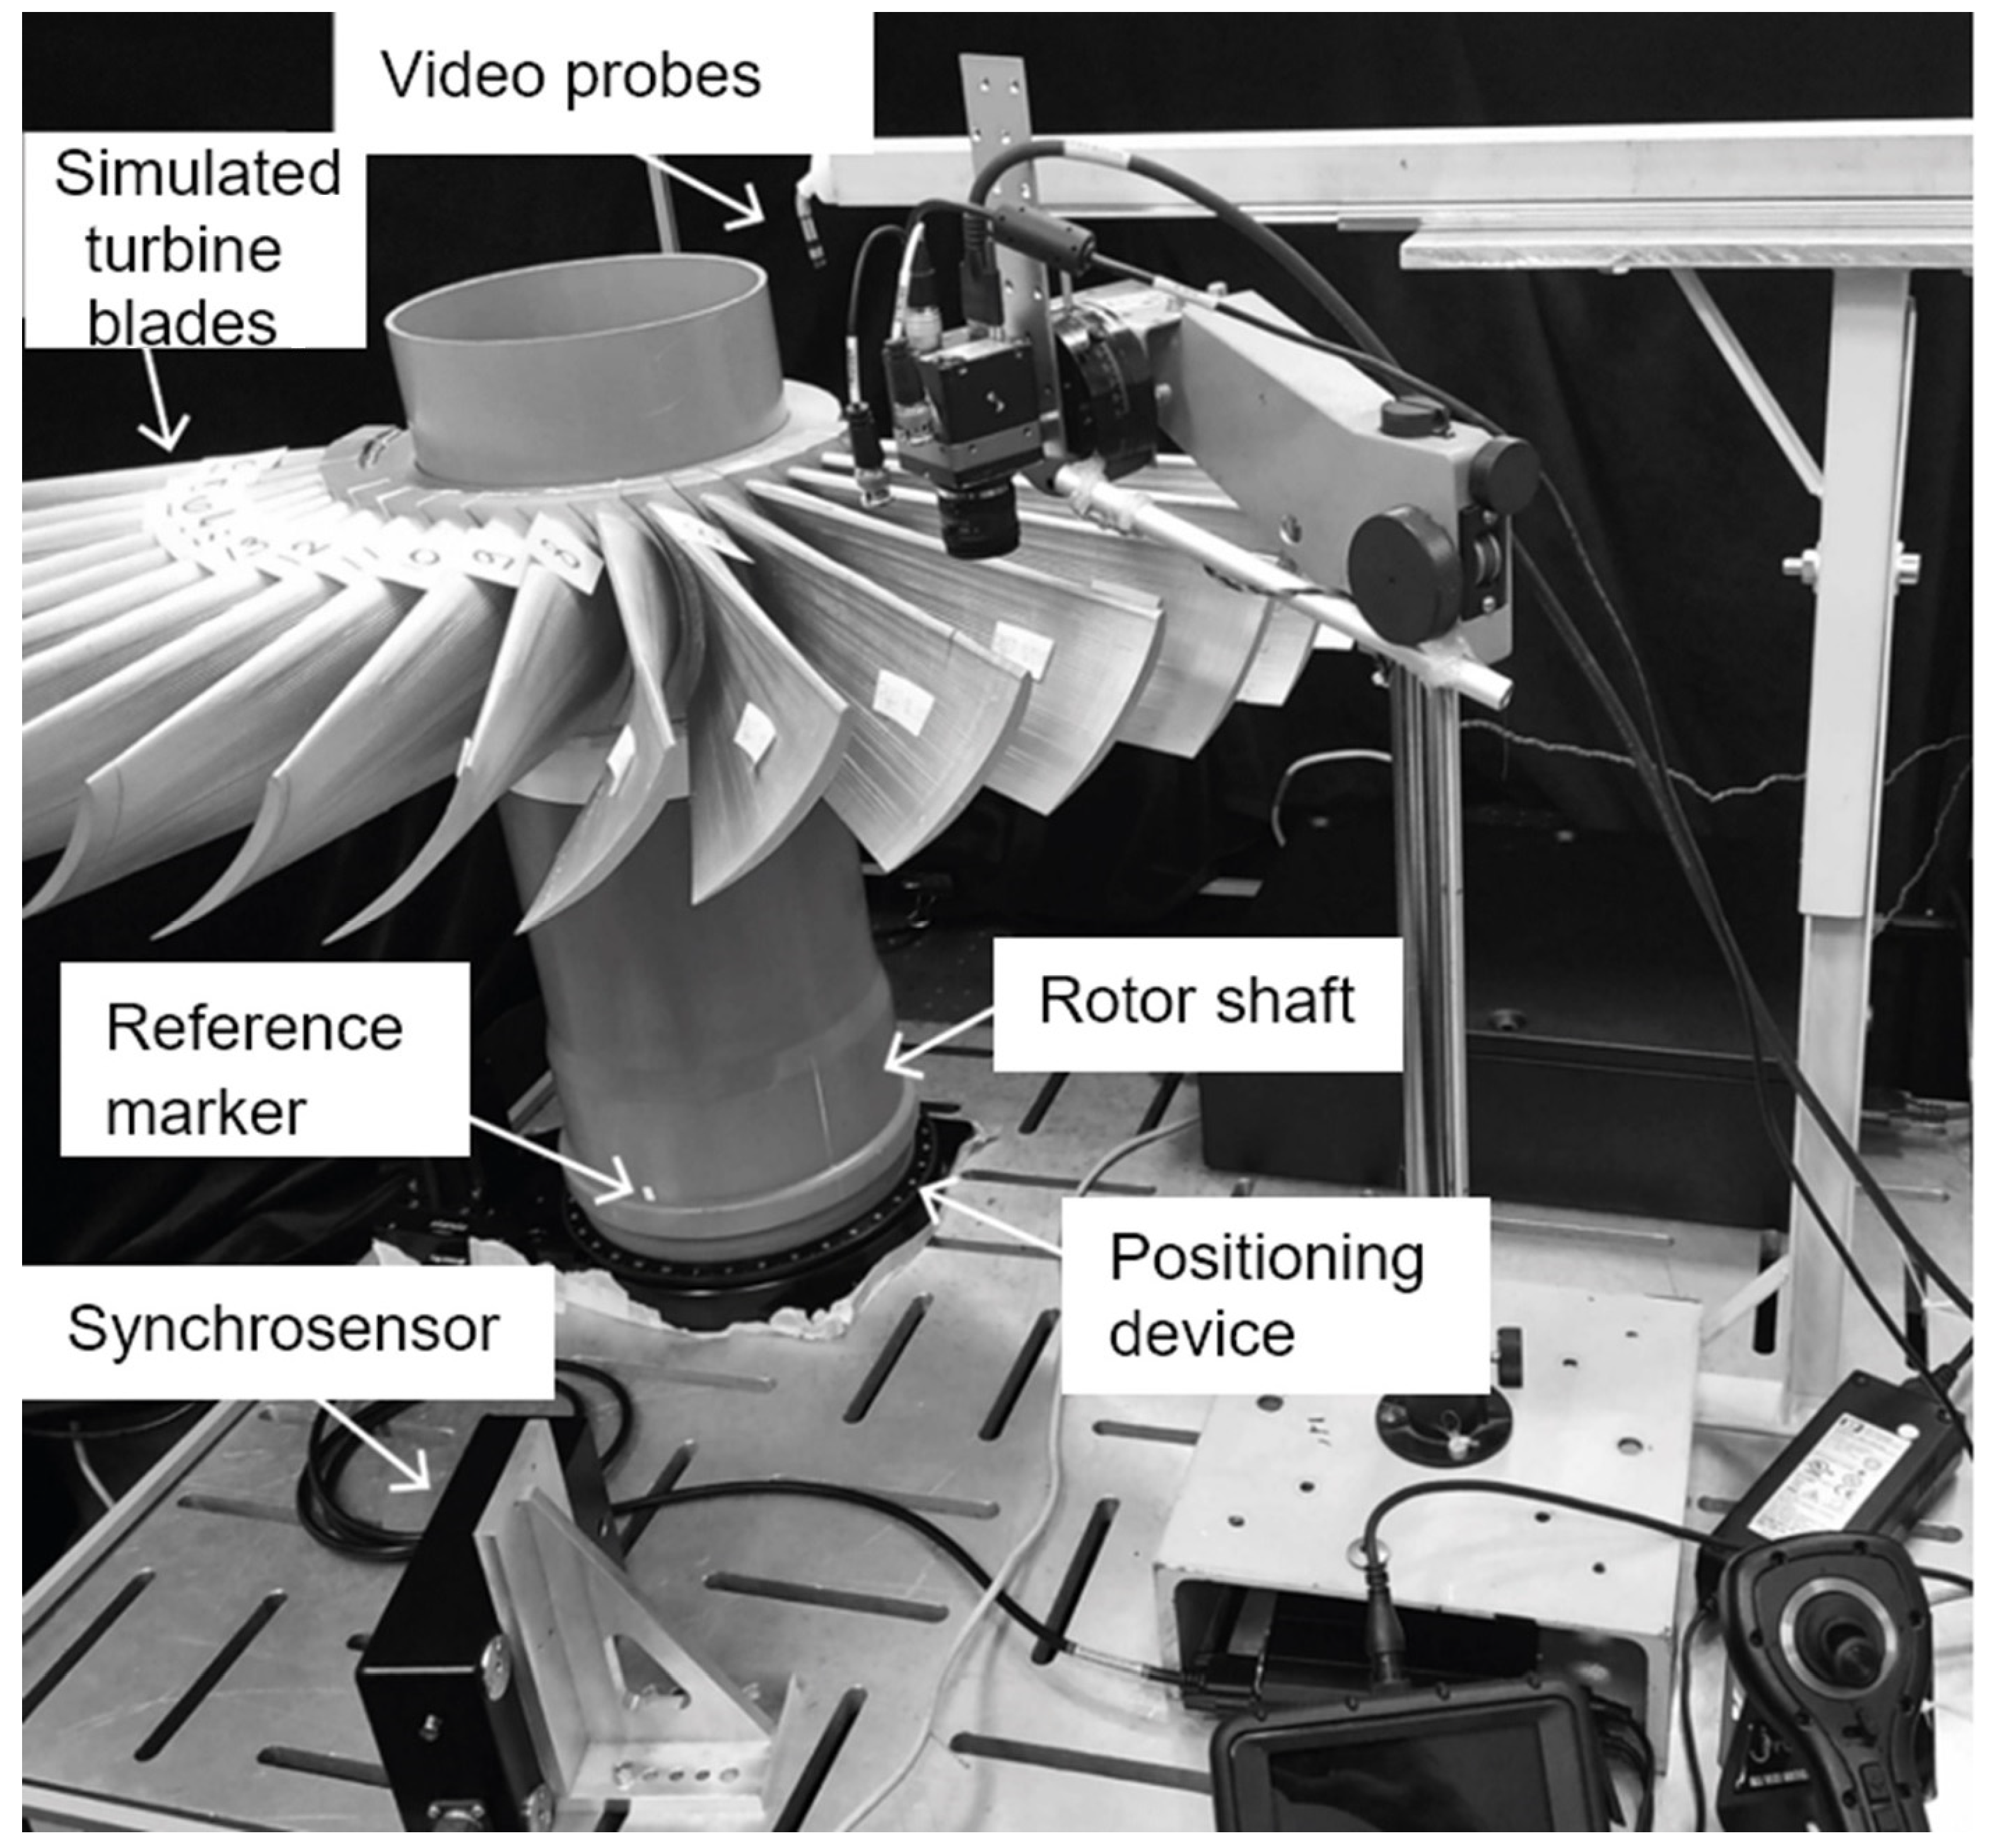
Figure 1. Experimental setup of the optoelectronic system for monitoring rotor blade wear.
Machines 13 00174 g001
Figure 2. Schematic of the ray path for forming projection B i of image b i , representing blade chord b i , on the photodetector plane. 1—Blade, 2—blade chord b i , 3 and 4—illumination sources for the trailing and leading edges, respectively, 5—video camera lens, 6—photodetector, 7—video camera, 8—blade chord image b i , 9—projection of the blade chord image B i on the photodetector plane, 10—video probe, A ,   C and A ,   C —leading and trailing edges of the blade and their respective images.
Machines 13 00174 g002
Figure 3. Graphs of the dependence of the standard deviation (SD) estimate of the total error in determining blade chord length δ b i and its components on distance z 0 in two cases: (a) before implementing measures to compensate for the most significant error sources and (b) after compensation and calibration.
Machines 13 00174 g003
Figure 4. The magnitude of image edge defocusing and the error δ b i s l in chord measurement as a function of blade section radii.
Machines 13 00174 g004
Figure 5. Component error diagrams for δ b i at distances z 0 = 70 mm (blue), 115 mm (red), and 150 mm (green).
Machines 13 00174 g005
Figure 6. Structural diagram of the test bench and prototype of the optoelectronic system for monitoring rotor blade wear.
Machines 13 00174 g006
Figure 7. Graph of the errors in the optoelectronic system caused by the instability of the synchro transducer δ b i S S for N 1 synchro transducer positions in static conditions (a) and the result of the standard deviation of the chord length measurement δ b i for each blade, obtained dynamically using the following video probes: (1) Megion 3325 and (2) SATEKO ME-0-FT2A2S-6.0-X (b).
Machines 13 00174 g007
Disclaimer/Publisher’s Note: The statements, opinions and data contained in all publications are solely those of the individual author(s) and contributor(s) and not of MDPI and/or the editor(s). MDPI and/or the editor(s) disclaim responsibility for any injury to people or property resulting from any ideas, methods, instructions or products referred to in the content.