Article

Artificial Neural Network-Based Structural Analysis of 3D-Printed Polyethylene Terephthalate Glycol Tensile Specimens

by
Athanasios Manavis
,
Anastasios Tzotzis
,
Lazaros Firtikiadis
and
Panagiotis Kyratsis
*
Department of Product and Systems Design Engineering, University of Western Macedonia, 50100 Kila Kozani, Greece
*
Author to whom correspondence should be addressed.
Machines 2025, 13(2), 86; https://doi.org/10.3390/machines13020086
Submission received: 27 December 2024 / Revised: 12 January 2025 / Accepted: 21 January 2025 / Published: 23 January 2025
(This article belongs to the Section Advanced Manufacturing)

Abstract

:
Materials are a mainstay of both industry and everyday life. The manufacturing and processing of materials is a very important sector as it affects both the mechanical properties and the usage of the final products. In recent years, the increased use of 3D printing and, by extension, its materials have caused the creation of gaps in terms of strength that require further scientific study. In this study, the influence of various printing parameters on 3D-printed specimens made of polyethylene terephthalate glycol (PETG) polymer was tested. More specifically, three printing parameters were selected—infill, speed, and type—with three different values each (50%, 70%, and 90%), (5 mm/s, 20 mm/s, and 35 mm/s) and (Grid, Rectilinear, and Wiggle). From the combinations of the three parameters and the three values, 27 different specimens were obtained and thus, 27 equivalent experiments were designed. The measurements were evaluated, and the process was modeled with the Artificial Neural Network (ANN) method, revealing a strong and robust prediction model for the tensile test, with the relative error being below 10%. Both infill density and infill pattern were identified as the most influential parameters, with the Wiggle type being the strongest pattern of all. Additionally, it was found that the infill density acts increasingly on the strength, whereas the printing speed acts decreasingly.

1. Introduction

The Fused Filament Fabrication (FFF) technology is one of the most well-known additive manufacturing (AM) technologies. Thanks to its ability to create unusual geometries in a relatively short time and at low cost, it finds application in many areas of industry, from the manufacture of wearables [1], furniture [2], functional components [3], and even architectural structures [4]. More and more studies are being carried out and dealing with the technology of FFF. It is either compared to conventional production methods (injection molding), or the potential and limitations of the mechanical properties of its materials are tested. Depending on the desired result through 3D printing, different materials are used. The most popular of these are PLA, ABS, and TPU [5,6,7], while in recent years, efforts have been made to recycle and reuse these materials (PLA-r and ABS-r) [8,9,10,11]. Additionally, a thermoplastic elastomer increasingly used in 3D printing is polyethylene terephthalate glycol (PETG). The main concern of the researchers is the improvement of additive manufacturing technology, with the specific material, for its more effective and wider use.
During studies, for the control and validity of the tests, the researchers relied on ASTM standards, applying well-known methods such as Taguchi [12], K-means cluster, or the finite element method (FEM) [13]. The most common optimization procedures that will be mentioned in the following studies focus on tensile, compression, and bending tests (as well as their combination) for the PETG material. Hanon et al. [14] investigated the mechanical properties of polyethylene terephthalate glycol (PETG) in tensile test specimens. The parameters of the print concerned its orientation (in the X, Y, and Z axes), the direction angles of the raster, five different patterns, and their percentage of filling. After the tensile tests, the resulting diagrams were studied to draw conclusions. Özen et al. [15] studied the properties of the PETG material in order to understand its characteristics. The control samples were based on the ISO 527-2 [16] and ASTM D3039 [17] standards and were tested in two ways. First, they were tested digitally through the finite element method (FEM) and then through tensile testing, after being manufactured with 3D printing technology. Dolzyk et al. [18] examined the anisotropy of the mechanical properties of polyethylene terephthalate glycol (PETG) through tensile tests. The main parameter studied was the representation of the raster orientations. The results of their strength and elasticity proved that PETG shows little anisotropy and competitive mechanics compared to other materials used in 3D printing.
Colmenero et al. [19] studied the mechanical properties of PETG during compression tests. With the ISO-604 [20] standard and an innovative structural design, based on the CTE standard, the mechanical strength of the samples was evaluated according to their printing direction. Depending on their construction directions, on the X, Y, and Z axes, different deformations and resistances during their uniaxial compression loads were observed. At the same time, in comparison with the numerical measurements, PETG was found to be an isotropic material. Corresponding research results, which study the isotropy of PETG during the compression test, are available in the literature [21,22].
Aberoumand et al. [23] studied PETG samples with bending tests and drew some conclusions about this polymer material. Its behavior under this control method, in terms of shape recovery and self-shaping, largely depends on the parameters set (mainly the temperature and the printing speed). Durgashyam et al. [24] investigated the strength of the printed PETG polymer in bending and tensile testing. Specific parameters were taken into account to find the effectiveness of the controls. Fill density, feed rate, and layer thickness were selected. In parallel with the use of analysis of variance (ANOVA), the optimal values for the mechanical properties of the material were obtained.
Additionally, due to the increasing demand for synthetic PETG for greater efficiency, the mechanical properties of the material were also investigated, with reinforcement from other materials, such as PGA and glass fibers [25,26]. Alarifi et al. [27] used carbon fibers to enhance the mechanical properties of PETG. The properties were tested in terms of tension, bending, and compression. The 3D printing parameters chosen were pattern, fill rate, and layer thickness. It is important for the research that the numerical simulation carried out was consistent with the experimental results. Valvez et al. [28] performed compression tests on PETG polymer material reinforced with carbon fibers and aramid fibers. The specific materials are suitable for use in the automotive and aeronautical sectors. Their mechanics were altered, strongly reducing the resistance to compression and compressive displacements. Valvez et al. [29] focused on the optimization of printing parameters, aiming to maximize the mechanical properties of PETG reinforced with plant fibers and aramid fibers in a bending test. The printing parameters selected were printing speed, layer height, nozzle temperature, and fill percentage. In addition, the Taguchi method was followed for the experiments, while the analysis of variance (ANOVA) proved the validity of the results. Ranganathan et al. [30] dealt with the type of filling pattern in PETG specimens reinforced with carbon fibers. Through the tensile, bending, and hardness tests, the optimal filling pattern was found among mesh, straight, honeycomb, and cubic. In this way, the possibility of using the reinforced polymer in various components is highlighted. Moreover, the use of sodium chlorate powder helps to improve the mechanical properties of parts that are 3D-printed with the PETG polymer material. More specifically, to achieve this, samples with 100% filling and a different printing direction were placed in a space with sodium chloride powder. The results after heat treatment showed a significant improvement in tensile and compressive strength. Moreover, the evaluation of the internal structures in SEM proved the same [31,32].
In addition, beyond the research on the mechanical properties of reinforced PETG with other materials, PETG was also compared with the most popular materials that are used in 3D printing (PLA, ABS, PC, and ASA). Tensile, compression, and bending tests are carried out under specific conditions and printing parameters in order to have more accurate data of the 3D printing materials for their possible applications in the improved manufacturing quality of parts [33,34,35,36]. Finally, an application of using the PETG polymer material could be the creation of 3D-printed furniture joints [37]. In parallel with the design method of parametric design, it is possible to generate alternative geometries of parts through parameters that would be defined by the user. The number and positions of the links could be generated through an automated process [38,39].
Even though numerous studies related to the mechanical property evaluation of 3D-printed specimens are available, a literature survey revealed that the majority of these studies are based on statistical methodologies or FEM tools. Therefore, a gap in the methodology implementation was identified, enabling the utilization of the Artificial Neural Network (ANN) method. In this study, the degree of influence of specific printing parameters on the tensile strength of 3D-printed specimens was investigated. Infill, Speed, and Type were the selected printing parameters. In the Infill parameter, the values were set to 50%, 70%, and 90%; in the Speed parameter, the parameters were 5 mm/s, 20 mm/s, and 35 mm/s. Finally, for the Type parameter, the values were set to Grid, Rectilinear, and Wiggle.

2. Material and Methods
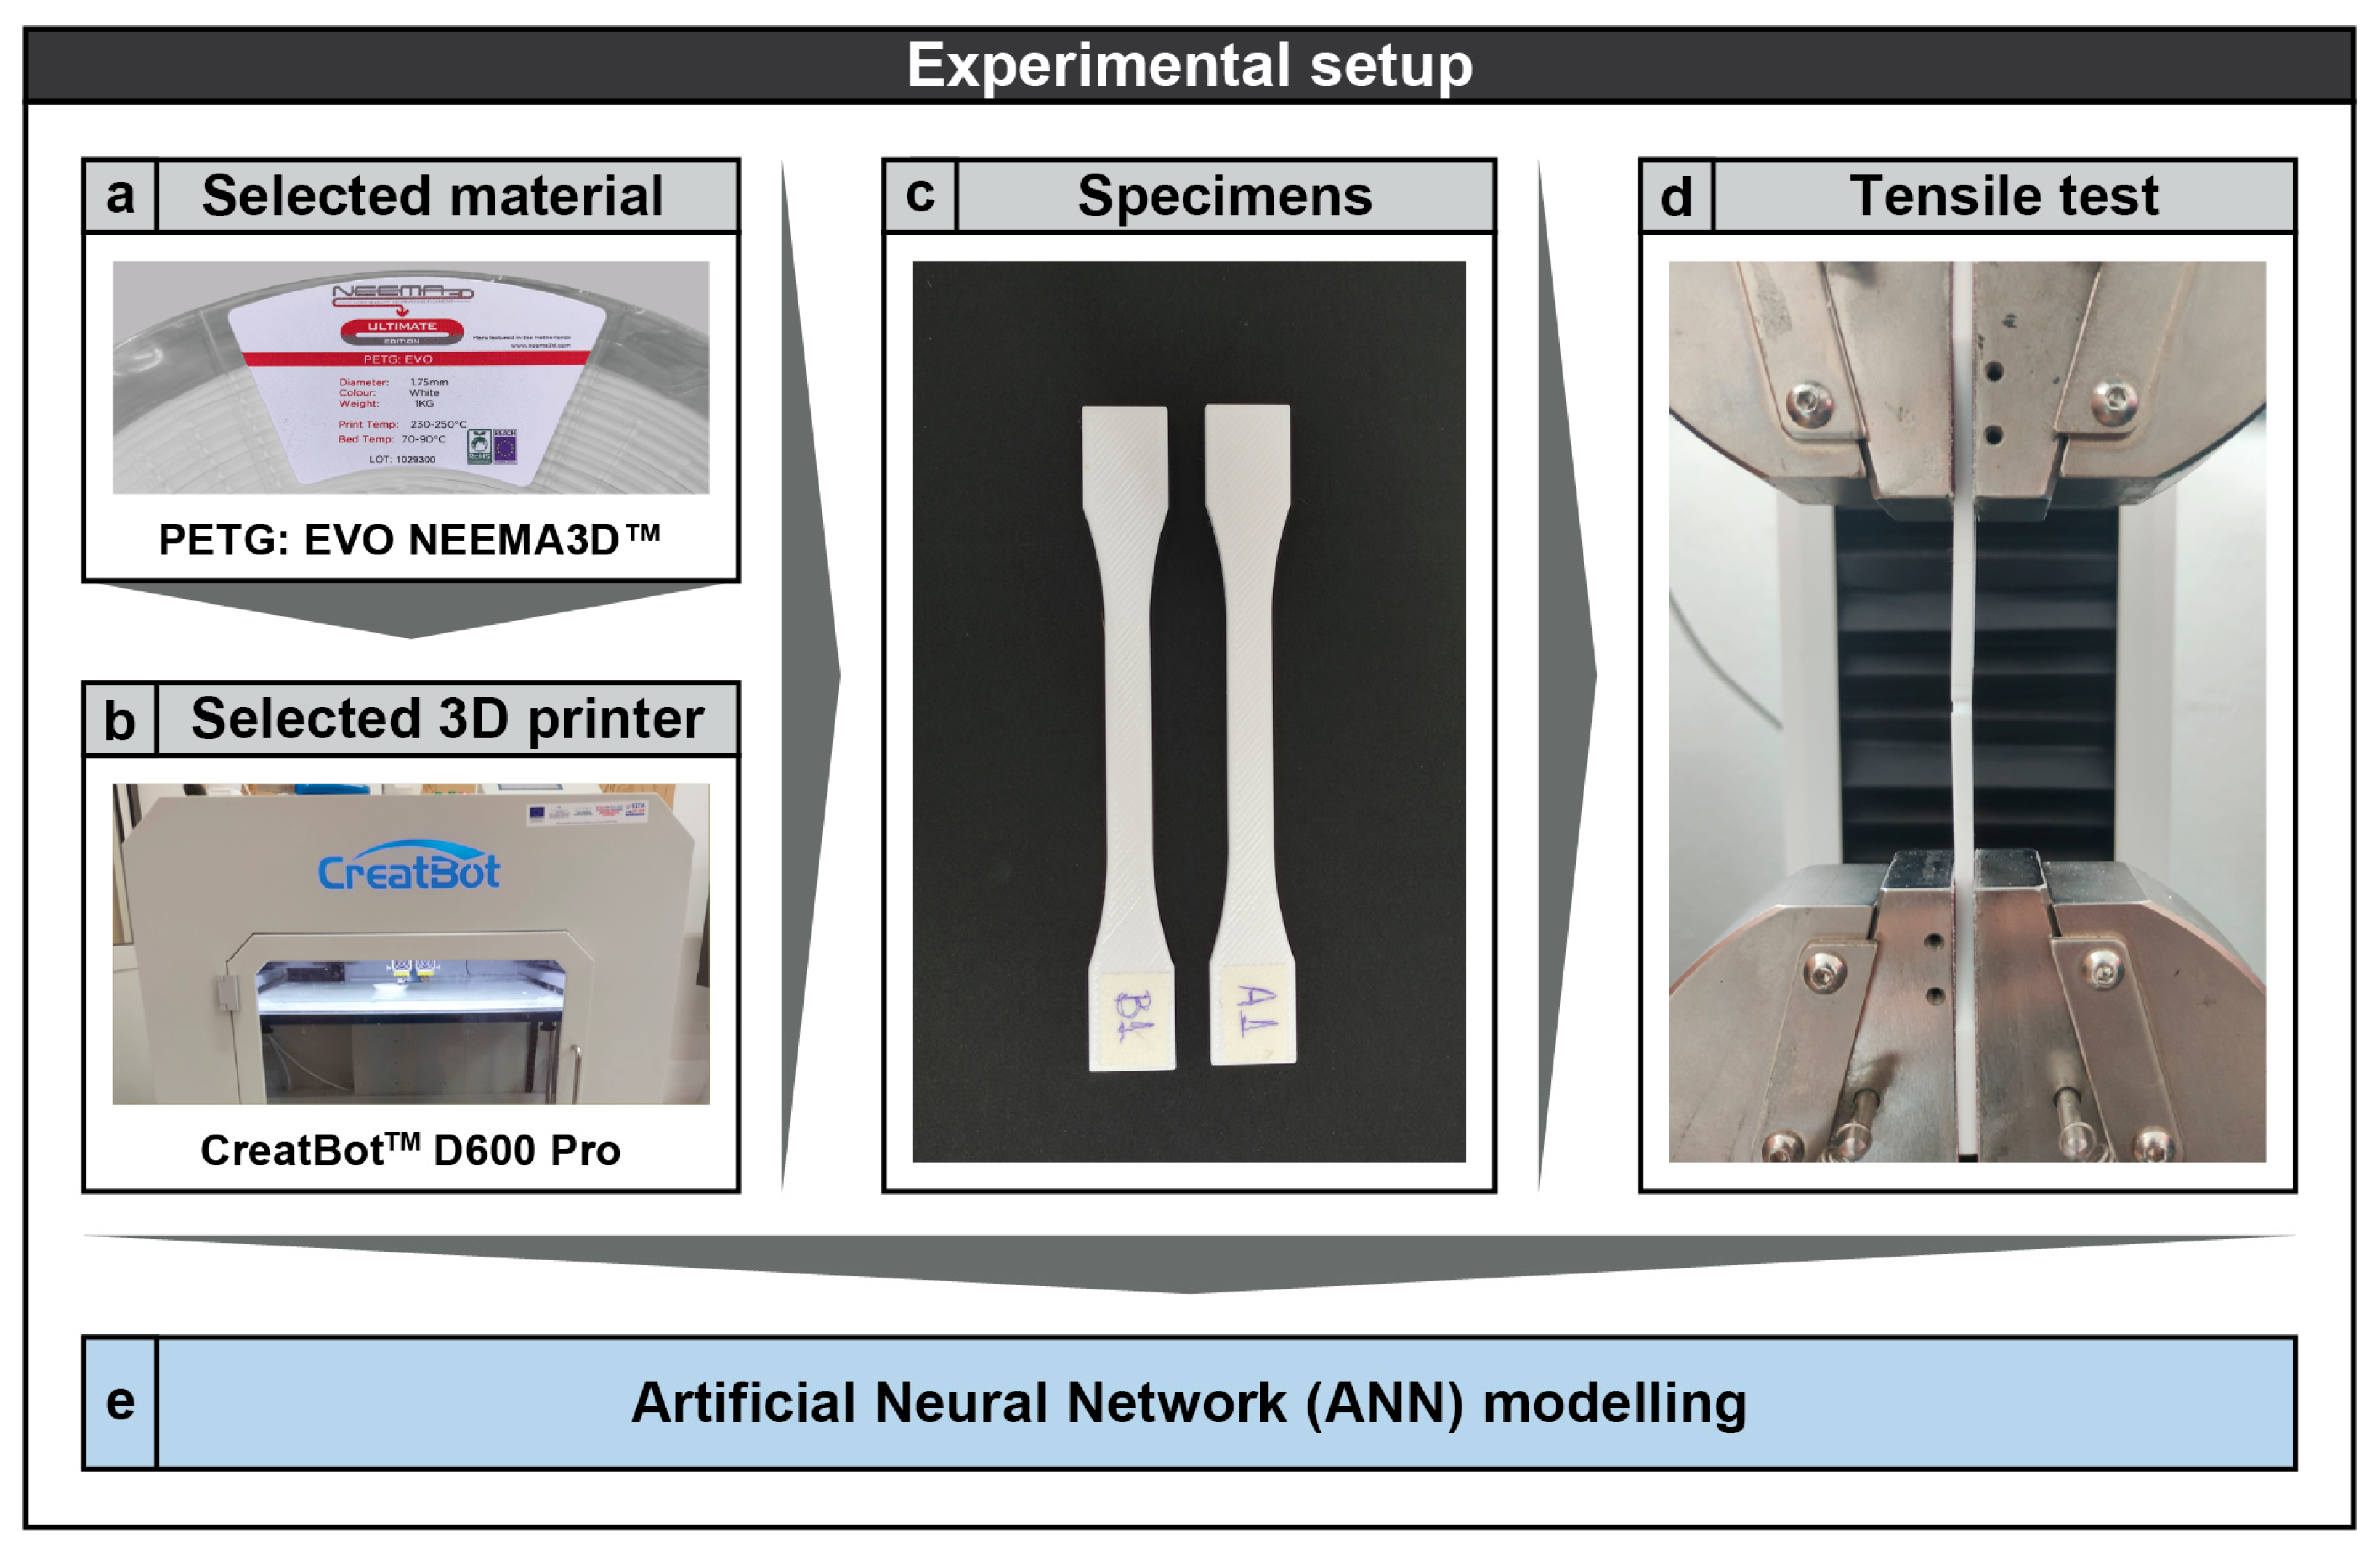
2.1. Study Workflow

In this study, tensile specimens were printed using 3D printing and were then tested and evaluated. Specifically, three printing parameters were selected in order to change their values. Printing parameters play an important role in the strength of the final printed objects. Based on the three levels of the different values selected, the combinations of settings were printed in each specimen separately. The workflow of the study is based on the following five stages:
(a)
Selected material;
(b)
Selected 3D printer;
(c)
Specimens;
(d)
Tensile test;
(e)
Artificial Neural Network (ANN) modeling.
At this point, a detailed description is given for each of the five stages of the study. The following information is illustrated in Figure 1.
(a)
The material chosen in the study was PETG: EVO (NEEMA3D™, Athens, Greece). It is a polyethylene terephthalate glycol polymer with a filament diameter of 1.75 mm. According to the manufacturer, the tensile strength is measured at 50 MPa, while its net weight is 1.27 g/cc.
(b)
The 3D printer used in the study was the CreatBotTM D600 Pro (Henan Creatbot Technology Limited, Zhengzhou, China). The printing area is relatively large (X = 600 mm, Y = 600 mm, and Z = 600 mm). This particular printer is of the closed type; as a result, it maintains stable conditions during printing. A significant advantage over smaller printers is that the large printing area allows for the construction of all specimens at the same time.
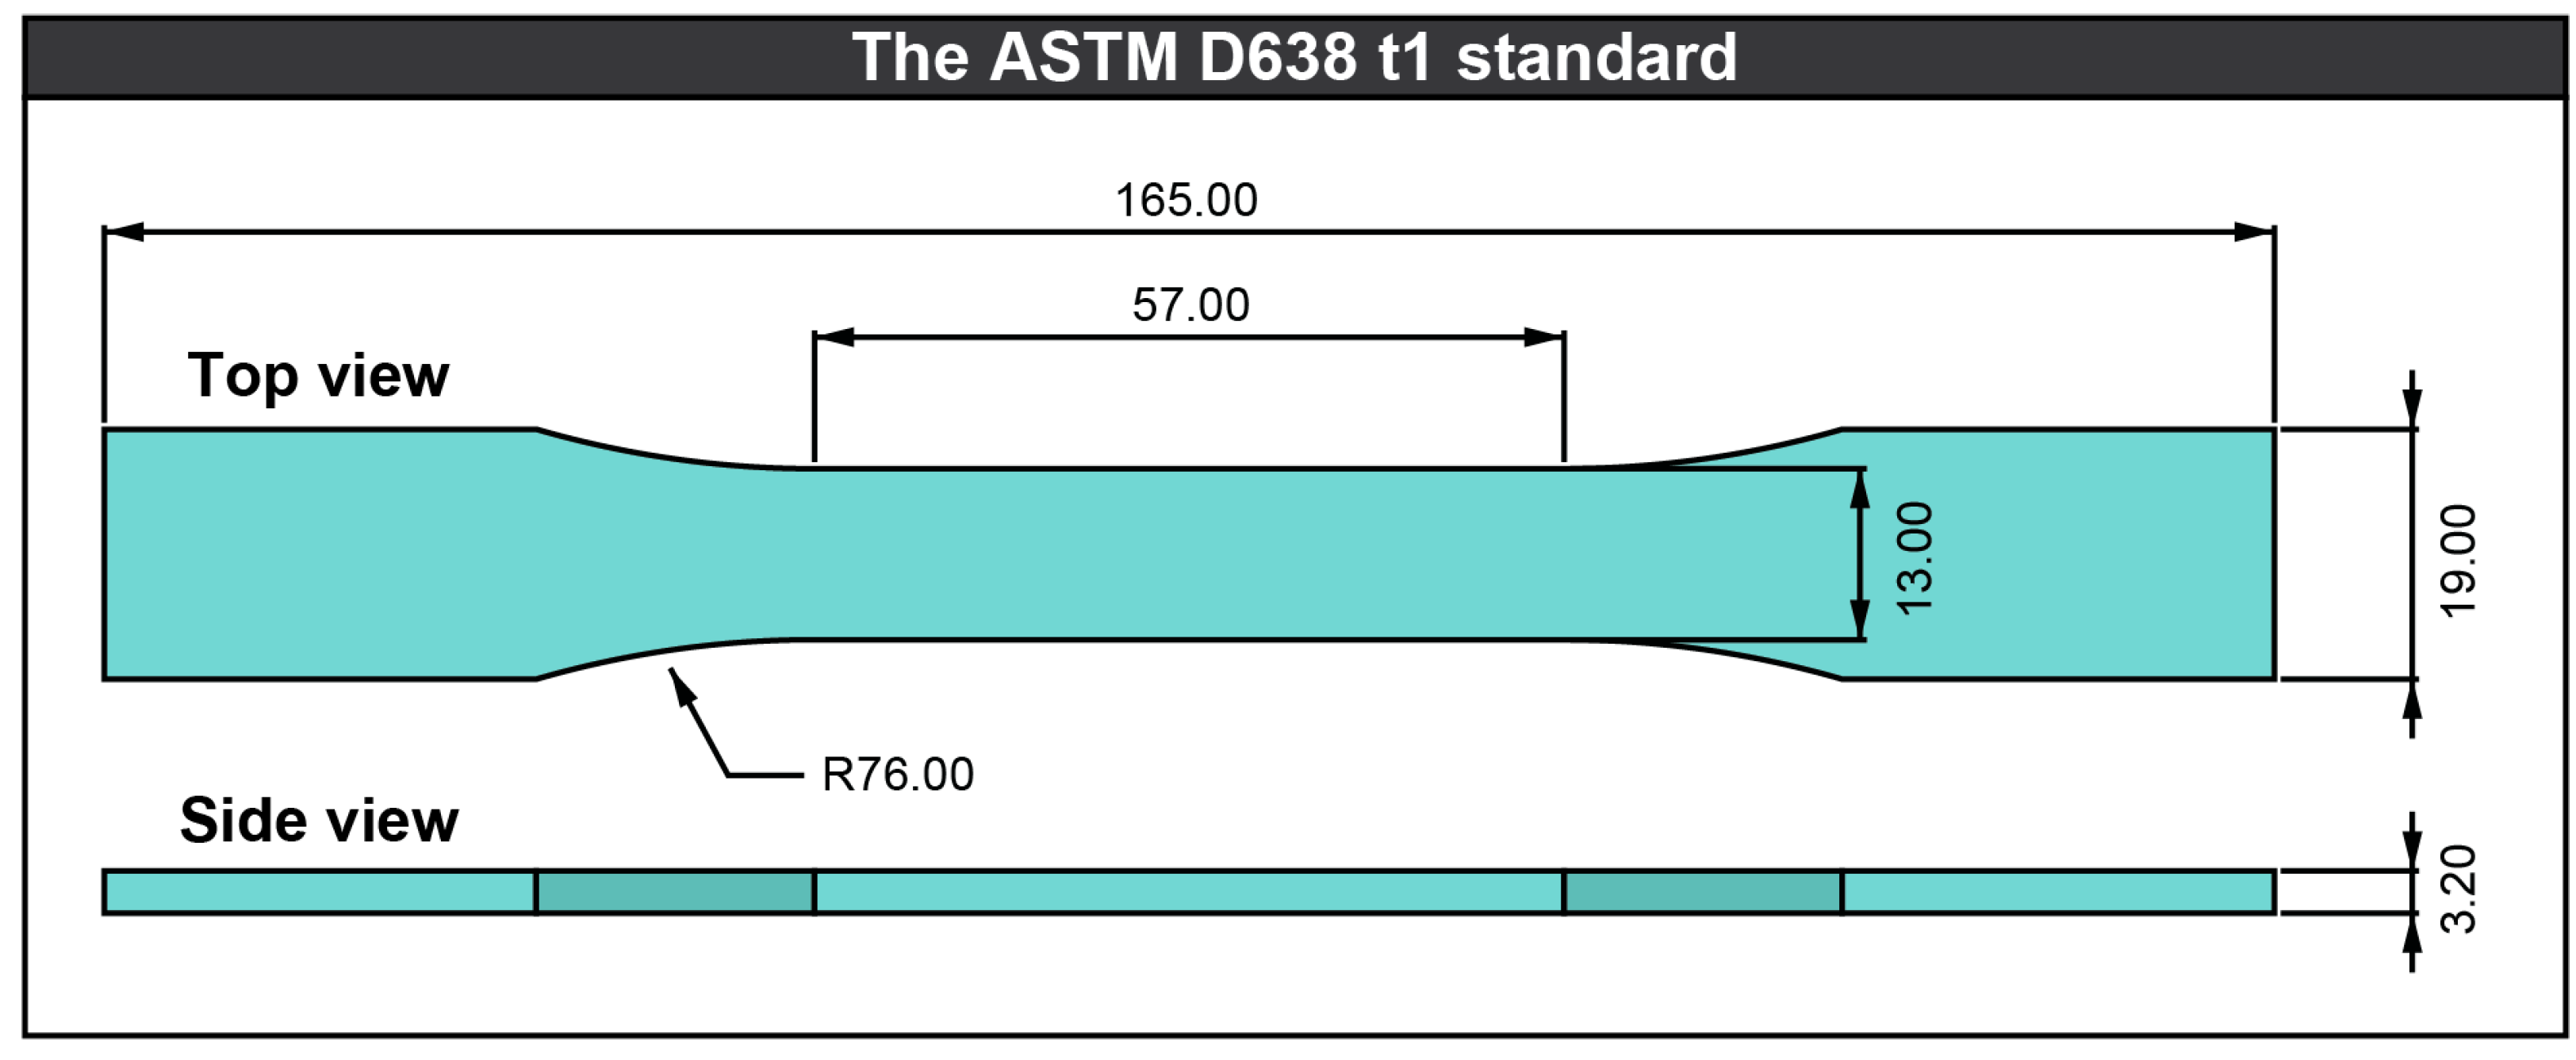
(c)
Based on three different values for each of the three printing parameters, 27 different specimens were constructed. Each specimen used a different combination of values of the variable parameters. For the increased reliability of the study, the 27 specimens with different combinations were printed twice so that the measurement results could be evaluated according to the average of each pair.
(d)
The printed specimens were tested in tensile stress to measure their strength. Specifically, the InstronTM 3345 universal testing machine (Instron, Norwood, MA, USA) was used in the tests. The maximum tension that the machine can exert is 5 kN, while the available space for specimens has a height of 1123 mm. According to the manufacturer, the maximum and minimum speed of the grips are 500 mm/min and 0.05 mm/min, respectively.
(e)
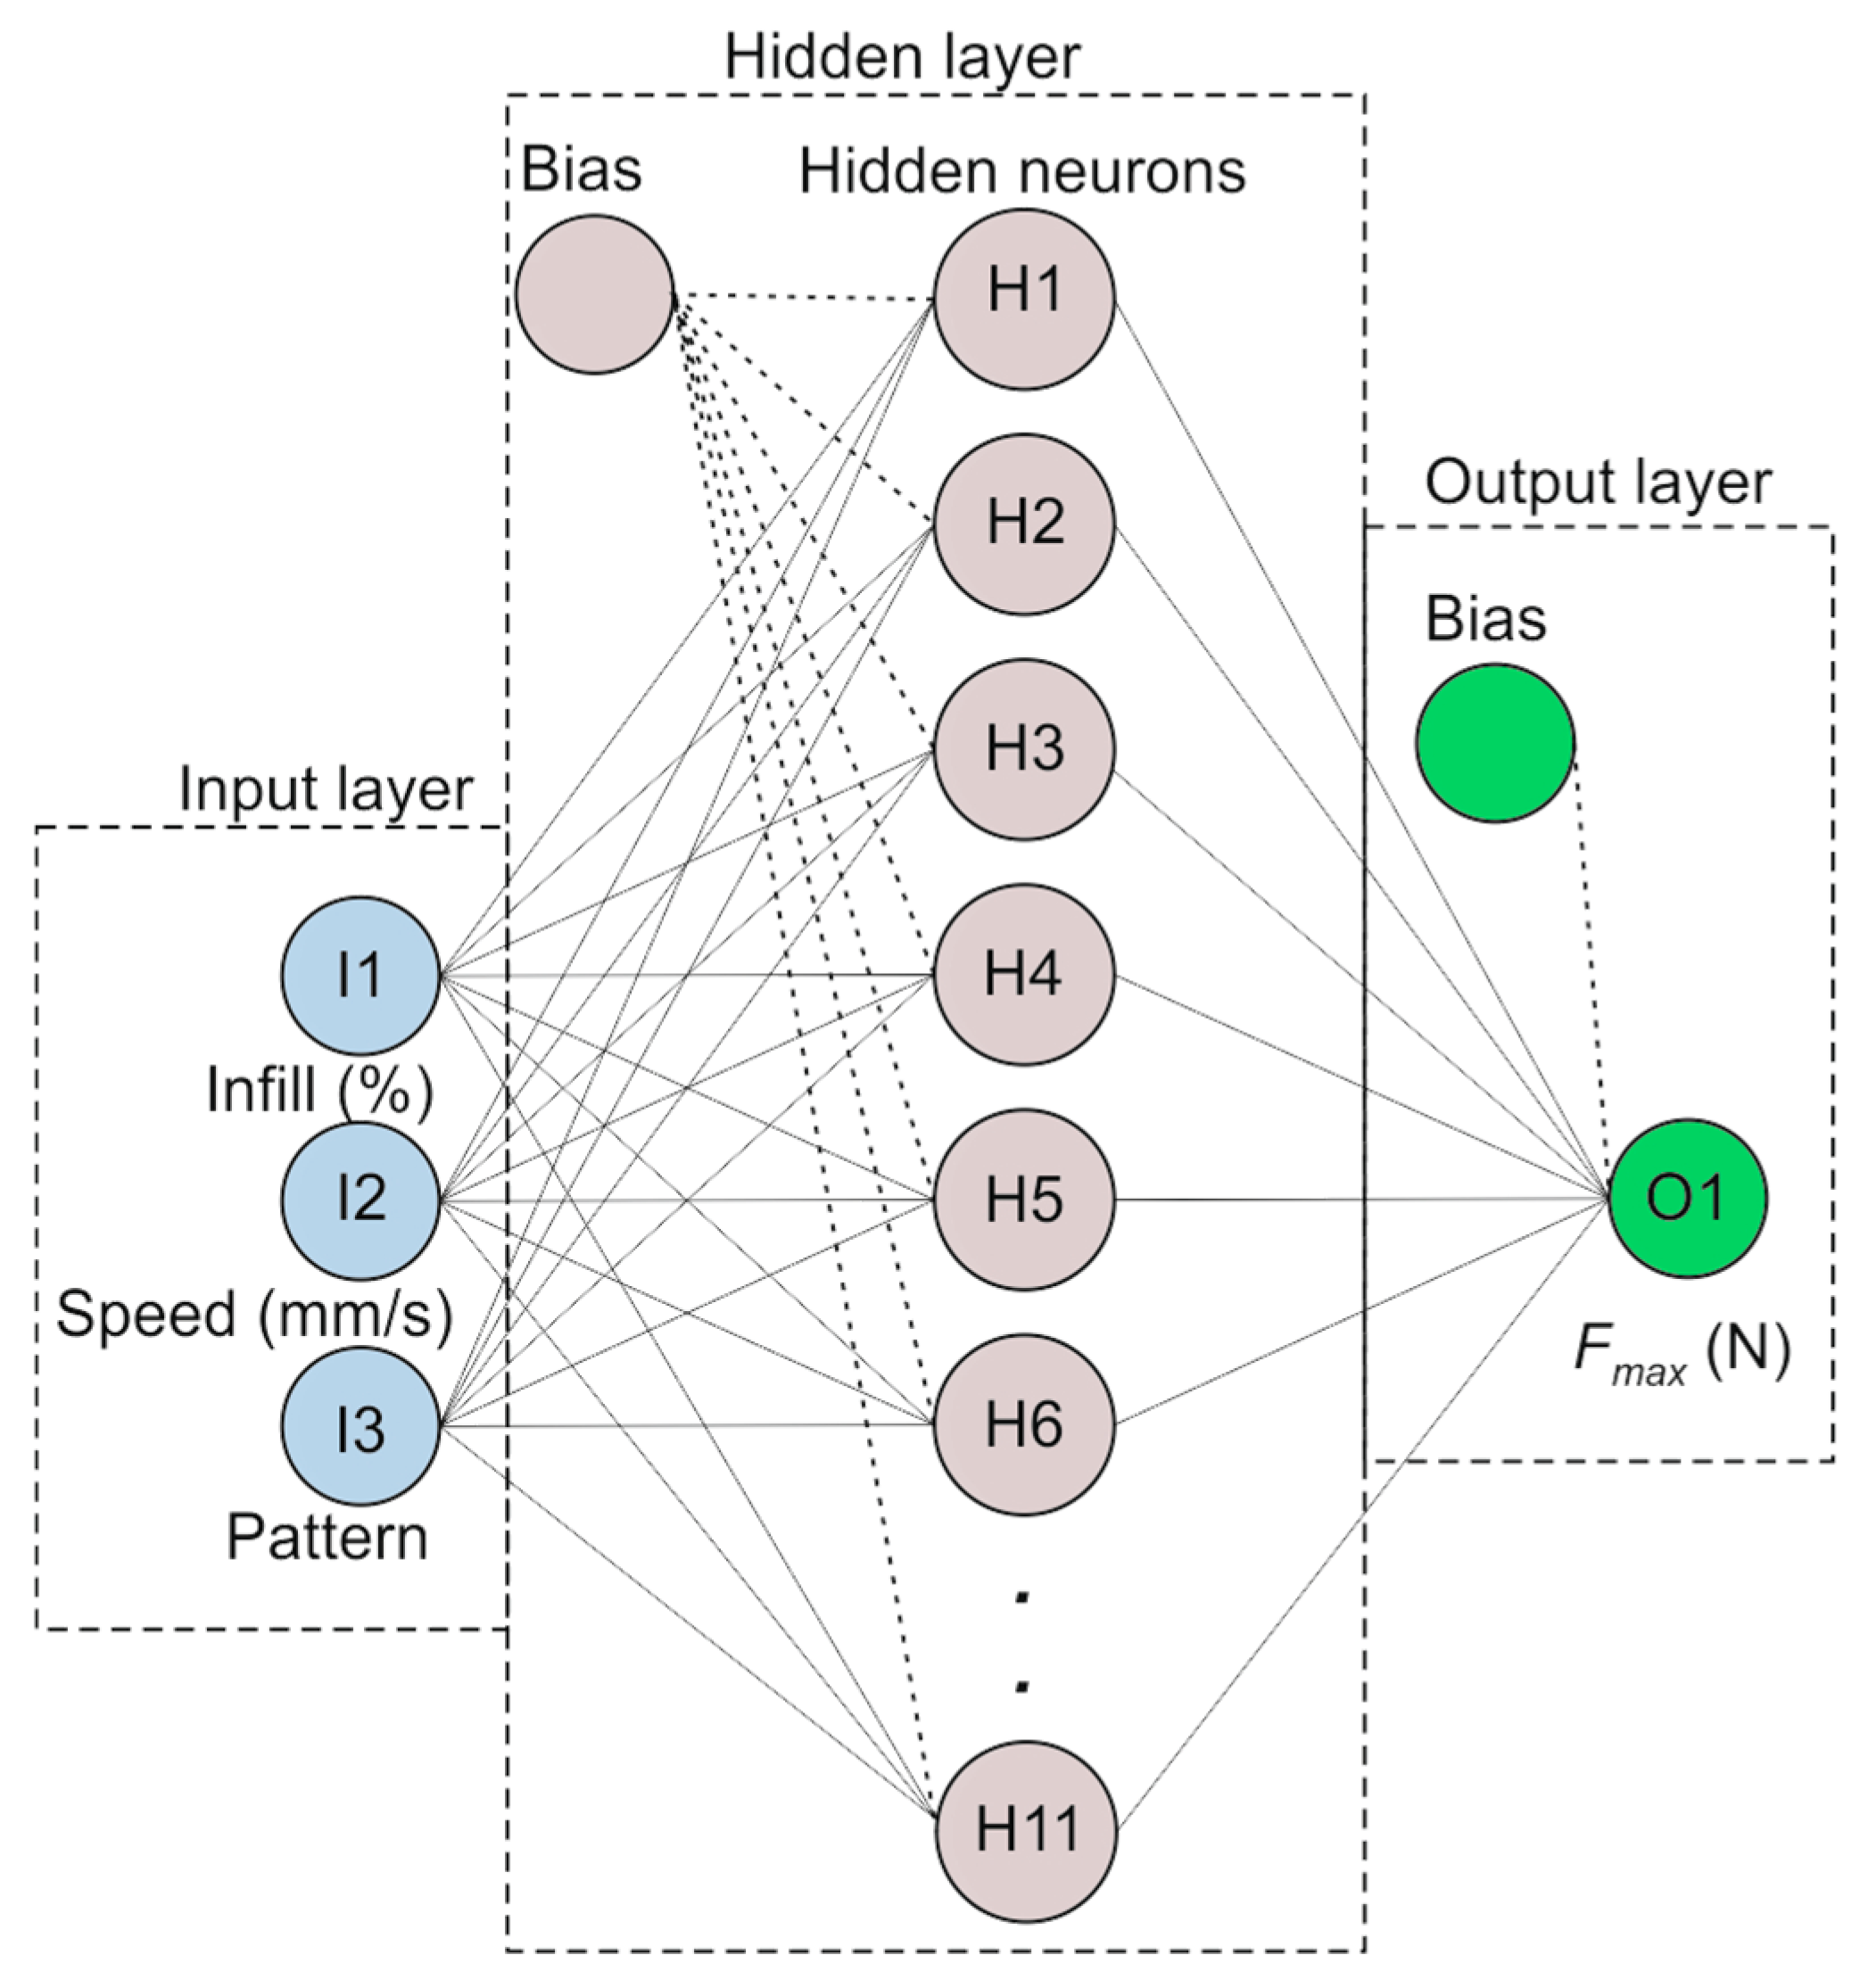
The results of the tensile tests were evaluated using an Artificial Neural Network (ANN) model. ANNs are structures used for processing parallel distribution data. The mode of operation of this specific mathematical model is based on the mode of operation of the human brain. ANN modeling accepts data, processes them, and finally outputs the results of the analysis.
The specimen’s geometry was created using a general purpose three-dimensional CAD (computer-aided design) software. The dimensions of the specimen were based on type 1 of the ASTM D638 t1 standard [40]. The basic dimensions of the specimen were 165 mm, 19 mm, and 3.2 mm for the X, Y, and Z axes. The size of the area to be tested had dimensions of 57 mm, 13 mm, and 3.2 mm. The vertical area according to the direction of the tensile force was 41.6 mm2 (13 mm × 3.2 mm = 41.6 mm2). The main dimensions of the specimen from two different angles are presented in Figure 2.
As previously stated, 3D printing necessitates the specification of various parameters/settings, including temperature, speed, and layer height. These parameters influence the final printing output. In this study, the focus was on controlling three specific printing parameters, which means that for the rest of the parameters, specific values were assigned. Table 1 presents the set of constant printing parameters used. The initial parameter was the layer height, which was set at 0.2 mm. This refers to the thickness of each layer in the print, with 0.2 mm being the average value utilized. The second parameter was the extrusion temperature, which is the temperature at which the material melts. The value of the extrusion temperature was set to 240 °C. The third parameter was the bed temperature, which pertains to the temperature of the print bed. A value of 80 °C was selected. Both the extrusion temperature and bed temperature were established according to the specifications provided by the material manufacturer. The fourth parameter was cooling, which was set to 100%. Cooling is the percentage speed of the fan blowing over the printed material. Finally, the fifth parameter was shell thickness, which was set at 1.2 mm. This parameter indicates the thickness of the wall, which is a multiple of the nozzle diameter. Given that the nozzle diameter was 0.6 mm, the two perimeter paths on the wall resulted in a total thickness of 1.2 mm. The last printing parameter was support structures, which were not utilized based on the chosen geometry.
At this stage, the three printing parameters chosen for the experimentation will be presented. More specifically, Infill, Speed, and Type were the parameters altered during the experiments (Table 2). The first two parameters were quantitative; thus, numerical values were used. In contrast, the third parameter was qualitative, so various printing techniques based on geometric references were used, rather than numerical expressions.
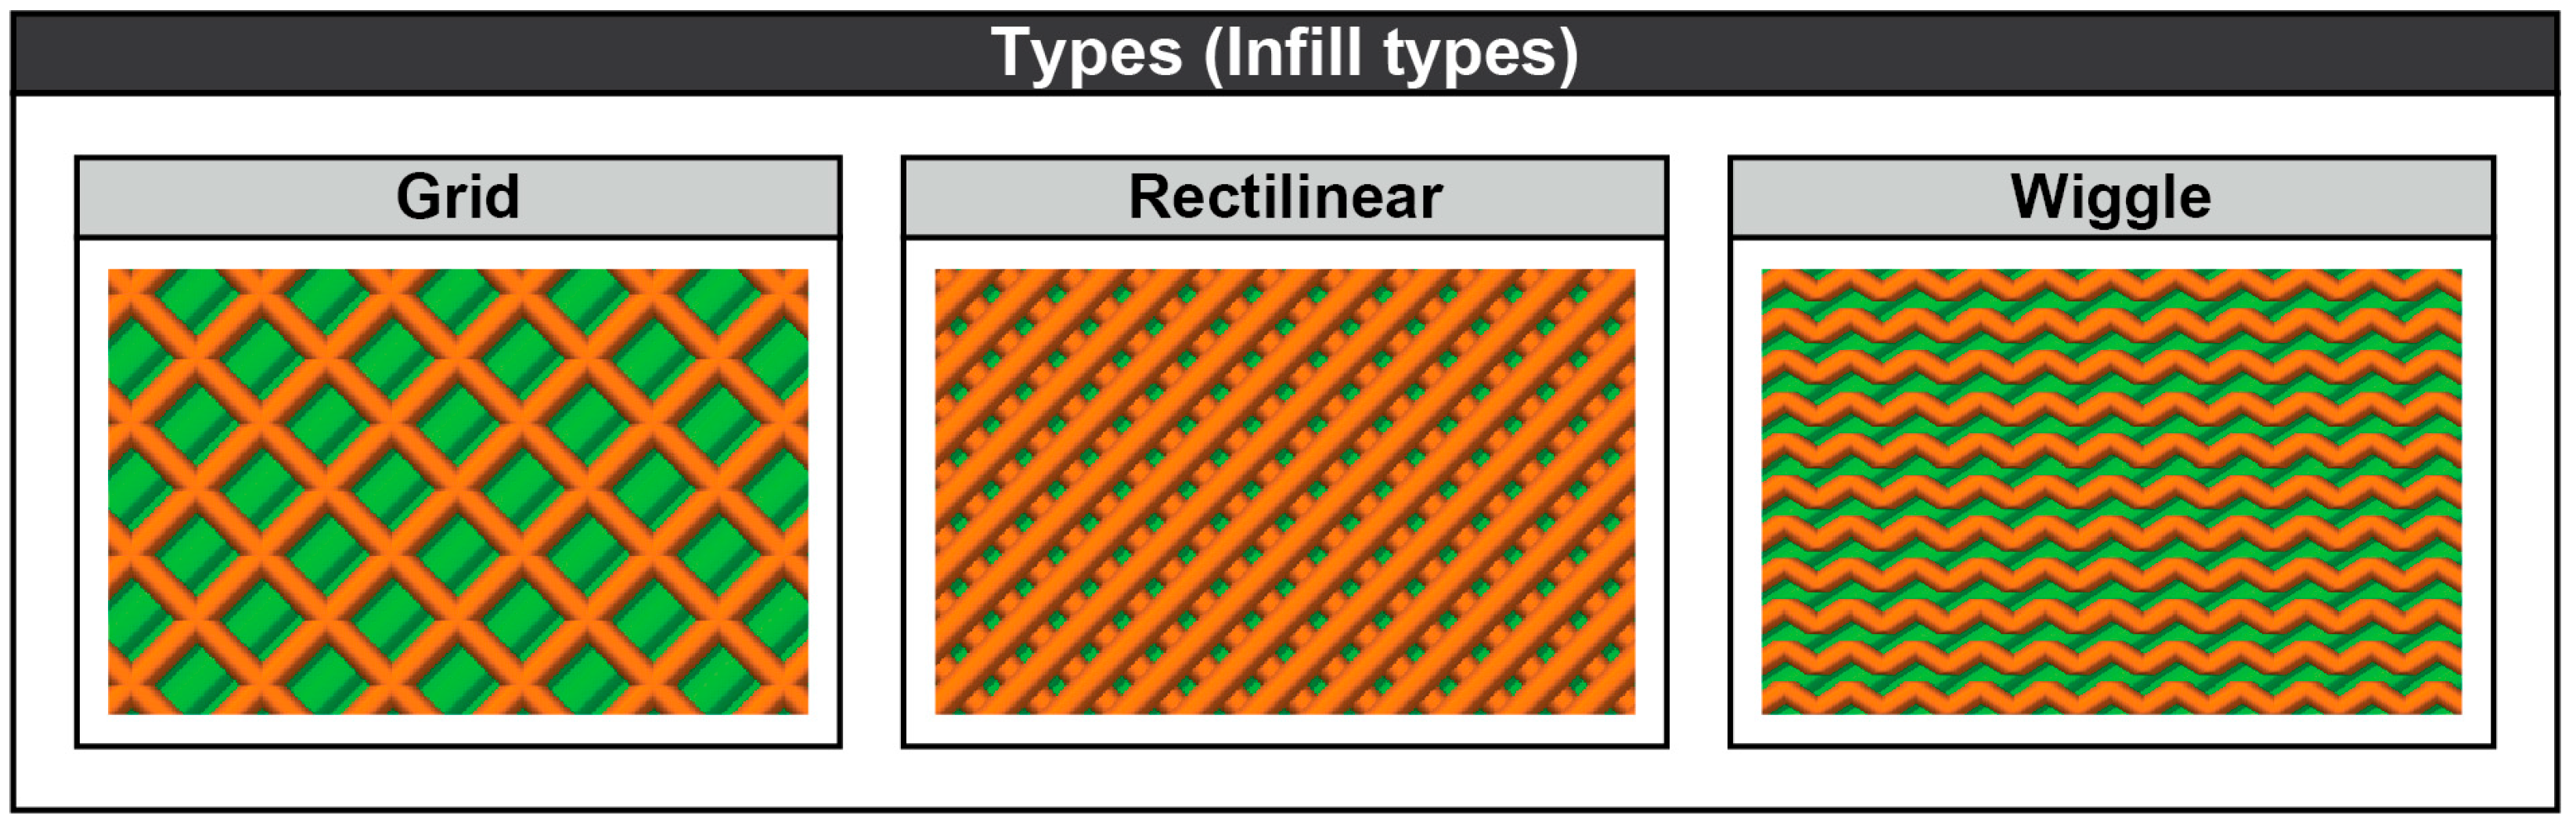
  • The Infill parameter expresses the filling percentage of the printed specimens. A specimen with a full filling percentage is defined with a value of 100%. The values used in the Infill parameter were 50%, 70%, and 90%.
  • The Speed parameter expresses the speed at which the nozzle will move when it extrudes the material; it is measured in millimeters per second (mm/s). The values used in the Speed parameter were 5 mm/s, 20 mm/s, and 35 mm/s.
  • The Type parameter expresses the type of Infill geometry. In this study, the types used were Grid, Rectilinear, and Wiggle.
These parameters were selected because of their combination, which is typical and well established for this material; parameters such as wiggle pattern are available in only a few slicing softwares, at least to our knowledge, and therefore have not been adequately studied.
Figure 3 illustrates how the three types of Infill are woven. In all instances, the infill percentage is set at 70%. The Type is represented in orange, while the green area represents the base of the geometry.

2.2. ANN Modeling

The Artificial Neural Network (ANN) technique draws inspiration from the biological brain and is utilized for learning processes. It consists of a network formed by a series of nodes, termed artificial neurons, which are organized into layers and interconnected, akin to biological neurons. External inputs to the system are processed, transformed, and then produced as outputs. Typically, an ANN includes an input layer, a hidden layer, and an output layer. Nodes in the input layer simply relay information to the hidden layer without performing any computations, whereas the hidden layer conducts all necessary calculations on the input data and transfers the results to the output layer.
Subsequently, the output layer receives and delivers the processed information. An activation function is applied to the model to determine which neurons are activated at any given time. This function assesses the importance of an input through mathematical operations. Each neuron possesses two attributes—weight and bias. The primary role of the activation function is to convert the sum of the weighted inputs into a value that can either be forwarded to another hidden layer or output as the final result.
In the present study, a shallow network was developed for prediction purposes. The aim was to determine the structural strength of the supporting parts used in the furniture industry during the design process. The selected method constitutes a reliable and accurate tool for this purpose.

3. Results and Discussion

3.1. Experimental Data

The specimens of both groups (27 + 27) were measured separately for tensile strength. The results of the measurements are the maximum force exerted on each specimen, which was measured in N (Newton). Based on the total measurements, the averages of each pair of specimens were calculated to obtain the stresses σ in MPa. The calculation of the stress σ was achieved through the following expression:
σ = F k N A   mm 2   MPa
where A is the vertical surface according to the applied force.
The calculations resulted in the average stress σ for each specimen, respectively. Table 3 presents the data of each specimen (Infill, Speed, and Type), the maximum force applied in N, and the stress σ in MPa.
The mean effect plot provides insight into how the three 3D printing parameters influence the tensile strength (s in MPa) of the 3D-printed specimens (Figure 4). Regarding infill density (%), it was observed that the tensile strength increases as the infill density increases from 50% to 90%. At 50% infill, the average tensile strength was around 30 MPa, which was the lowest point. At 70% infill, the average tensile strength rose to approximately 36 MPa, whereas at 90%, the average tensile strength peaked at about 41 MPa. A higher infill density led to a greater tensile strength because there was more solid material in the printed specimen, which enhanced its load-bearing capacity. On the contrary, the average tensile strength seemed to decrease as the printing speed increased from 5 mm/s to 35 mm/s. At 5 mm/s, the average tensile strength was around 37 MPa. At 20 mm/s, the average tensile strength dropped slightly to about 36 MPa. At 35 mm/s, the average tensile strength further decreased to approximately 34 MPa. Lower printing speeds resulted in improved tensile strength, likely because the slower speed allowed for better bonding between layers, reducing voids or defects. However, the interaction was not that strong compared to the infill density. Finally, the average tensile strength varied significantly with the type of infill pattern. For the Grid, the Rectilinear, and the Wiggle pattern, the average tensile strength was approximately 31 MPa, 34 MPa, and 43 MPa, respectively. It was observed that the Wiggle infill pattern provided the highest average tensile strength, possibly due to its ability to distribute stress more effectively across the specimen.
Summarizing, infill density and infill type had a strong positive influence on tensile strength. Printing speed, on the other hand, negatively affected the tensile strength. To maximize tensile strength, it was recommended to use a higher infill density (e.g., 90%), a lower printing speed (e.g., 5 mm/s), and the Wiggle infill pattern.

3.2. Shallow Network Development

The application of Artificial Neural Networks (ANNs) in design and manufacturing studies is well documented and has been successfully implemented by numerous researchers in recent years [41,42,43,44]. The network utilized in the present study was designed based on the feedforward backpropagation method, which is the most commonly employed technique for problems involving non-linear parameters. This method aims to minimize the discrepancy between the actual output and the network’s predicted output by continuously adjusting the weights of the network connections. The algorithm employed for this purpose is the Levenberg–Marquardt algorithm [45]. This choice was made following a preliminary evaluation of suitable learning algorithms for supervised learning. Common algorithms include the quasi-Newton (BFGS) method, the Levenberg–Marquardt (LM) method, Resilient Backpropagation, Scaled Conjugate Gradient, the Fletcher–Powell Conjugate Gradient, and the Polak–Ribiére Conjugate Gradient. The BFGS and LM methods were selected as they are better suited for function approximation problems, such as the one in the current study. Both algorithms demonstrated comparable training speeds; however, the LM method exhibited a slightly better accuracy compared to the BFGS method and was thus chosen.
The experimental data collected from the 54 experiments were categorized into three sets—70% for training the model, 15% for validation, and 15% for testing. To identify the optimal network structure for the present problem, various configurations were tested and compared using the correlation coefficient (R), as shown in Table 4, with hidden neurons ranging from 6 to 12. The objective was to determine the optimal degree of the polynomials to avoid both low variance and high bias, which could result in underfitting or overfitting the model. Parameters affecting the learning rate, such as the maximum number of epochs to train, epochs between display, maximum number of validation checks, and minimum performance gradient, were set to 1000, 25, 100, and 10−7, respectively.
Therefore, the number of neurons was set to 11 for the predicted max load, according to the three input variables and the one output. As already mentioned, a low number of neurons is usually avoided since it would probably lead to underfitting. On the other hand, a superfluous number of neurons could possibly lead to overfitting. The network structure used in this study is illustrated in Figure 5.
A preliminary evaluation of the most commonly used activation functions revealed that various forms of the sigmoid function offer specific advantages to the process. The transfer function chosen to serve as the activation function for the developed model is the hyperbolic tangent (tanh). The primary advantage of the tanh function, compared to the sigmoid one, is its ability to map the output to negative, neutral, or positive values, with an output range between −1 and 1, instead of the 0 to 1 range of the sigmoid. Additionally, the centering of the data simplifies the learning process for the hidden layers. In this study, the data were normalized to fit the activation function’s range [−1, 1], enhancing the model’s performance. The hyperbolic tangent function outperforms the sigmoid in terms of the training process [46]. Equation (1) describes the hyperbolic tangent function, while Equation (2) represents the generalized mathematical expression that computes the output variables, which is adjusted for the summation of the weighted data. Here, z denotes the output variable; Wi represents the output layer weights for n hidden nodes; f(x) is the hyperbolic tangent activation function for each numerical value of the hidden neurons Hi; and b denotes the bias of the output layer.
f ( x ) = tanh ( x ) = 2 1 e 2 x 1
z = i = 1 n W i f ( H i ) + b
To align with the range of the hyperbolic tangent activation function, all data were normalized. Equation (3) can be used to compute the normalized values ynormalized, based on the parameter value y, where ymax and ymin represent the maximum and minimum actual values of the input or output variables, respectively.
y n o r m a l i z e d = 2 y max y min × y y max + y min y max y min
Finally, the formula that was generated during the network development for the max load prediction is represented by Equation (4). It is noted that the equation can be safely used within the scope of the present study. The numerical value of each hidden neuron Hi can be calculated with the respective equation shown in Equation (4), which takes into consideration both the weights of the input layer and the biases of the hidden layer.
F max = 0.26294 H 1 + 0.22635 H 2 0.49128 H 3 0.30094 H 4 0.30345 H 5 1.7091 H 6 0.35242 H 7 + 0.28387 H 8 + 0.19595 H 9 1.0939 H 10 + 0.52873 H 11 + 0.055821
H 1 = tanh ( 0.5 × ( 3.1064 I 1.0215 S 2.3319 P 2.1769 ) ) H 2 = tanh ( 0.5 × ( 1.3012 I 2.4756 S 0.94798 P 2.3535 ) ) H 3 = tanh ( 0.5 × ( 0.30898 I + 3.5124 S 0.93774 P 1.5155 ) ) H 4 = tanh ( 0.5 × ( 3.1711 I 1.4283 S + 0.036261 P + 0.18819 ) ) H 5 = tanh ( 0.5 × ( 2.5043 I 0.58056 S + 1.971 P + 0.59307 ) ) H 6 = tanh ( 0.5 × ( 0.60136 I 0.31323 S 1.0799 P + 0.69851 ) ) H 7 = tanh ( 0.5 × ( 0.64029 I 2.0701 S + 2.1899 P + 0.79923 ) ) H 8 = tanh ( 0.5 × ( 1.4656 I 1.839 S 2.1071 P + 0.039091 ) ) H 9 = tanh ( 0.5 × ( 0.093938 I 3.2281 S 0.45163 P 1.7056 ) ) H 10 = tanh ( 0.5 × ( 2.3143 I 0.43816 S 1.9466 P 2.9065 ) ) H 11 = tanh ( 0.5 × ( 0.53332 I 1.6952 S 2.3566 P 3.446 ) )
To assess the developed model, the regressions plots shown in Figure 6 were generated and evaluated. These plots correspond to the training data set, validation data set, testing data set, and the total data set, as dictated by the headlines. Two notable characteristics indicate a strong fit between the experimental and predicted max load values. First, the predicted data points are close to the zero-error line, represented by the dotted line (Y = T). Second, there is collinearity between the fit line and the error line. The high R-values obtained for all data sets demonstrate the model’s increased accuracy, contributing to low error rates. Specifically, the coefficient values for the training data set, validation data set, testing data set, and the total data set were estimated to be 0.99938, 0.99254, 0.99997, and 0.99859, respectively.
To evaluate the performance of the developed model, the scatter plot shown in Figure 7 was used. It is evident that the model exhibits a strong capacity. Three reasons support this finding. First, the range of the error is narrow, between approximately 2.1% and −3.4%. Second, the majority of the error points are close to the zero-error line, and third, only a few outliers are present.

4. Conclusions

In the present study, experimental testing was carried out on 3D-printed specimens. More specifically, the degree of influence of the Infill, Speed, and Type printing parameters on the tensile stress was evaluated. Three different values were set for each parameter: (50%, 70%, and 90%), (5 mm/s, 20 mm/s, and 35 mm/s), and (Grid, Rectilinear, and Wiggle), respectively. The first two predictors are continuous variables, while the third one is categorical. The printer used in the study is the CreatBotTM D600 Pro FFF (Fused Filament Fabrication). The polyethylene terephthalate glycol polymer PETG: EVO from NEEMA3DTM was chosen as the material. Based on the three parameters and the three different values of each parameter, 27 different combinations emerged. Then, all 27 combinations were fabricated twice with respect to the full factorial analysis. Using a tensile testing machine, the two sets of the specimens (54 in total) were tested in vertical tension. The obtained results were evaluated and modeled with the ANN method. In general, the following conclusions can be drawn:
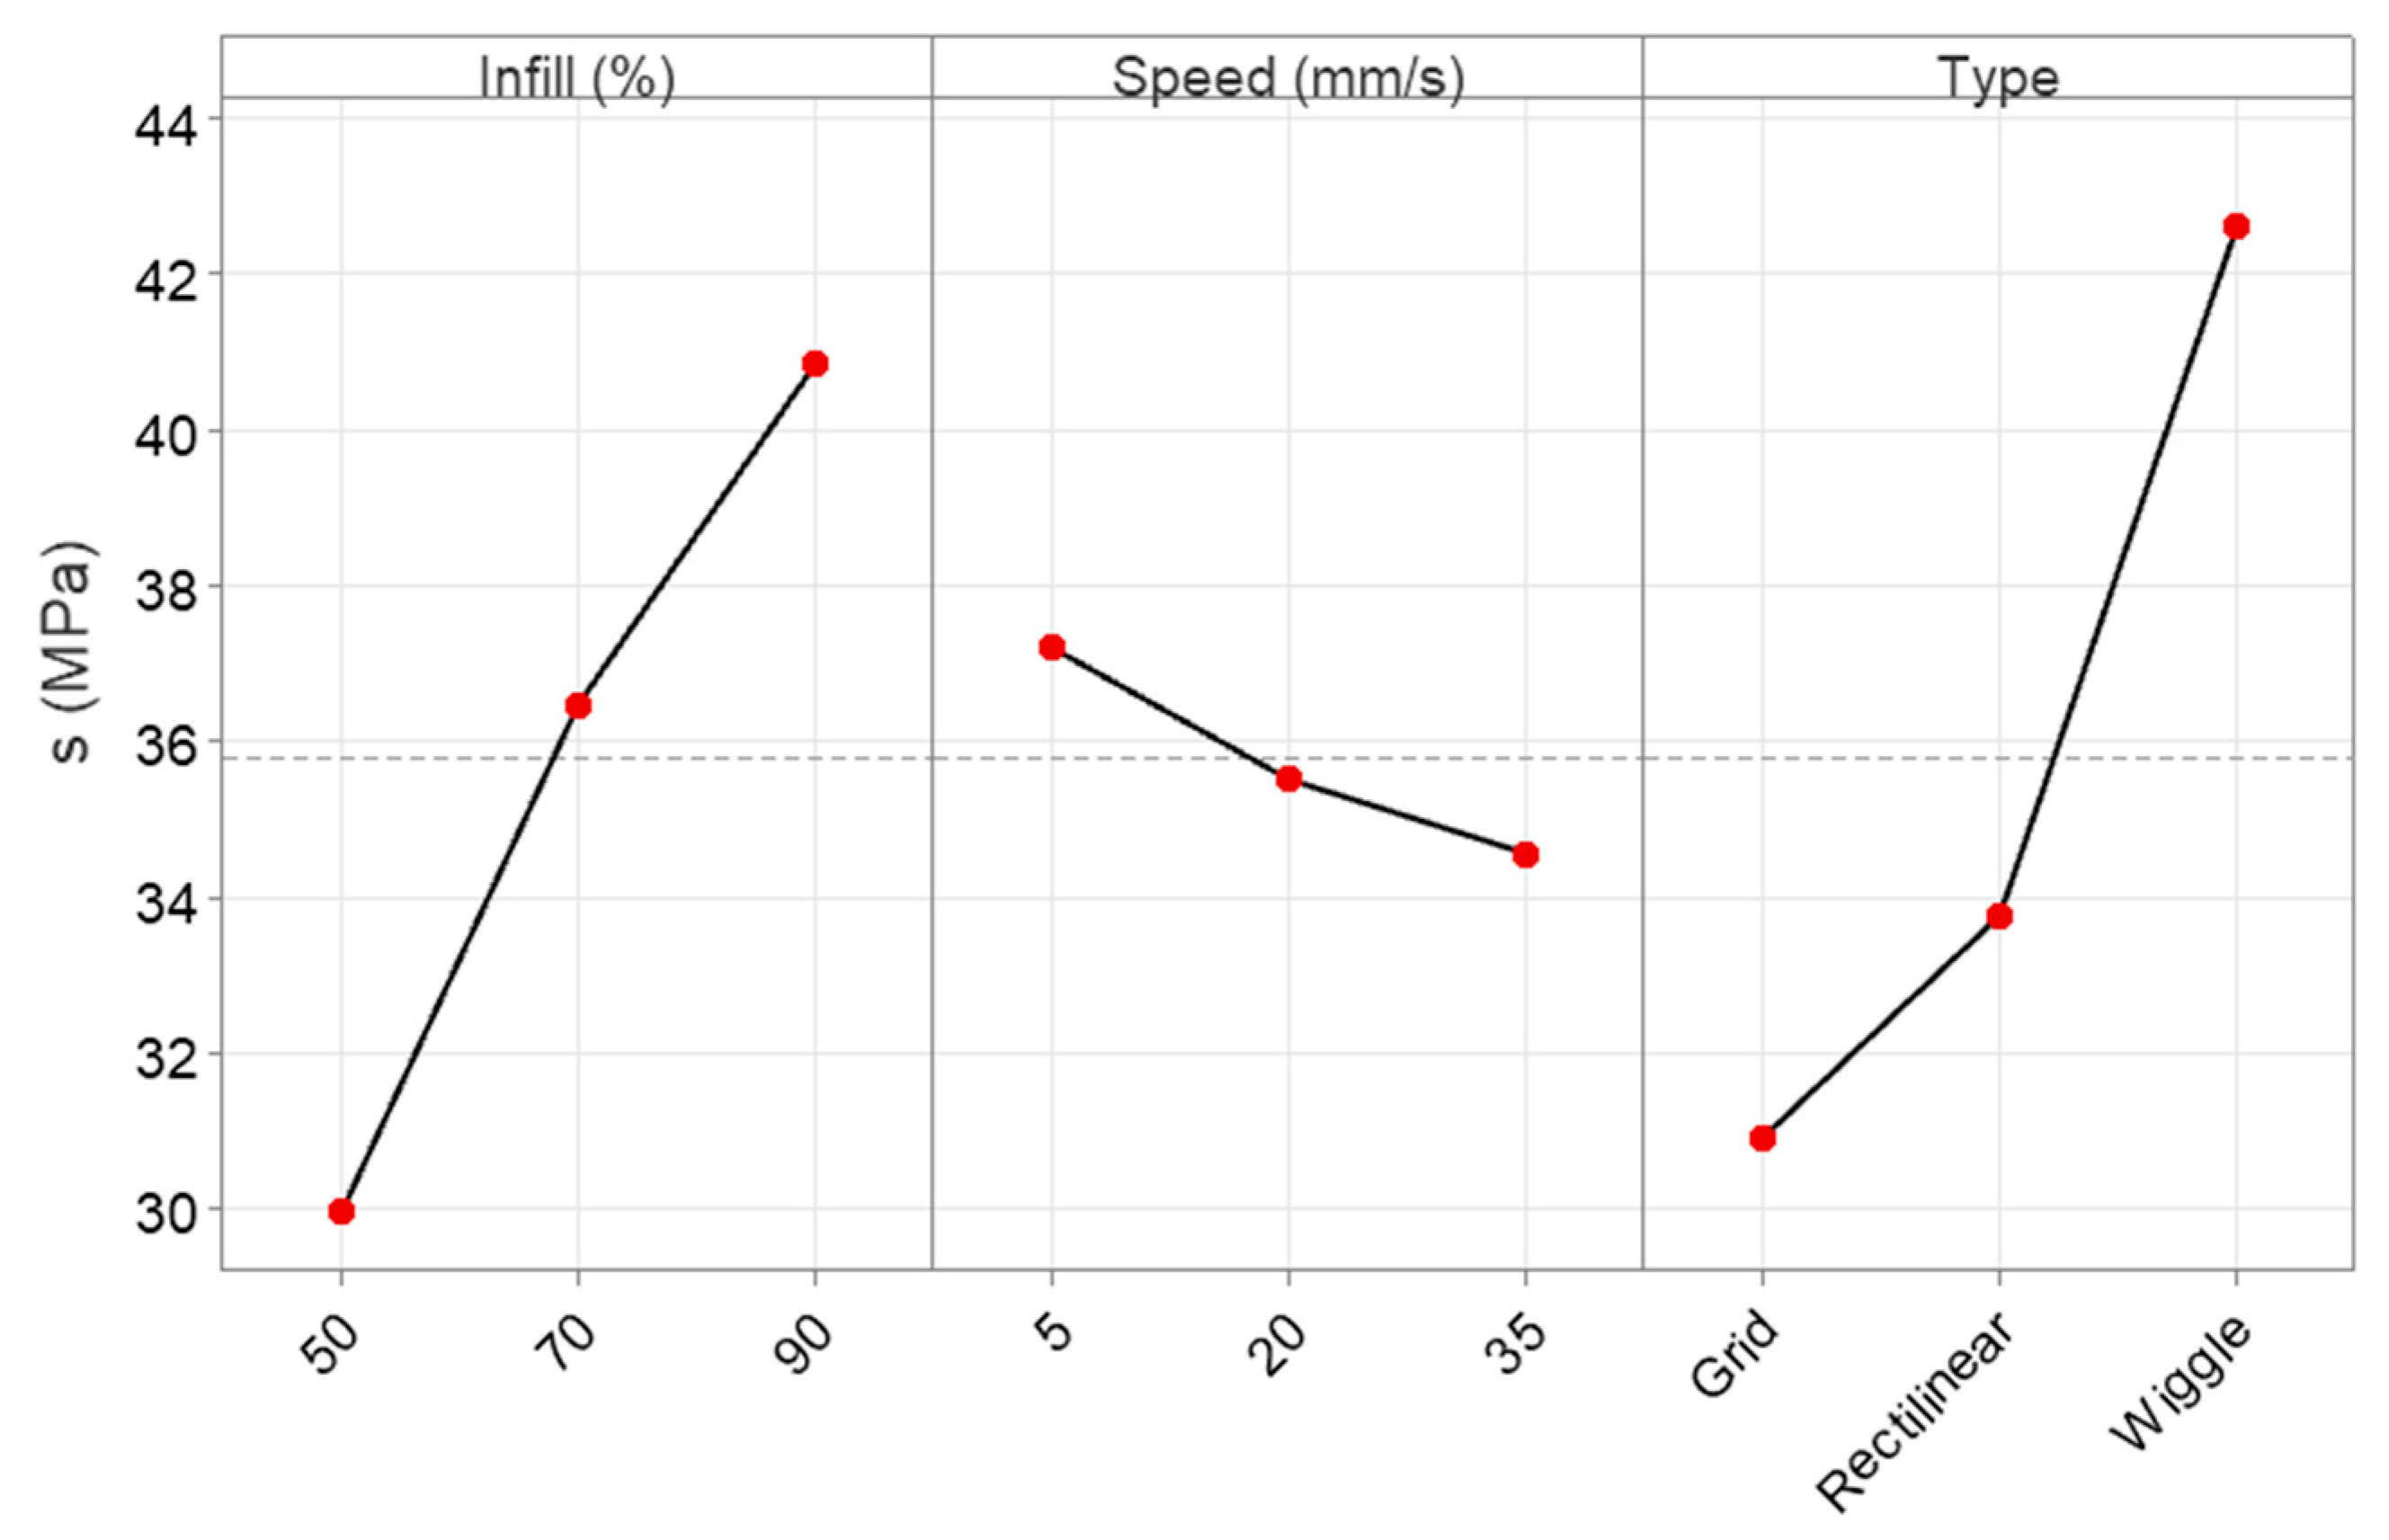
  • Both the Infill and the Type contribute the most to the response, followed by the Speed.
  • Wiggle is the strongest infill pattern, yielding strength values of over 42 MPa.
  • Higher Infill and lower printing speeds positively affect the response.
  • The best combination was identified with 90% infill, 5 mm/s speed, and the Wiggle pattern. In this case, the strength was measured at 49.82 MPa.
  • The worst combination was identified with 50% infill, 35 mm/s speed, and the Grid pattern. The strength was measured at 25.65 MPa.
  • The best ANN structure was determined to be the 3-11-1 configuration.
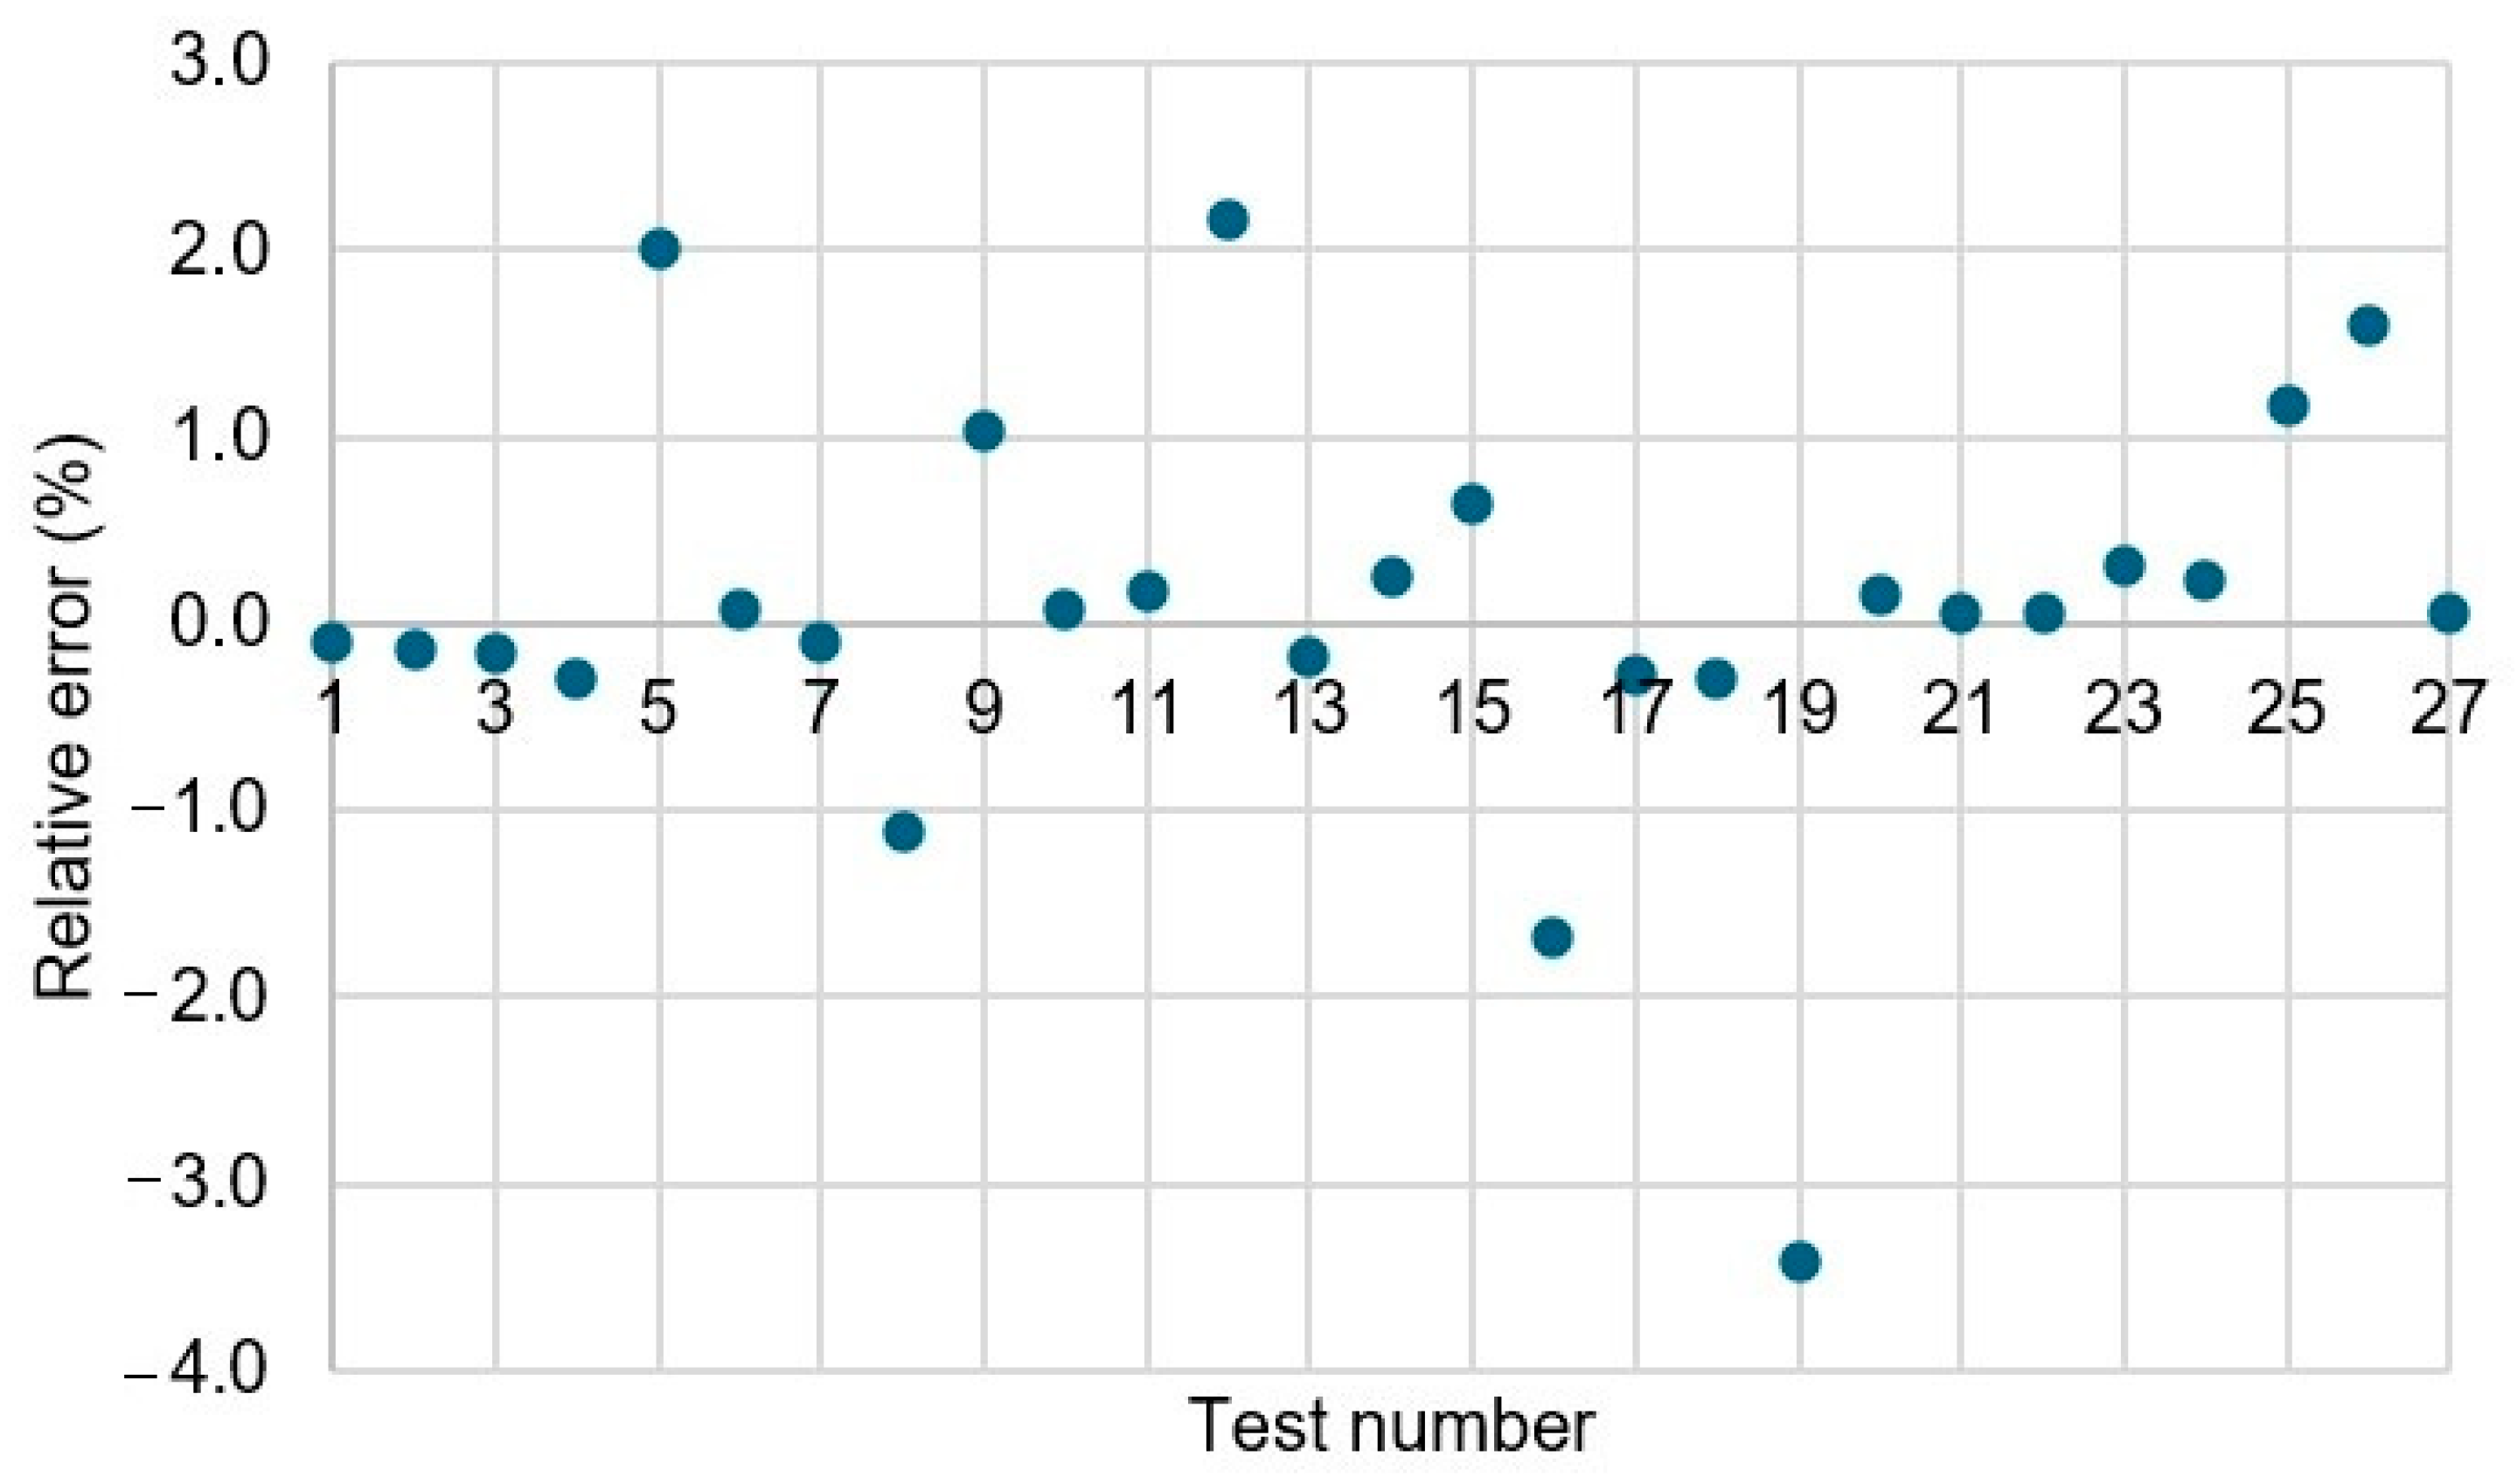
  • The developed ANN model was proven to be accurate and robust, with the correlation coefficient for the summation of the data points being equal to 0.99859 and the relative error between the experimental and the predicted values of tensile strength being below 10%.

Author Contributions

Conceptualization: A.M. and P.K.; data curation: A.M., A.T. and L.F.; formal analysis: A.M., A.T. and P.K.; investigation: A.M., A.T., L.F. and P.K.; methodology: A.M., A.T., L.F. and P.K.; resources: P.K.; supervision: P.K.; validation: A.M.; visualization: A.M. and L.F.; writing—original draft: A.M. and A.T.; writing—review and editing: A.M. and P.K. All authors have read and agreed to the published version of the manuscript.

Funding

This research received no external funding.

Data Availability Statement

Data are contained within the article.

Conflicts of Interest

The authors declare no conflicts of interest.

References

  1. Firtikiadis, L.; Minaoglou, P.; Efkolidis, N.; Kyratsis, P. Slipper-sole computational design: A customer-based approach. In Proceedings of the VI International Scientific Conference in Contemporary Trends Innovations in the Textile Industry (CT&ITI 2023), Belgrade, Serbia, 14–15 September 2023. [Google Scholar]
  2. Manavis, A.; Minaoglou, P.; Tzetzis, D.; Efkolidis, N.; Kyratsis, P. Computational design technologies for interior designers: A case study. IOP Conf. Ser. Mater. Sci. Eng. 2021, 1009, 012037. [Google Scholar] [CrossRef]
  3. Nicolau, A.; Pop, M.A.; Coșereanu, C. 3D printing application in wood furniture components assembling. Materials 2022, 15, 2907. [Google Scholar] [CrossRef] [PubMed]
  4. Žujović, M.; Obradović, R.; Rakonjac, I.; Milošević, J. 3D printing technologies in architectural design and construction: A systematic literature review. Buildings 2022, 12, 1319. [Google Scholar] [CrossRef]
  5. Yang, Y.; Dai, X.; Yang, B.; Zou, P.; Gao, F.; Duan, J.; Wang, C. Optimization of polylactic acid 3D printing parameters based on support vector regression and cuckoo search. Polym. Eng. Sci. 2023, 63, 3243–3253. [Google Scholar] [CrossRef]
  6. Tzotzis, A.; Manavis, A.; Efkolidis, N.; García-Hernández, C.; Kyratsis, P. Analysis of the Influence of Structural Characteristics on the Tensile Properties of Fused Filament Fabricated ABS Polymer Using Central Composite Design. Appl. Mech. 2023, 5, 20–35. [Google Scholar] [CrossRef]
  7. Wang, J.; Yang, B.; Lin, X.; Gao, L.; Liu, T.; Lu, Y.; Wang, R. 2020 Research of TPU materials for 3D printing aiming at non-pneumatic tires by FDM method. Polymers 2020, 12, 2492. [Google Scholar] [CrossRef]
  8. Atakok, G.; Kam, M.; Koc, H.B. Tensile, three-point bending and impact strength of 3D printed parts using PLA and recycled PLA filaments: A statistical investigation. J. Mater. Res. Technol. 2022, 18, 1542–1554. [Google Scholar] [CrossRef]
  9. Anderson, I. Mechanical properties of specimens 3D printed with virgin and recycled polylactic acid. 3D Print. Addit. Manuf. 2017, 4, 110–115. [Google Scholar] [CrossRef]
  10. Bergaliyeva, S.; Sales, D.L.; Delgado, F.J.; Bolegenova, S.; Molina, S.I. Manufacture and characterization of polylactic acid filaments recycled from real waste for 3D printing. Polymers 2023, 15, 2165. [Google Scholar] [CrossRef]
  11. Kumar, R.; Singh, R.; Farina, I. On the 3D printing of recycled ABS, PLA and HIPS thermoplastics for structural applications. PSU Res. Rev. 2018, 2, 115–137. [Google Scholar] [CrossRef]
  12. Panneerselvam, T.; Raghuraman, S.; Vamsi Krishnan, N. Investigating mechanical properties of 3D-printed polyethylene terephthalate glycol material under fused deposition modeling. J. Inst. Eng. (India) Ser. C 2021, 102, 375–387. [Google Scholar] [CrossRef]
  13. Özen, A.; Abali, B.E.; Völlmecke, C.; Gerstel, J.; Auhl, D. Exploring the role of manufacturing parameters on microstructure and mechanical properties in fused deposition modeling (FDM) using PETG. Appl. Compos. Mater. 2021, 28, 1799–1828. [Google Scholar] [CrossRef]
  14. Hanon, M.M.; Marczis, R.; Zsidai, L. Anisotropy evaluation of different raster directions, spatial orientations, and fill percentage of 3D printed PETG tensile test specimens. Key Eng. Mater. 2019, 821, 167–173. [Google Scholar] [CrossRef]
  15. Özen, A.; Auhl, D.; Völlmecke, C.; Kiendl, J.; Abali, B.E. Optimization of manufacturing parameters and tensile specimen geometry for fused deposition modeling (FDM) 3D-printed PETG. Materials 2021, 14, 2556. [Google Scholar] [CrossRef] [PubMed]
  16. ISO 527-2; Plastics—Determination of Tensile Properties—Part 2: Test Conditions for Moulding and Extrusion Plastics. International Organization for Standardization: Geneva, Switzerland, 2012.
  17. ASTMD3039/D3039M-17; Standard Test Method for Tensile Properties of Polymer Matrix Composite Materials. ASTM International: West Conshohocken, PA, USA, 2017.
  18. Dolzyk, G.; Jung, S. Tensile and fatigue analysis of 3D-printed polyethylene terephthalate glycol. J. Fail. Anal. Prev. 2019, 19, 511–518. [Google Scholar] [CrossRef]
  19. Mercado-Colmenero, J.M.; La Rubia, M.D.; Mata-Garcia, E.; Rodriguez-Santiago, M.; Martin-Doñate, C. Experimental and numerical analysis for the mechanical characterization of petg polymers manufactured with fdm technology under pure uniaxial compression stress states for architectural applications. Polymers 2020, 12, 2202. [Google Scholar] [CrossRef] [PubMed]
  20. ISO 604; Plastics—Determination of Compressive Properties. International Organization for Standardization: Geneva, Switzerland, 2002.
  21. Malyadri, T.; Sunkara, N.; Srinivasa Rao, M.S. Investigation on Mechanical Properties of 3D Printed PETG Material. In Recent Advances in Manufacturing Processes and Systems: Select Proceedings of RAM 2021; Springer: Singapore, 2022; pp. 571–582. [Google Scholar]
  22. Kumaresan, R.; Samykano, M.; Kadirgama, K.; Pandey, A.K.; Rahman, M.M. Effects of printing parameters on the mechanical characteristics and mathematical modeling of FDM-printed PETG. Int. J. Adv. Manuf. Technol. 2023, 128, 3471–3489. [Google Scholar] [CrossRef]
  23. Aberoumand, M.; Soltanmohammadi, K.; Soleyman, E.; Rahmatabadi, D.; Ghasemi, I.; Baniassadi, M.; Abrinia, K.; Baghani, M. A comprehensive experimental investigation on 4D printing of PET-G under bending. J. Mater. Res. Technol. 2022, 18, 2552–2569. [Google Scholar] [CrossRef]
  24. Durgashyam, K.; Reddy, M.I.; Balakrishna, A.; Satyanarayana, K.J.M.T.P. Experimental investigation on mechanical properties of PETG material processed by fused deposition modeling method. Mater. Today Proc. 2019, 18, 2052–2059. [Google Scholar] [CrossRef]
  25. Wang, K.; Shen, J.; Ma, Z.; Zhang, Y.; Xu, N.; Pang, S. Preparation and Properties of Poly (ethylene glycol-co-cyclohexane-1, 4-dimethanol terephthalate)/Polyglycolic Acid (PETG/PGA) Blends. Polymers 2021, 13, 452. [Google Scholar] [CrossRef]
  26. Szykiedans, K.; Credo, W.; Osiński, D. Selected mechanical properties of PETG 3-D prints. Procedia Eng. 2017, 177, 455–461. [Google Scholar] [CrossRef]
  27. Alarifi, I.M. Mechanical properties and numerical simulation of FDM 3D printed PETG/carbon composite unit structures. J. Mater. Res. Technol. 2023, 23, 656–669. [Google Scholar] [CrossRef]
  28. Valvez, S.; Silva, A.P.; Reis, P.N. Compressive behaviour of 3D-printed PETG composites. Aerospace 2022, 9, 124. [Google Scholar] [CrossRef]
  29. Valvez, S.; Silva, A.P.; Reis, P.N. Optimization of printing parameters to maximize the mechanical properties of 3D-printed PETG-based parts. Polymers 2022, 14, 2564. [Google Scholar] [CrossRef]
  30. Ranganathan, S.; Palanivelu, R. Enhancing the Tribological Properties PETG and CFPETG Composites Fabricated by FDM via Various Infill Density and Annealing; SAE Technical Paper No. 2020-28-0429; SAE International: Warrendale, PA, USA, 2020; pp. 1–7. [Google Scholar]
  31. Amza, C.G.; Zapciu, A.; Constantin, G.; Baciu, F.; Vasile, M.I. Enhancing mechanical properties of polymer 3D printed parts. Polymers 2021, 13, 562. [Google Scholar] [CrossRef] [PubMed]
  32. Zapciu, A.; Amza, C.G.; Baciu, F.; Vasile, M.I. Heat treatment of 3D printed polyethylene terephthalate glycol in a supporting powder bed. IOP Conf. Ser. Mater. Sci. Eng. 2021, 1182, 012083. [Google Scholar] [CrossRef]
  33. Mercado–Colmenero, J.M.; Martin–Doñate, C. A novel geometric predictive algorithm for assessing compressive elastic modulus in MEX additive processes, based on part nonlinearities and layers stiffness, validated with PETG and PLA materials. Polym. Test. 2024, 133, 108389. [Google Scholar] [CrossRef]
  34. Sepahi, M.T.; Abusalma, H.; Jovanovic, V.; Eisazadeh, H. Mechanical properties of 3D-printed parts made of polyethylene terephthalate glycol. J. Mater. Eng. Perform. 2021, 30, 6851–6861. [Google Scholar] [CrossRef]
  35. Hsueh, M.H.; Lai, C.J.; Wang, S.H.; Zeng, Y.S.; Hsieh, C.H.; Pan, C.Y.; Huang, W.C. Effect of printing parameters on the thermal and mechanical properties of 3d-printed pla and petg, using fused deposition modeling. Polymers 2021, 13, 1758. [Google Scholar] [CrossRef] [PubMed]
  36. Ramírez-Revilla, S.; Camacho-Valencia, D.; Gonzales-Condori, E.G.; Márquez, G. Evaluation and comparison of the degradability and compressive and tensile properties of 3D printing polymeric materials: PLA, PETG, PC, and ASA. MRS Commun. 2023, 13, 55–62. [Google Scholar] [CrossRef]
  37. Top, N.; Şahin, İ.; Gökçe, H. Topology optimization for furniture connection part and production with 3d printer technology. In Proceedings of the XXIXth International Conference Research for Furniture Industry, Ankara, Türkiye, 19–20 September 2019; p. 671. [Google Scholar]
  38. Fu, C.W.; Song, P.; Yan, X.; Yang, L.W.; Jayaraman, P.K.; Cohen-Or, D. Computational interlocking furniture assembly. ACM Trans. Graph. (TOG) 2015, 34, 1–11. [Google Scholar] [CrossRef]
  39. Koyama, Y.; Sueda, S.; Steinhardt, E.; Igarashi, T.; Shamir, A.; Matusik, W. AutoConnect: Computational design of 3D-printable connectors. ACM Trans. Graph. (TOG) 2015, 34, 1–11. [Google Scholar] [CrossRef]
  40. ASTM D638-22; Standard Test Method for Tensile Properties of Plastics. American Society for Testing and Materials: West Conshohocken, PA, USA, 2022. Available online: https://www.astm.org/d0638-22.html (accessed on 14 November 2024).
  41. Çakar, T.; Cil, I. Artificial neural networks for design of manufacturing systems and selection of priority rules. Int. J. Comput. Integr. Manuf. 2004, 17, 195–211. [Google Scholar] [CrossRef]
  42. Mumali, F. Artificial neural network-based decision support systems in manufacturing processes: A systematic literature review. Comput. Ind. Eng. 2022, 165, 107964. [Google Scholar] [CrossRef]
  43. Nagarajan, H.P.; Mokhtarian, H.; Jafarian, H.; Dimassi, S.; Bakrani-Balani, S.; Hamedi, A.; Coatanéa, E.; Wang, G.G.; Haapala, K.R. Knowledge-based design of artificial neural network topology for additive manufacturing process modeling: A new approach and case study for fused deposition modeling. J. Mech. Des. 2019, 141, 021705. [Google Scholar] [CrossRef]
  44. Singh, J.; Goyal, K.K.; Kumar, R.; Gupta, V. Development of artificial intelligence-based neural network prediction model for responses of additive manufactured polylactic acid parts. Polym. Compos. 2022, 43, 5623–5639. [Google Scholar] [CrossRef]
  45. Lera, G.; Pinzolas, M. Neighborhood based Levenberg-Marquardt algorithm for neural network training. IEEE Trans. Neural Netw. 2002, 13, 1200–1203. [Google Scholar] [CrossRef] [PubMed]
  46. Tzotzis, A.; Nedelcu, D.; Mazurchevici, S.-N.; Kyratsis, P. Surface Quality Evaluation of 3D-Printed Carbon-Fiber-Reinforced PETG Polymer During Turning: Experimental Analysis, ANN Modeling and Optimization. Polymers 2024, 16, 2927. [Google Scholar] [CrossRef]
Figure 1. Experimental workflow.
Machines 13 00086 g001
Figure 2. The dimensions of the specimen.
Machines 13 00086 g002
Figure 3. The three different types of infill (Grid, Rectilinear, and Wiggle).
Machines 13 00086 g003
Figure 4. The mean effect plots for the tensile strength.
Machines 13 00086 g004
Figure 5. The ANN structure of the study.
Machines 13 00086 g005
Figure 6. The regression plots for the training set, the validation set, the test set, and the total of the data sets of the force prediction ANN.
Machines 13 00086 g006
Figure 7. Scatter plot of the percentage relative error between the experimental and the predicted values of tensile strength.
Machines 13 00086 g007
Table 1. Parameters for the PETG printing process.
ParametersValueUnit
Layer Height0.2mm
Extrusion Temperature240°C
Bed Temperature80°C
Cooling100%
Shell Thickness1.2mm
Support StructuresN/A-
Table 2. Specimen printing parameters.
ParametersValue 1Value 2Value 3
Infill (%)507090
Speed (mm/s)52035
TypeGridRectilinearWiggle
Table 3. The tensile testing results.
Infill (%)Speed (mm/s)TypeσA (MPa)σB (MPa)σ (MPa)
1505Grid28.8227.2528.04
25020Grid26.4525.5726.01
35035Grid25.2725.9325.65
4705Grid35.7035.9435.82
57020Grid33.1832.2832.73
67035Grid29.9129.8729.89
7905Grid40.7540.6640.71
89020Grid31.1531.1331.14
99035Grid28.5828.0928.33
10505Rectilinear26.2128.4227.32
115020Rectilinear26.5627.9027.22
125035Rectilinear27.0527.8127.42
13705Rectilinear32.6834.1533.41
147020Rectilinear31.1232.2531.68
157035Rectilinear33.3534.2133.79
16905Rectilinear42.6342.1142.37
179020Rectilinear40.1440.9040.52
189035Rectilinear39.6740.8340.25
19505Wiggle34.0834.2834.18
205020Wiggle38.7735.3337.06
215035Wiggle37.9635.6536.80
22705Wiggle44.8141.7643.28
237020Wiggle45.7842.6344.19
247035Wiggle44.4942.7843.62
25905Wiggle51.5648.1149.82
269020Wiggle50.8347.5149.16
279035Wiggle44.6546.2345.43
Table 4. Structure trials for the shallow network.
ANN StructureR-Value
3-6-10.95069
3-7-10.91986
3-8-10.96506
3-9-10.92851
3-10-10.73833
3-11-10.99859
3-12-10.94639
Disclaimer/Publisher’s Note: The statements, opinions and data contained in all publications are solely those of the individual author(s) and contributor(s) and not of MDPI and/or the editor(s). MDPI and/or the editor(s) disclaim responsibility for any injury to people or property resulting from any ideas, methods, instructions or products referred to in the content.

