Article

Design and Discrete Element (DEM) Simulation Analysis of Grassland Ecological Cleaning and Restoration Vehicle

School of Mechanical and Automotive Engineering, Liaocheng University, Liaocheng 252000, China
*
Author to whom correspondence should be addressed.
Machines 2025, 13(2), 114; https://doi.org/10.3390/machines13020114
Submission received: 28 December 2024 / Revised: 23 January 2025 / Accepted: 28 January 2025 / Published: 30 January 2025
(This article belongs to the Section Machine Design and Theory)

Abstract

:
To reduce the weight of the grassland ecological restoration vehicle disk brush, force analysis and topology optimization are carried out to reduce the weight of the disk brush by 55.43%. Then, the study found that the vehicle speed and the rotational speed of the disk brush have an effect on the trajectory of garbage throwing, and the relationship between the two needs to be coordinated. The sweeping effect works best when the speed ratio coefficient is greater than 1.826, which can be found by matching the motion trajectory equation with the speed ratio coefficient λ. Based on the discrete element method (DEM), it is verified that when the rotational speed is 90 r/min and the vehicle speed is 10 km/h, the sweeping effect is the best, and the influence on plants is minimized. Finally, the seeding effect of grass seeds was verified by a three-factor three-level orthogonal experiment. The results showed that high rotational speed and multiple slots could reduce the row spacing of seeding, while higher speed increased the row spacing of seeding. When the rotational speed of the seed-displacement disk was 50 r/min, the number of slots was 24, and the vehicle speed was 15 km/h, the seed displacement reached the maximum, and the row spacing was in line with the reasonable seeding requirements of ryegrass. The experimental results provide technical support for similar grassland cleaning and restoration vehicles in the future.

1. Introduction

As a component of the six ecosystems, grasslands comprise 40.5% of the Earth’s landmass [1]. However, grasslands are facing increasing desertification and litter problems, which have significant impacts on economic and social stability [2,3,4]. In Inner Mongolia Autonomous Region, due to the rapid growth of tourism, the number of tourists continues to increase each year, and consequently, the amount and composition of garbage changes; especially, the proportion of plastic and glass increases [5]. It is worth noting that the collection and transportation of waste is the most costly part of the waste management budget [6,7]. This thesis presents a new grassland ecological cleaning and restoration vehicle specifically designed for waste collection and winnowing. The aim is to restore grassland ecology while minimizing damage to plants.
Currently, road sweepers are rapidly developing and widely used worldwide, and industrialized countries such as the United States, Germany, the United Kingdom, Italy, and Japan have mechanized road sweeping [8,9]. Nevertheless, large grassland environments heavily polluted by litter rarely exist in the territories of these countries, leading to insufficient research on specialized grassland sweepers. A lot of research has been conducted in the past on how to protect and use grasslands, how to design the best sweeping equipment, and how to study mechanical motion characteristics. For example, Yin et al. [10] designed a chicken coop sweeper that removed 91.7% of the dust by changing the height of the sweeper and finding the best moving speed, rotational speed, and nozzle height.
Serajian et al. [11] adjusted the sweeper’s travel speed and the disk brush’s rotational speed to control the disk brush’s height and angular velocity to reduce dust and avoid unnecessary overlapping sweeping effectively. Tang et al. [12] proposed a reconfigurable and deformed tracked wheel with two modes of wheeled and tracked, applied the RDTW mechanical design, and conducted an in-depth study on its kinematic characteristics. The study’s findings show that the reconfigurable deformed tracked wheel can greatly lower the damage to the ground, and the suggested kinematic mechanism is very important for changing from wheels to tracks.
Grazioso et al. [13] investigated the multiple interactions between the links of the chain that constitutes the track and the different elements in the system through accurate modeling so that the sprocket wheel, idler pulley, and landing gear rollers can operate in a coordinated manner, thus realizing effective switching between wheel and track. Miyamoto et al. [14] improved forage production and increased livestock carrying capacity by mechanically modifying pastures (furrowing, etc.). However, there is a lack of an integrated vehicle that can effectively minimize damage to grass during the sweeping process and is specifically designed for grassland cleaning and restoration.
This design improves the efficiency of garbage collection, reduces the cost, and realizes the versatility of vehicles. It is possible to find a good relationship between the sweeper’s moving speed and the disk brush’s rotating speed by figuring out the motion trajectory equation of the point where the brush contacts the ground and matching the speed ratio coefficient λ. It is discovered that the sweeping effect is best when λ is greater than 1.826.
Based on the discrete element method (DEM), the effects of traveling speed and rotational speed on the sweeping effect were verified, and it was found that the effect on plants was minimized and the sweeping efficiency was highest when the rotational speed was 90 r/min and the traveling speed was 10 km/h. In addition, for most grass plants in the grassland [15], the EDEM software established a particle contact model to analyze the plant force during the sweeping process.
Finally, experiments were conducted on the grass seed sowing device, and the results showed that when the rotational speed of the seed disks was higher and the number of slots was higher, the row spacing was smaller; and the higher the speed of the vehicle was, the larger the row spacing was. When the rotational speed of the seeding disk is 50 r/min, the number of slots is 24, the vehicle speed is 15 km/h, the seeding volume is maximum, and the row spacing is reasonable.
This study aims to develop an efficient vehicle for grassland ecological cleanup and restoration to improve the efficiency of grassland litter removal and the sustainability of grassland ecology restoration.

2. Structural Design and Analysis

2.1. Structure and Working Principle of Grassland Ecological Cleaning and Restoration Vehicle

Figure 1 depicts the structure of a grassland ecological cleanup and restoration vehicle. Table 1 lists the performance specifications, with the width of 1890 mm under “Overall size (mm)” referring to the vehicle’s external dimensions and the width of 1900 mm under “Working width (mm)” indicating the vehicle’s effective width when in operation.
When the vehicle is traveling in grassland areas and encounters heavy litter contamination, the sweeping disk brushes provide kinetic energy to the litter, throwing it from the grass to the working area of the sweeper’s suction duct. Under the action of the suction, the litter is fed through the ducting into the dust exclusion box and then transferred to the helical knife litter winnowing unit. Here, the high-speed rotating spiral reamers shred the trash. The shredded garbage is subjected to gravity and centrifugal force, passes through a filter, and is compressed by the lower garbage compactor unit, Finally, it is placed in the rubbish can. In addition, the truck is outfitted with soil screening equipment capable of scooping out half-buried rubbish and separating it from the soil before feeding it into the suction pipe.

2.2. Working Mechanism of Wheel–Track Composite Obstacle-Crossing Device

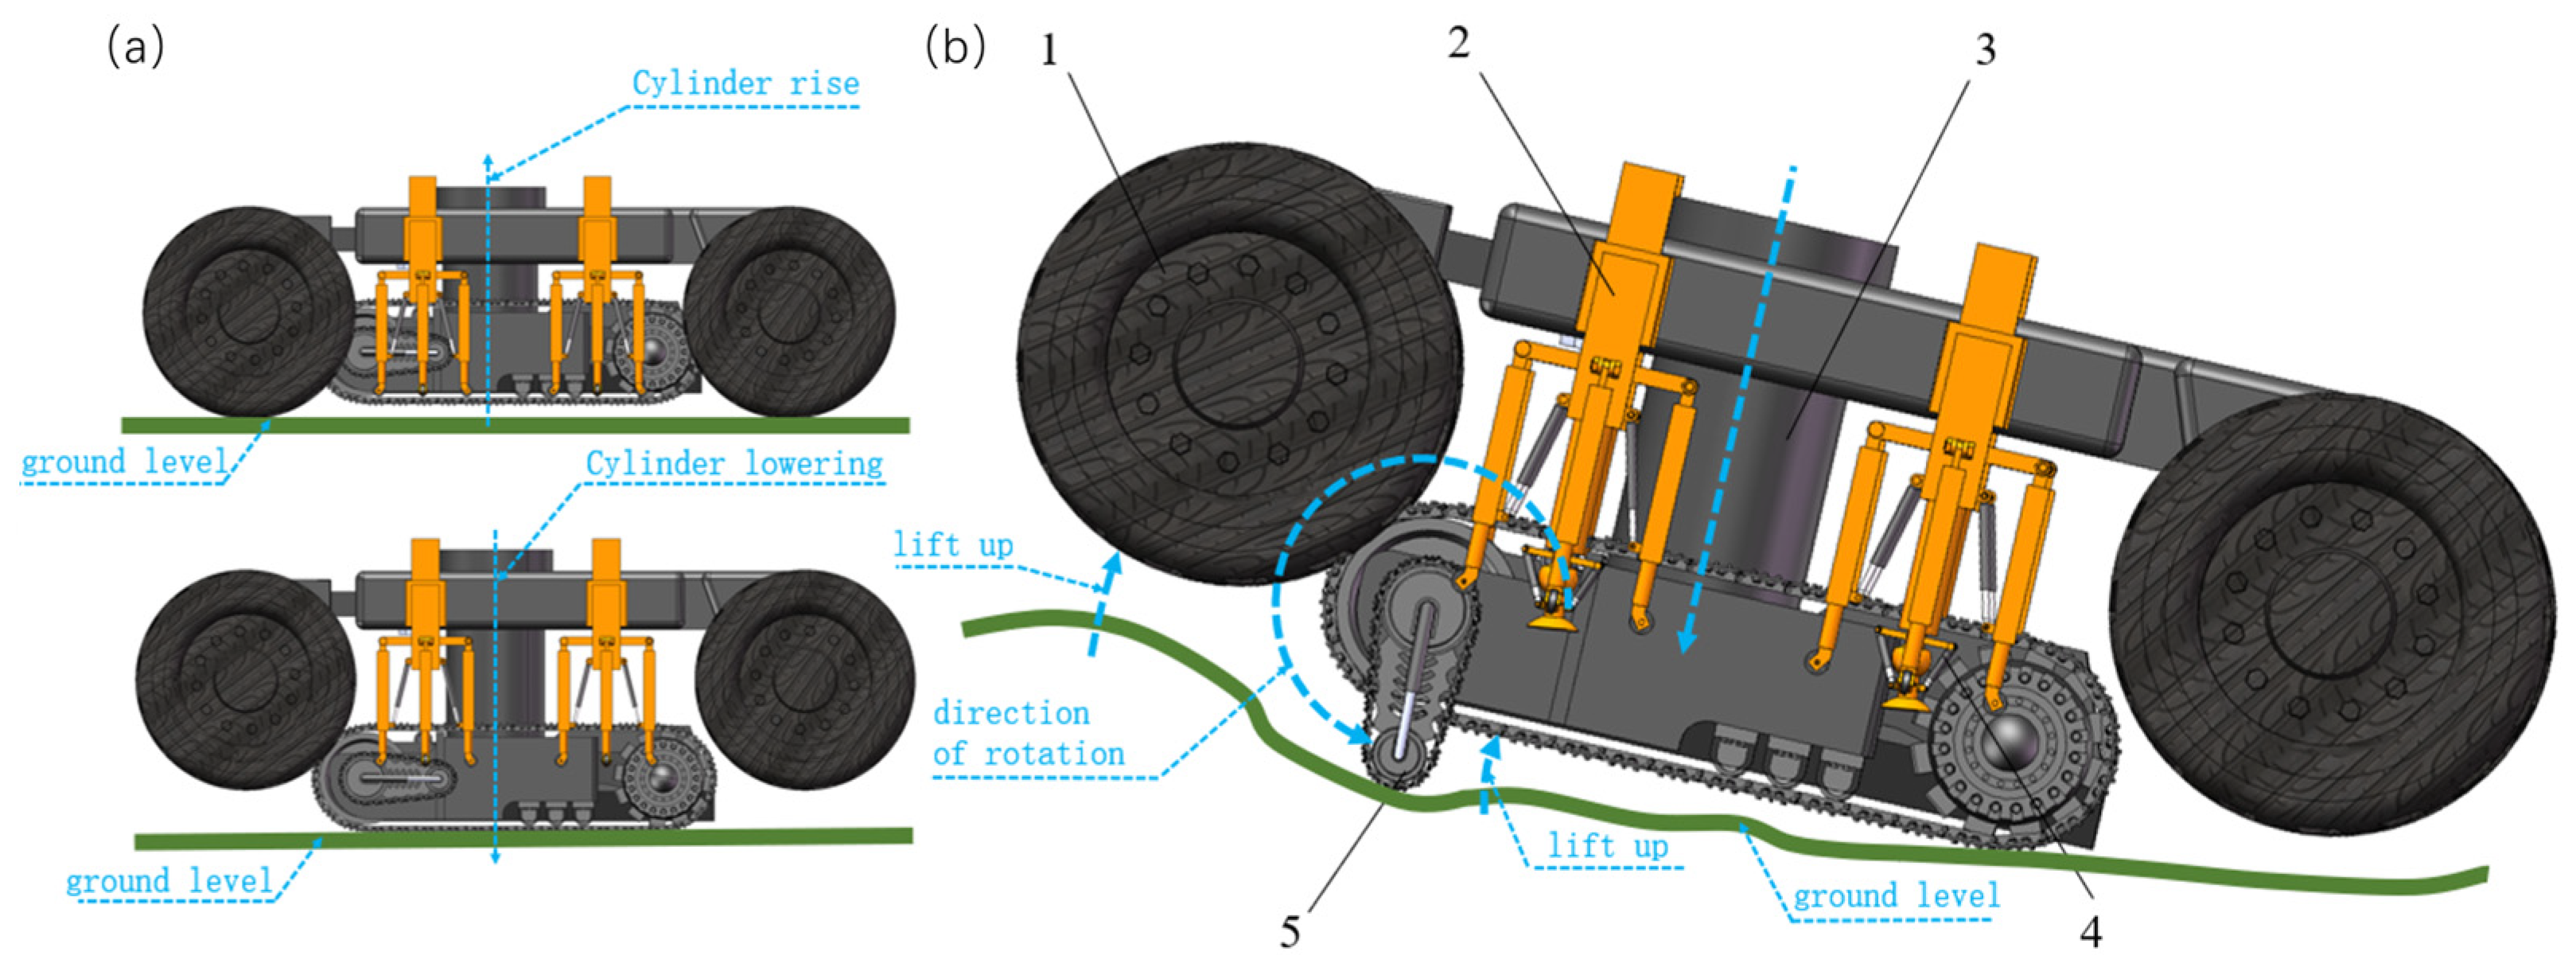
When the grassland ecological cleaning and restoration vehicle works, it is in contact with the ground by the tracks, as shown in Figure 2a. Therefore, reducing the damage to the grassland ecology [16,17,18], the tracks are connected to the main body by hydraulic cylinders, and their rise and fall are controlled by the expansion and contraction of these cylinders. When the grassland ecological cleaning and restoration vehicle travels on a road, the hydraulic cylinders contract and the tracks rise, which puts the tires in contact with the ground, thus increasing the vehicle’s driving speed. At the same time, a rotating track is installed on the track-driven wheel to realize the vehicle’s crossing obstacles, as shown in Figure 2b; additional rotating ball stabilizing and constant outriggers are installed, which are connected to the ball and socket base through the main support arm, and four secondary support arms are added around the periphery, and the bottom end of the secondary support arm is connected to the universal wheel. When the equipment is moving, the main support arm extends out, and the universal wheels at the bottom end of the four secondary support arms contact the ground to ensure the stability of the device; when facing a slope, the angle of the ball-sleeve connection is changed hydraulically to realize the tilting of the base and adapt to the slope.

2.3. Design of Sweeping Device

2.3.1. Structural Design of Disk Brush with Variable Radius and Angle

The existing disk brush head cannot be extended, and the angle cannot be adjusted, which is generally only suitable for sweeping a smooth road surface, and it is difficult to achieve a better cleanup of the gullies, pits, and other places in the grassland area that are likely to accumulate garbage, which limits the sweeping efficiency of the sweeper; therefore, the existing sweeper trash brush is modified.
The structure of the disk brush with variable radius and angle is shown in Figure 3. By adjusting the radius toggle and angle toggle, the two sets of internal meshing rack and pinion drives are quickly adjusted so that the rotation of the toggles is transformed into a change in the center distance of the disk brush and the angle of brush tilt. This design enables the sweeper to flexibly adjust the radius and angle of the disk brush to effectively sweep grassland gullies, grooves, and other uneven and garbage-gathering areas, thus significantly improving the sweeper’s work efficiency. The arm support effectively eliminates vibration during the sweeping process. The arm connects the body to the reducer brush, which not only supports the weight of the brush but also ensures its stability during operation. In addition, the arm controls the up-and-down movement of the disk brush, keeping it in contact with the ground at all times, thus improving sweeping efficiency and stability. A revolving vice connects the arm to the other bracket components to absorb ground shocks and vibrations, lowering the impact on the body joints and boosting the unit’s reliability.
The geometry of the arm bracket helps to maintain the proper positioning of the brush and allows the brush to move through the unit system to adapt to different road conditions, thus increasing the adaptability and flexibility of the vehicle.

2.3.2. Motion Analysis of Disk Brush Swivel Arm Mechanism

Because the arm has to do a lot of work and be light, it is made of 7075 aluminum alloy, which has a density of 2810 kg·m⁻3, a modulus of elasticity of 7.17 × 10¹⁰ Pa, a Poisson’s ratio of 0.33, a tensile strength of 524 MPa, and a yield strength of 455 MPa [19,20,21].
The swivel arm model is imported into the Inspire program, and the joint positions are defined by adjusting the Activated Pin Joint and Activated Cylindrical Joint, as illustrated in Figure 4a. The Activated Pin Joint confines the part’s rotation around a fixed point but does not enable it to move linearly, whereas the Activated Cylindrical Joint allows the part to freely spin in a cylindrical plane while moving axially. Both drives are translational and spring-loaded. The first part goes between the “Spring Stop” and “Shock Absorber Cylinder” parts. The “Drive Motor” base is put on the “Shock Absorber Cylinder” part, with the drive axis lined up with the inner bore of the “Shock Absorber Cylinder” part. In this part, the “Shock Absorber Cylinder” has an inner hole that the driving axis goes along. The “Drive Motor” base is attached to the bottom of the “Spring Baffle Plate” part. Figure 4b depicts the “Oscillation” driving equation, which simulates the vibration phenomenon during the sweeping operation. The drive type is “displacement,” and the initial driving direction is along the axis. The later drive is used in the same place, with a free length equal to the distance between the end face of the shock absorption cylinder and the end face of the spring stopper (500 mm), with all other settings set to default.
We carry out the kinematic analysis of the swivel arm mechanism after installing the drive. The end time is set at 2 s, the output frequency is 50 Hz, the analysis type is transient, and gravity and contact effects are taken into account. During the analysis, the oscillation of the “drive motor” changes the alternating load on the rotating arm mechanism. Figure 5a shows the load curves for each part, and Figure 5b shows the motion displacement curve of the rotating arm. The moving arm’s oscillation amplitude displacement curve is bigger along the “shock-absorbing cylinder” parts of the bore surface axis Z direction, as can be seen from the curve. This is mostly because the direction of the vibration and the direction of the drive motor vibration are the same, which causes the vibration to be transmitted and amplified. In the X-direction, which is perpendicular to the end face of the arm, the motor’s vibration direction almost completely acts on the end face of the arm. This is why the displacement curve in this direction has a nearly zero amplitude of oscillation, showing that the arm is rigid and can withstand vibrations well.

2.3.3. Static Force Analysis of Disk Brush Swivel Arm Mechanism

Hydrostatic analysis of the swivel arm determined the maximum displacement and maximum equivalent force, as shown in Figure 6. The model weighs 15.909 kg and has a maximum displacement of 0.001364 mm, located at the front end of the connecting hole between the spinning arm and the spring stopper. The hydrostatic analysis shows that the most movement is concentrated in this area. This may be because the oscillations are louder in the Z-axis direction, which means that more weight is being put on that side. The maximum von Mises stress is 143.6 MPa, placed at the lower end of the connection hole between the rotating arm and the spring stopper, and it still has a considerable safety margin when compared to the yield strength of the material (7075 alloy), which is 455 MPa. As a result, the rotating arm’s design allows for significant weight savings.

2.3.4. Optimization of Disk Brush Swivel Arm Topology

Variable density method continuum topology optimization is one of the more widely used of the many topology optimization methods [22]. At its core, it assumes that there is a pseudo-density relationship between the elastic modulus of a material and its relative density [23]. The algorithm that figures out which units to keep in the design space says that the final topology scheme is made up of the units that were kept to achieve topology optimization. The mathematical model for the variable density method can be found in reference [24].
ρ = [ ρ 1 ,   ρ 2 , ,   ρ n , ] T min f ( ρ ) s . t . V 0 i = 1 n ρ i V i V i α 0 ρ i 1 g ( ρ )
In the above equation:
  • ρ—lative density of the ith cell;
  • Vi—Volume of the ith cell;
  • Vo—original volume;
  • α—Percentage reduction in volume;
  • f(ρ)—objective function;
  • g(ρ)—constraint function.
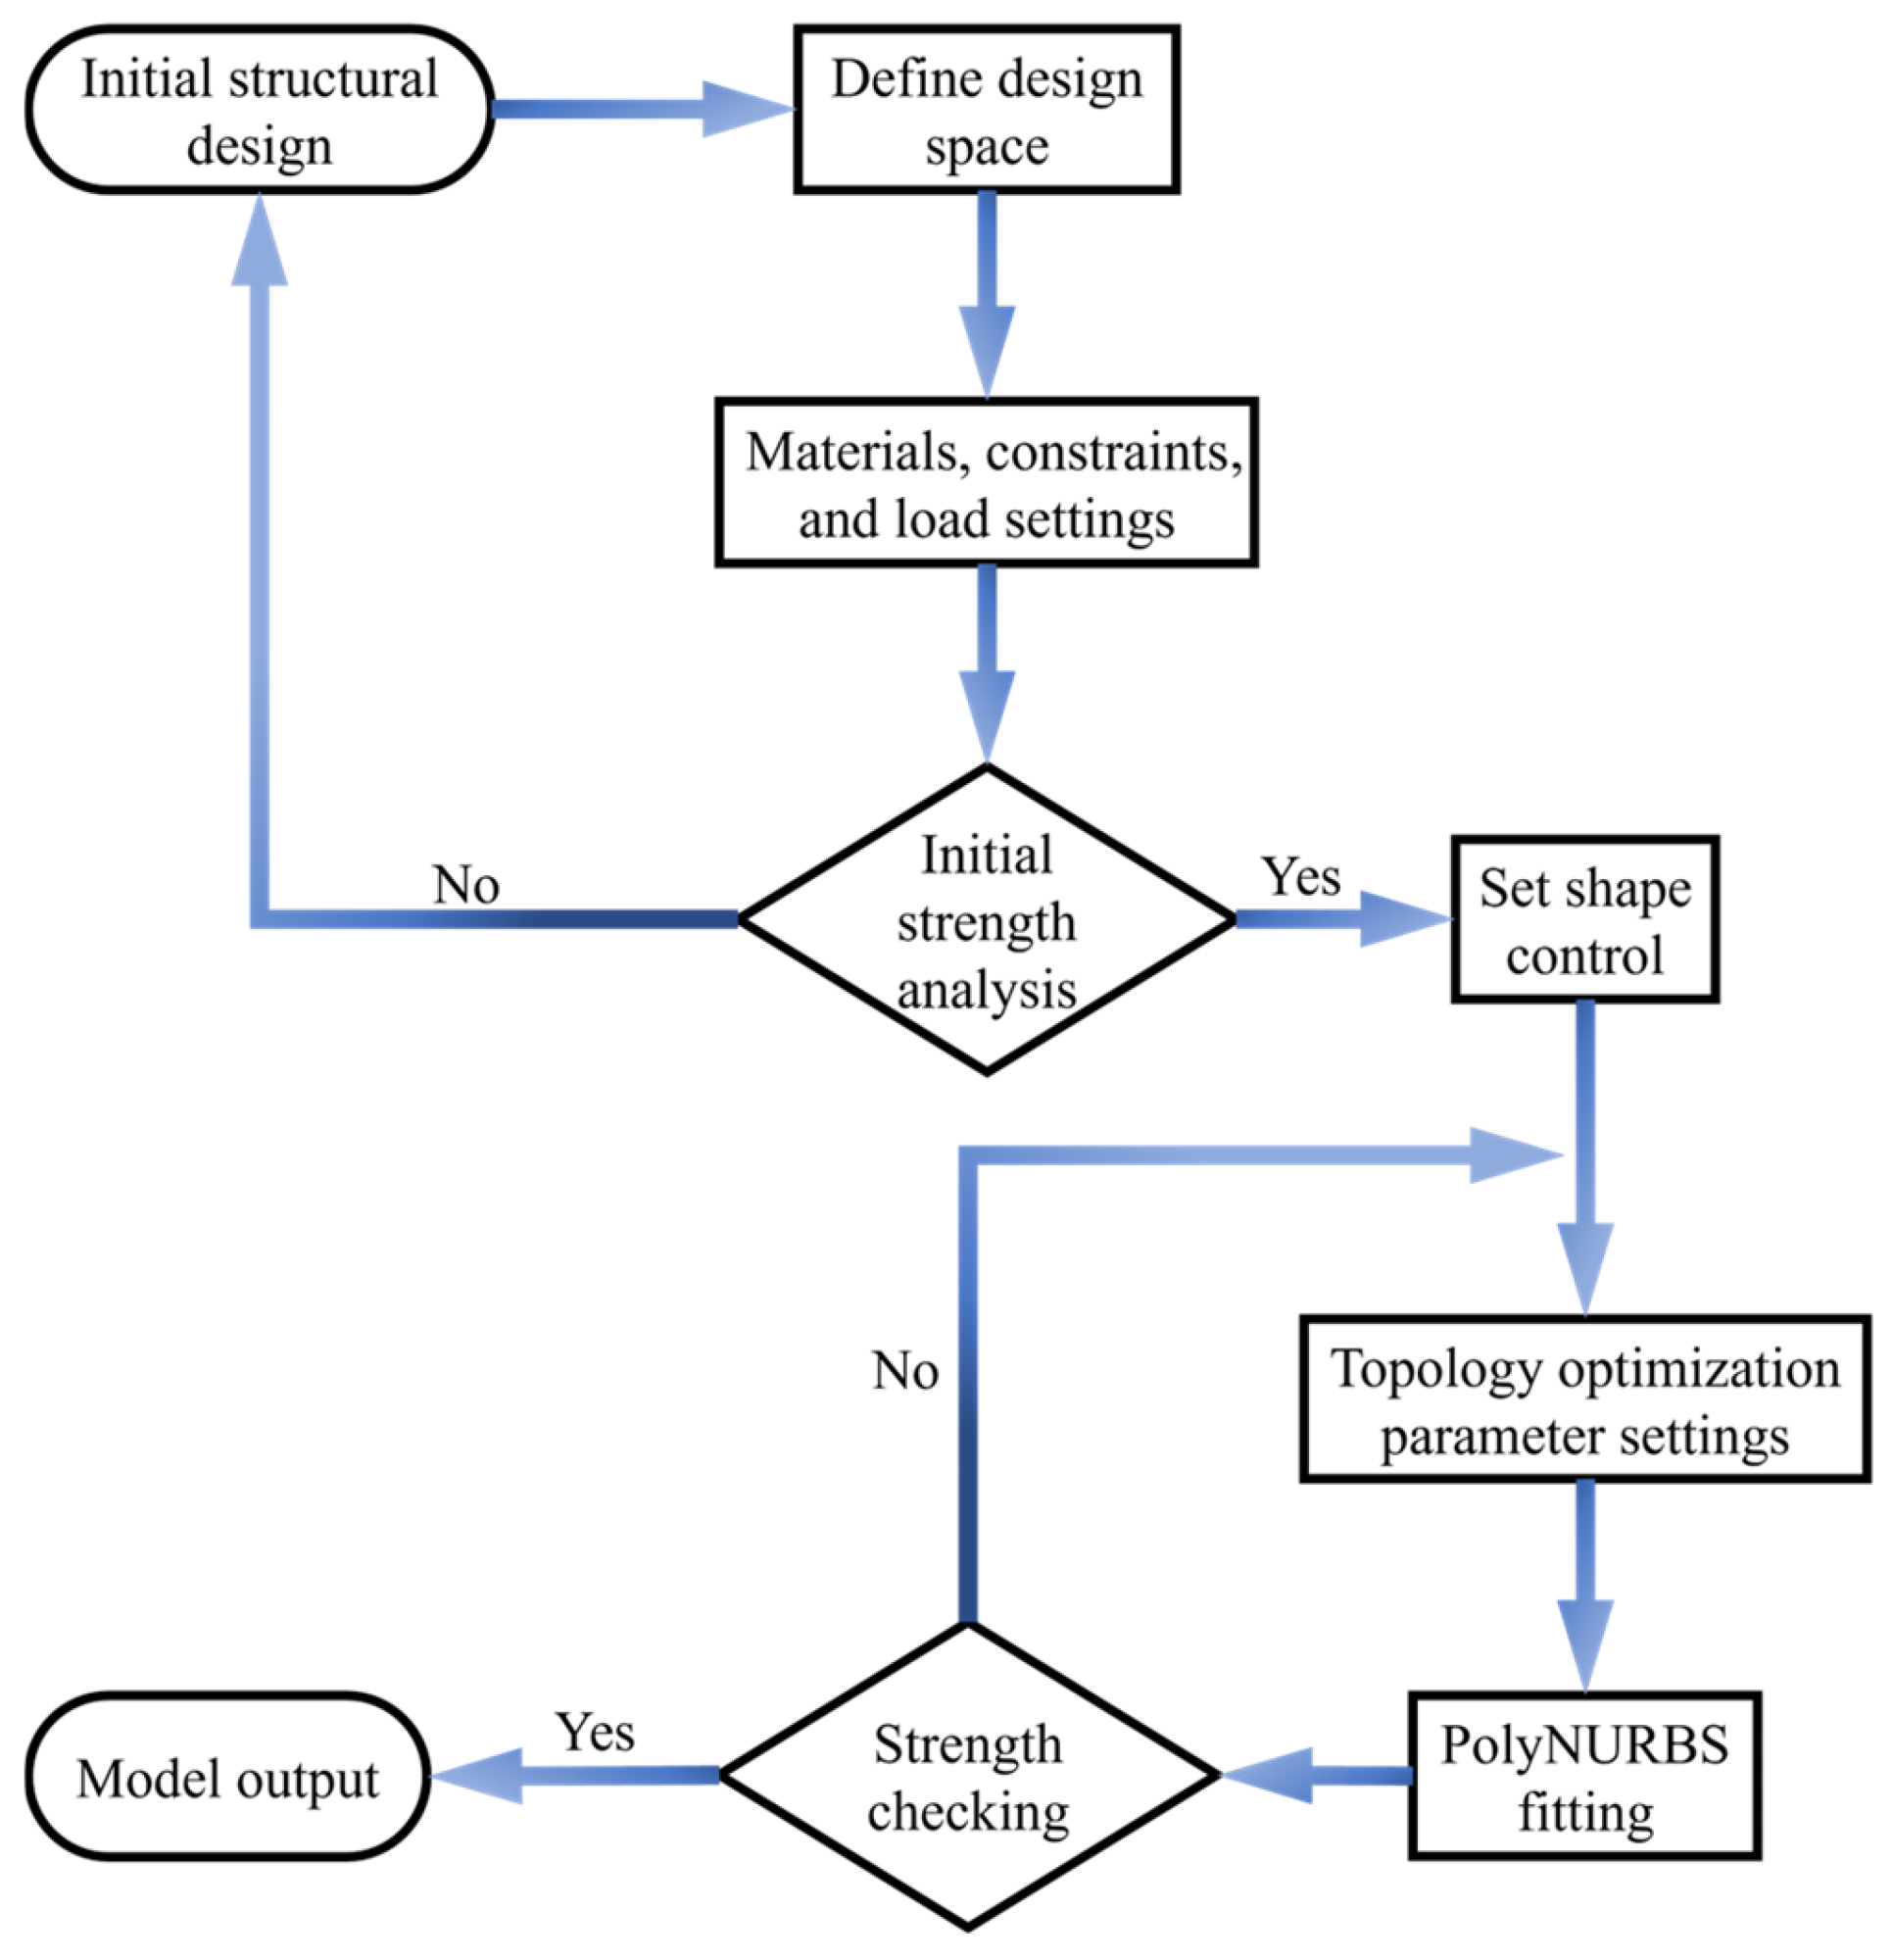
The model is reconstructed by setting materials, loads, and constraints on the initial structure, performing kinematic structural analysis, setting up the design space, setting optimization parameters and objectives, and finally carrying out strength checks. Its whole optimization process is shown in Figure 7.
The topology optimization technique, i.e., finding the best material distribution or force transfer path in a given design space, adjusts the distribution of materials to optimize a certain morphological index of the structure and obtains the design with the lightest weight under the condition of satisfying the product performance [25,26,27], and the optimization results are shown in Figure 8a. In the geometrical reconstruction of the swivel arm, the optimal weight reduction is firstly derived by automatic fitting as shown in Figure 8b. The optimization process to ensure the part’s functionality and assembly requirements prevents material removal from the non-design space [28].
Encountering a situation where the design space intersects with the non-design space will reduce the safety factor of the model and make it more susceptible to damage. For this reason, the material distribution of the swivel arm was adjusted by manual fitting to make it more reasonable, and its final mass was 7.091 kg, which achieved a weight reduction of 55.43% through lightweight design; the final model is shown in Figure 8c.

2.3.5. Calibration of the Results of the Topology Optimization of the Disk Brush Swivel Arm

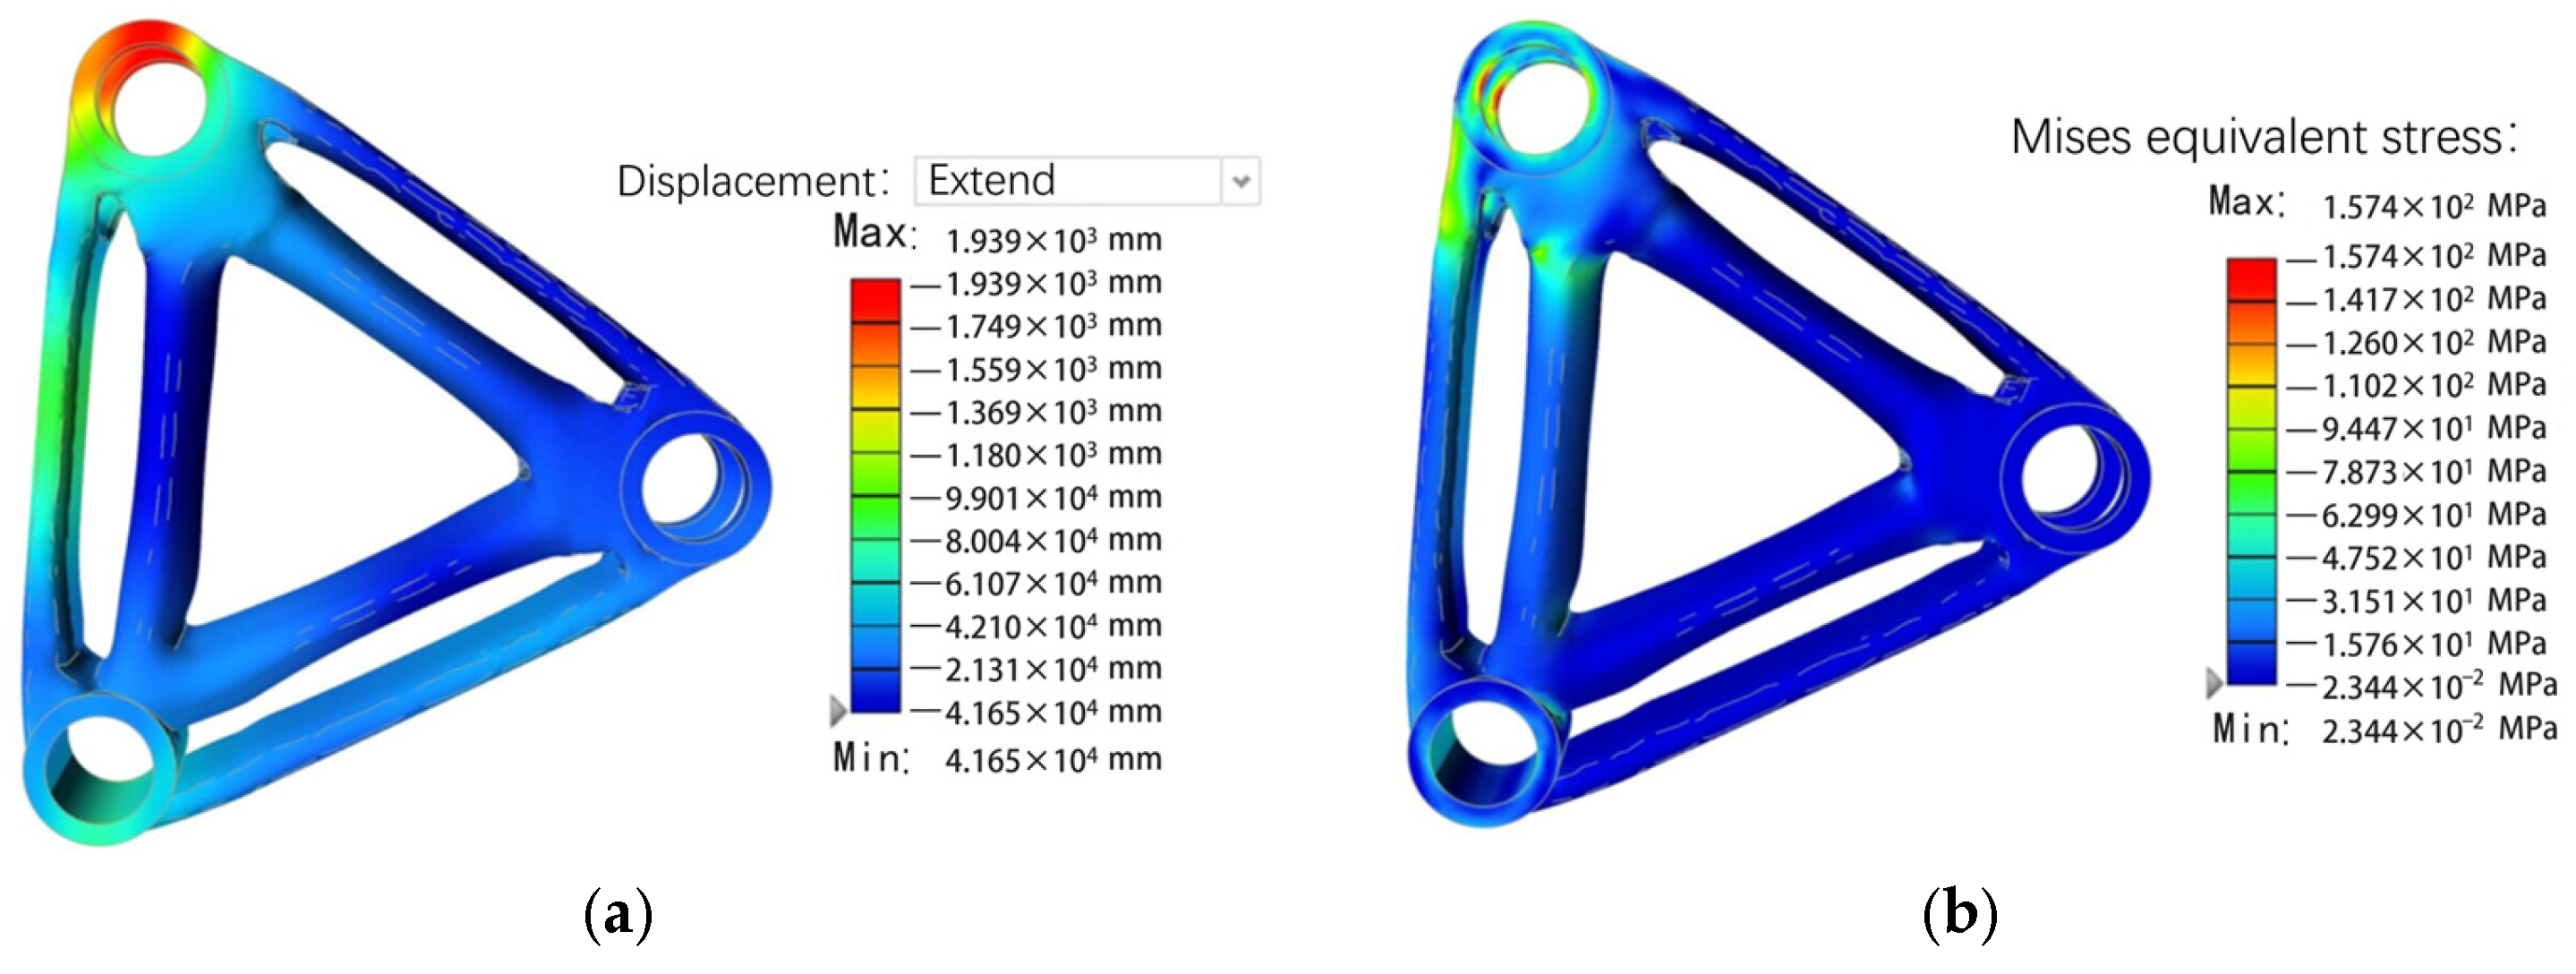
The optimized model is again imported into Inspire software for hydrostatic analysis, and the displacement cloud and von Mises equivalent stress cloud are shown in Figure 9. The maximum displacement of the component after lightweight is 0.001939 mm and the maximum von Mises equivalent stress is 157.4 MPa, and the comparison before and after optimization is shown in Table 2. The increased amount is still within the safe range, and the lightweight design of the rotating arm parts achieves a weight reduction of 55.43% and meets the actual strength requirements.
The initialized model and the topology-optimized model are installed into the disk brush swivel arm bracket for motion simulation, respectively, to obtain the energy profile as shown in Figure 10.
The images show that the enhanced design of the rotating arm support for the disk brushes resulted in a considerable reduction in energy consumption during movement while also reducing the total weight of the rotating arm.
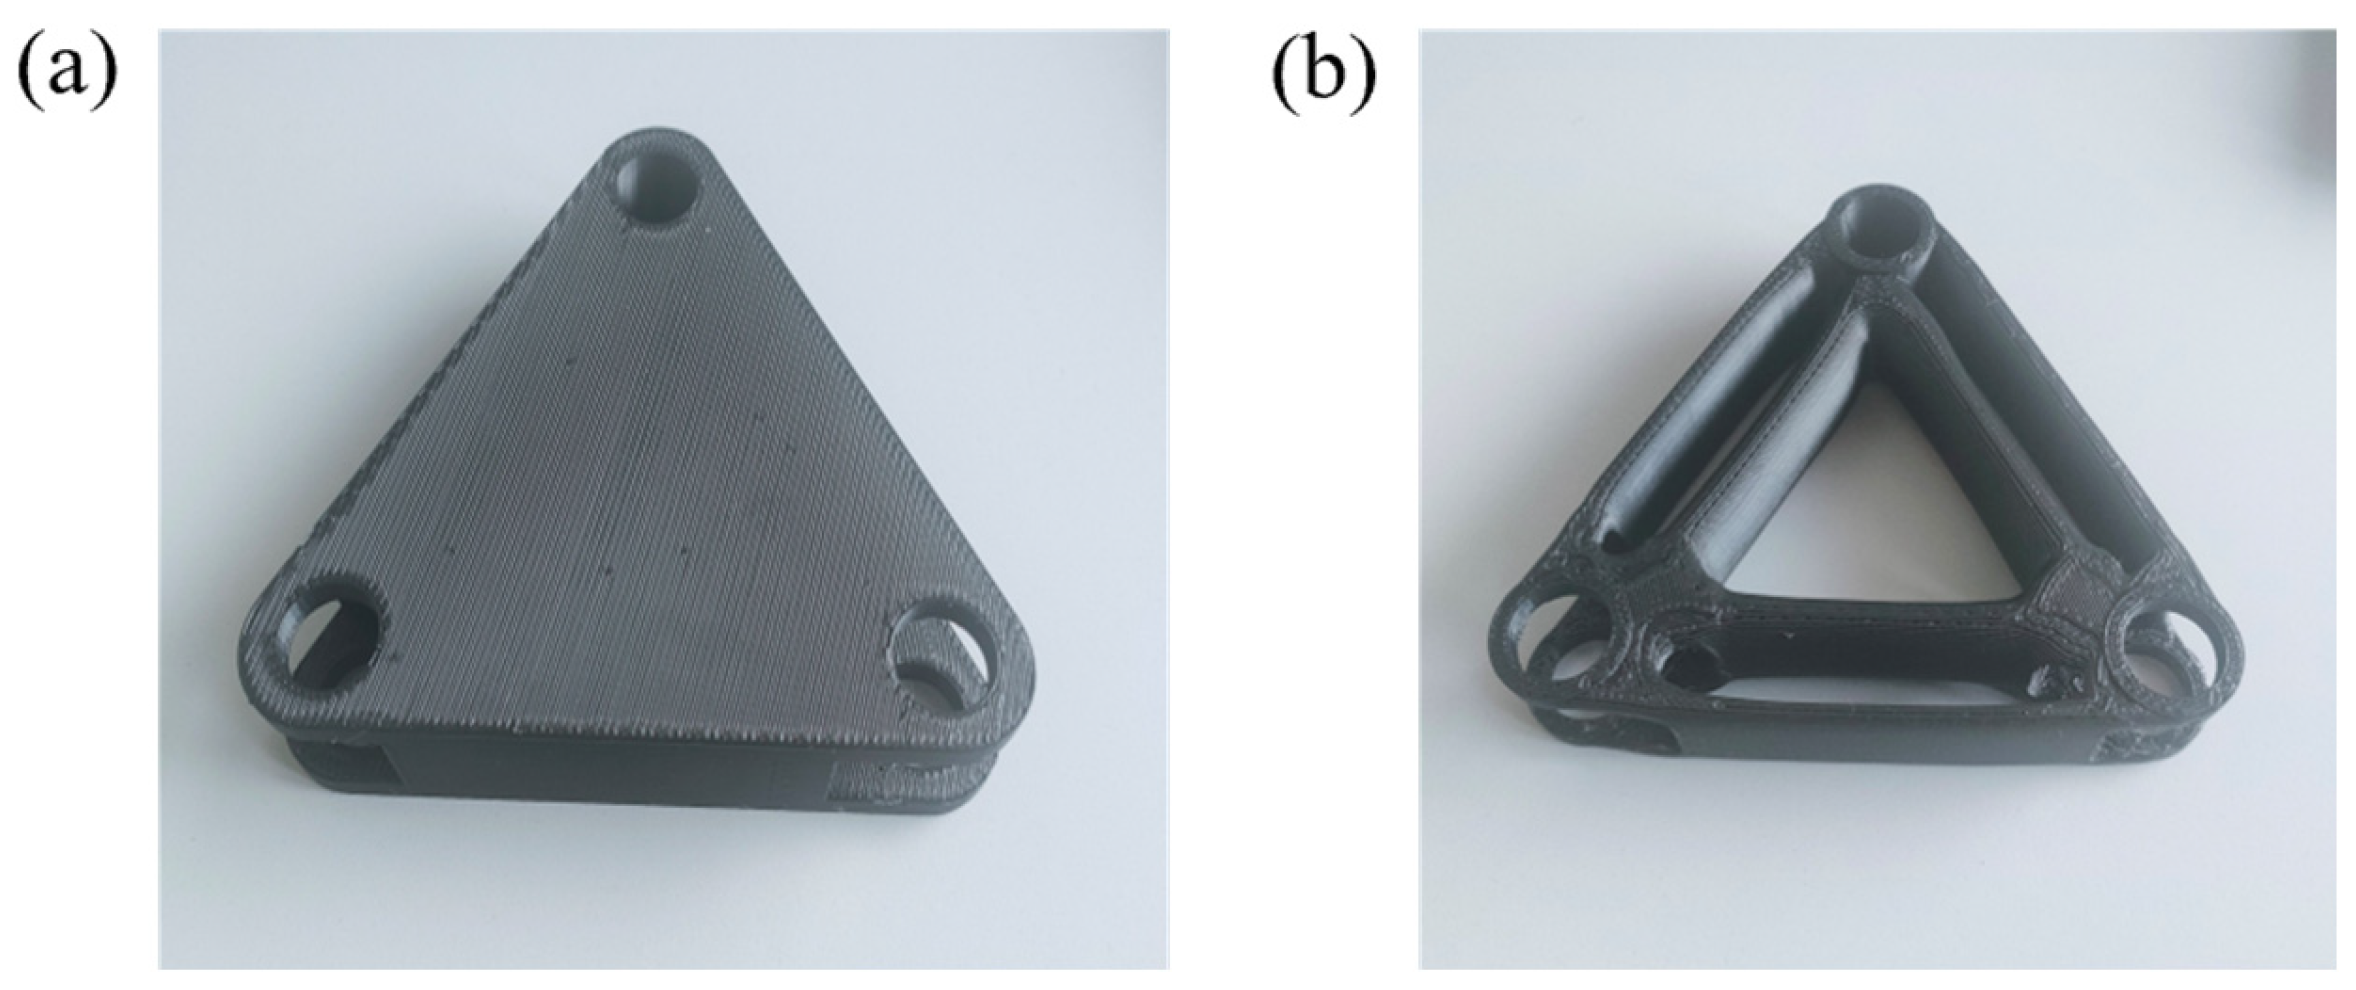
By printing the topology-optimized model in conjunction with 3D printing technology, we were able to carry out a faster and better validation of the rationality of the designed target product [29], as shown in Figure 11.

2.4. Design of the Waste Disposal Unit

2.4.1. Mechanism of the Spiral Knife Waste Shredding Device

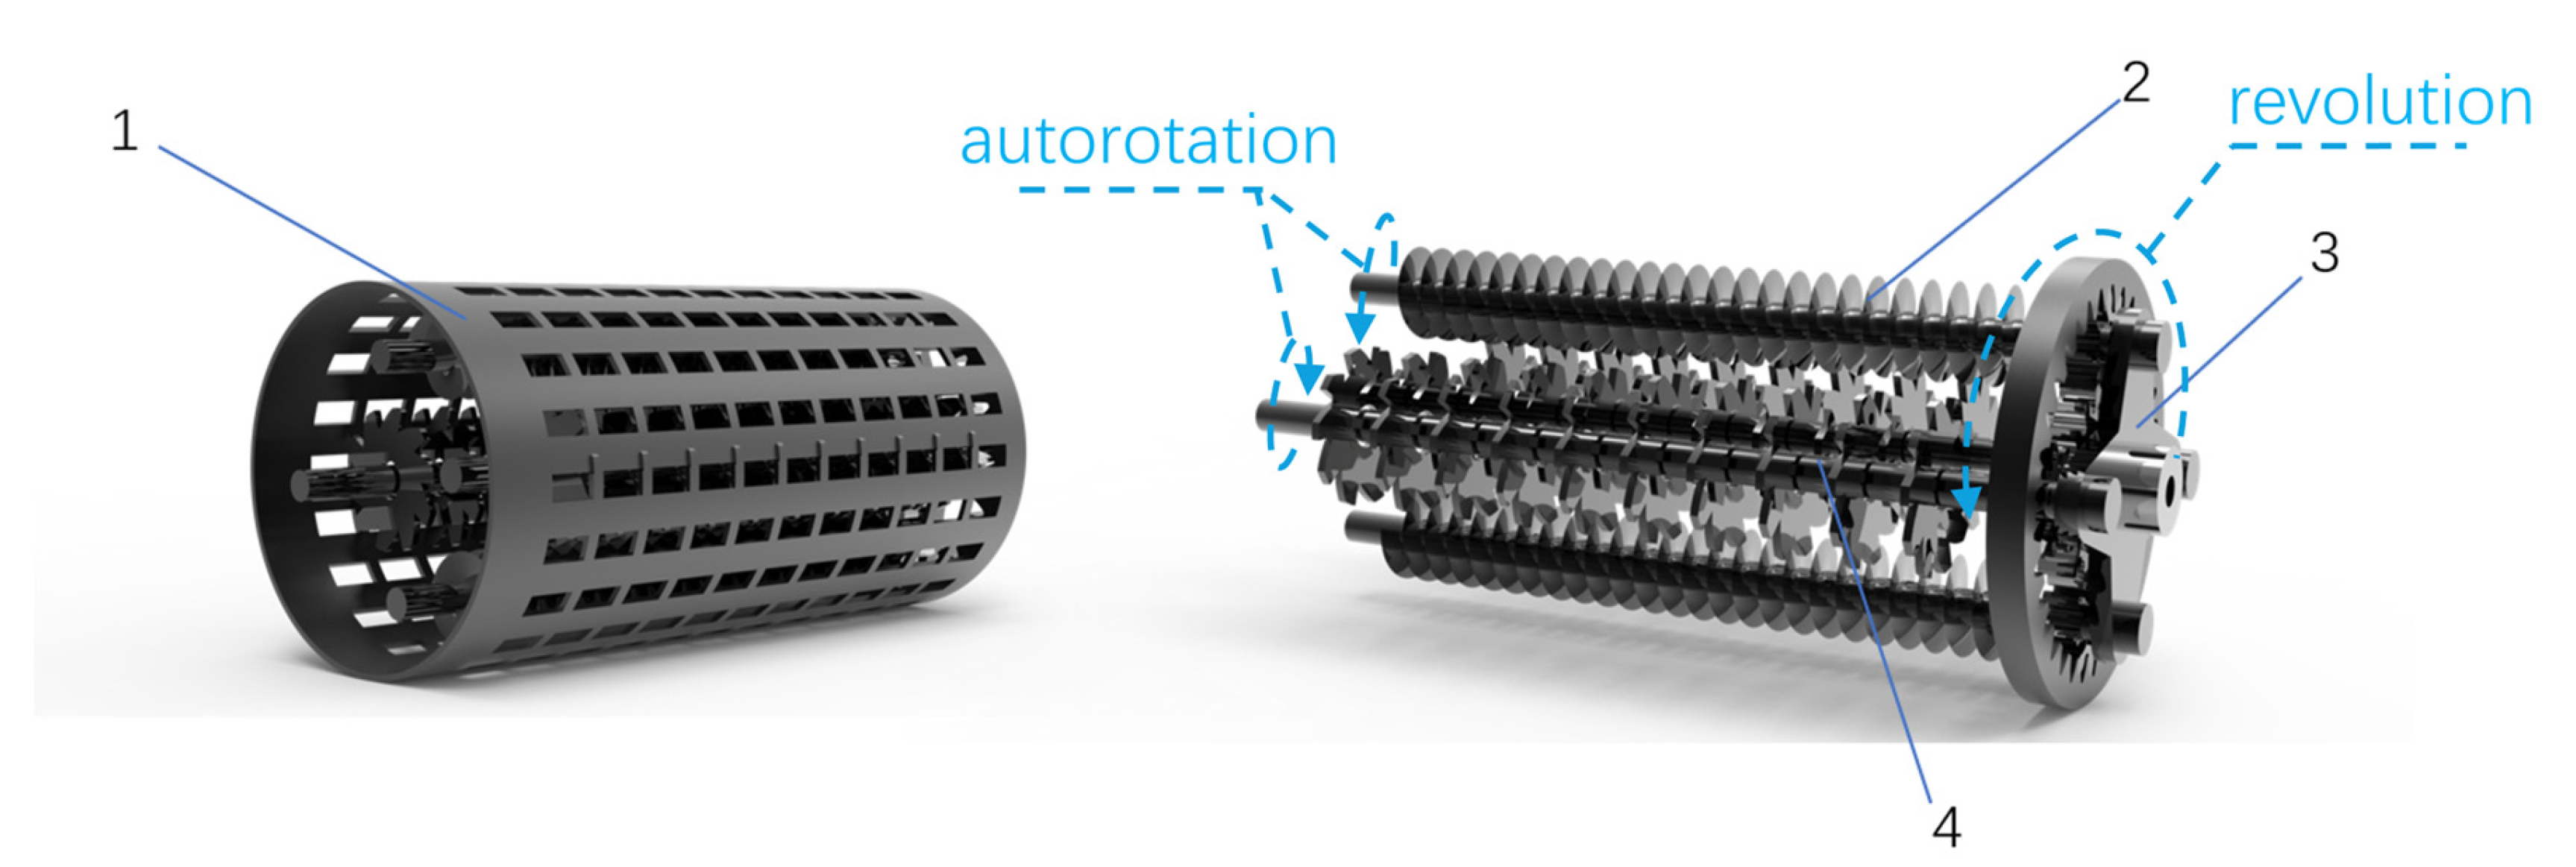
The working principle of the spiral knife rubbish shredding device is as follows: the motor shaft drives the large gear to rotate, and the large gear further drives the four planetary gears to rotate. The planetary gears are fitted with reamers, which rotate around the axis of the large gears while rotating themselves to grind. The spiral shape allows for continuous feeding and efficient shredding, making it possible to treat huge amounts of tough material quickly.
The construction of the helical blade ensures that the waste is uniformly stressed during the cutting process, which reduces tool wear and improves cutting results. Compared to conventional cutting knives, the design of spiral knives reduces the likelihood of trash clogging, thus improving continuity and stability of operation. The spiral reamer knife typically maintains low energy consumption during operation, reducing dependence on electrical resources and meeting the requirements of sustainable development. With the ability to process a wide range of waste types, including plastics, paper, and metals, the machine is highly adaptable to meet different waste disposal needs. The effective winnowing mechanism significantly reduces the volume of waste and facilitates subsequent transport and disposal. This is shown in Figure 12.

2.4.2. Kinematic Analysis of Spiral Knife Waste Shredding Devices

After reducing the model to a factor of 40, we carried out a detailed analysis of the helical knife waste shredding device using the Motion module of SolidWorks software. The gravitational acceleration was set to 9.806 m/s2, and a rotary motor was mounted on the reamer support disk at a speed set to 120 r/min, while a resisting moment of 100 N·m was applied to simulate the load that the reamer would be subjected to during the rubbish winnowing process, resulting in a moment analysis as shown in Figure 13 and a displacement analysis as shown in Figure 14.
From the results, as shown in Figure 13, it can be observed that both the angular and linear moments of the reamer exhibit sinusoidal waveforms and continue to increase with increasing acceleration. This simulation effectively demonstrates the dynamics of the reamer’s rotation about its full-circle rotary motion around the reamer. In the acceleration curve, it can be seen that the reamer exhibits instability in shredding the rubbish, and the acceleration curve varies strongly in 0–2 s after the device is started; as the rubbish is stirred and the reamer speed gradually stabilizes, the acceleration stabilizes and exhibits a periodic distribution, and the graphs show oscillatory variations in the moments from positive to negative as a certain point of the reamer rotates around the axis.
From the results, as shown in Figure 14, it can be seen that the angular velocity displacement of the reamer exhibits a rigid shock during the push stroke and a flexible shock during the return stroke. This impact feature provides a high inertial force during winnowing, which aids in the effective crushing of trash, whilst the softness during the return stroke helps to the device’s longevity and vehicle stability [30].
The start-up acceleration of the reamer is very low during the first 2 s of device activation, resulting in a slow change in angular displacement, reflecting the operating state of the device when it first starts to shred the litter. The linear displacement of the reamer showed a sinusoidal periodic distribution, showing the up-and-down movement of the upper point of the reamer as it rotated with the shaft. As the speed increases, the cycle of periods becomes tighter until the system reaches a steady state.

2.5. Working Mechanism of Centre of Mass Leveling Device

A carriage leveling device is installed under both sides of the middle section of the carriage and used to support the carriage. When the vehicle is stable, the device does not run; when the vehicle passes through a bumpy road or is climbing, the device is activated, so that the carriage is always level, that is, rotated relative to the vehicle, using the carriage and the mass of rubbish to balance the mass of the vehicle, to improve the stability of the device, as shown in Figure 15.
The device is equipped with a leveling sensor and a controller, both of which are connected to a servomotor. The leveling sensor is used to monitor the tilting status of the carriage, and when the tilting angle exceeds a preset value, the sensor transmits a signal to the controller, which then instructs the servomotor to level the carriage. The worm gear rotates under the servomotor’s drive, and because the worm wheel is fastened to the base, the worm gear rotates around it, causing the carriage and its parts to level.
When the carriage base rotates, the lower moving gear rotates around the fixed gear. The worm gear and worm wheel work together to adjust the horizontal angle of the carriage, and the fixed gear and mobile gear work together to support the weight of the carriage, both working together to ensure smooth angle adjustment and extend the life of the device.

2.6. Grass Seed Sowing Device Working Mechanism

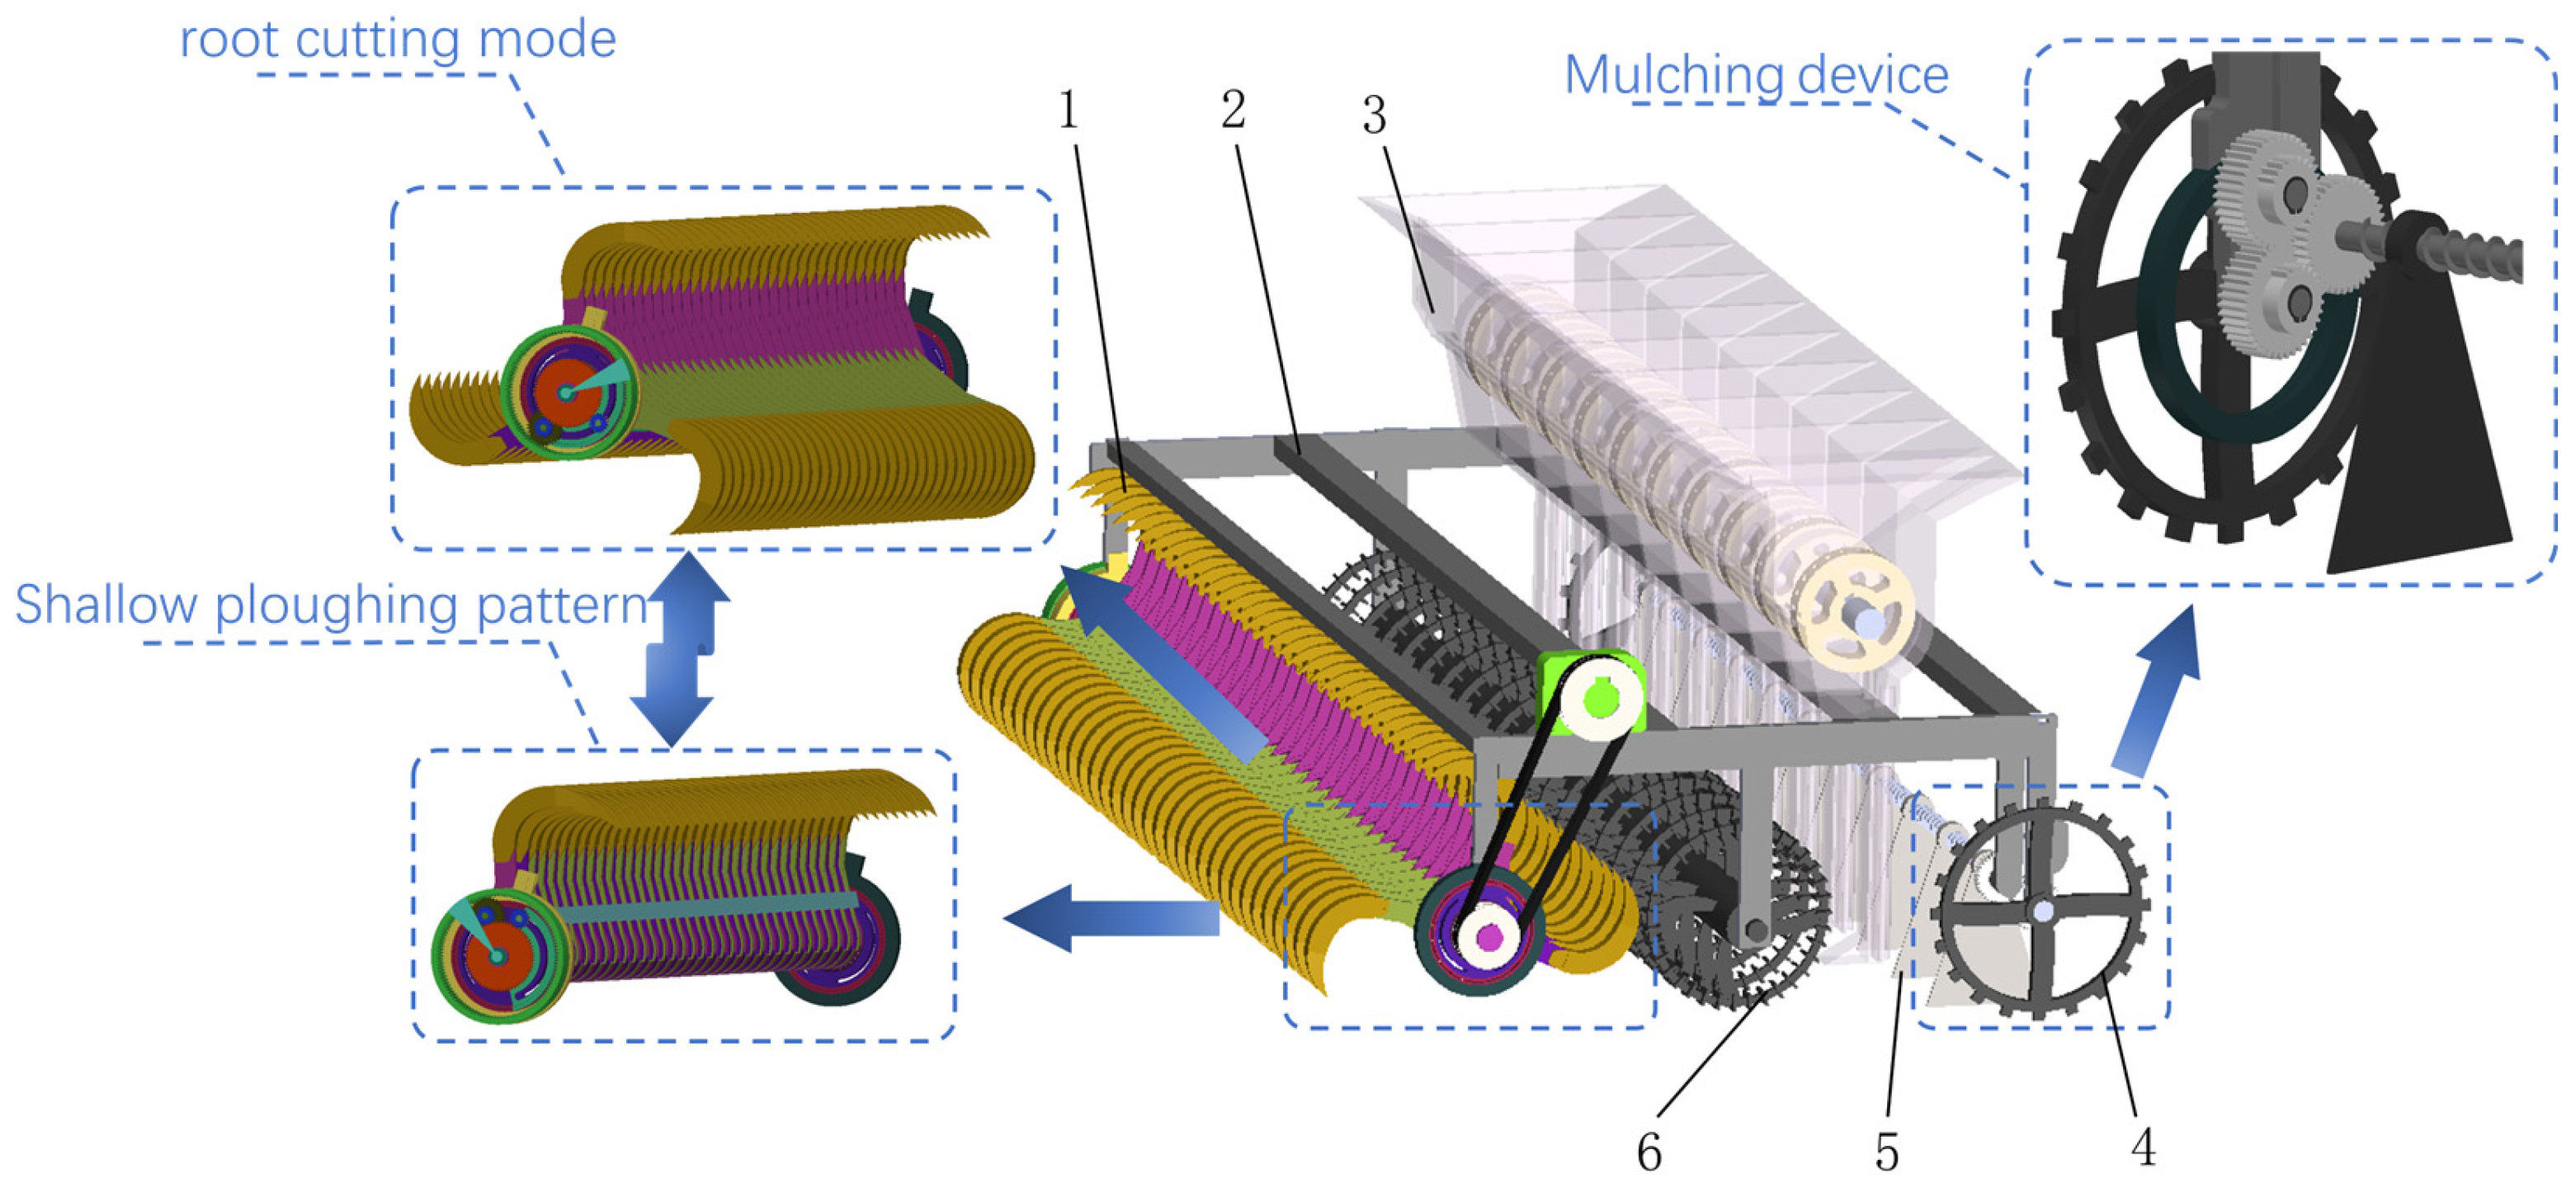
The restoration and regeneration of grassland ecological areas are very important for the grassland ecological cleaning and restoration vehicle; the land contaminated by waste needs to be sown again, to gradually restore the ecology, and the grassland area as a whole is large, and more time needs to be spent for planting work. Nowadays, the seeding equipment is only suitable for working on the edge of flat grassland, and it is easy for it to be powerless or ineffective for some undulating terrain or gravel [31]. Therefore, the research and design of the grass-seeding device are shown in Figure 16. The soil-turning device adopts an innovative design, and its main purpose is to switch between two working modes through the circular arrangement of three sets of reamers. The first working mode is the root cutting mode, in which the three sets of reamers are distributed around the main shaft every 120°. When the vehicle is moving forward, the spindle transfer mechanism is activated, and the device cuts and slits the turf, which is suitable for moderately degraded grasslands with predominantly rhizomatous plants. The second mode of operation is the shallow plowing pattern, in which the three reamers completely overlap to form a complete tilling blade. When the vehicle is moving forward, the spindle transfer mechanism also works, and the device plow the land, which is mainly applied to sand-covered grassland (sheet sand-covered type) and eroded grassland (erosion-roughened type).

3. Methodology and Simulation

3.1. Parametric Modeling of Disk Brush Movement

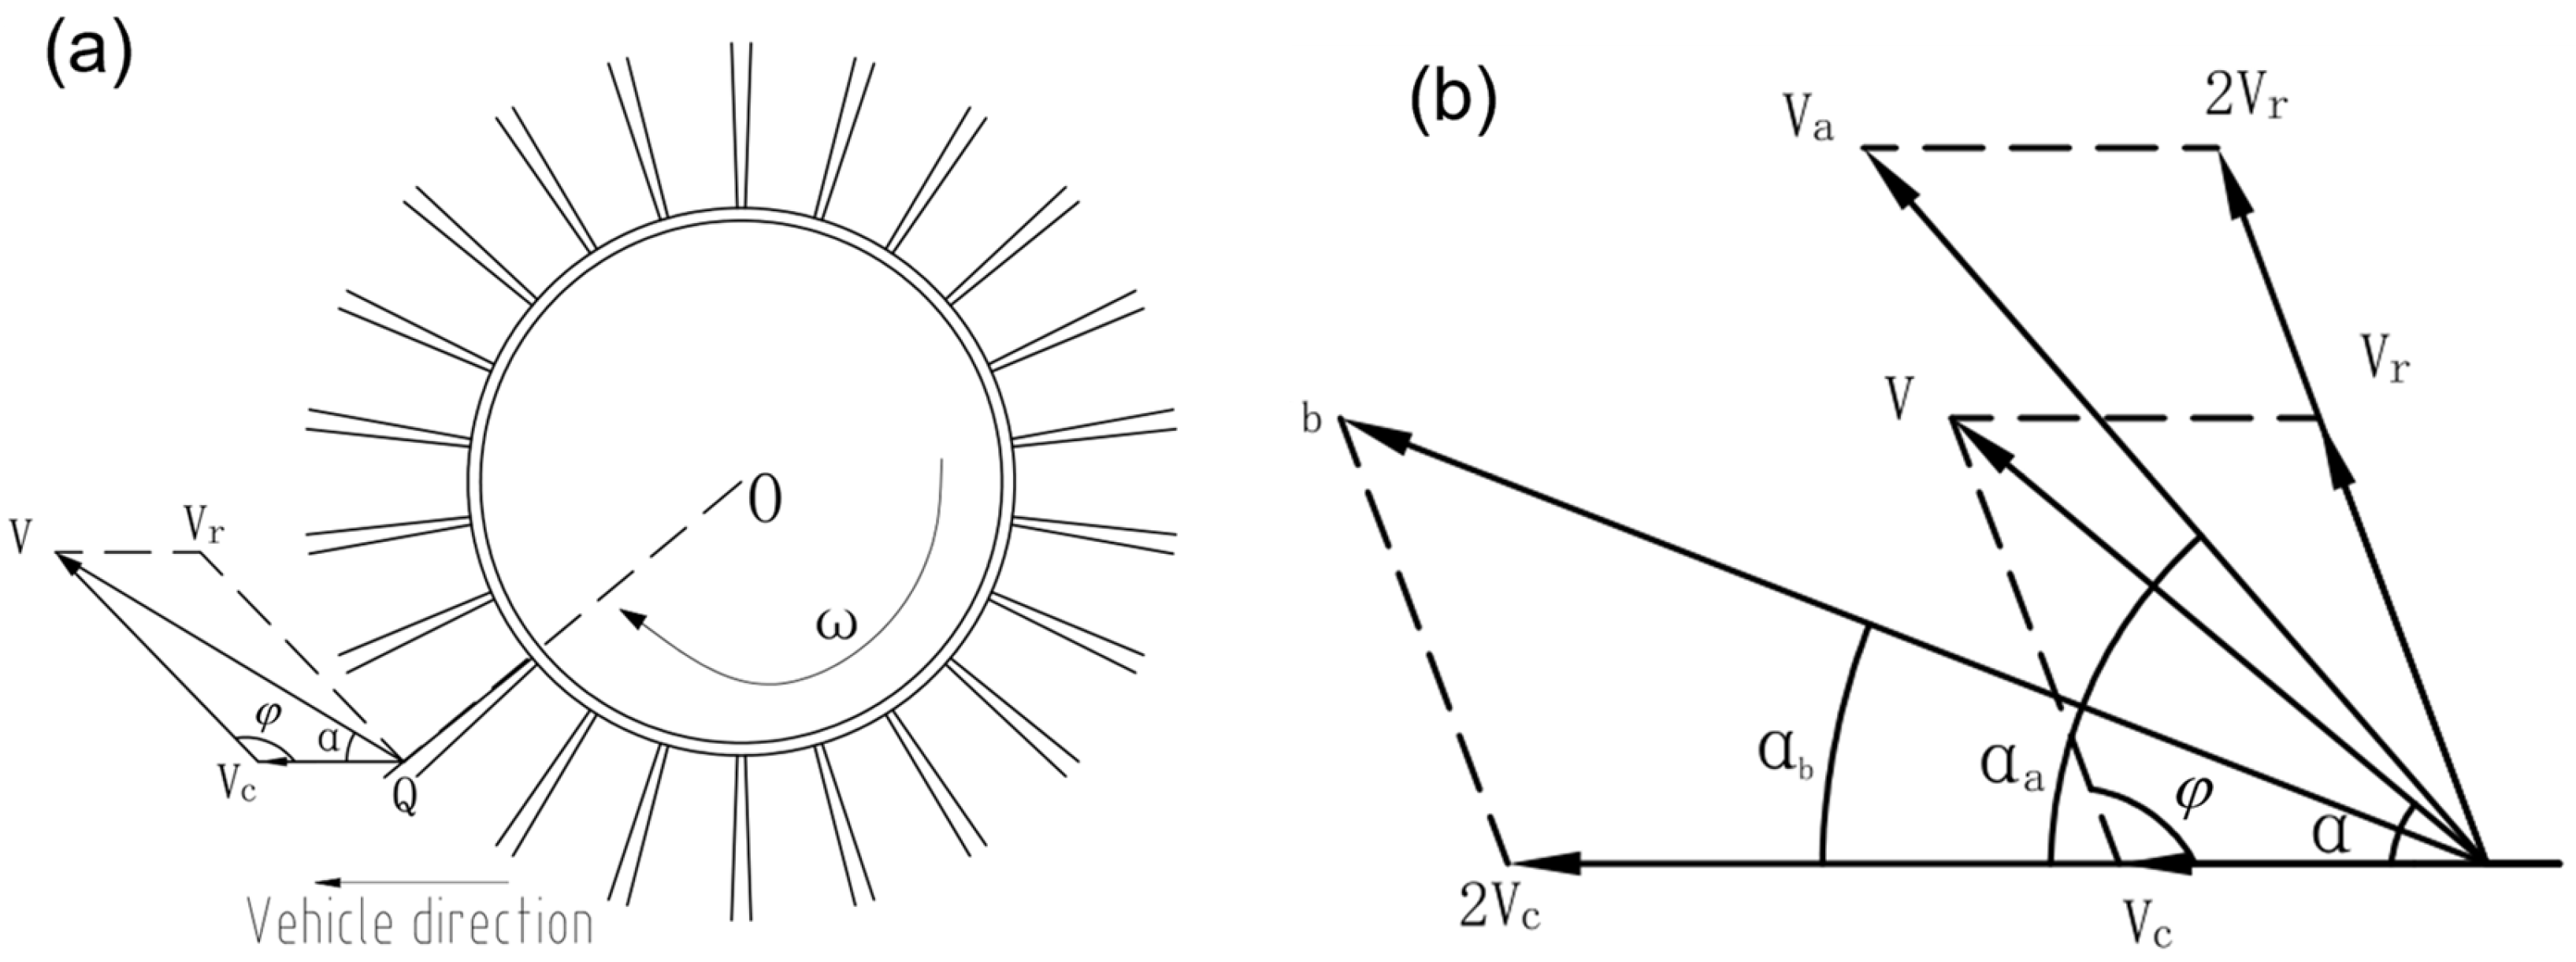
When the grassland ecological cleaning and restoration vehicle is traveling in a straight line, the disk brush moves along a circular trajectory. Due to the difference between the driving speed and the rotational speed of the disk brush, the kinetic energy of the collision that the rubbish is subjected to during the cleaning process changes, thus affecting its throwing trajectory. To analyze the effects of traveling speed and disk brush rotational speed, a disk brush motion model is established as shown in Figure 17 [32]. Figure 17a demonstrates the motion synthesis between the disk brush and the litter at the action point Q, while Figure 17b depicts the synthetic relationship of the velocity change at the Q point. Assuming that the radius of OQ is r and the rotational speed of the disk brush is ω, the absolute velocity at point Q is derived from the synthesis of the traveling speed of the repair vehicle and the rotational speed of the disk brush.
According to Figure 17, the following series of formulas can be derived as shown below [32]:
V r = ω × r
V = V c 2 + ω 2 r 2 2 V c ω r cos φ
α = cos 1 V c ω r cos φ V c 2 + ω 2 r 2 2 V c ω r cos φ
Style: ω is the rotational speed of the disk brush; r is the radius of the disk brush; V is the absolute velocity of the ground at the point of contact of the disk brush relative to the ground. Vc is the traveling speed for the sweeper; φ is the angle between the forward direction of the sweeper and the direction of linear velocity at the grounding point; α is the angle between the traveling speed of the sweeper and the absolute speed of the sweeper.
Assuming disk brush speed ωa = 2ω, sweeper traveling speed Vc remains unchanged.
V a = V c 2 + 4 ω 2 r 2 4 V c ω r cos φ
α a = cos 1 V c 2 ω r cos φ V c 2 + 4 ω 2 r 2 4 V c ω r cos φ
Through the graph, and comparing Equations (2) and (4), we obtain Va > V, and comparing Equations (3) and (5) we obtain α a > α .
When the operating speed Vc of the sweeper is kept constant, if the rotational speed ω of the disk brushes is increased, the absolute speed V of the sweeper’s work will increase, thus enhancing the kinetic energy gained by the rubbish and making it easier to disturb the rubbish in the grass. The angle α between the absolute speed of the sweeper and its traveling speed increases, and when the angle α increases, when analyzed in conjunction with Figure 17, the throwing path of the rubbish in the grass moves towards the suction pick-up area of the suction pipeline, which can improve the cleaning efficiency of the sweeper.
Assuming that the rotational speed of the disk brush ω remains constant, the sweeper traveling speed Ve = 2Vc.
V b = 4 V c 2 + ω 2 r 2 4 V c ω r cos φ
α b = cos 1 2 V c ω r cos φ 4 V c 2 + ω 2 r 2 4 V c ω r cos φ
Through Figure 17 and comparing Equations (2) and (6), we obtain Vb > V, and comparing Equations (3) and (7), we obtain α b < α .
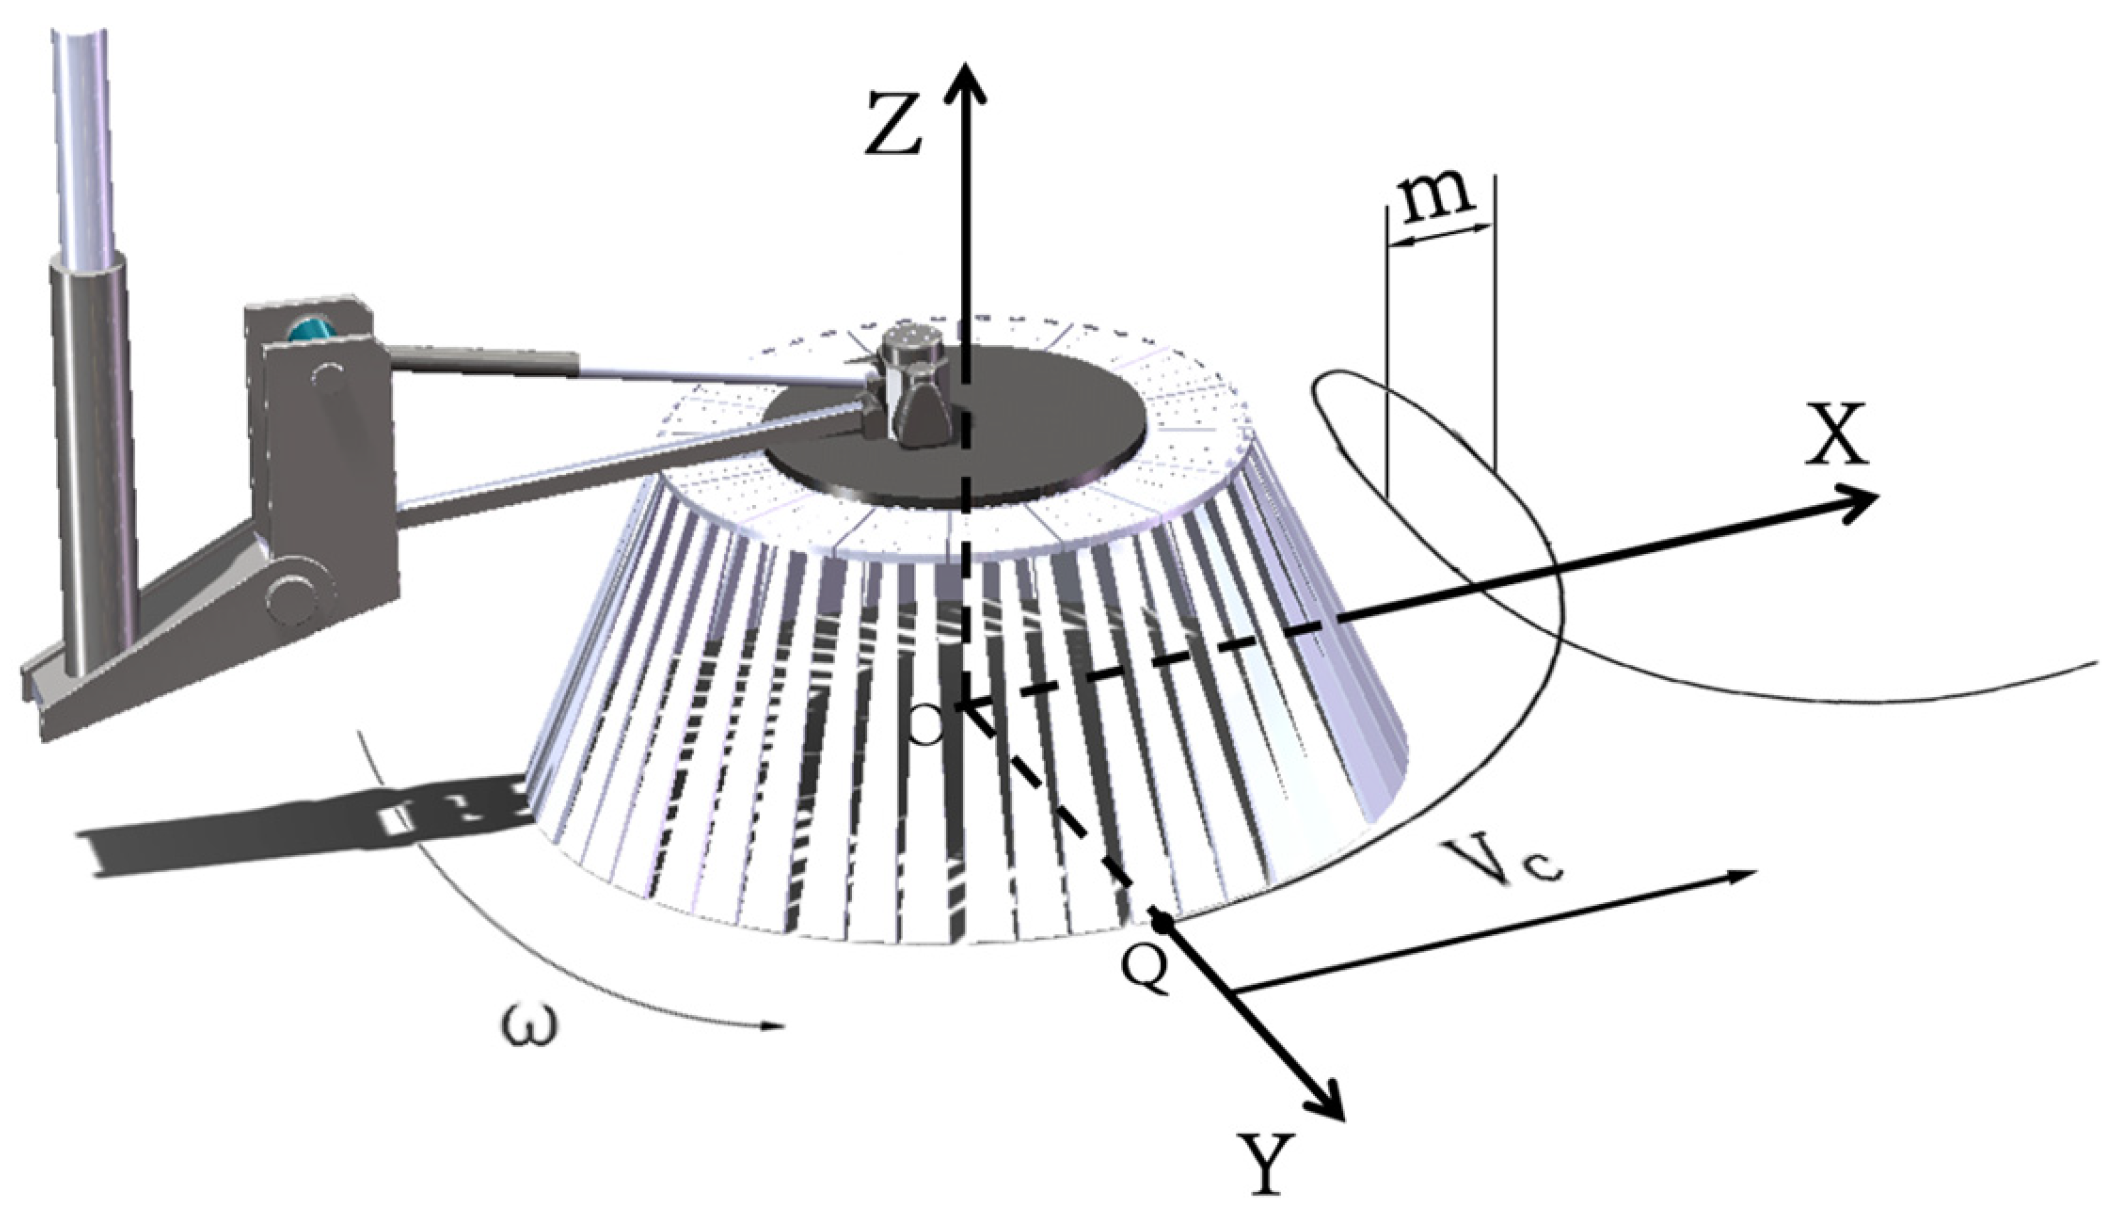
When the traveling speed Vc of the sweeper vehicle increases while the rotational speed ω of the disk brush remains constant, the absolute speed V of the vehicle also increases. It can be seen from Figure 18 that as the angle α between the absolute speed and the operating speed becomes smaller, the throwing trajectory of the rubbish will deviate from the suction pipe pick-up area, thus reducing the cleaning efficiency of the sweeper vehicle. These analyses show that the disk brush carries out a circular motion, while the motion of the sweeper vehicle itself is a straight line, and the synthetic trajectory of the point at which the disk brush contacts the ground takes on the shape of a swing line, as shown in Figure 18. The amplitude and direction of the sweeper’s absolute speed vary in response to variations in disk brush speed and moving speed.
To improve the cleaning efficiency and work efficiency of the sweeper, it is necessary to reasonably coordinate the traveling speed of the sweeper with the rotational speed of the disk brush.
Construct the equations for the trajectory of Q at the point of contact between the disk brush and the ground [32].
x Q = r sin ω t + V c t y Q = r cos ω t
The factors affecting the trajectory of the Q-point are the radius r of the disk brush, the rotational speed ω, and the traveling speed Vc of the sweeper through Equation (8). The operating speed of the sweeper is usually between 5 and 30 km/h. To reasonably match the rotational speed of the disk brush and the traveling speed of the sweeper, the radius of the sweeper disk is set to 0.54 m.

3.2. Discrete Element Simulation Modeling and Parameterization of the Cleaning Process

3.2.1. Discrete Element Method (Math.)

The discrete element method is a numerical simulation and computational method used to analyze the behavior of particle motion and its mechanical properties [33,34,35]. The method can be used to simulate processes such as asphalt mixture distribution uniformity [36], the effect of the rotational speed of the distributor and related distribution parameters on the speed and distribution of the material [37], and the harvesting of agricultural products [38,39,40]. Because the process of disk brush sweeping is similar to that of disk brush slewing speed, litter splash distribution, and agricultural harvesting, this paper uses the discrete element method to analyze litter collection and disturbance, as well as seeding of the seeding device, under various motion metrics.

3.2.2. Contact Model

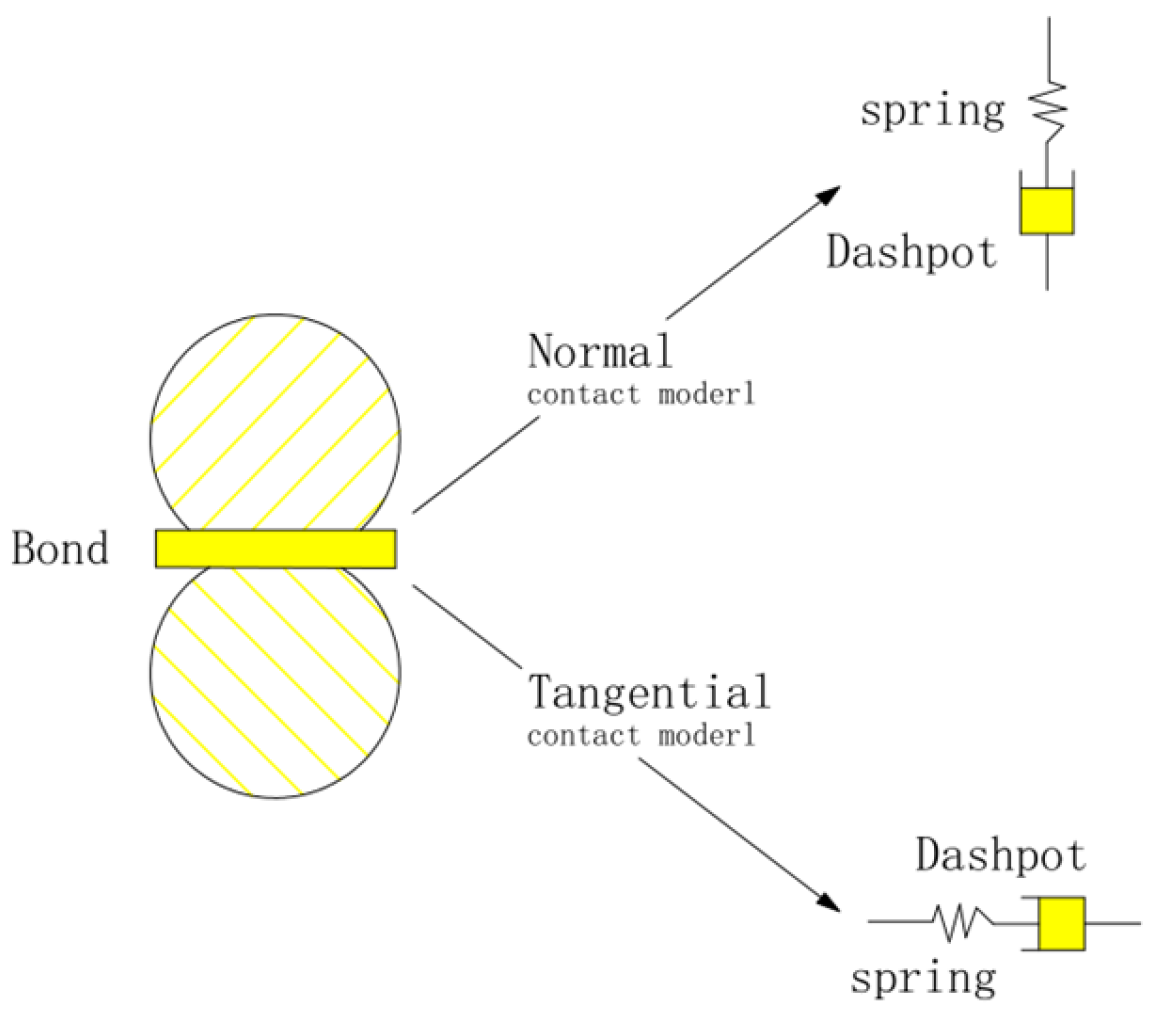
In the linear contact bond model, springs are regarded as elastic elements exerting action at the point of contact and possessing constant normal and shear stiffness properties, as shown in Figure 19 [40]. These springs set the corresponding tensile and shear strengths to limit the associated tensile and shear forces. The presence of contact bonding prevents sliding and ensures that the shear force remains within the range of the shear strength, independent of the coefficient of friction and normal force [40,41,42,43]. Contact bonding allows for the creation of tension in the contact gap, and these mechanical properties are similar to those of graminoids in grasslands. In this study, graminoids were simulated using a linear contact bonding model.

3.2.3. Venue Construction

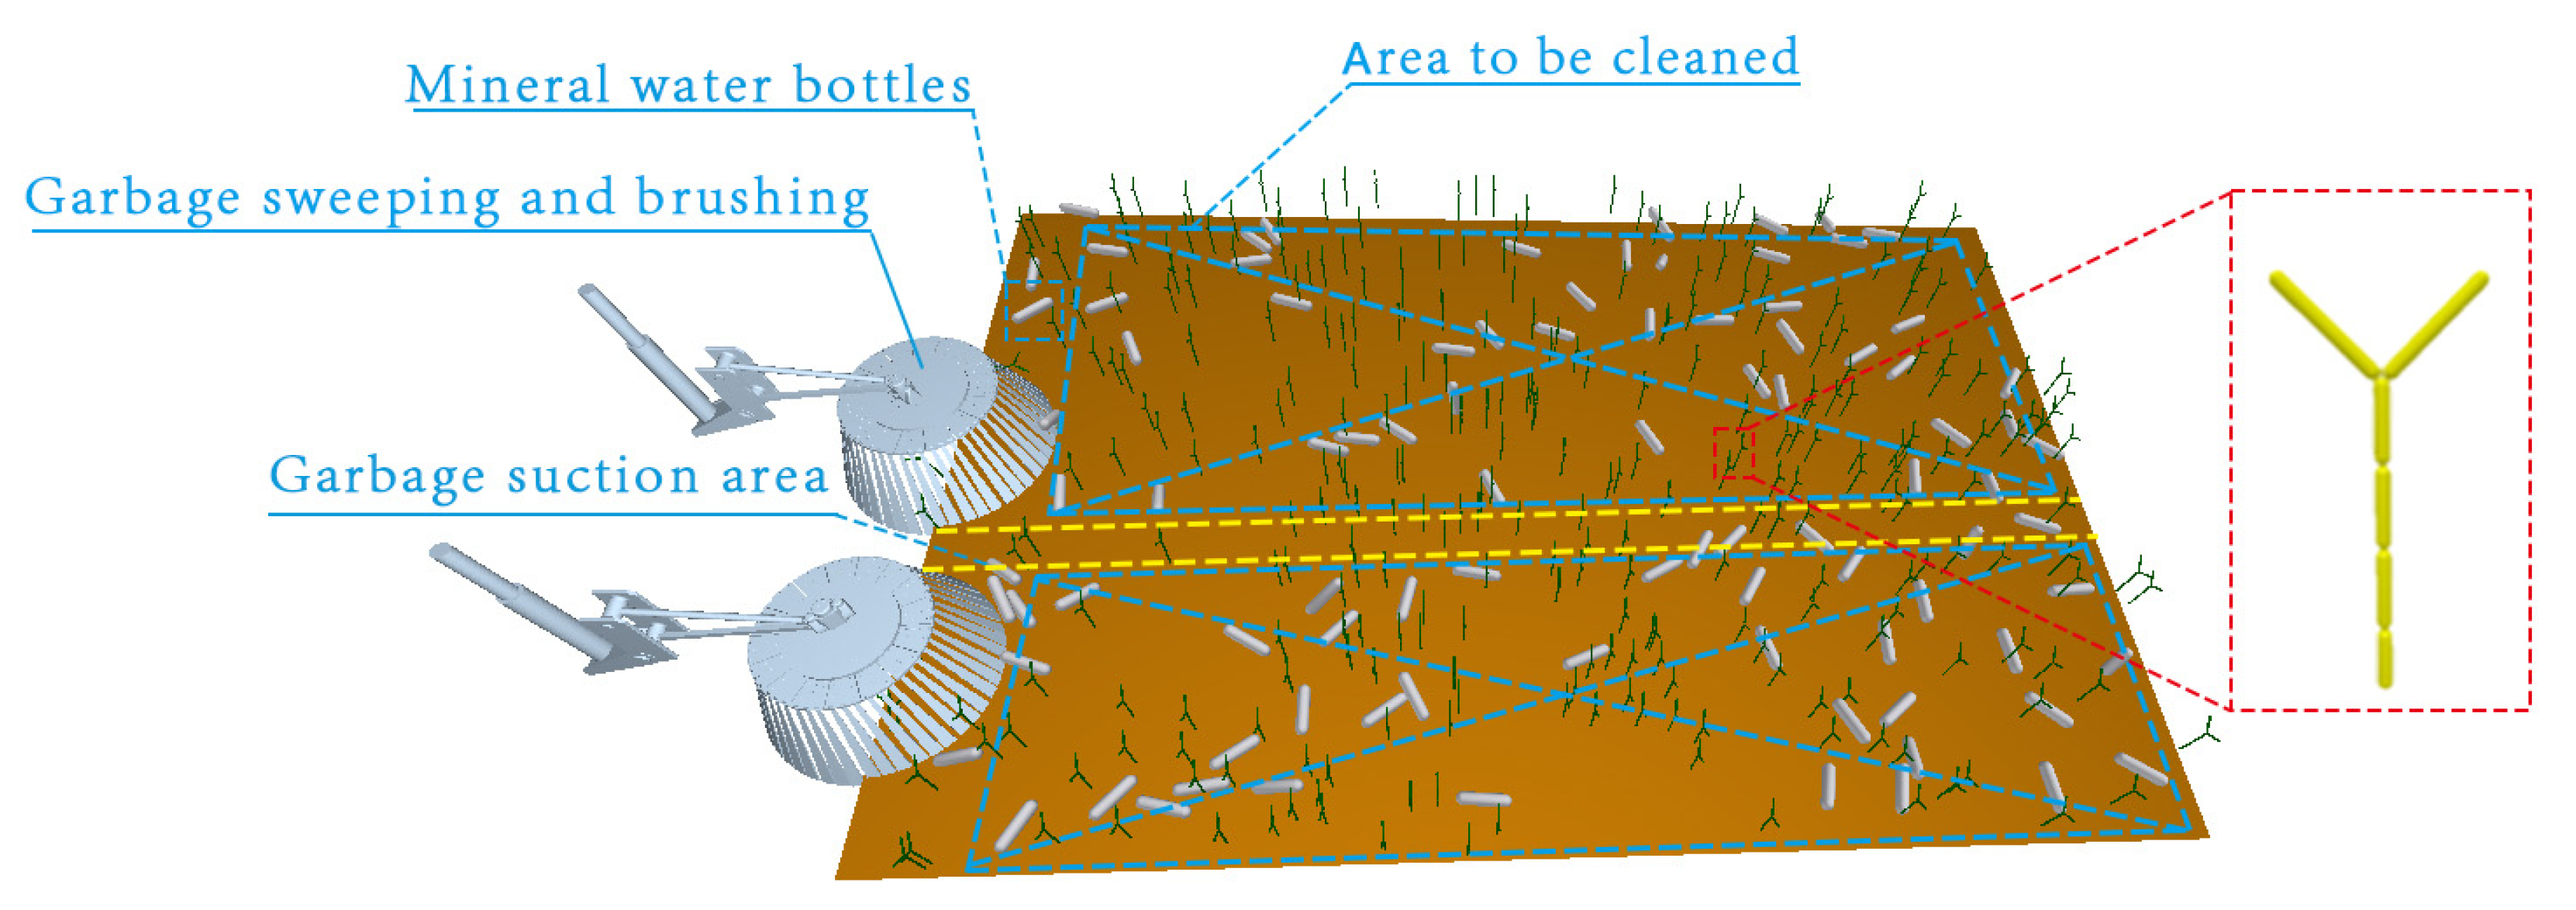
In this study, EDEM software was used to simulate the waste collection process of the grassland ecological cleaning and restoration vehicle. To begin, particles were put up to resemble plastic litter bottles, and a model of a grass plant was built, divided into three parts: head, center, and roots.
We chose Spherocylinders particles and constructed them in the Meta-Particle framework: a section was placed at the root and a fixed speed was set, three sections were placed at the middle, and two ends were placed at the head, which finally formed the appearance of the graminaceous plant. Linear and rotational motions were then applied to the disk brushes to imitate the forward and operating states of a sweeper.
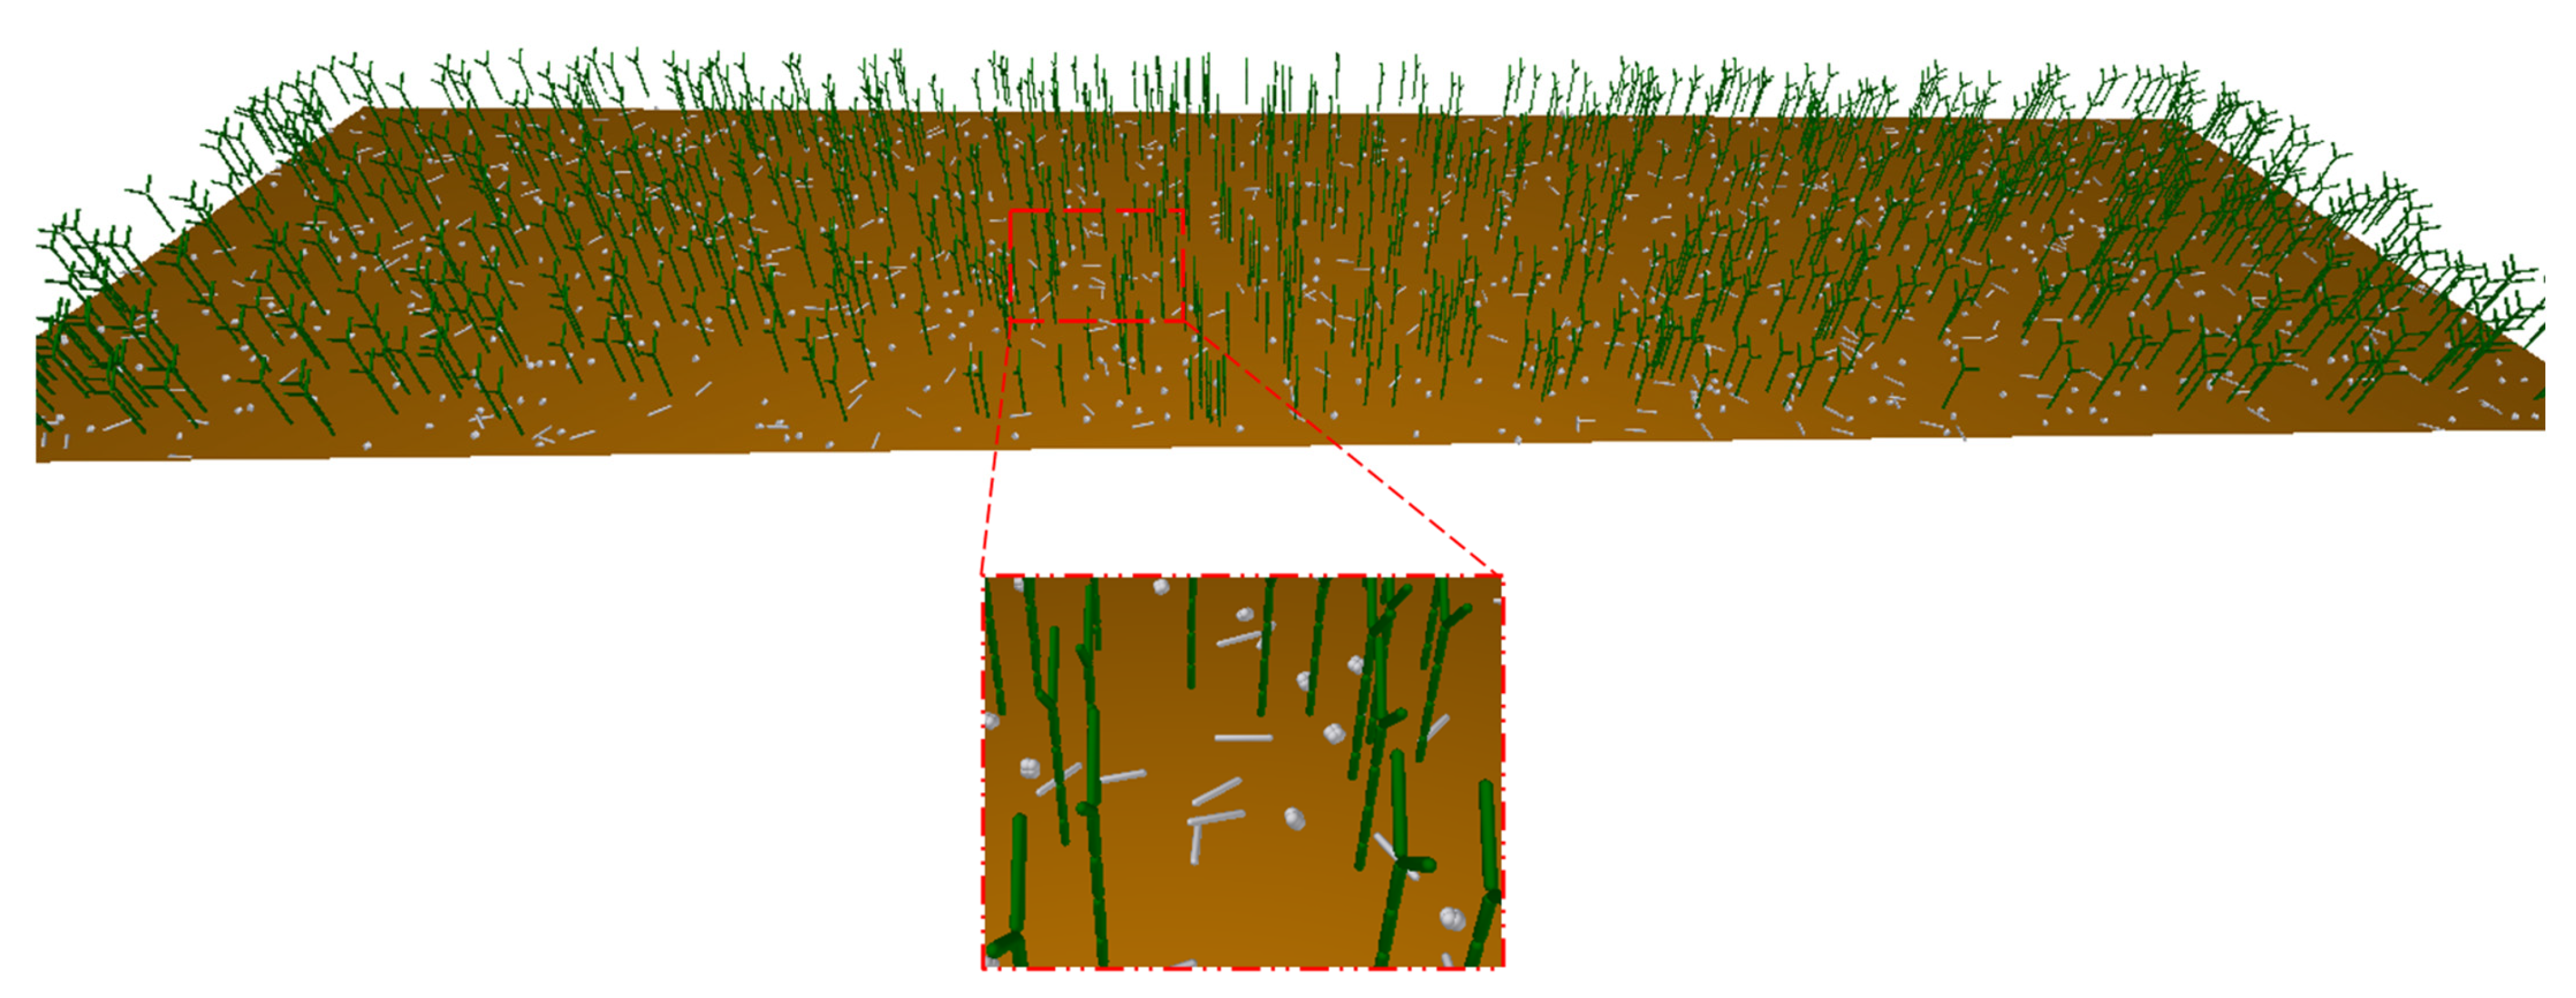
Then, the layout and planning of the experimental site were carried out, and a long rectangle was chosen as the experimental site and 30 litter bottle models were randomly arranged, as shown in Figure 20. The parameter coefficients of the grass plants in the simulation were set according to the literature [44] and the official help document provided by the EDEM software, as shown in Table 3. According to the size of the grass plants, the software automatically generates the appropriate grid size; in this study, a grid size of 2 R min was used, and the time step was set to 1.7 × 10⁻⁵ s to start the simulation.

4. Results and Discussion

4.1. Analysis of the Results of the Disk Brush Motion Parameters

The speed ratio coefficient λ is calculated according to Equation (9), and the speed ratio coefficient is used to match the traveling speed of the sweeper and the rotational speed of the disk brush n.
λ = V r V c = π n r 30 V c
where: λ is the speed ratio coefficient, the ratio of the rotational speed of the disk brush and the traveling speed of the sweeper; n is the rotational speed of the disk brush, 100–200 r/min; r is the radius of the disk brush with variable radius 0.54 m; Vc is the traveling speed of the sweeper, 2.78~6.94 m/s.
According to the data in Figure 21a, when the rotational speed of the disk brush is 90 r/min, different vehicle speeds (10 km/h, 15 km/h, and 20 km/h) significantly affect the sweeping effect. When the vehicle speed is 20 km/h, the speed ratio coefficient λ is 0.912, and the trajectory of the contact point Q has almost no loop (m ≤ 0), which leads to a poor sweeping effect. When the vehicle speed is reduced to 15 km/h, the speed ratio coefficient λ increases to 1.216, and the trajectory shows a short pendulum shape (m ≥ 0), which may lead to leakage of the sweeping phenomenon. When the vehicle speed is further reduced to 10 km/h, the speed ratio coefficient increases to 1.826, and the trajectory shows a wider loop buckle (m > 0), which has the best sweeping effect and is suitable for cleaning the dirty ground. In addition, the narrower the loop buckle, the longer the sweeping coverage distance, in the order of a3 > a2 > a1.
According to Figure 21b, when the rotational speed of the disk brush is 130 r/min, the effects of different vehicle speeds (15 km/h, 20 km/h, 25 km/h) are as follows: At 25 km/h, the velocity ratio coefficient λ is 1.117, and the trajectory of the touch point Q is narrower, and the sweeping effect is poor. At 25 km/h, the speed ratio λ is 1.117, the track loop of touch point Q is narrower, and the sweeping effect is poor. When it is reduced to 15 km/h, the speed ratio coefficient is 1.866, the trajectory forms a wide loop, and the cleaning degree is significantly improved. As a result, a speed of 15 km/h is chosen to ensure efficient cleaning.
According to Figure 21c, when the rotational speed of the disk brush is 200 r/min, the effects of different vehicle speeds (20 km/h, 25 km/h, 30 km/h) are as follows: At 30 km/h, the speed ratio coefficient λ is 1.356, the trajectory loop buckle of the contact point Q is narrower, and the sweeping effect is poor. At 25 km/h, the speed ratio coefficient is 1.628, forming a wider loop, and the sweeping effect is better. At 20 km/h, the speed ratio coefficient is increased to 2.034, and the trajectory line shows a very wide loop, which has the best sweeping effect, but most of the sweeping paths are duplicated due to the almost overlapping of the loops, which significantly reduces the sweeping efficiency. To provide optimal sweeping results, a speed control of 25 km/h is recommended.

4.2. Analysis of Disk Brush Simulation Results

4.2.1. Effects of Rotational Speed and Vehicle Speed on Gramineous Plants

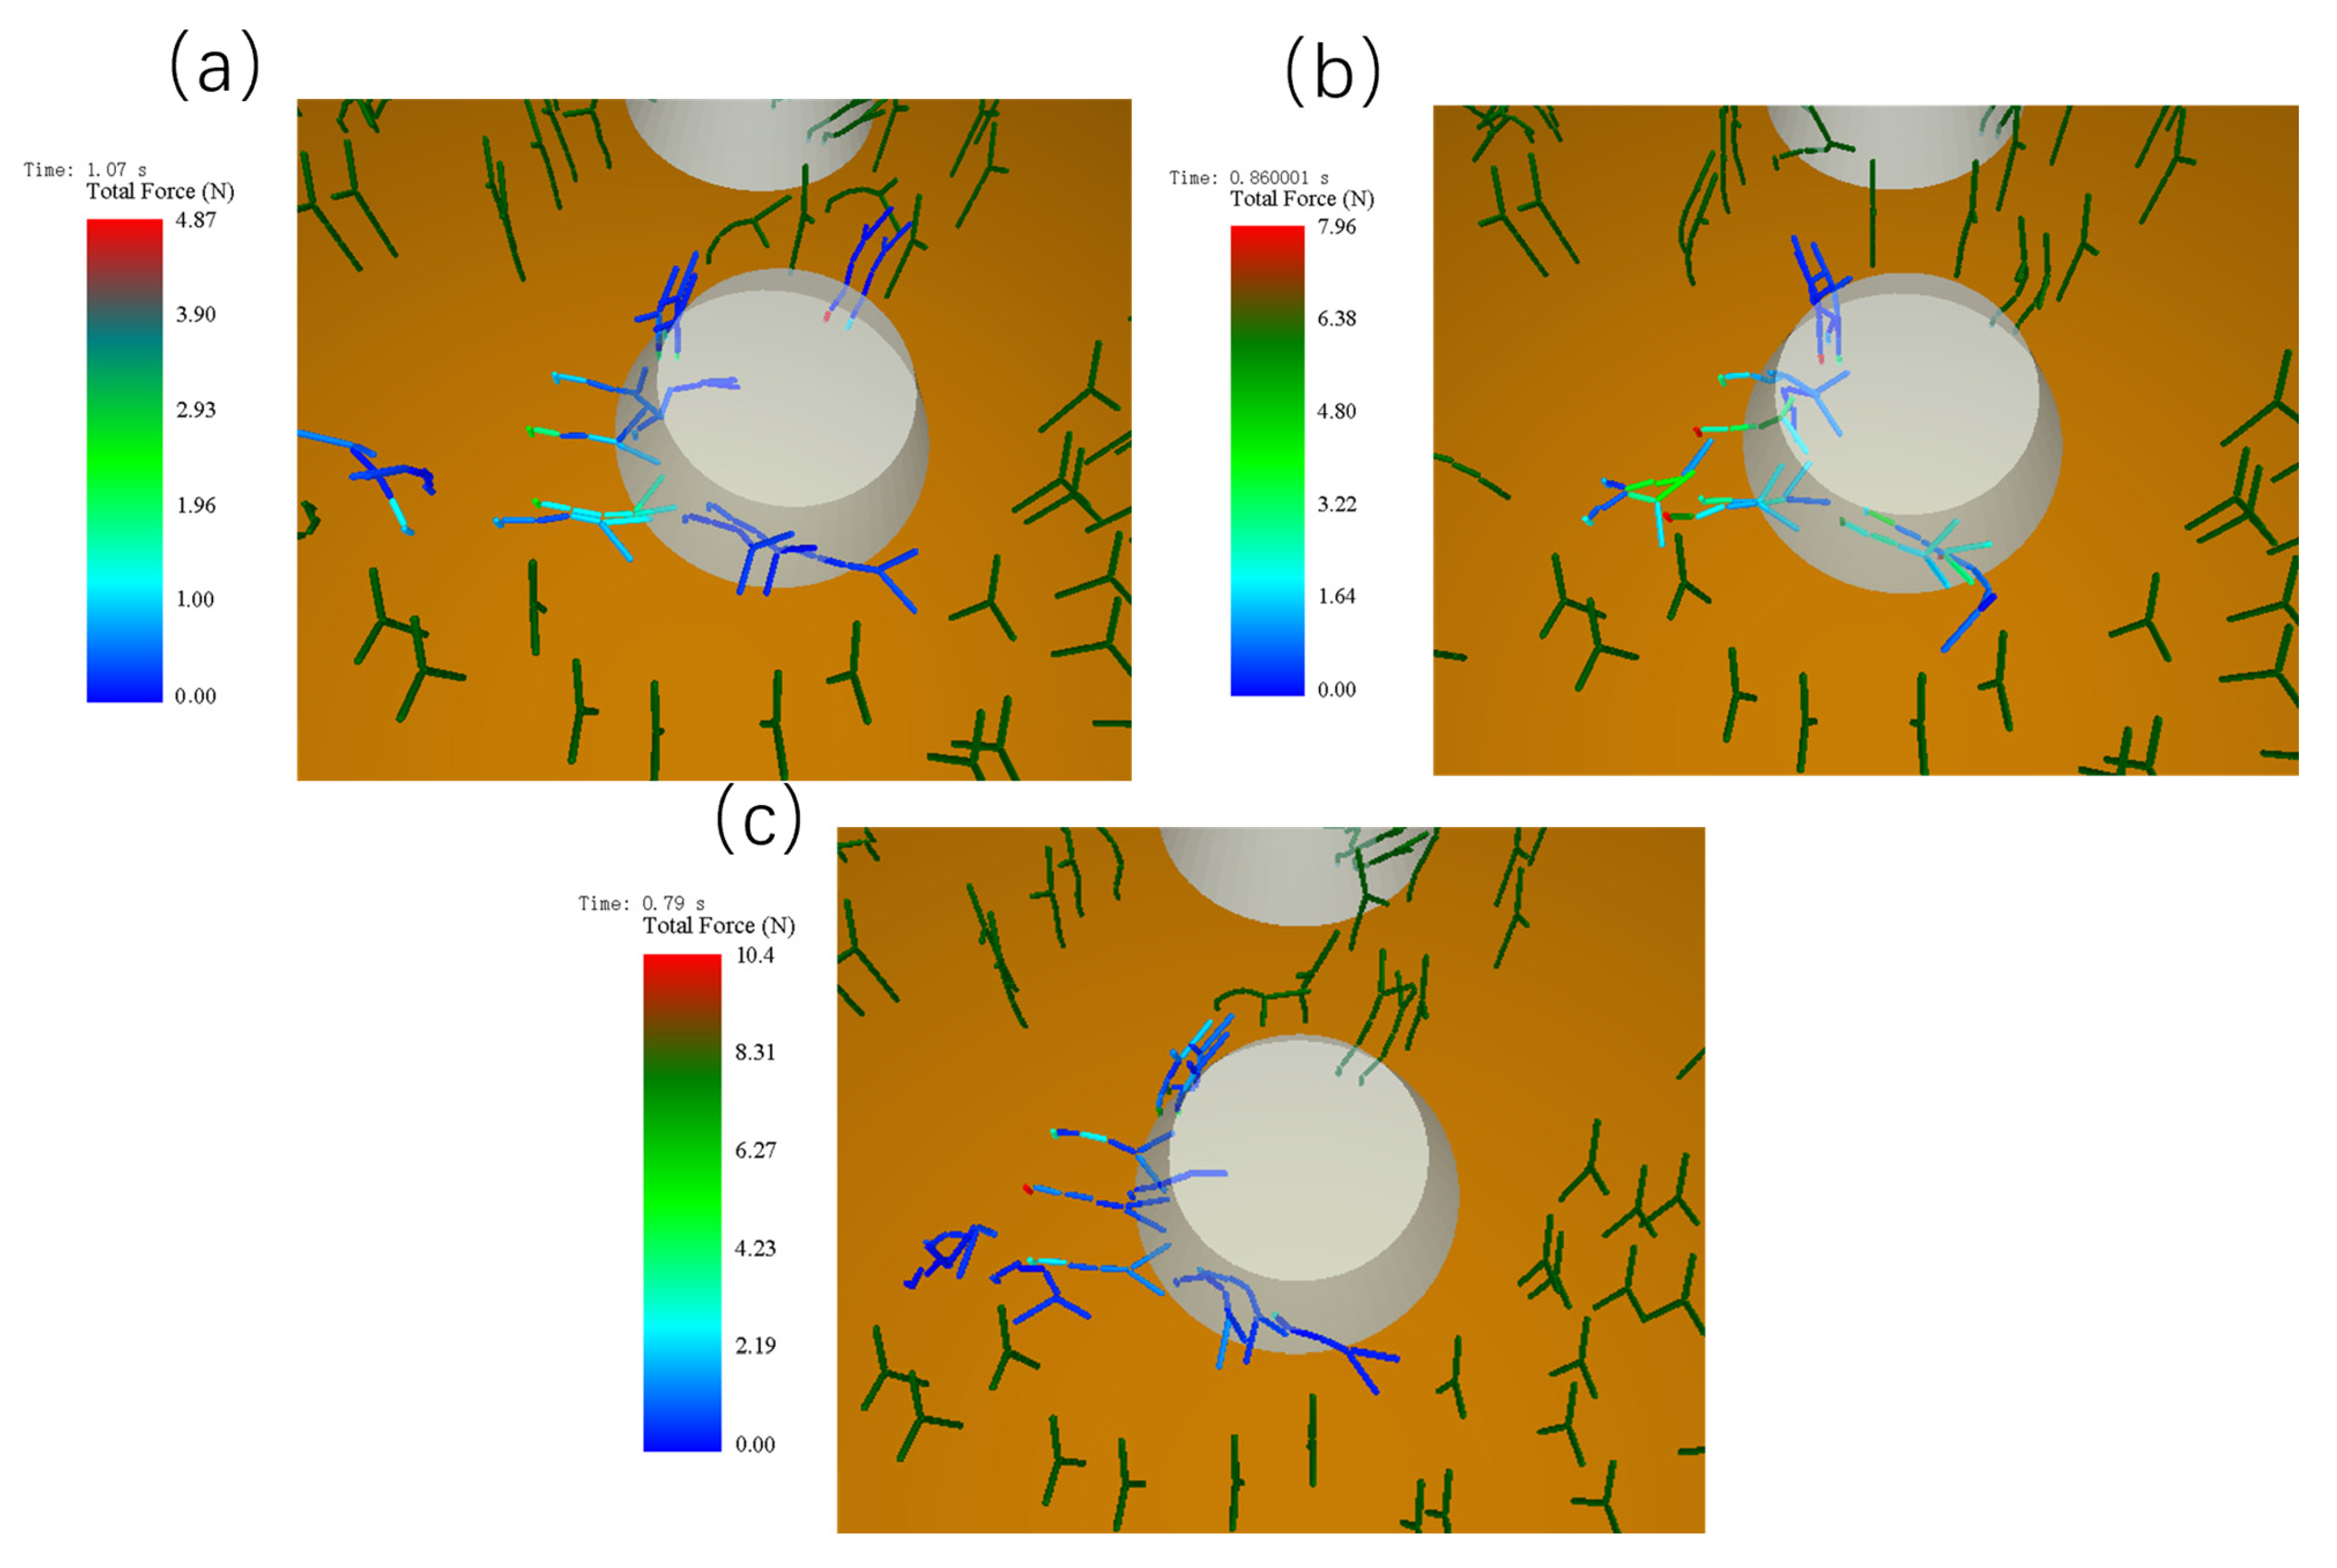
According to the analysis of the disk brush trajectory equations, the best cleaning effect of the sweeper is achieved when the vehicle is traveling at 10 km/h, 15 km/h, and 25 km/h with the disk brushes at the speeds of 90 r/min, 130 r/min, and 200 r/min. Discrete elemental simulations of grassland litter sweeping were performed for these three sets of parameters. Thirteen graminoids were selected for analysis on the trajectory swept by the disk brush. Due to the different speeds of the vehicle, the time to reach these 13 grass plants varies, and the simulation effect of the force on the grass plants is shown in Figure 22, where the different colors represent the different situations of the force on the grass plants. Figure 22c shows that when the disk brush speed is 200 r/min and the vehicle speed is 25 km/h, the effect on the graminaceous plants is significantly higher than in the other two cases.

4.2.2. Effect of R/MIN and Vehicle Speed on Garbage Collection

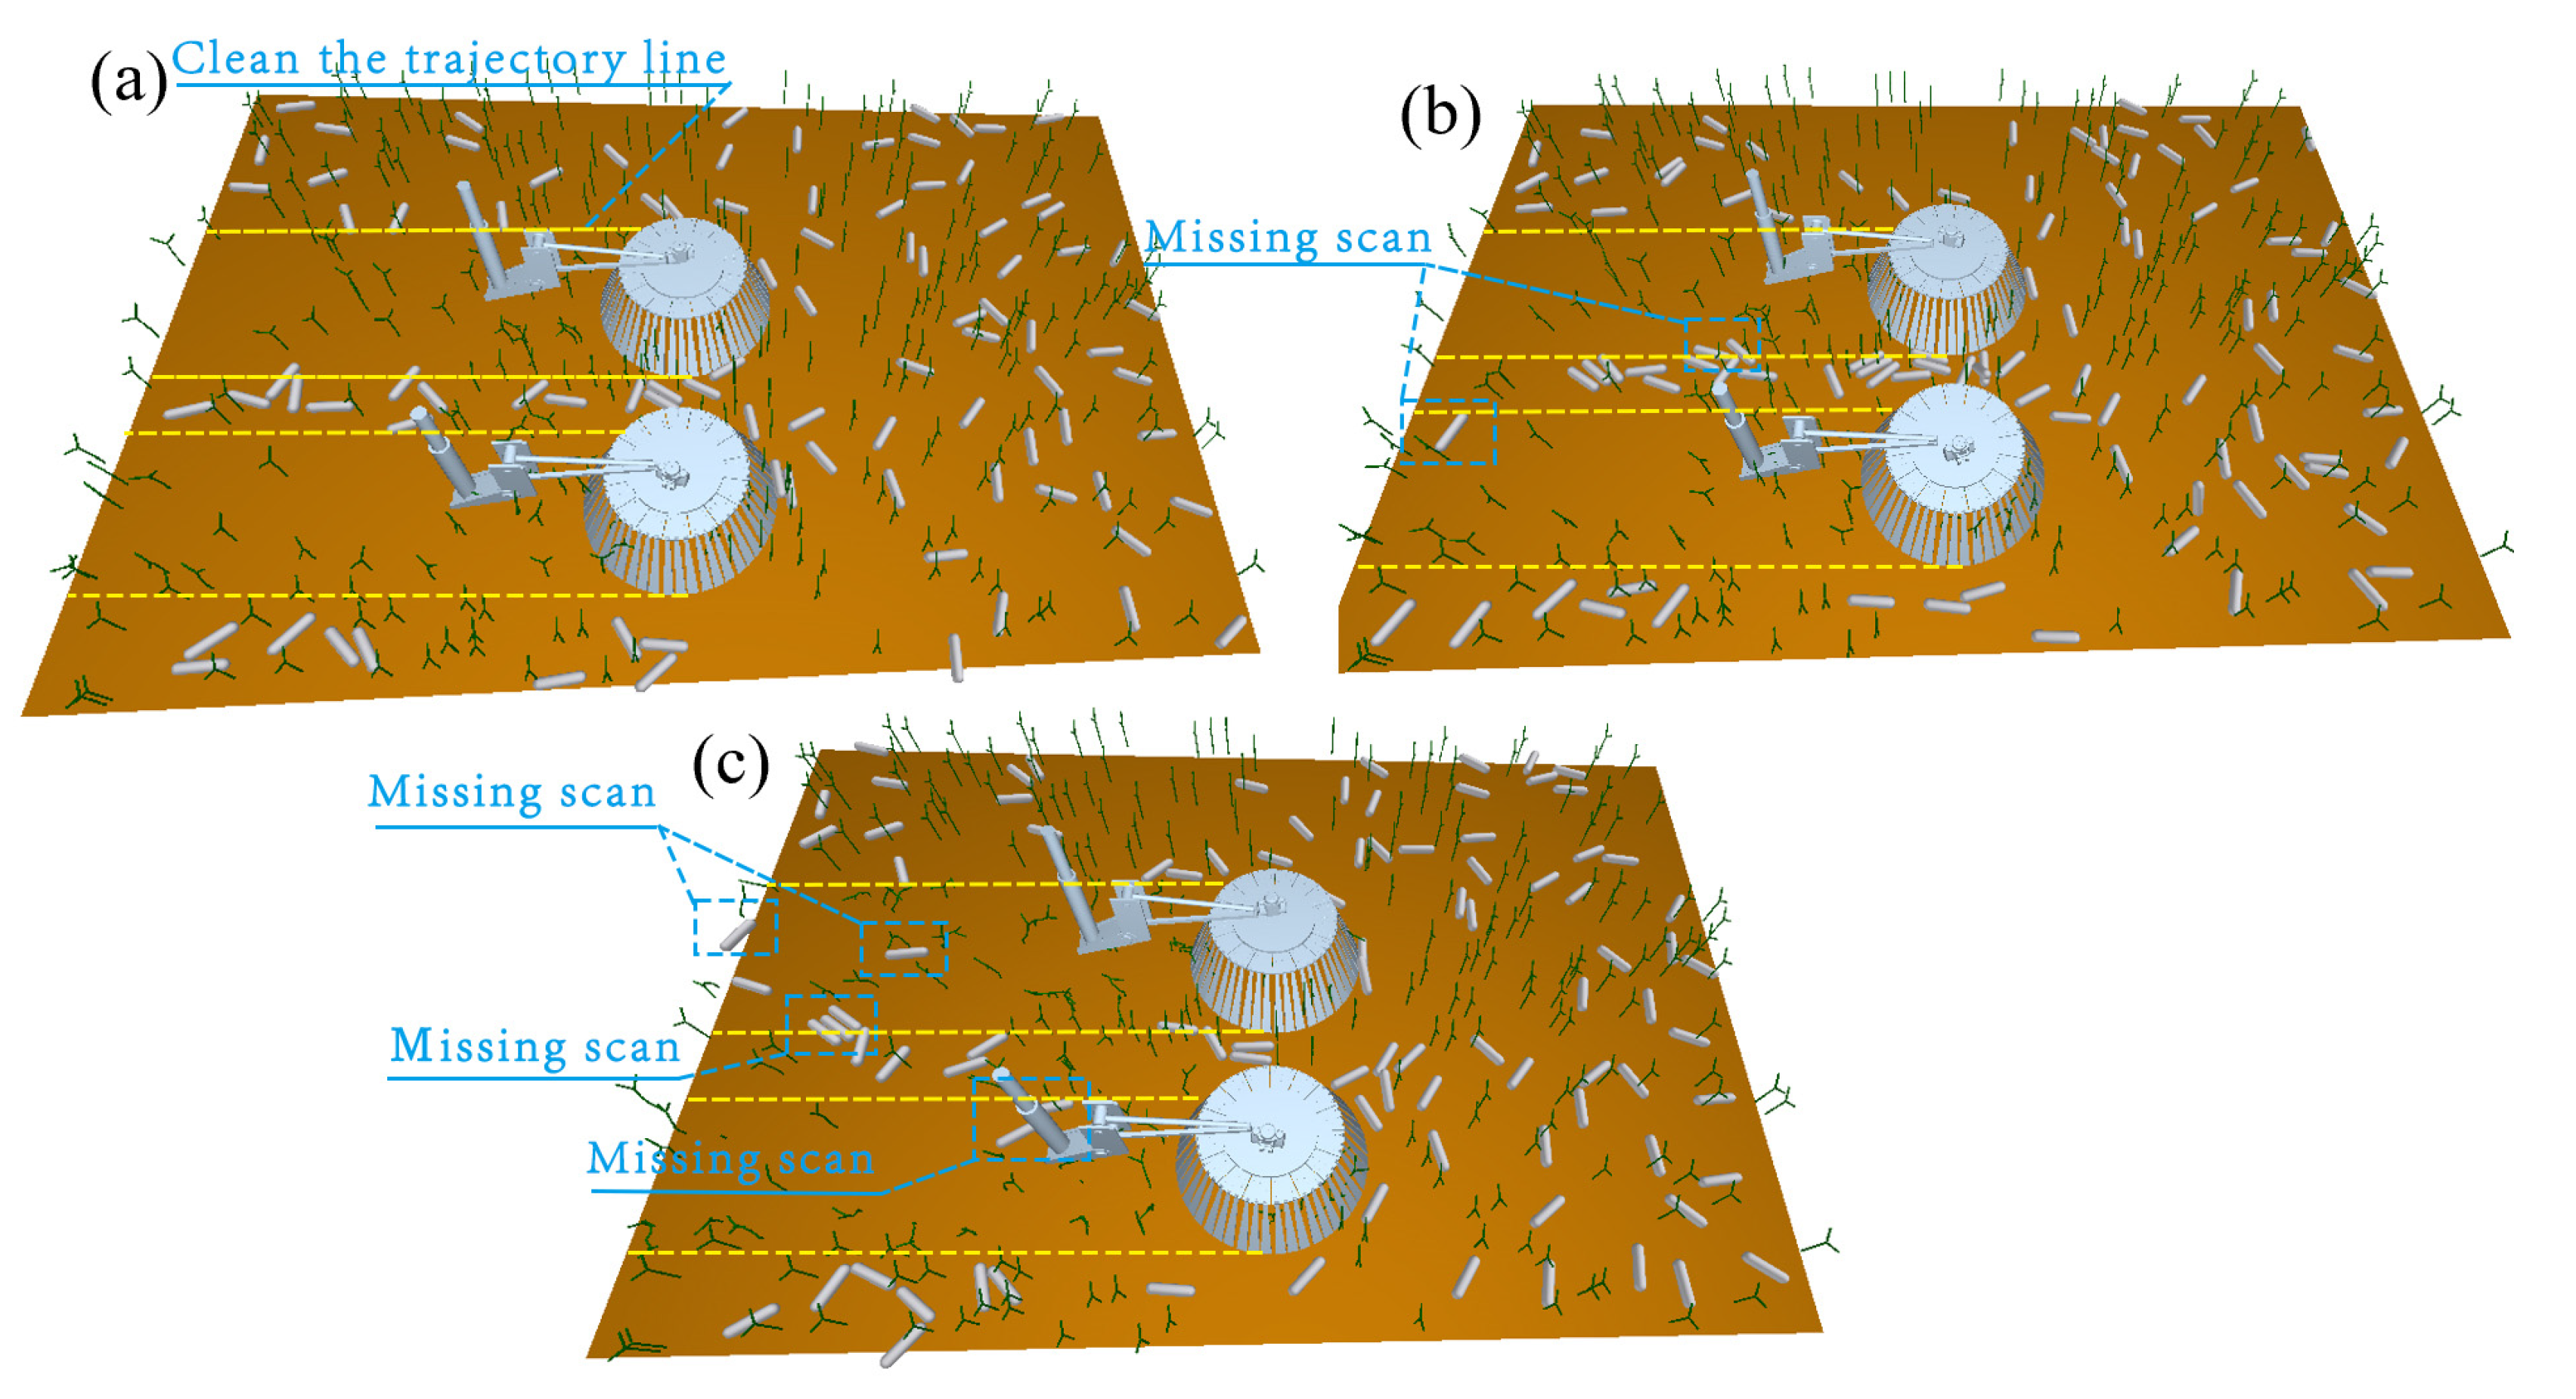
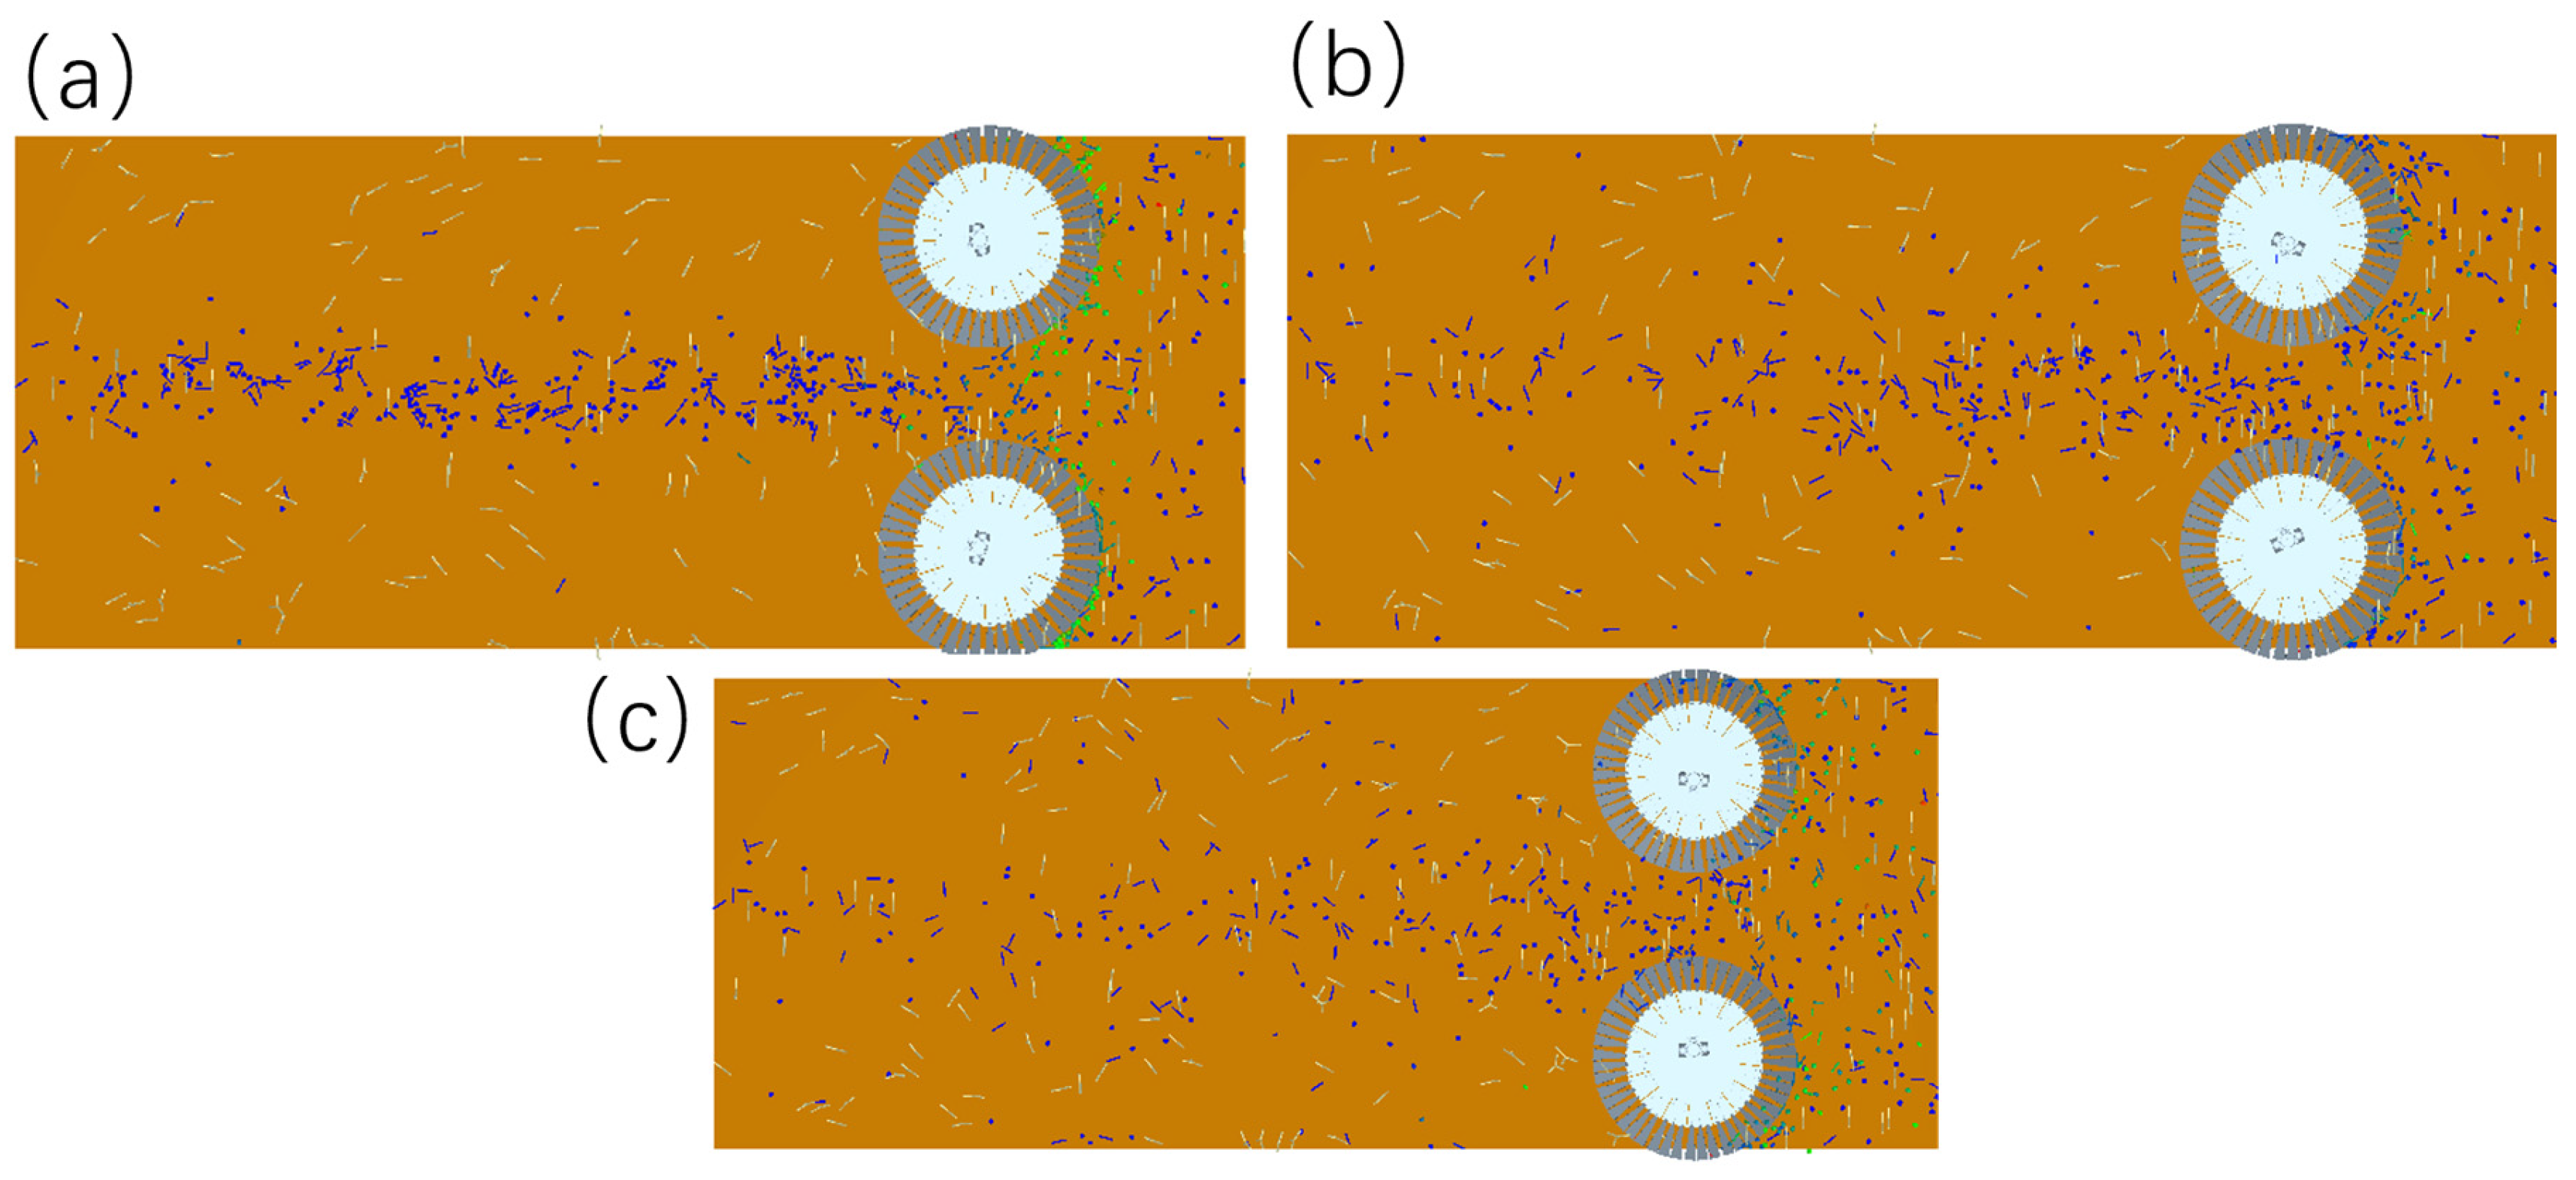
To study the effect of the disk brush speed and vehicle traveling speed on garbage collection, the above speeds and speeds were sequentially applied to conduct the plastic garbage bottle collection test, and the specific results are shown in Figure 23. The figure shows that the rotation of the disk brush provides the starting kinetic energy for the plastic bottles to be thrown to the central garbage suction area, and the collection effect is the best when the rotational speed is 90 r/min, while the leakage situation occurs when the rotational speed is 130 r/min, and when the rotational speed is 200 r/min, the starting kinetic energy of the plastic bottles is too large, which leads to the throwing trajectory deviating from the suction nozzle suction area, and the leakage situation is serious.
To more accurately verify the sweeping effect of grassland cleaning and restoration vehicles, we re-established the length of 10 m, and the width of 5 m of the experimental platform, according to the standard JB/T 7303-2007 [45] “road sweeper”, with an average of 40 g/square meter of road pollution (pollutants for the plastic debris) as shown in Figure 24, the cleaning car speed according to the requirements of the speed of the sweeping operation, sampling distance 5 m, and the sweeping width is the same as the operating width.
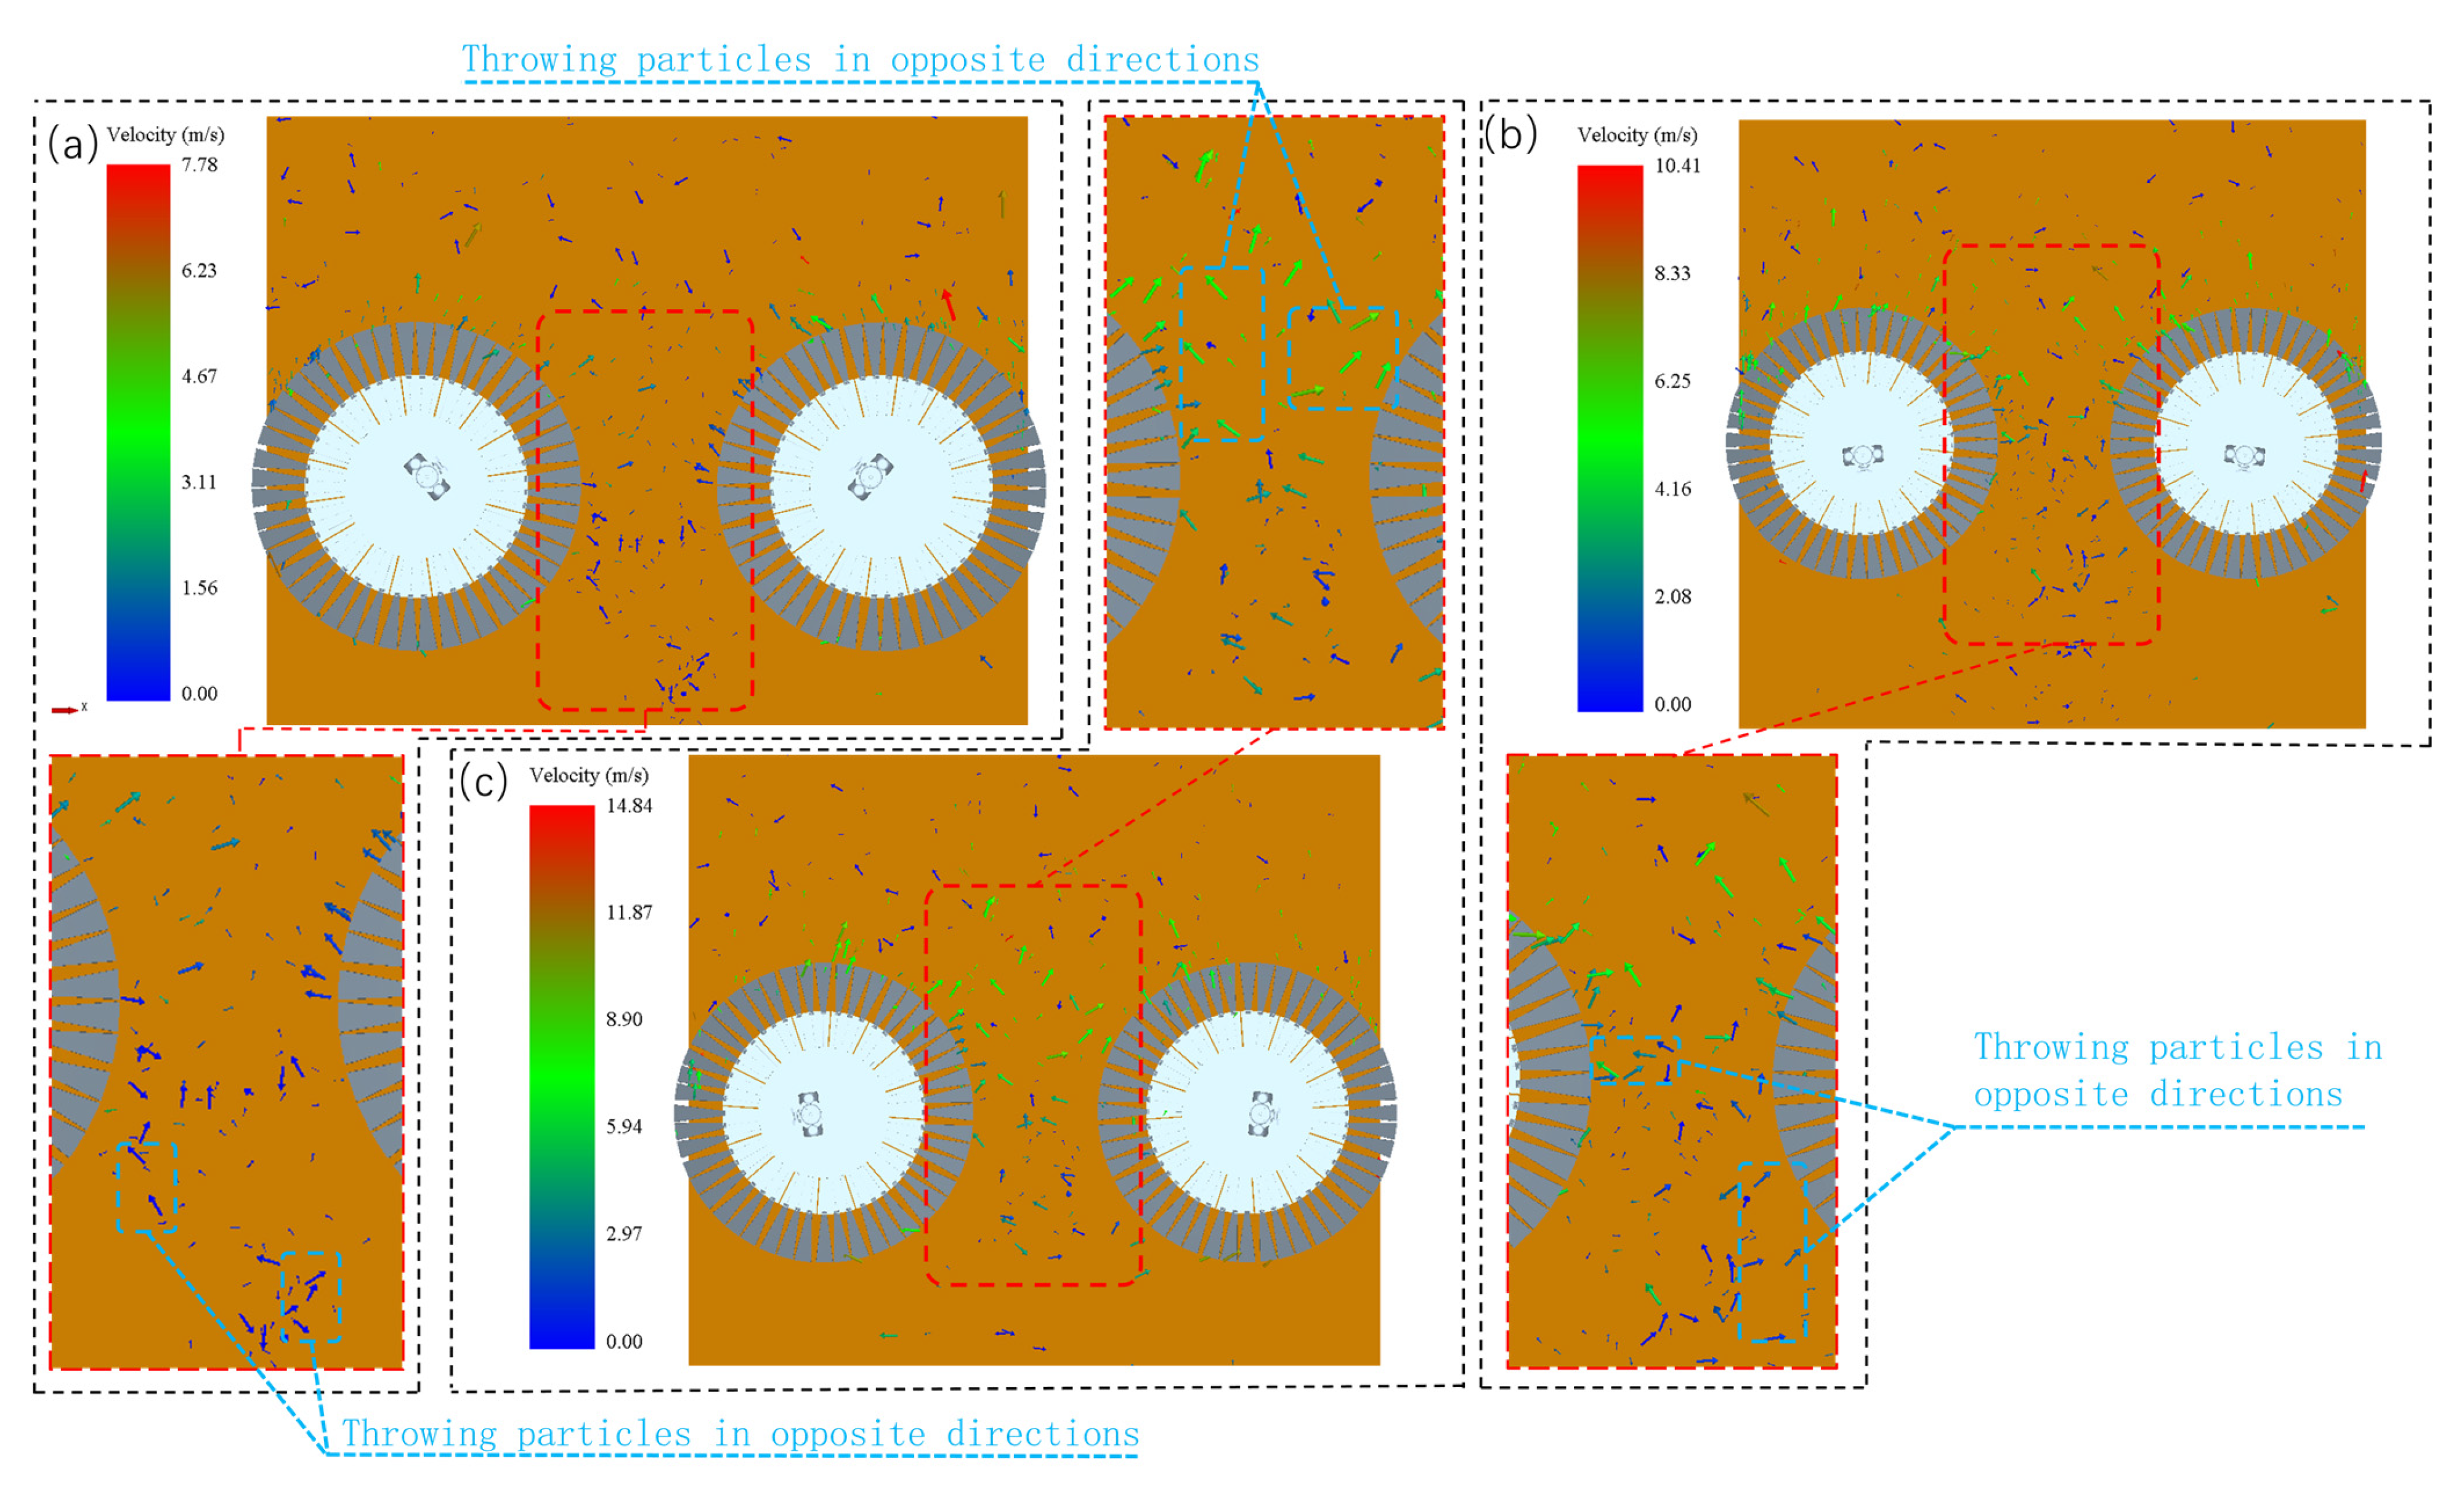
When the rotational speed of the disk brush is 90 r/min, the initial velocity of the plastic fragments being thrown up is low, and their residence time in the suction and pickup area is long. In addition, after the disk brush passes by, the initial velocity of the plastic fragments remaining in the suction pick-up area is almost zero, and the velocity of the particles thrown in the opposite direction is also very small, which basically cannot be thrown by the opposite disk brush for the second time, as shown in Figure 25a. At this time, the kinetic energy of the disk brush on the plastic particles is low, the number of particles thrown into the air is small, and the perturbation effect on the particles is weak, as shown in Figure 26a. When the rotational speed of the disk brush is increased to 130 r/min, part of the plastic fragments are thrown to the pick-up area at a high speed, and after the disk brush passes by, part of the plastic fragments in the pick-up area still have a high speed, and these fragments may continue to move forward, or even detach from the pick-up area, as shown in Figure 25b. When the rotational speed of the disk brush is further increased to 200 r/min, a large number of plastic fragments are thrown to the pick-up area at a high speed, while the speed of the fragments thrown by the opposite disk brush remains high, resulting in the particles being thrown again by the opposite disk brush, thus making the trajectory tend to be chaotic, as shown in Figure 25c. At this moment, the kinetic energy of the disk brush on the plastic particles increases greatly, as does the quantity of particles launched into the air, as well as the perturbation effect on the particles, as illustrated in Figure 26c.
Record the amount of ground litter before and after sweeping. Control the speed of equipment and vehicle speed, conduct the prairie cleaning and restoration vehicle clean rate test, and match the speed of sweeping equipment and vehicle speed by the speed ratio coefficient. Calculate the clean rate according to Equation (10). Repeat the test three times; the cleaning effect is shown in Figure 27, and the results are recorded in Table 4.
η = G 0 G 1 G 0 × 100 %
Style: η is the cleaning rate of sweeper operation; G0 is the amount of ground garbage before sweeping; G1 is the amount of garbage residue after sweeping.
According to the data in Table 4 of the test results, the correlation between the speed ratio coefficient, the rotational speed of the disk brush, the operating speed of the sweeper, and the clean rate was analyzed. When the speed ratio coefficient λ reaches 1.826, the clean rate is the highest, as shown in Figure 27a, but when λ is further increased, the clean rate of the disk brush decreases sharply. When the velocity ratio coefficient λ is lower than 1.36, the clean rate decreases equally sharply, as shown in Figure 27c. Therefore, in practical applications, it is necessary to comprehensively consider the matching relationship between the radius of the disk brush, the rotational speed, and the operating speed to realize the best cleaning effect.

4.3. Discrete Element Simulation and Parameterization of the Seeding Process

4.3.1. Discrete Element Simulation Modeling Parameter Settings

After the seeding mechanism was imported into EDEM 2023, all parts were merged into a single unit, except for the seed discharge disk, which could be rotated. The seed model consists of several spherical particles with varying diameters around 2.3 mm and is arranged according to the size, thus constructing ryegrass seed particles of different sizes, as shown in Figure 28. By setting up a conveyor belt at the bottom, the seeding state when the vehicle is moving is simulated. To prevent the seed particles from jumping on the conveyor belt, the recovery coefficient, static friction coefficient, and rolling friction coefficient between the seed and the conveyor belt were set, and the specific parameters are shown in Table 5 [46]. The dimensions of the computational domain of the conveyor belt and seeder were [x, y, z] = [1103.1, 2566.7, 4396.7]. Considering the smooth and non-sticky surface of ryegrass seeds, the Hertz–Mindlin contact model was used for the simulation experiments. Since the parameters of ryegrass seeds are similar to those of cereal seeds, according to the literature [47], we set the parameters of the seeds as well as the contact parameters between the seeds and the seed discharging tray, and we set the simulation parameters as shown in Table 5. The number of particles generated per second by the pellet plant needs to be calculated. For example, when the traveling speed of the grassland ecological cleaning and restoration vehicle is 15 km/h, the rotational speed of the seed discharge disk is 60 r/min, and the number of slots is 20, the seed discharge disk discharges about 40 seeds per revolution. Therefore, the particle generation rate of the pellet plant is set to 40 particles per second. Finally, the step time was set to 4.5 × 10⁻⁶ s, and the total simulation time was set to 5 s. The step time was set to 4.5 × 10⁻⁶ s, and the total simulation time was set to 5 s.

4.3.2. One-Way Experimental Analysis

To study the effect of rotational speed and number of slots on the amount of seed discharged, we first fixed the number of slots as 22 and the rotational speed of the seeding discs as 40, 50, and 60 r/min, to study the effect of rotational speed on the amount of seed discharged, and the histograms of the amount of seed discharged are shown in Figure 29.
It is obvious from the histograms that the rotational speed has a significant effect on the number of seeds discharged, and as the rotational speed increases, the number of seeds discharged is also increasing significantly, and the highest number of seeds is discharged when it reaches 50 r/min, but when the rotational speed reaches 60 r/min, the number of seeds is instead decreasing significantly. Therefore, the optimum seed discharge speed is 50 r/min.

4.3.3. Influence of the Number of Slots on the Amount of Seed Discharged

The fixed seeding discs were rotated at 50 r/min with 20, 22, and 24 slots to investigate the influence of the number of slots on the amount of seed ejected.
The histograms of the number of seeds discharged are shown in Figure 30.
The data show that the number of slots has a substantial impact on the volume of seed ejected.
As the number of slots increases, the number of seeds discharged also increases significantly. When the number of slots reached 24, the seed discharge was more uniform and the phenomenon of three seeds per hole was improved.

4.3.4. Orthogonal Experiment

The row spacing is not only related to the vehicle speed but also closely related to the speed of the seeding disk and the number of slots [48]. While the seed discharge volume is related to the seed discharge speed and the number of slots, it is necessary to comprehensively consider the effects of various factors on the seeding row spacing and seed discharge volume. Ryegrass has a reasonable sowing row spacing of 12 to 20 cm [49]. We need to identify the best approach that ensures the seeding row distance is within the acceptable range while simultaneously achieving the highest seeding row volume.
A 3 × 3 orthogonal test was conducted based on factor A (seeding disk speed), factor B (vehicle speed), and factor C (number of slots), and the resulting orthogonal table is shown in Table 6. Among them, the parameters 40 r/min, 50 r/min, and 60 r/min of factor A were replaced by 1, 2, and 3, respectively, and the parameters 10 km/h, 15 km/h, and 25 km/h of factor B were replaced by 1, 2, and 3, respectively, and the parameters 20, 22, and 24 of factor C were replaced by 1, 2, and 3, respectively.
By analyzing the polarity in the table, it can be concluded that R1 > R3 > R2. The importance of the three contributing parameters is as follows: rotating speed, number of slots, and vehicle speed. Specifically, the rotational speed has the greatest influence on the seeding capacity, followed by the number of slots, while the traveling speed of the vehicle has almost no influence on the seeding capacity, implying that the speed of the vehicle is almost ineffective on the seeding capacity. Therefore, the optimal configuration is A2C3, i.e., the best seed discharge is obtained when the rotational speed is 50 r/min and the number of slots is 24. Further analysis shows that the rotational speed of the seeding disk and the number of slots is inversely proportional to the row spacing, while the vehicle speed is directly proportional to the row spacing. In the A2C3 configuration, if the vehicle traveling speed is 10 km/h, the row spacing is 9.72 cm, which is lower than the reasonable sowing range of ryegrass. At this time, the row spacing can be increased by increasing the vehicle speed. When the vehicle speed is adjusted to 15 km/h, the row spacing is 14.58 cm, which corresponds to the appropriate seeding distance for ryegrass.

5. Conclusions

(1) A grassland ecological cleaning and restoration vehicle suitable for complex terrain was designed for the requirements of grassland garbage cleaning, which can effectively solve the problems of low cleaning efficiency, difficulty in cleaning the garbage in the grass, great damage to grass plants, and difficulty in restoring the grassland.
(2) The finite element analysis of the disk brush swivel arm was carried out using Inspire (2023) software, and the weight reduction of the disk brush swivel arm by 55.43% was successfully achieved by a topology optimization technique. The results show that the yield strength of the optimized component is still within the required range. Using the dynamics principle, the spiral knife garbage shredding device of the grassland ecological cleaning and restoration vehicle was studied using SolidWorks Simulation, and the device was designed to meet the requirements of structural stability.
(3) By analyzing the model of disk brush movement parameters, it is concluded that with the increase in disk brush speed, the absolute speed of the contact point of the disk brush relative to the ground is higher, the kinetic energy of sweeping garbage increases, the angle between the absolute speed of the disk brush and its traveling speed increases, and the scattering path of the garbage in the grass moves to the suction pipeline’s suction pickup area, which improves the cleaning efficiency of the sweeping vehicle. By constructing the trajectory of the contact point of the disk brush and the ground, matching the speed ratio coefficient λ to find a reasonable relationship between the traveling speed of the sweeper and the speed of the disk brush, when the speed ratio coefficient λ < 1.216, the trajectory of the contact point of the sweeping disk is a short oscillating line, which may cause a leakage of the sweeping when the speed ratio coefficient is greater than 1.397, the effective guarantee of the effect of the sweeping, and when the speed ratio coefficient reaches 1.826 the effect is the best.
(4) Using EDEM (2023) software, the discrete element analysis of plastic bottles and plastic garbage fragments collected by the disk brush was carried out, and the force of the graminoid was analyzed. The results showed that the best sweeping effect was achieved when the disk brush speed was 90 r/min and the traveling speed was 10 km/h, and the effect on the graminoid plants was minimized.
(5) Finally, through three-factor, three-level orthogonal experiments, the effects of vehicle speed, seed-sowing disk speed, and seed-sowing disk slot number on seed-sowing volume and row spacing were successfully derived. The results showed that the higher the rotational speed and the more the number of slots of the seed discharge disk, the larger the seed discharge volume and the smaller the row spacing of the seed discharge, and the influence of vehicle speed on the row spacing of the seed discharge was significant. It was finally concluded that when the rotational speed of the seed discharge disk was 50 r/min, the number of slots was 24, and the vehicle speed was 15 km/h, the seed discharge volume was the largest, and the row spacing was in line with the reasonable sowing spacing of ryegrass.

Author Contributions

Conceptualization, L.Y. and X.G.; methodology, L.Y.; software, L.Y.; validation, L.Y., C.L. and H.W.; formal analysis, L.Y.; resources, M.G. and D.Y. data curation, C.L.; writing—original draft L.Y.; writing—review and editing, D.Y.; visualization, L.Y.; supervision, M.G. project administration, L.Y.; Funding acquisition A.G. All authors have read and agreed to the published version of the manuscript.

Funding

This work is supported by the Natural Science Foundation of Shandong Province (ZR2023ME154), and the Training Program of Innovation and Entrepreneurship for Undergraduates (Grant Nos. 202410447016, CXCY2024121).

Data Availability Statement

Data are contained within the article.

Conflicts of Interest

The authors declare no conflicts of interest.

References

  1. Wang, Y.; Wang, X.; Chen, L.; Ma, J. A new type of environmentally friendly self-loading rubbish truck. Spec. Purp. Veh. 2019, 9, 89–92. [Google Scholar]
  2. He, M.; Zhou, G.; Yuan, T.; van Groenigen, K.J.; Shao, J.; Zhou, X. Grazing Intensity Significantly Changes the C:N:P Stoichiometry in Grassland Ecosystems. Glob. Ecol. Biogeogr. 2020, 29, 355–369. [Google Scholar] [CrossRef]
  3. Dettlaff, M.A.; Erbilgin, N.; Cahill, J.F., Jr. An Invasive Grass and Litter Impact Tree Encroachment into a Native Grassland. Appl. Veg. Sci. 2021, 24, e12618. [Google Scholar] [CrossRef]
  4. Bhagat, S.R.; Dharmale, S. Eco Efficiency Optimization of Municipal Solid Waste Management. IJRASET 2023, 11, 2271–2278. [Google Scholar] [CrossRef]
  5. Feng, B.; Liu, Y.; Liu, X.; Xie, R.; Xiang, Y. Study on the Influence of Village Form of Famous Tourism Village on the Layout of Garbage Collection Points—A Case Study of Famous Tourism Village in Guilin City. IOP Conf. Ser. Earth Environ. Sci. 2020, 446, 032024. [Google Scholar] [CrossRef]
  6. Bhat, V.N. A Model for the Optimal Allocation of Trucks for Solid Waste Management. Waste Manag. Res. 1996, 14, 87–96. [Google Scholar] [CrossRef]
  7. Peña, D.; Dorronsoro, B.; Ruiz, P. Sustainable Waste Collection Optimization Using Electric Vehicles. Sustain. Cities Soc. 2024, 105, 105343. [Google Scholar] [CrossRef]
  8. He, Q.; Zuo, C.; Yin, C.; Wu, Y.; Liu, A. Simplified Calculation of Pressure on Buried Pipelines by Vehicle Loads. Eng. Constr. Des. 2020, 22, 71–72. [Google Scholar] [CrossRef]
  9. Yao, B.; Xie, Y. Discussion on the technical status and development trend of self-loading rubbish truck loading mechanism. Spec. Purp. Veh. 2022, 11, 28–31. [Google Scholar] [CrossRef]
  10. Yin, Y.; Diao, A.; Li, Z.; Wang, Q.; Liu, S. Design of an Automatic Ground Cleaning Machine for Dedusting Rooms of Chicken Houses. Agriculture 2023, 13, 1231. [Google Scholar] [CrossRef]
  11. Serajian, R.; Sun, J.-Q.; Ehsani, R. Design of an Integrated Controller for a Sweeping Mechanism of a Low-Dust Almond Pickup Machine. Sensors 2023, 23, 2046. [Google Scholar] [CrossRef] [PubMed]
  12. Tang, Y.; Xu, X.; Zhang, L.; Chen, G.; Luo, K.; Yan, L. Structure Design and Configuration Optimization of the Reconfigurable Deformed Tracked Wheel Based on Terramechanics Characteristics. J. Intell. Robot. Syst. 2023, 108, 7. [Google Scholar] [CrossRef]
  13. Grazioso, A.; di Maria, E.; Giannoccaro, N.I.; Ishii, K. Multibody Modeling of a New Wheel/Track Reconfigurable Locomotion System for a Small Farming Vehicle. Machines 2022, 10, 1117. [Google Scholar] [CrossRef]
  14. Miyamoto, D.L.; Olson, R.A.; Schuman, G.E. Long-Term Effects of Mechanical Renovation of a Mixed-Grass Prairie: I. Plant Production. Arid. Land Res. Manag. 2004, 18, 93–101. [Google Scholar] [CrossRef]
  15. Koyama, A.; Uchida, K. Grassland Legacy Remaining in Vegetation and Seedbank Species Diversity: Evaluation in Abandoned Grasslands and Plantation Forests. Glob. Ecol. Conserv. 2022, 36, e02134. [Google Scholar] [CrossRef]
  16. Kacigin, V.V.; Guskov, V.V. The Basis of Tractor Performance Theory: Part 1—General Laws of Soil Strength and Deformation. J. Terramech. 1968, 5, 43–66. [Google Scholar] [CrossRef]
  17. Ferrero, A.; Usowicz, B.; Lipiec, J. Effects of Tractor Traffic on Spatial Variability of Soil Strength and Water Content in Grass Covered and Cultivated Sloping Vineyard. Soil Tillage Res. 2005, 84, 127–138. [Google Scholar] [CrossRef]
  18. Yuferev, S.S.; Lesovskaya, M.I.; Olentsova, Y.A. Optimal Weight and Power Parameters of Crawler Tractors to Reduce Pressure on the Soil. IOP Conf. Ser.Earth Environ. Sci. 2019, 315, 052009. [Google Scholar] [CrossRef]
  19. Huang, T.; Tong, X.; Hou, Z. Design of suspension rocker arms and their topology optimization for Formula Racing cars. Agric. Equip. Veh. Eng. 2017, 55, 55–57. [Google Scholar]
  20. Wu, H.; Guo, A.; Kong, D.; Wu, J.; Qu, P.; Wang, S.; Guo, S.; Li, X.; Zhao, Z.; Liu, C.; et al. Preparation of Bouligand Biomimetic Ceramic Composites and the Effect of Different Fiber Orientations on Mechanical Properties. J. Manuf. Process. 2024, 132, 789–801. [Google Scholar] [CrossRef]
  21. Yang, W.; Guo, A.; Sheng, X.; Tang, R.; Qu, P.; Wang, S.; Liu, C.; Yin, L.; Sui, S.; Guo, S. Preparation of 316L Stainless Steel/WC Gradient Layered Structures with Excellent Strength-Elongation Synergy Using Laser Powder Bed Fusion. J. Manuf. Process. 2025, 133, 692–704. [Google Scholar] [CrossRef]
  22. Bai, S.; Zhu, J. Topology Optimization Design of 3D Continuum Structure with Reserved Hole Based on Variable Density Method. JESTR 2016, 9, 121–128. [Google Scholar] [CrossRef]
  23. Xie, L.; Zhang, Y.; Ge, M.; Zhao, Y. Topology Optimization of Heat Sink Based on Variable Density Method. Energy Rep. 2022, 8, 718–726. [Google Scholar] [CrossRef]
  24. Tian, L.; Fan, W. Topology optimization design of complex antenna support structures for star-carried articulated spreading antennas. Mech. Des. 2022, 39, 1–5. [Google Scholar] [CrossRef]
  25. Coranic, T.; Gaspar, S.; Pasko, J. Utilization of Optimization of Internal Topology in Manufacturing of Injection Moulds by the DMLS Technology. Appl. Sci. 2021, 11, 262. [Google Scholar] [CrossRef]
  26. Chung, J.; Lee, K. Optimal Design of Rib Structures Using the Topology Optimization Technique. Proc. Inst. Mech. Eng. Part C J. Mech. Eng. Sci. 1997, 211, 425–437. [Google Scholar] [CrossRef]
  27. Ypsilantis, K.-I.; Kazakis, G.; Faes, M.G.R.; Ivens, J.; Lagaros, N.D.; Moens, D. A Topology-Based in-Plane Filtering Technique for the Combined Topology and Discrete Fiber Orientation Optimization. Comput. Methods Appl. Mech. Eng. 2023, 417, 116400. [Google Scholar] [CrossRef]
  28. Lu, Y.; Ji, X.; Liu, D.; Duan, C.; Lin, J.; Ma, Y. Topology optimization and lightweight design of scroll compressor frame for a certain model. Mech. Des. 2022, 39, 110–114. [Google Scholar] [CrossRef]
  29. Yuan, X. Research on Product Innovation Design Based on Reverse Engineering and 3D Printing Technology. Mech. Des. 2015, 32, 105–108. [Google Scholar] [CrossRef]
  30. Zubov, V.V.; Domnitskiy, A.A.; Kargin, R.V. Calculation and Choice of Grip Parameters for Garbage Truck Manipulator. Procedia Eng. 2015, 129, 896–902. [Google Scholar] [CrossRef]
  31. Ma, Q. Wide spreader for sowing turfgrass seed. Foreign For. 1983, 2, 51. [Google Scholar]
  32. Holopainen, R.; Salonen, E.-M. Modelling the Cleaning Performance of Rotating Brush in Duct Cleaning. Energy Build. 2002, 34, 845–852. [Google Scholar] [CrossRef]
  33. Kannan, N.; Huggins, C. Opportunities to Mitigate Particle Drift from Ground-Based Preemergent Herbicide Applications. Appl. Eng. Agric. 2023, 39, 33–42. [Google Scholar] [CrossRef]
  34. Alian, M.; Ein-Mozaffari, F.; Upreti, S.R.; Wu, J. Using Discrete Element Method to Analyze the Mixing of the Solid Particles in a Slant Cone Mixer. Chem. Eng. Res. Des. 2015, 93, 318–329. [Google Scholar] [CrossRef]
  35. Jung, J.; Kim, C. Scaling Law and Mechanism for the Formation of Stripe Patterns in a Binary Mixture of Granular Materials under Horizontal Vibration. J. Korean Phys. Soc. 2013, 63, 1937–1943. [Google Scholar] [CrossRef]
  36. Li, Y.; Ye, M.; Zhang, Y.; Sun, Y.; Hao, C. Optimization of Particle Distribution for Asphalt Mixtures in Screw Conveyer of Paver Based on Discrete Element Method and Response Surface Methodology. Adv. Theory Simul. 2023, 6, 2300252. [Google Scholar] [CrossRef]
  37. Zhou, K.; Jiang, Z.; Pan, D.; Gui, W.; Huang, J. Influence of Charging Parameters on the Burden Flow Velocity and Distribution on the Blast Furnace Chute Based on Discrete Element Method. Steel Res. Int. 2022, 93, 2100332. [Google Scholar] [CrossRef]
  38. Yan, D.; Yu, J.; Wang, Y.; Zhou, L.; Sun, K.; Tian, Y. A Review of the Application of Discrete Element Method in Agricultural Engineering: A Case Study of Soybean. Processes 2022, 10, 1305. [Google Scholar] [CrossRef]
  39. Zhao, Z.; Wu, M.; Jiang, X. A Review of Contact Models’ Properties for Discrete Element Simulation in Agricultural Engineering. Agriculture 2024, 14, 238. [Google Scholar] [CrossRef]
  40. Lai, Q.; Hua, Z.; Xing, J.; Ma, W. Simulation and Verification for Seed-Filling Performance of Cell Wheel Precision Seed Metering Device Based on Discrete Element Method. MATEC Web. Conf. 2018, 169, 01035. [Google Scholar] [CrossRef]
  41. Ramírez-Aragón, C.; Ordieres-Meré, J.; Alba-Elías, F.; González-Marcos, A. Comparison of Cohesive Models in EDEM and LIGGGHTS for Simulating Powder Compaction. Materials 2018, 11, 2341. [Google Scholar] [CrossRef] [PubMed]
  42. Sheng, X.; Guo, A.; Guo, S.; Sui, S.; Yang, W.; Tang, R.; Li, X.; Qu, P.; Wang, M.; Lin, X. Laser Powder Bed Fusion for the Fabrication of Triply Periodic Minimal Surface Lattice Structures: Synergistic Macroscopic and Microscopic Optimization. J. Manuf. Process. 2024, 119, 179–192. [Google Scholar] [CrossRef]
  43. Kong, D.; Guo, A.; Wu, H.; Li, X.; Wu, J.; Hu, Y.; Qu, P.; Wang, S.; Guo, S. Four-Dimensional Printing of Polymer-Derived Ceramics with High-Resolution, Reconfigurability, and Shape Memory Effects. Addit. Manuf. 2024, 83, 104050. [Google Scholar] [CrossRef]
  44. Jirapornvaree, I.; Suppadit, T.; Kumar, V. Assessing the Economic and Environmental Impact of Jasmine Rice Production: Life Cycle Assessment and Life Cycle Costs Analysis. J. Clean. Prod. 2021, 303, 127079. [Google Scholar] [CrossRef]
  45. China Machinery Industry Federation. JB/T 7303-2007; Road Sweeper. China Machine Press: Beijing, China, 2007. [Google Scholar]
  46. Chen, Y.; Cheng, Y.; Chen, J.; Zheng, Z.; Hu, C.; Cao, J. Design and Experiment of the Buckwheat Hill-Drop Planter Hole Forming Device. Agriculture 2021, 11, 1085. [Google Scholar] [CrossRef]
  47. Zheng, G.; Qi, B.; Zhang, W.; Song, S.; Wu, Y.; Xia, Q.Q.; Wang, Y. Calibration and Testing of Discrete Element Simulation Parameters for Spinach Seeds. Comp. Part. Mech. 2024, 1–12, in press. [Google Scholar] [CrossRef]
  48. Chen, Z.; Xue, D.; Guan, W.; Guo, J.; Liu, Z. Performance Optimization of a Spoon Precision Seed Metering Device Based on a Maize Seed Assembly Model and Discrete Element Method. Processes 2023, 11, 3076. [Google Scholar] [CrossRef]
  49. Wang, W.; Zhao, Y.; Li, M. Comparative study on establishment effect of summer/fall seeded duckweed + perennial ryegrass + white clover grasses. J. Yunnan Agric. Univ. 2021, 36, 1057–1064. [Google Scholar]
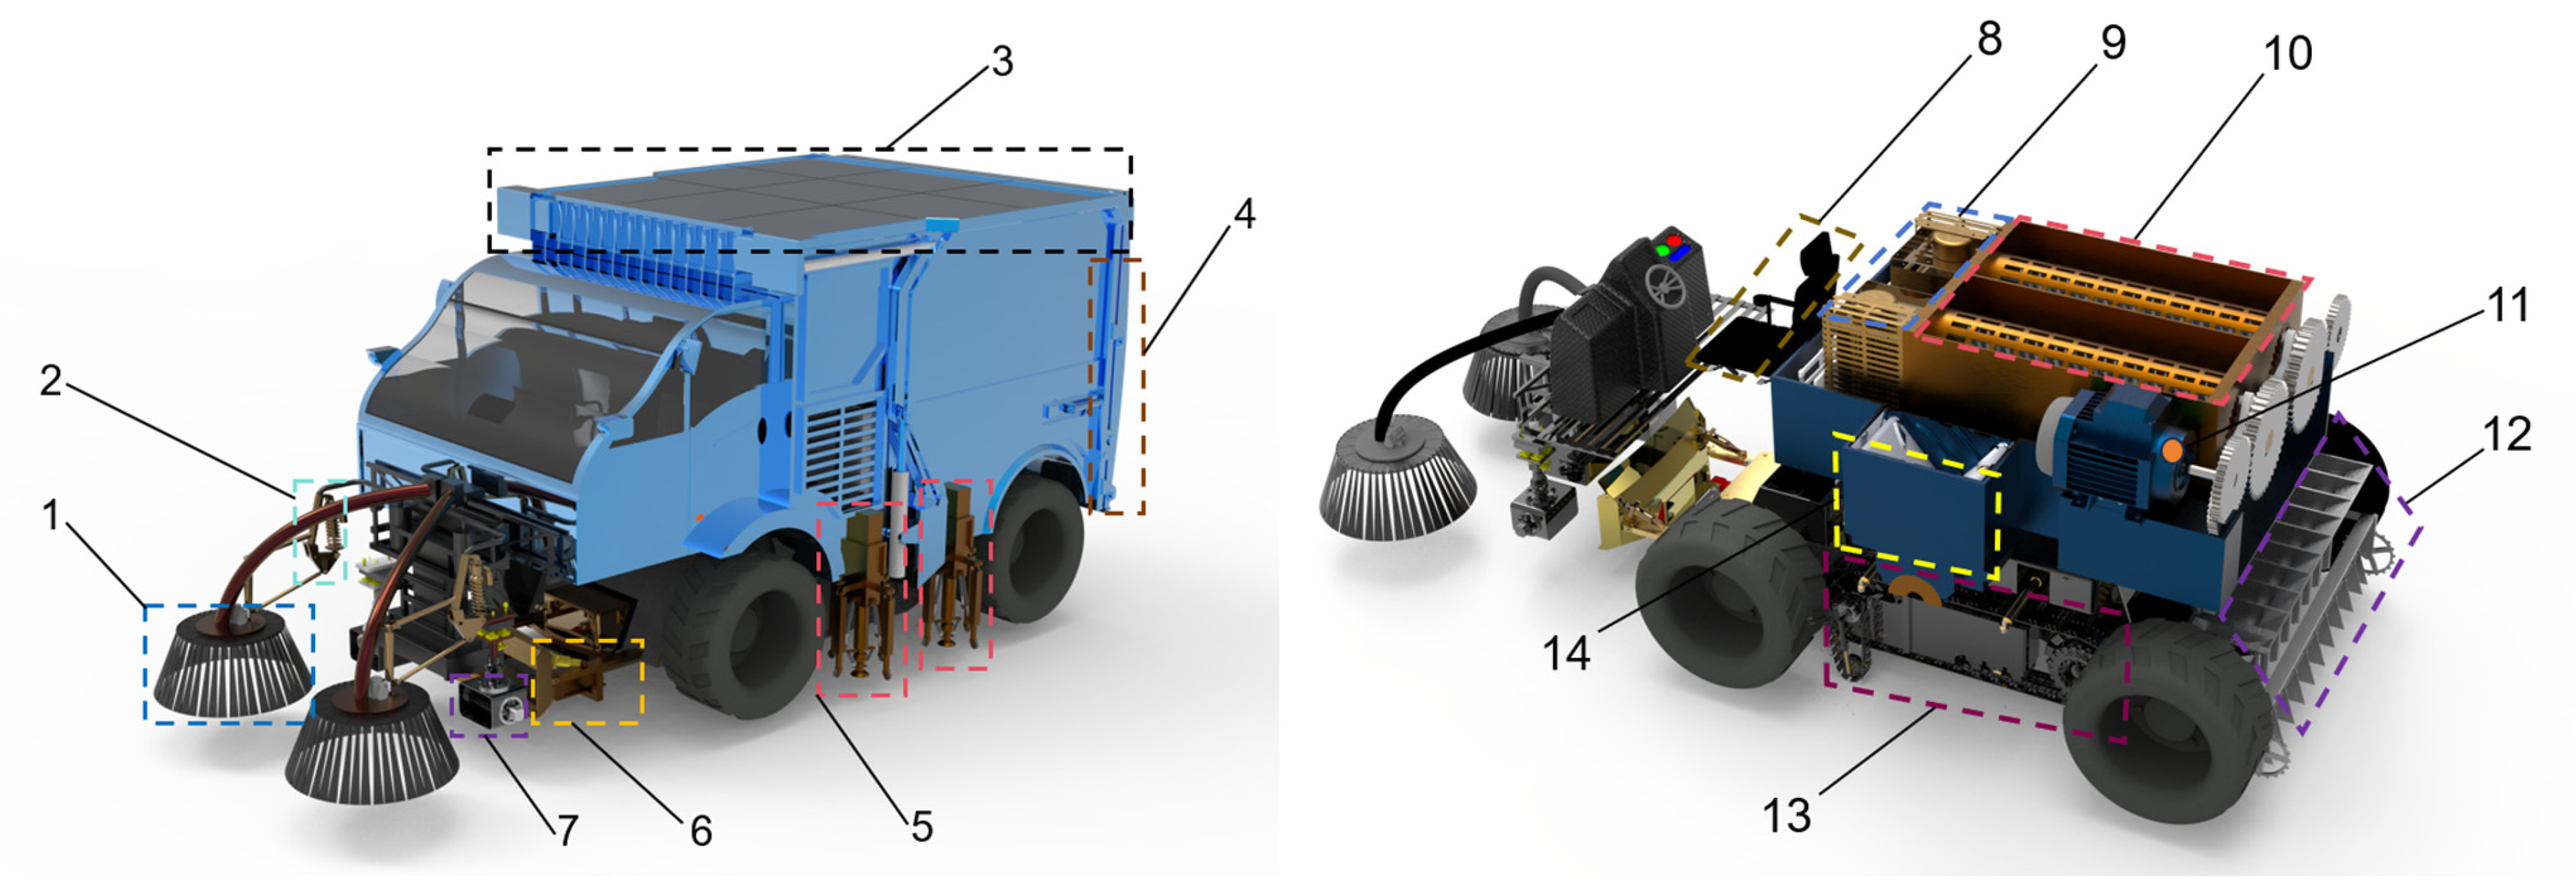
Figure 1. Grassland ecological cleaning and restoration vehicle: 1. radius and angle variable disk brush device; 2. disk brush holder; 3. photovoltaic panel 4. rear door; 5. rotating ball stabilizing outrigger; 6. soil separating device; 7. side garbage winnowing device; 8. four-direction leveling seat; 9. dust exclusion box; 10. spiral knife garbage winnowing device; 11. motor; 12. grass seed sowing device; 13. wheel–track composite device; 14. carriage leveling device.
Machines 13 00114 g001
Figure 2. Wheel-–track composite obstacle-crossing device. (a) Schematic diagram of wheel–track conversion. (b) Schematic diagram of obstacle-crossing device: 1. wheel; 2. main support arm; 3. hydraulic cylinder; 4. rotating ball constant stabilizing outrigger; 5. rotating track.
Machines 13 00114 g002
Figure 3. Variable radius and angle disk brushes. (a) Radius and angle variable disk brush device. (b) Radius and angle variable disk brush, exploded view: 1. swivel arm; 2. guide bar; 3. brush; 4. upper cover; 5. angle variable gear set; 6. angle variable toothed ring; 7. angle variable actuator; 8. lower cover; 9. angle variable radius toothed ring; 10. angle variable radius gear set; 11. housing; 12. angle variable radius actuator.
Machines 13 00114 g003
Figure 4. Part connection of the swivel arm mechanism and drive motor setting. (a) Part connection of the swivel arm mechanism: 1. shock-absorbing cylinder; 2. spring stop; 3. swivel arm. (b) Drive motor control curve.
Machines 13 00114 g004
Figure 5. Analysis of forces and displacements in the motion of a swivel arm mechanism. (a) Motion force analysis of the components of the swivel arm mechanism (the symbol * represents the multiplication sign). (b) Displacement curve of the swivel arm motion.
Machines 13 00114 g005
Figure 6. Static analysis results of the swivel arm before optimization. (a) Swivel arm displacement cloud. (b) Swivel arm stress cloud.
Machines 13 00114 g006
Figure 7. Topology optimization flowchart.
Machines 13 00114 g007
Figure 8. Turning arm weight reduction. (a) Topology optimization result. (b) Automatic fitting result. (c) Manual fitting result.
Machines 13 00114 g008
Figure 9. Results of the static analysis of the optimized swivel arm. (a) Displacement cloud. (b) Von Mises equivalent stress cloud.
Machines 13 00114 g009
Figure 10. Energy diagram before and after optimization of the disk brush swivel arm support.
Machines 13 00114 g010
Figure 11. Physical drawings of the swivel arm parts before and after optimization. (a) Before model optimization. (b) After model optimization.
Machines 13 00114 g011
Figure 12. Three-dimensional model of the spiral knife waste shredding device: 1. screen; 2. spiral reamer; 3. reamer support disk; 4. sheet reamer.
Machines 13 00114 g012
Figure 13. Moment analysis of the spiral knife waste shredding device. (a) Reamer angular moment curve. (b) Reamer linear moment. (c) Reamer acceleration (** represents exponentiation).
Machines 13 00114 g013
Figure 14. Moment analysis of the spiral knife waste shredding device. (a) Angular displacement. (b) Linear displacement.
Machines 13 00114 g014
Figure 15. Three-dimensional model diagram of the carriage leveling and holding device. (a) State of the carriage leveling device when the ground is horizontal. (b) State of the carriage leveling device when the ground is inclined. (c) Main view of the leveling device: 1. first fixing solenoid; 2. spring support plate; 3. second fixing solenoid; 4. moving gear; 5. accumulator; 6. motor; 7. fixing gear; 8. worm; 9. turbine.
Machines 13 00114 g015
Figure 16. Side view of two modes of grass seed sowing device: 1. soil turning device; 2. frame; 3. seeding device; 4. self-propelled wheels; 5. mulching device; 6. crushing wheels.
Machines 13 00114 g016
Figure 17. Motion parameter model of disk brush. (a) Synthesis of motion at point Q. (b) Synthesis of velocity change at point Q.
Machines 13 00114 g017
Figure 18. Trajectory of a point on the disk brush.
Machines 13 00114 g018
Figure 19. Schematic diagram of the linear contact model.
Machines 13 00114 g019
Figure 20. Simulation platform for waste collection process of grassland ecological cleaning and restoration vehicles.
Machines 13 00114 g020
Figure 21. Motion trajectory simulation results. (a) Disk brush rotational speed 90 r/min; λ varies with the speed of the vehicle. (b) Plot of the variation of λ with vehicle speed for a disk brush speed of 130 r/min. (c) Plot of the variation of λ with vehicle speed for a disk brush speed of 200 r/min.
Machines 13 00114 g021
Figure 22. Stress diagrams of graminaceous plants. (a) Stress diagram of graminaceous plants at 90 r/min speed. (b) Stress diagram of graminaceous plants at 130 r/min speed. (c) Stress diagram of graminaceous plants at 200 r/min speed.
Machines 13 00114 g022
Figure 23. Plastic bottle collection experiment. (a) Plastic bottle collection at 90 r/min. (b) Plastic bottle collection at 130 r/min. (c) Plastic bottle collection at 200 r/min.
Machines 13 00114 g023
Figure 24. Prairie eco-clean restoration vehicle clean rate testbed.
Machines 13 00114 g024
Figure 25. Vector diagrams of particles thrown by disk brush. (a) Vector diagram of particle direction for speed 90 r/min. (b) Vector diagram of particle direction for speed 130 r/min. (c) Vector diagram of particle direction for speed 200 r/min.
Machines 13 00114 g025
Figure 26. Kinetic energy diagrams of particles thrown by disk brush. (a) Kinetic energy diagram of particles with speed 90 r/min. (b) Vector diagram of particles with speed 130 r/min. (c) Vector diagram of particles with speed 200 r/min.
Machines 13 00114 g026
Figure 27. Cleaning effect of different speeds of disk brush. (a) Cleaning effect of speed 90 r/min. (b) Cleaning effect of speed 130 r/min. (c) Cleaning effect of speed 200 r/min.
Machines 13 00114 g027
Figure 28. Sowing experiment site setup.
Machines 13 00114 g028
Figure 29. Effect of seed discharge at different speeds. (a) Histogram of seed discharge at 40 r/min. (b) Histogram of seed discharge at 50 r/min. (c) Histogram of seed discharge at 60 r/min.
Machines 13 00114 g029
Figure 30. Effect of seed displacement with different numbers of slots. (a) Histogram of seed displacement with 20 slots. (b) Histogram of seed displacement with 22 slots. (c) Histogram of seed displacement with 24 slots.
Machines 13 00114 g030
Table 1. Performance indicators of grassland ecological cleaning and restoration vehicle.
NameOverall Size (mm)Overall Mass (kg)Working Width (mm)Rated Load (kg)Authorized Strength
parameters6890 × 1890 × 26409800190043001
Table 2. Performance comparison before and after optimization.
Maximum Displacement/mmMaximum von Mises Equivalent Force/MpaMass/kg
Initial model1.364 × 10−2 mm143.6 Mpa15.909 kg
Optimized model1.939 × 10−3 mm157.4 Mpa7.091 kg
Table 3. Basic parameters used in the DEM model.
Nature of SampleValueNature of the ModelValue
Number of grass plants200Normal Stiffness/N/m21 × 109
Contact modelLinear contact bondShear Stiffness/N/m23 × 108
Shear modulus/Pa1 × 108Normal Strength/Pa5 × 107
Friction coefficient0.5Shear Strength/Pa5 × 107
Stem density/(kg/m3)100
Table 4. Test result data.
Speed Ratio Coefficient λDisk Brush Speed/(r·min−1)Vehicle Speed/(km·h−1)Cleaning Rate/%
1.826901098.9
1.8661301585.1
1.3562003081.5
Table 5. Seed parameter settings.
CharacteristicsParameterNumerical
Seed characteristicsPoisson’s ratio0.362
Density (kg·m−3)1.04 × 10³
Shear modulus (Pa)5.06 × 10⁷
Aluminum alloyPoisson’s ratio0.394
Density (kg·m−3)2.05 × 10³
Shear modulus (Pa)7.9 × 10⁸
Coefficient of restitutionSeed–seed0.501
Seed–seed guide mechanism0.500
Coefficient of static frictionSeed–seed0.213
Seed–seed guide mechanism0.300
Coefficient of rolling frictionSeed–seed0.035
Seed–seed guide mechanism0.030
Other parametersGravitational acceleration (m·s−2)9.81
Table 6. Data table of orthogonal experiments.
ConsiderationsFactor A (Seeding Disk Speed)Factor B (Vehicle Speed)Factor C (Number of Slots)Seed DispenserRow Spacing/cm
1111509.17
21226212.5
31336519.44
42127410.56
52237314.58
62316329.17
73135311.67
83214220.83
93325231.25
average value 159.00059.00051.667
average value 270.00059.00062.667
average value 349.00060.00063.667
extremely poor R21.0001.00012.000
Disclaimer/Publisher’s Note: The statements, opinions and data contained in all publications are solely those of the individual author(s) and contributor(s) and not of MDPI and/or the editor(s). MDPI and/or the editor(s) disclaim responsibility for any injury to people or property resulting from any ideas, methods, instructions or products referred to in the content.