Article

Gear Fault Classification and Diagnosis Based on Gear Transmission Errors: Theoretical and Experimental Research

1
College of Mechanical and Electrical Engineering, Wenzhou University, Wenzhou 325035, China
2
Pingyang Institute of Intelligent Manufacturing, Wenzhou University, Wenzhou 325035, China
*
Author to whom correspondence should be addressed.
Machines 2025, 13(12), 1093; https://doi.org/10.3390/machines13121093
Submission received: 30 October 2025 / Revised: 21 November 2025 / Accepted: 25 November 2025 / Published: 26 November 2025

Abstract

Among gearbox faults, gear tooth faults are dominant. Although the traditional vibration spectrum analysis method is the mainstream diagnostic method, it has limitations such as sensitivity to environmental noise and high sensor deployment cost. Based on the influence of the meshing stiffness of the faulty gear on the dynamic transmission error of the gear, this study innovatively proposes to use the transmission error to diagnose and identify typical gear tooth faults. This paper first calculates the time-varying stiffness of typical faulty gear teeth based on the potential energy method, and analyzes the influence of various faults and environmental noise on the dynamic transmission error signal and vibration signal by establishing a six-degree-of-freedom gear transmission dynamics model. Then, a gear transmission experimental platform is built to synchronously collect the vibration acceleration and transmission error data of the gearbox. The convolutional neural network is used to classify the data under different sample lengths and different noise intensities. The results show that the transmission error signal under the same conditions has a higher gear fault diagnosis accuracy. The proposed method can not only improve the accuracy and anti-interference of gear fault diagnosis but also reduce the deployment cost of signal acquisition, providing a new paradigm for gear condition monitoring.

1. Introduction

The reliability of gear systems is fundamental to the stable operation of numerous mechanical equipment. Although fault diagnosis techniques based on vibration and meshing force signal analysis are widely used, their effectiveness is often limited by harsh working environments in actual industrial scenarios [1,2,3,4], especially in fields with stringent safety and precision requirements. Strong background noise and electromagnetic interference significantly reduce the signal-to-noise ratio, making it difficult for traditional signal analysis methods to capture subtle signs that indicate early faults [5]. This constitutes a major technical bottleneck in achieving high-precision early diagnosis.
Kong et al. [6] establish a dynamic model of a two-stage gear transmission system with coupled pitting and cracking faults, and investigate the influence of these coupled faults on the system’s dynamic characteristics through simulation and experiment. Yu et al. [7] developed a digital twin-enhanced data-driven framework for gearbox fault detection, which synergistically amplifies discriminative features in both physical vibration signals and simulated signals, particularly for subtle characteristic frequencies; Niu et al. [8] investigated distinct phase and trend characteristics exhibited by various planetary gear faults in meshing forces. Although commonly adopted, both vibration and meshing force data pose two primary challenges for practical application [9,10,11,12]. On one hand, vibration analysis necessitates handling high-frequency data streams that are vulnerable to noise contamination. On the other hand, direct meshing force measurement is often prohibitively expensive and difficult to implement in operational environments. Chin et al. [13] proposed to utilize the different speeds and loads often encountered in gear transmissions through automatic identification of cracked teeth and TE-based crack size estimation methods. This study innovatively proposes the use of transmission error (TE) to investigate fault severity and characteristics, demonstrating its strong potential for gear fault assessment. However, research on its applications in fault diagnosis remains insufficient. Therefore, this paper proposes to use transmission error, which has higher sensitivity to gear faults and higher adaptability to different working conditions, as signal data [14] for fault diagnosis.
Gear mesh stiffness refers to the ability of gear teeth to resist deformation during meshing [15,16,17]. When tooth faults occur, the mesh stiffness varies accordingly, altering transmission performance [18,19]. Therefore, this study proposes a fault diagnosis method for typical gear tooth faults by leveraging the relationship between mesh stiffness and transmission error, using TE as input data.
To validate the feasibility of TE in gear fault diagnosis, we first analyze the stiffness-TE relationship. The time-varying mesh stiffness of healthy and faulty gears is calculated using the potential energy method, and a six-degree-of-freedom (6-DOF) dynamic model is established to simulate DTE and vibration displacement signals. The effects of different fault types and environmental noise on DTE and vibration signals are systematically investigated. Subsequently, a gear transmission test rig is constructed to synchronously acquire vibration acceleration and TE data. A 1D convolutional neural network (CNN) is employed to classify faults under varying sample lengths and noise intensities. By comparing the diagnostic accuracy of different signals under identical conditions, we identify the limitations of each signal type and analyze the causes of accuracy degradation. This work lays a foundation and provides guidance for future research.

2. Gear Transmission Dynamics Model

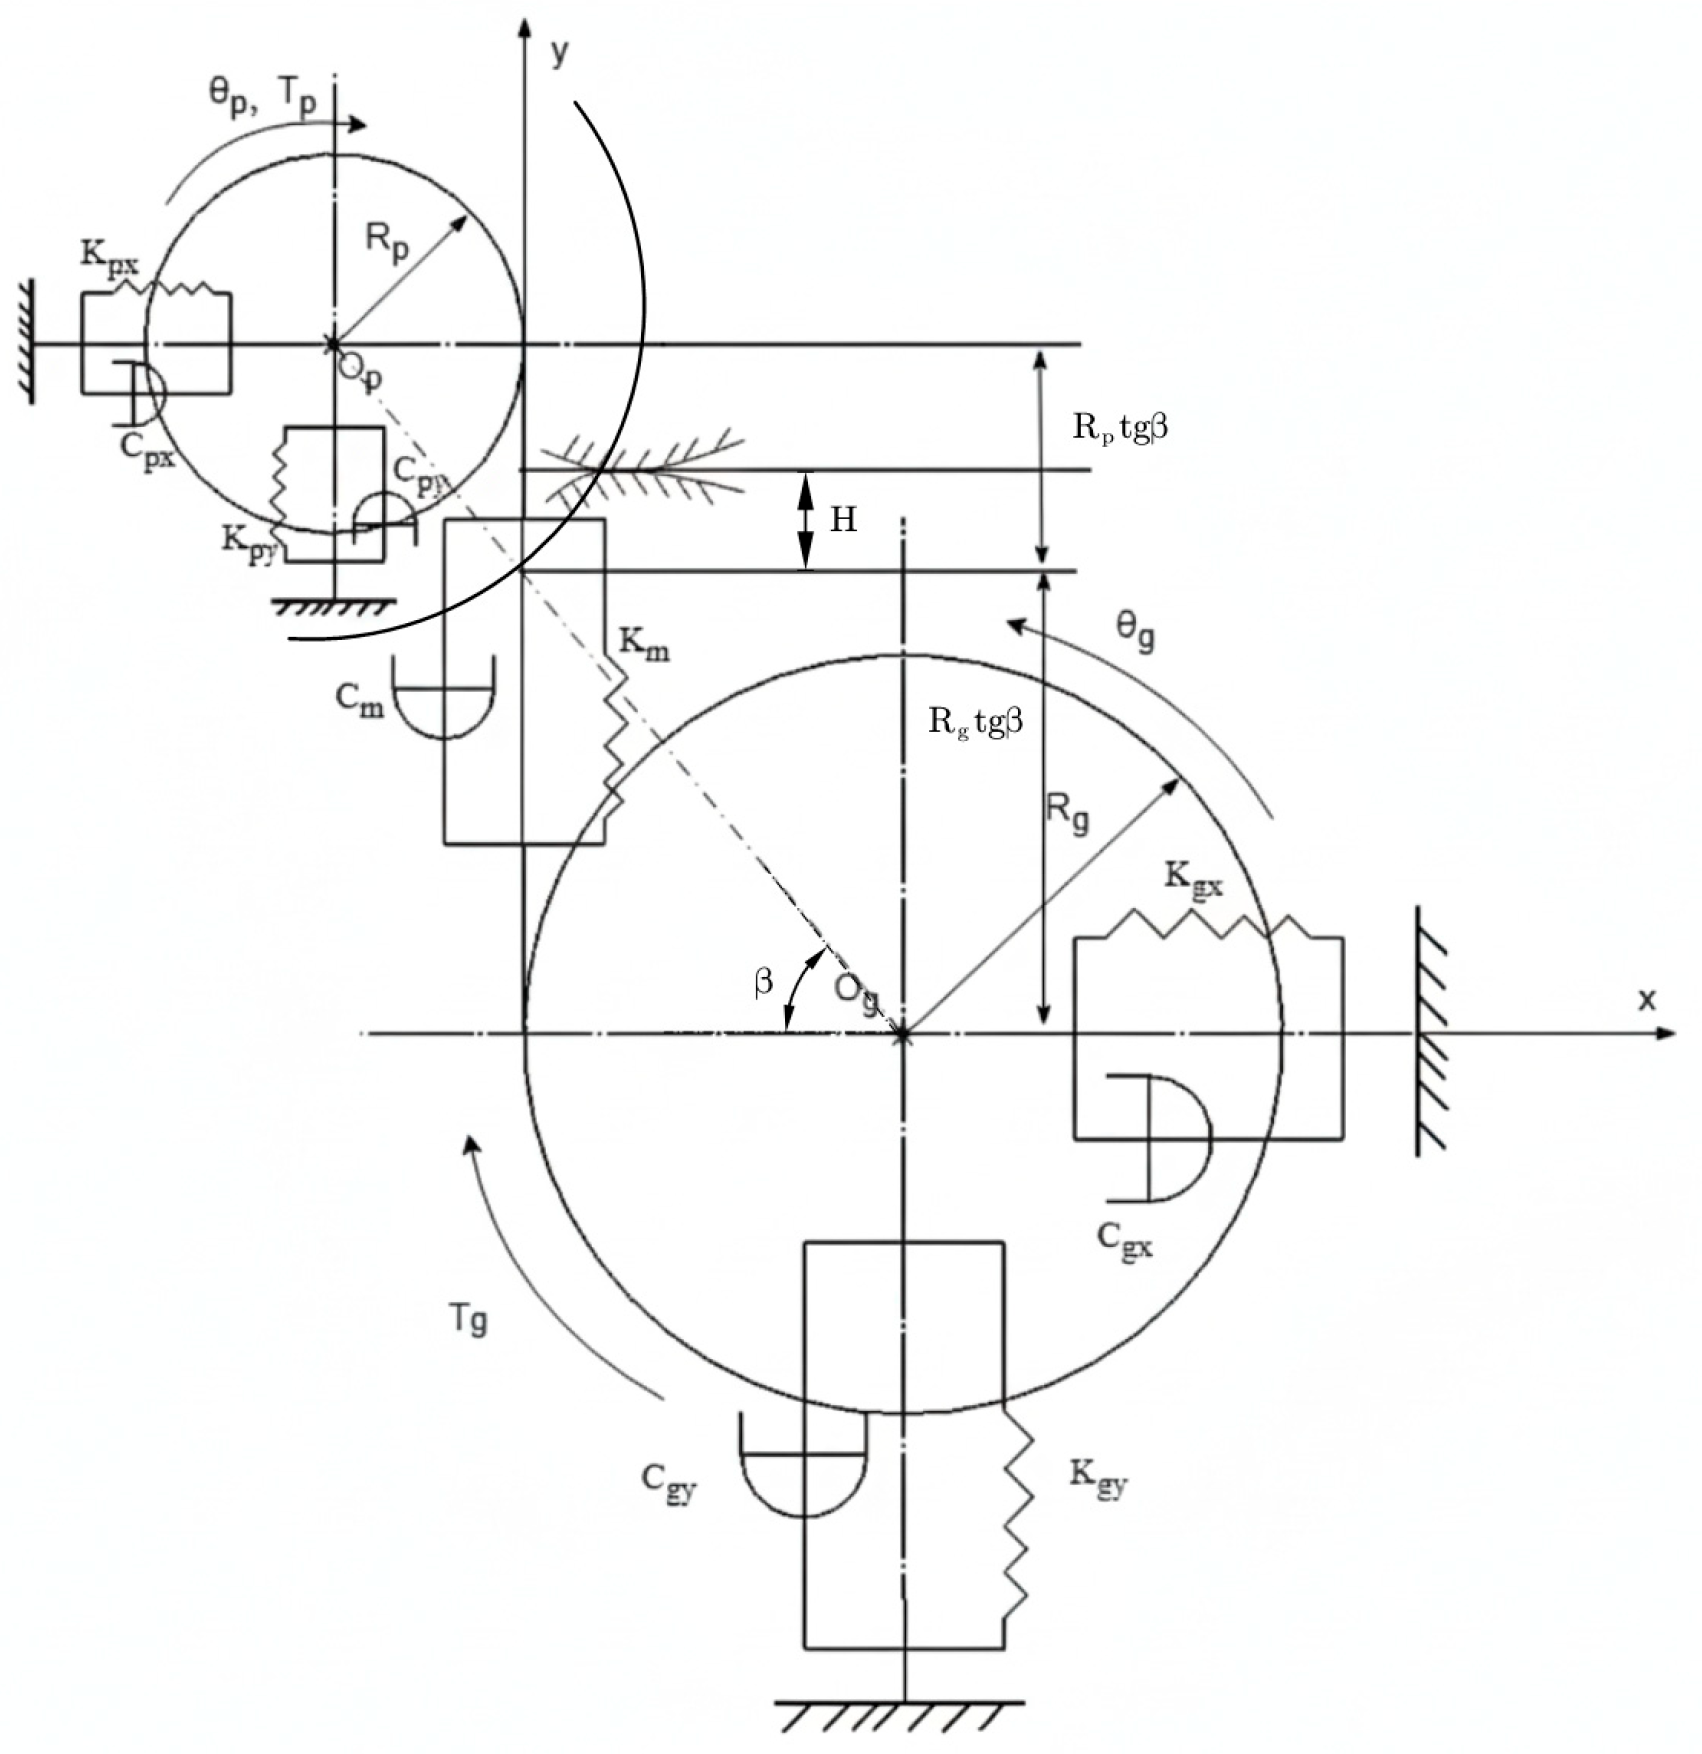
To investigate the influence of gear tooth faults on transmission error, this study adopts a six-degree-of-freedom (6-DOF) rotational-translational coupled dynamic model of a spur gear pair, as illustrated in Figure 1. The model comprises four translational degrees of freedom (DOFs) for gear displacement and two rotational DOFs for angular motion. The system’s dynamic equations are derived via Newton’s second law [20], expressed as:
m p x ¨ p + c p x x ˙ p + k p x x p = F f m p y ¨ p + c p y y ˙ p + k p y y p = F p I p θ ¨ p = F p R p + T p + F f ( R p t g β H ) m g x ¨ g + c g x x ˙ g + k g x x g = F f m g y ¨ g + c g y y ˙ g + k g y y g = F g I g θ ¨ g = F p R g T g + F f ( R g t g β + H )
In Formula (1),
( i = p , g ) p is the driving wheel, g is the driven wheel.
I i ( i = p , g ) is the moment of inertia.
R i ( i = p , g ) is the base circle radii.
m i ( i = p , g ) is the mass.
c p i , c g i ( i = x , y ) are the horizontal and vertical translation vibration damping coefficients.
k p i , k g i ( i = x , y ) are the horizontal and vertical translation vibration stiffness coefficients.
k m , c m are the time-varying meshing stiffness and comprehensive damping of the gear pair.
θ i ( i = p , g ) is the Torsional angle.
x i ( i = p , g ) is the horizontal displacement.
y i ( i = p , g ) is the Vertical displacement.
β is the mesh angle (pressure angle).
H is the distance from the mesh point to the pitch point.
F f = λ f F p is the tooth surface friction force. f is the equivalent friction coefficient. λ is the directional coefficient of tooth friction force (positive when F f aligned with the positive direction of the mesh line, negative otherwise).
F p is the dynamic mesh force acting on the driving gear.
F p = k m y + c m y ˙
F g = F p is the dynamic mesh force acting on the driven gear.
The horizontal and vertical displacements of the two gears are projected onto the meshing line to obtain the dynamic transmission error of the gear system, which can be described as follows:
DTE = R p θ p + R g θ g + y p y g
If the displacement of the gear axis is not considered, we call it a transmission error:
TE = R p θ p + R g θ g

3. Calculation of Time-Varying Meshing Stiffness of Gear Teeth

During gear meshing, the number of tooth pairs in contact and their contact state continuously vary, resulting in time-dependent changes in mesh stiffness. Therefore, in Equation (1), the gear pair’s mesh stiffness is time-varying. As the primary excitation source of gear system vibrations, it serves as a fundamental factor influencing dynamic characteristics such as vibration, noise, and fatigue life. When gear faults occur, the amplitude of mesh stiffness decreases or exhibits characteristic fluctuations (e.g., localized reductions). Accurate calculation and analysis of time-varying mesh stiffness are crucial for revealing the internal excitation mechanisms and vibrational behavior of gear transmission systems. Below, we employ the potential energy method to compute the time-varying mesh stiffness for healthy gears, gears with cracks, and gears affected by pitting faults.

3.1. Normal Gear Time-Varying Stiffness

The gear tooth is modeled as a cantilever beam, incorporating Hertzian contact effects (including bending and axial compression). Using the potential energy method, the total potential energy of the tooth can be decomposed into the following:
Bending potential energy U b ,
Shear potential energy U s ,
Axial compression potential energy U a ,
Hertzian contact potential energy U h .
The corresponding deformation stiffness components are then derived via energy principles:
Bending stiffness k b ,
Shear stiffness k s
Axial compression stiffness k a
Hertzian contact stiffness k h [21].
U b = F 2 2 k b = 0 d [ F b ( d x ) F a h ] 2 E I x 2 d x
U s = F 2 2 k s = 0 d 1.2 F b 2 2 G A x d x
U a = F 2 2 k a = 0 d F a 2 2 E A x d x
U h = F 2 2 k h
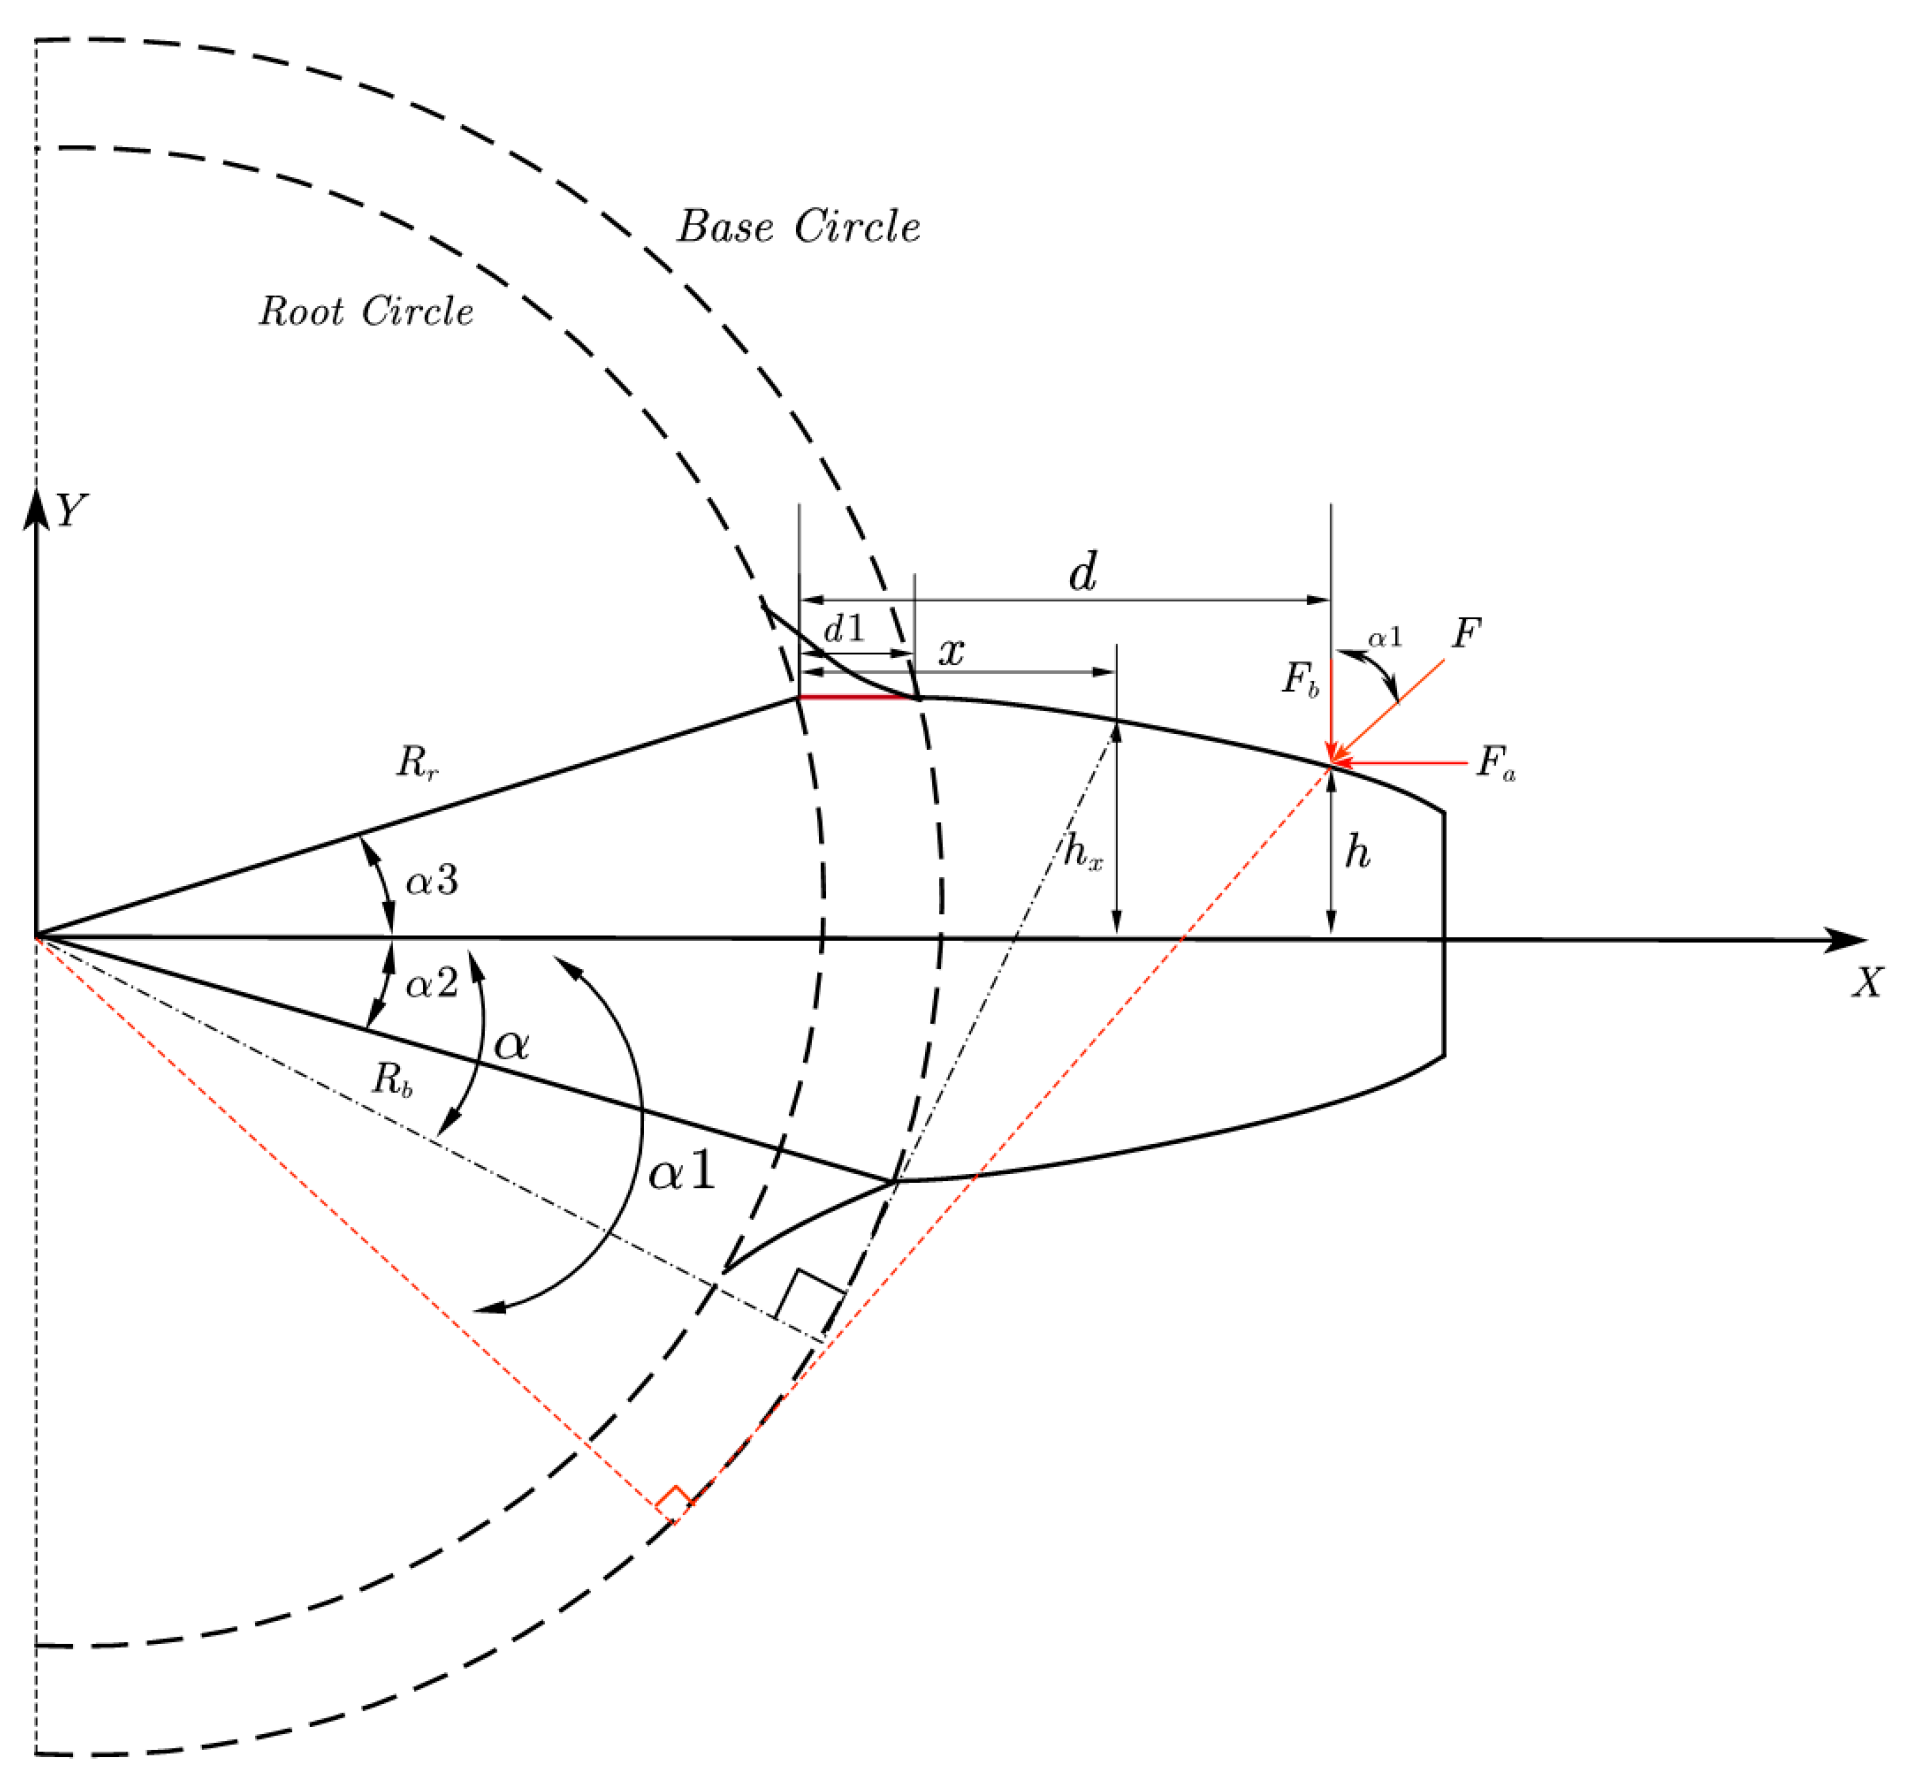
In Formulas (5)–(8), F is the mesh force, with F a and F b representing its horizontal and vertical components, respectively. G denotes the shear modulus, and E is Young’s modulus. d is the distance from the tooth root to the contact point on the tooth profile. h represents the distance from the gear tooth’s centerline (in the x-direction) to the contact point, as illustrated in Figure 2. A x and I x are the cross-sectional area and moment of inertia of the tooth, respectively.
I x = 2 3 h x 3 L
A x = 2 h x L
G = E 2 ( 1 + v )
h = R b [ ( α 1 + α 2 ) cos α 1 sin α 1 ]
d = R b [ cos α 1 + ( α 1 + α 2 ) sin α 1 ] R r cos α 3
h x = R b sin α 2 , R b [ ( α 2 + α 1 ) cos α 1 + sin α ] , 0 x d 1 d 1 x d
d 1 = R b cos α 2 R r cos α 3
In Figure 2, α 1 is the angle between the line of action and the horizontal component of the gear force (for the mating gear, denoted as α 1 ). α is the rotation angle of the gear corresponding to a specific point on the line of action. α 2 , α 3 are the semi-tooth angles of the base circle and root circle, respectively. h x is the semi-tooth thickness. R b , R r are the radii of the base circle and root circle, α 0 is the pressure angle, θ , θ are the angular displacement of the driving gear and driven gear, respectively.
α 1 = θ π 2 Z 1 θ + tan [ arccos Z 1 cos α 0 ( Z 2 + 2 ) 2 + ( Z 1 + Z 2 ) 2 2 ( Z 2 + 2 ) ( Z 1 + Z 2 ) cos ( arccos Z 2 cos α 0 Z 2 + 2 α 0 ) ]
α 1 = tan ( arccos Z 2 cos α 0 Z 2 + 2 ) π 2 Z 2 θ Z 1 Z 2 θ
By substituting Equations (9) through (15) into (5) to (8), we obtain the following expressions for k b , k s and k a :
1 k b = [ 1 ( z 2.5 ) cos α 1 cos α 3 z cos α 0 ] 3 ( 1 cos α 1 cos α 2 ) 3 2 E L cos α 1 sin 3 α 2 + α 1 α 2 3 1 + cos α 1 [ ( α 2 α 1 ) sin α cos α ] 2 ( α 2 α ) cos α 2 E L [ sin α + ( α 2 α ) cos α ] 3 d α
1 k s = 1.2 ( 1 + v ) cos 2 α 1 ( cos α 2 z 2.5 z cos α 0 cos α 3 E L sin α 2 + α 1 α 2 1.2 ( 1 + v ) ( α 2 α 1 ) cos α cos 2 α 1 E L [ sin α + ( α 2 α ) cos α ] d α
1 k a = sin 2 α 1 ( cos α 2 z 2.5 z cos α 0 cos α 3 2 E L sin α 2 + α 1 α 2 ( α 2 α 1 ) cos α sin 2 α 1 2 E L [ sin α + ( α 2 α ) cos α ] d α
The Hertz contact stiffness formula is [21]:
1 k h = π E L 4 ( 1 v 2 )
The calculation formula of gear matrix deformation stiffness is [22]
1 k f = cos 2 α 1 E L L * μ f S f 2 + M * μ f S f + P * 1 + Q * tan 2 α 1
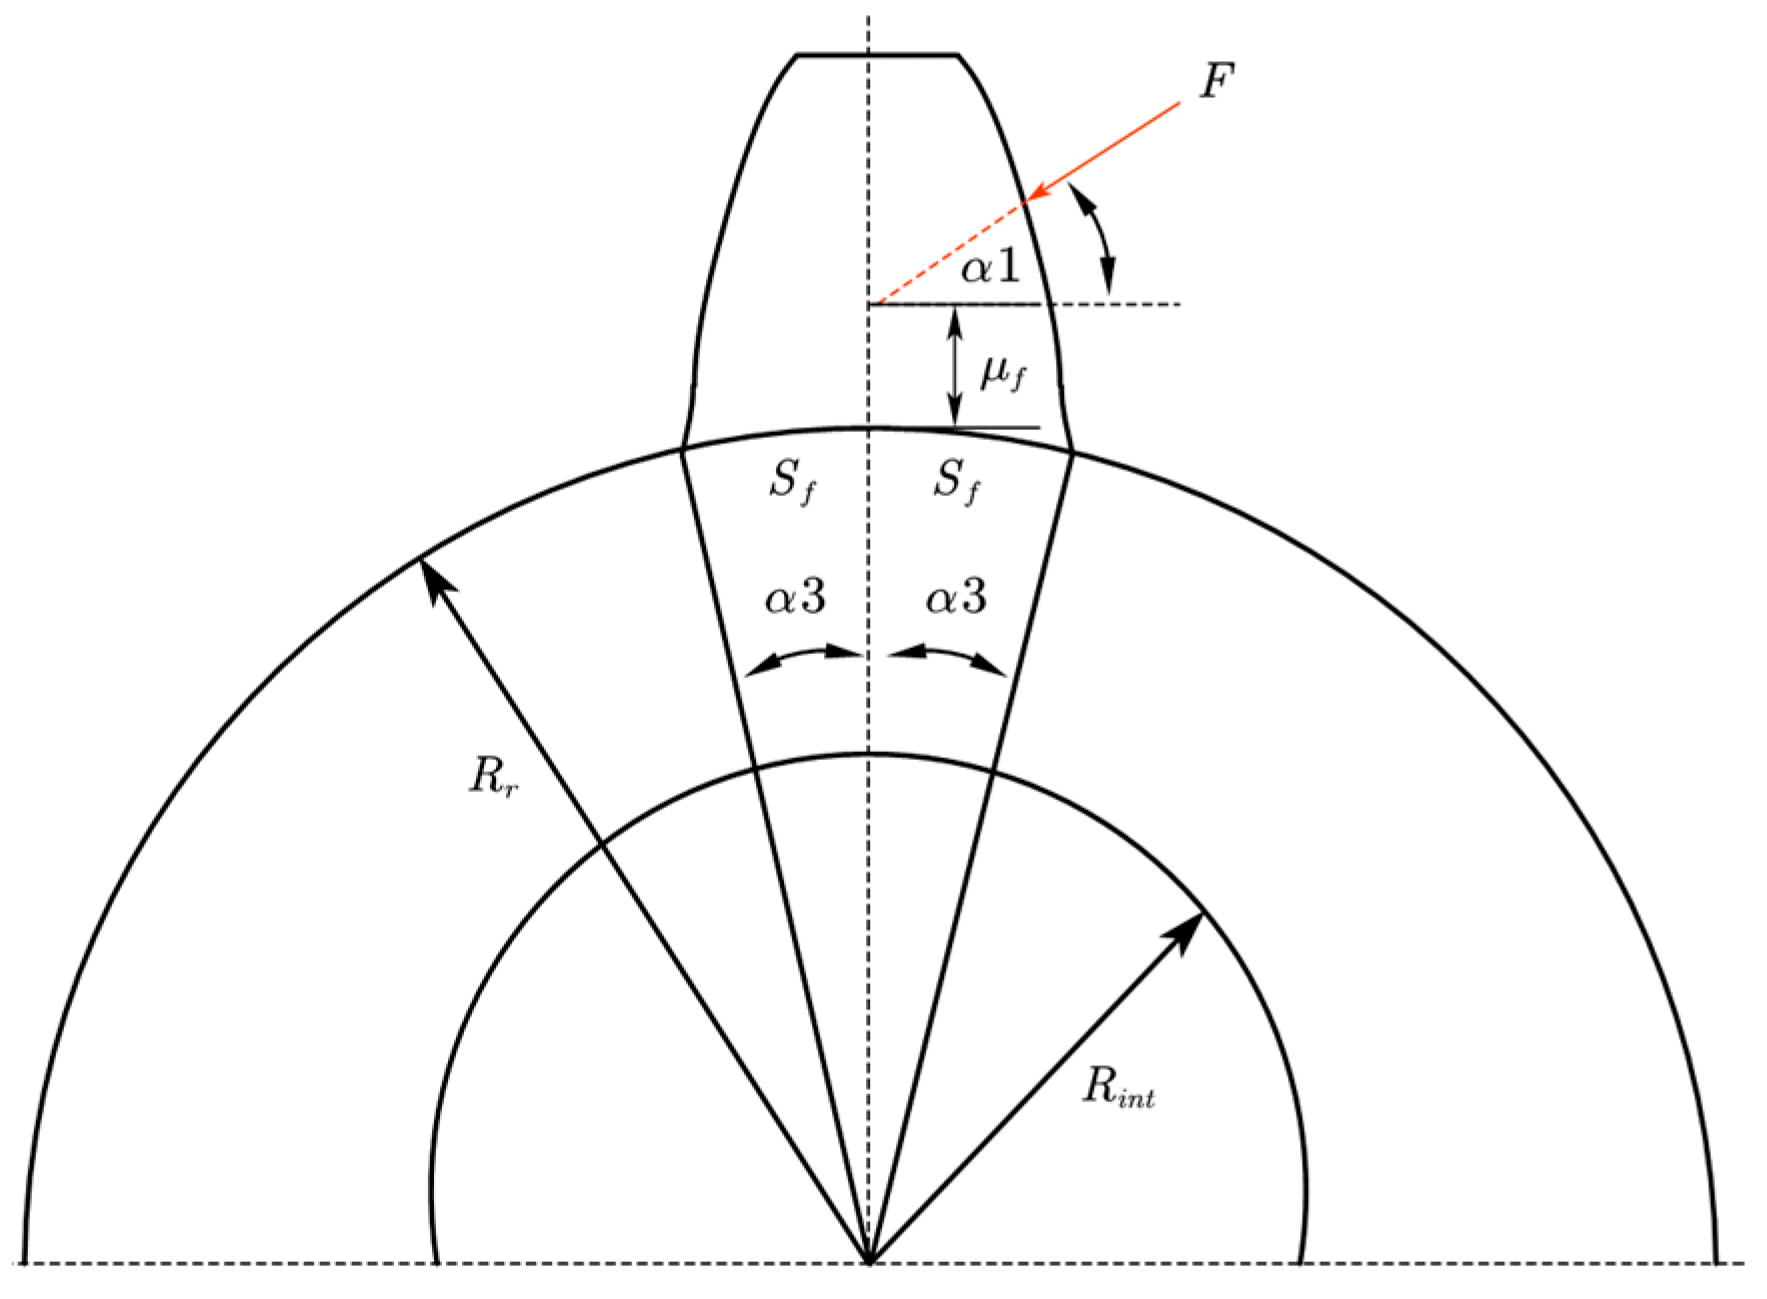
In Formula (22), S f is the root arc length. S f = 2 R r / α 3 . μ f denotes the distance from the root circle tooth profile to the action point centerline, as illustrated in Figure 3.
The derived polynomial functions for L * , M * , P * and Q * are expressed as:
X j * = A j / α 3 2 + B j h f 2 + C j h f / α 3 + D j / α 3 + E j h f + F j
h f is the ratio of the root circle radius to the gear aperture. The coefficient values in Formula (23) are listed in Table 1.
Considering the alternating meshing of single and double teeth during gear meshing, the comprehensive stiffness calculation formula is:
k t = 1 / ( 1 k h + 1 k b 1 + 1 k s 1 + 1 k f 1 + 1 k a 1 + 1 k b 2 + 1 k s 2 + 1 k f 2 + 1 k a 2 ) , i = 1 2 1 / ( 1 k h , i + 1 k b 1 , i + 1 k s 1 , i + 1 k f 1 , i + 1 k a 1 , i + 1 k b 2 , i + 1 k s 2 , i + 1 k f 2 , i + 1 k a 2 , i ) , Sin gle   tooth Double   teeth
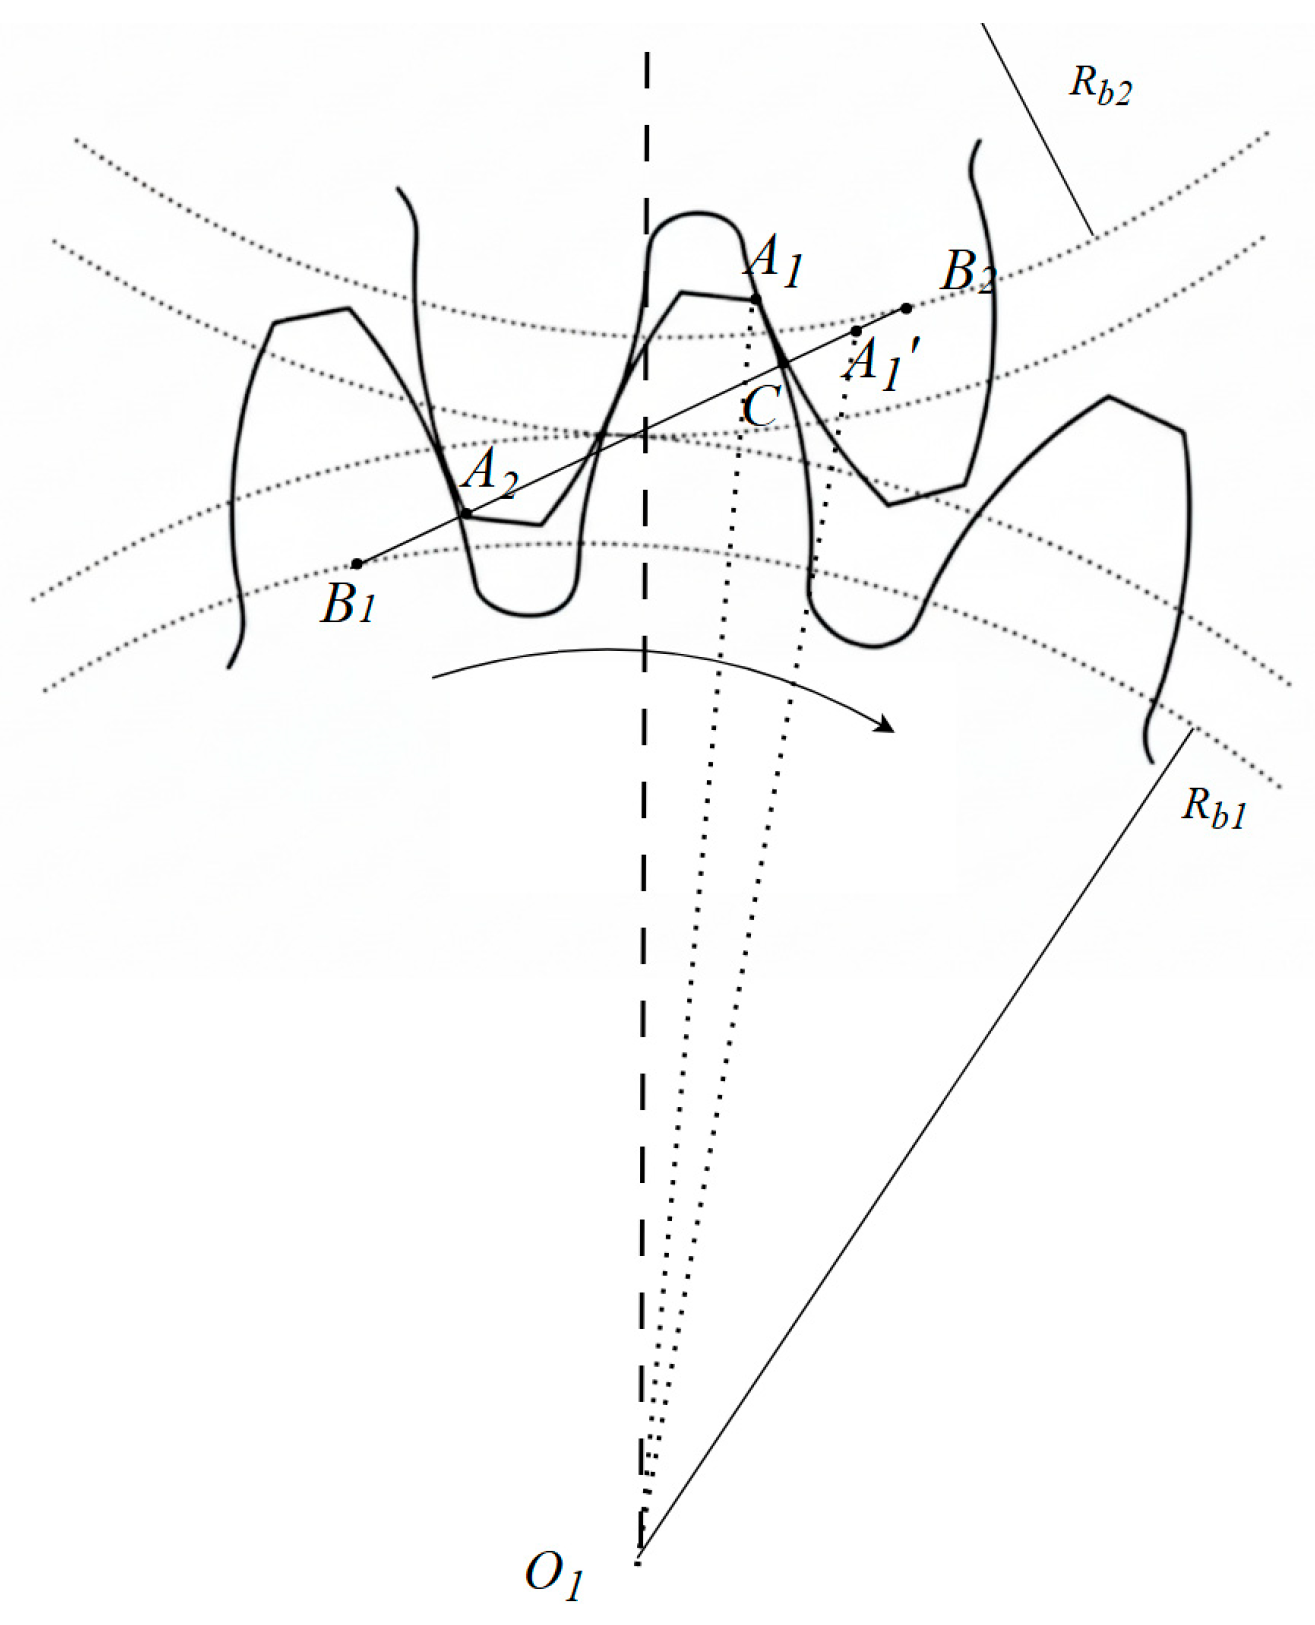
The gear meshing process is illustrated in the schematic diagram of Figure 4.
At the initial position, corresponding to point A2, the contact point for the second pair of mating teeth is at C. At this position, the angular displacements of the two meshing gears, θ and θ , are both zero. As the angular displacement increases, the contact point moves from point C to point A1. Correspondingly, point A1’ on the pinion moves to A1. The angle ∠A1’O1A1 is equal to the sustained angular displacement, defined as θ d . Therefore, throughout the entire angular displacement θ d , two pairs of teeth are always in mesh simultaneously. After passing point A1, the second pair of mating teeth disengages, marking the start of the single-tooth-pair meshing phase. This continues until the angular displacement reaches θ = 2 π / Z 1 , at which point the system returns to a state similar to the initial position. This corresponding angular displacement is defined as θ s .
θ d = tan ( arccos N 1 cos α 0 N 1 + 2 ) π 2 Z 1 tan [ arccos Z 1 cos α 0 ( Z 2 + 2 ) 2 + ( Z 1 + Z 2 ) 2 2 ( Z 2 + 2 ) ( Z 1 + Z 2 ) cos ( arccos Z 2 cos α 0 Z 2 + 2 α 0 ) ]
θ s = 2 π Z 1 θ d
Thus, based on Equation (25), when there are two tooth pairs meshing, the range of the angular displacement can be expressed as:
θ [ ( n 1 ) 2 π Z 1 , θ d + ( n 1 ) 2 π Z 1 ] ( n = 1 , 2 , )
when there is single tooth pair meshing, the range of the angular displacement can be expressed as:
θ [ ( n 1 ) 2 π Z 1 + θ d , ( n 1 ) 2 π Z 1 + ( θ d + θ s ) ] ( n = 1 , 2 , )
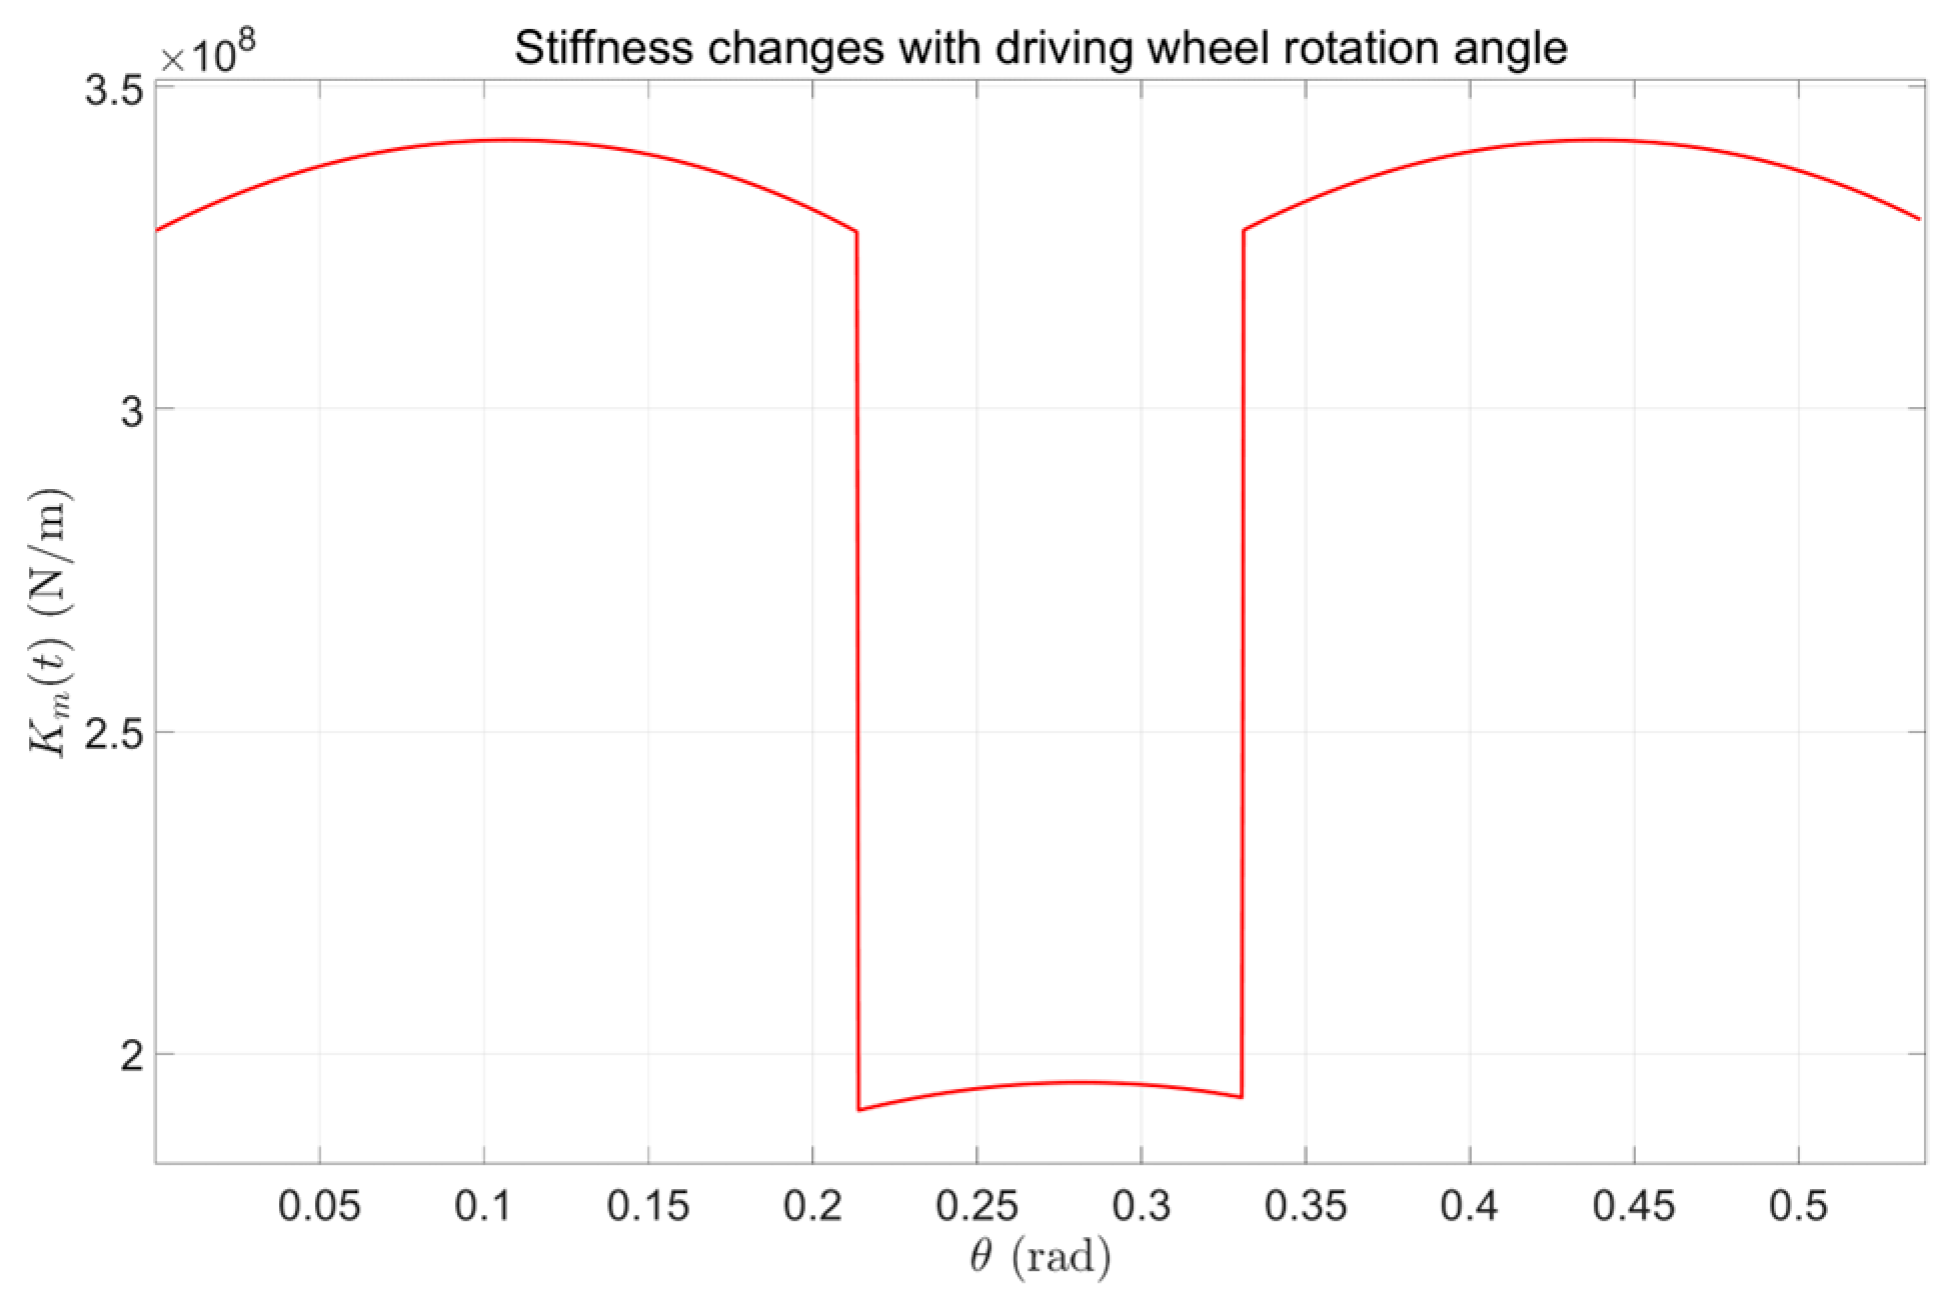
The time-varying mesh stiffness of the gears under normal conditions is shown in Figure 5, and the gear pair parameters are shown in Table 2.

3.2. Crack-Fault Gear Time-Varying Stiffness

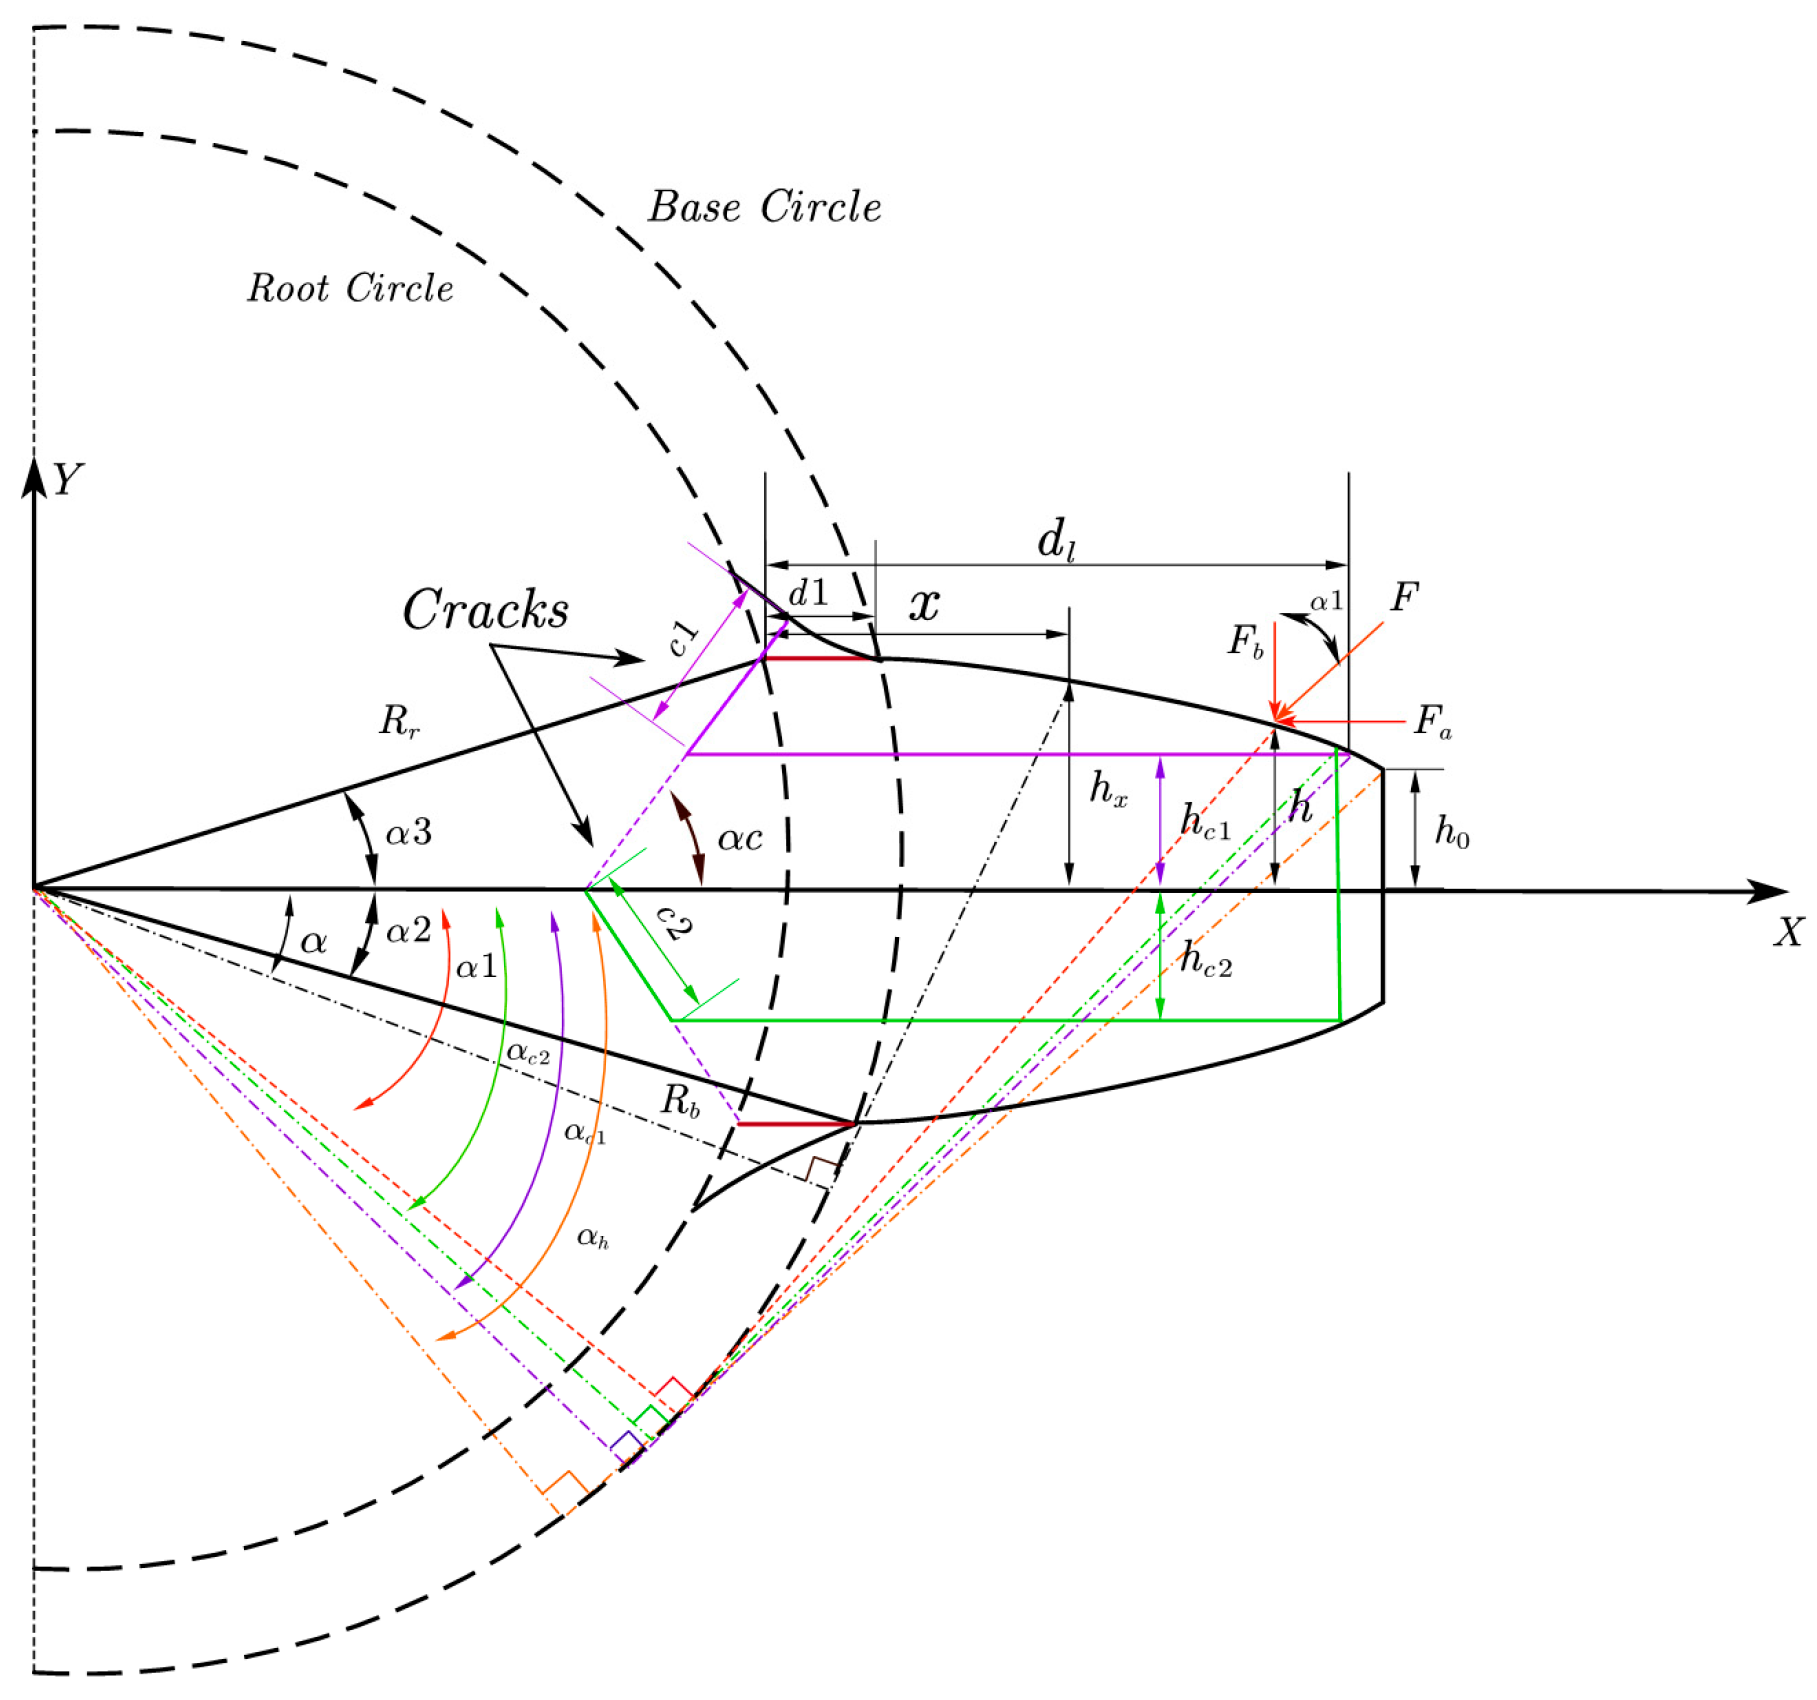
During gear transmission, prolonged operation or high-speed conditions can induce concentrated stress at the tooth root, leading to crack initiation. In this study, the crack is modeled as a straight-line defect with a 45° inclination angle to analyze its depth-dependent effects on time-varying mesh stiffness, with derived analytical expressions provided. The gear model with crack failure is illustrated in Figure 6.
In Figure 6, h c 1 , h c 2 are the Straight-line distances from the crack front faces to the gear centerline during crack propagation, with rotation angles denoted as α c 1 and α c 2 , respectively. h 0 is the semi-tooth thickness at the tooth tip, α h is the rotation angle corresponding to the tooth tip point. α c is the crack inclination angle, c 1 , c 2 are the crack lengths above and below the tooth centerline. d 1 is the Straight-line substitution length of the fillet radius between the root circle and base circle. d l is the distance from the intersection point of the crack tip horizontal line with the tooth profile to the root circle.
The main difference between the crack stiffness formula and the normal time-varying stiffness formula is the effect of the crack on gear teeth A x and I x . Therefore, the formulas are classified and discussed according to different depths [24,25].
Case 1: h c 1 h 0 and α > α c 1
Under this condition where the crack depth is relatively shallow, A x and I x can be expressed as:
I x = 1 12 ( h c 1 + h x ) 3 L , 1 12 ( 2 h x ) 3 L , x d l x > d l
A x = ( h c 1 + h x ) L , 2 h x L , x d l x > d l
h c 1 = R b sin α 2 c 1 sin α c
When the cross-section x lies outside the cracked region, substituting Equations (29) and (30) into (5) and (6) yields the solutions for k b and k s .
Case 2: h c 1 h 0 and α < α c 1 or h c 1 < h 0
At this stage, the crack propagates further but has not yet reached the tooth centerline, with cross-section x located within the cracked region. A x , I x are expressed as:
I x = 1 12 ( h c 1 + h x ) 3 L
A x = ( h c 1 + h x ) L
Substituting Equations (32) and (33) into (5) and (6) yields the solutions for k b , k s .
Case 3: h c 2 < h 0 or α < α c 2 and h c 2 > h 0
At this stage, the crack has initially extended beyond the tooth centerline.
Case 4: h c 2 > h 0 and α > α c 2
In this scenario where the crack depth reaches its maximum (approaching tooth breakage), parameters A x and I x approach their minimum values. For both Case 3 and Case 4 where cross-section x remains within the cracked region, the solutions can uniformly be expressed in terms of A x and I x as:
I x = 1 12 ( h x h c 2 ) 3 L
A x = ( h x h c 2 ) L
h c 2 = c 2 sin α c
Substituting Equations(34)–(36) into (5) and (6) yields the solutions for k b , k s :
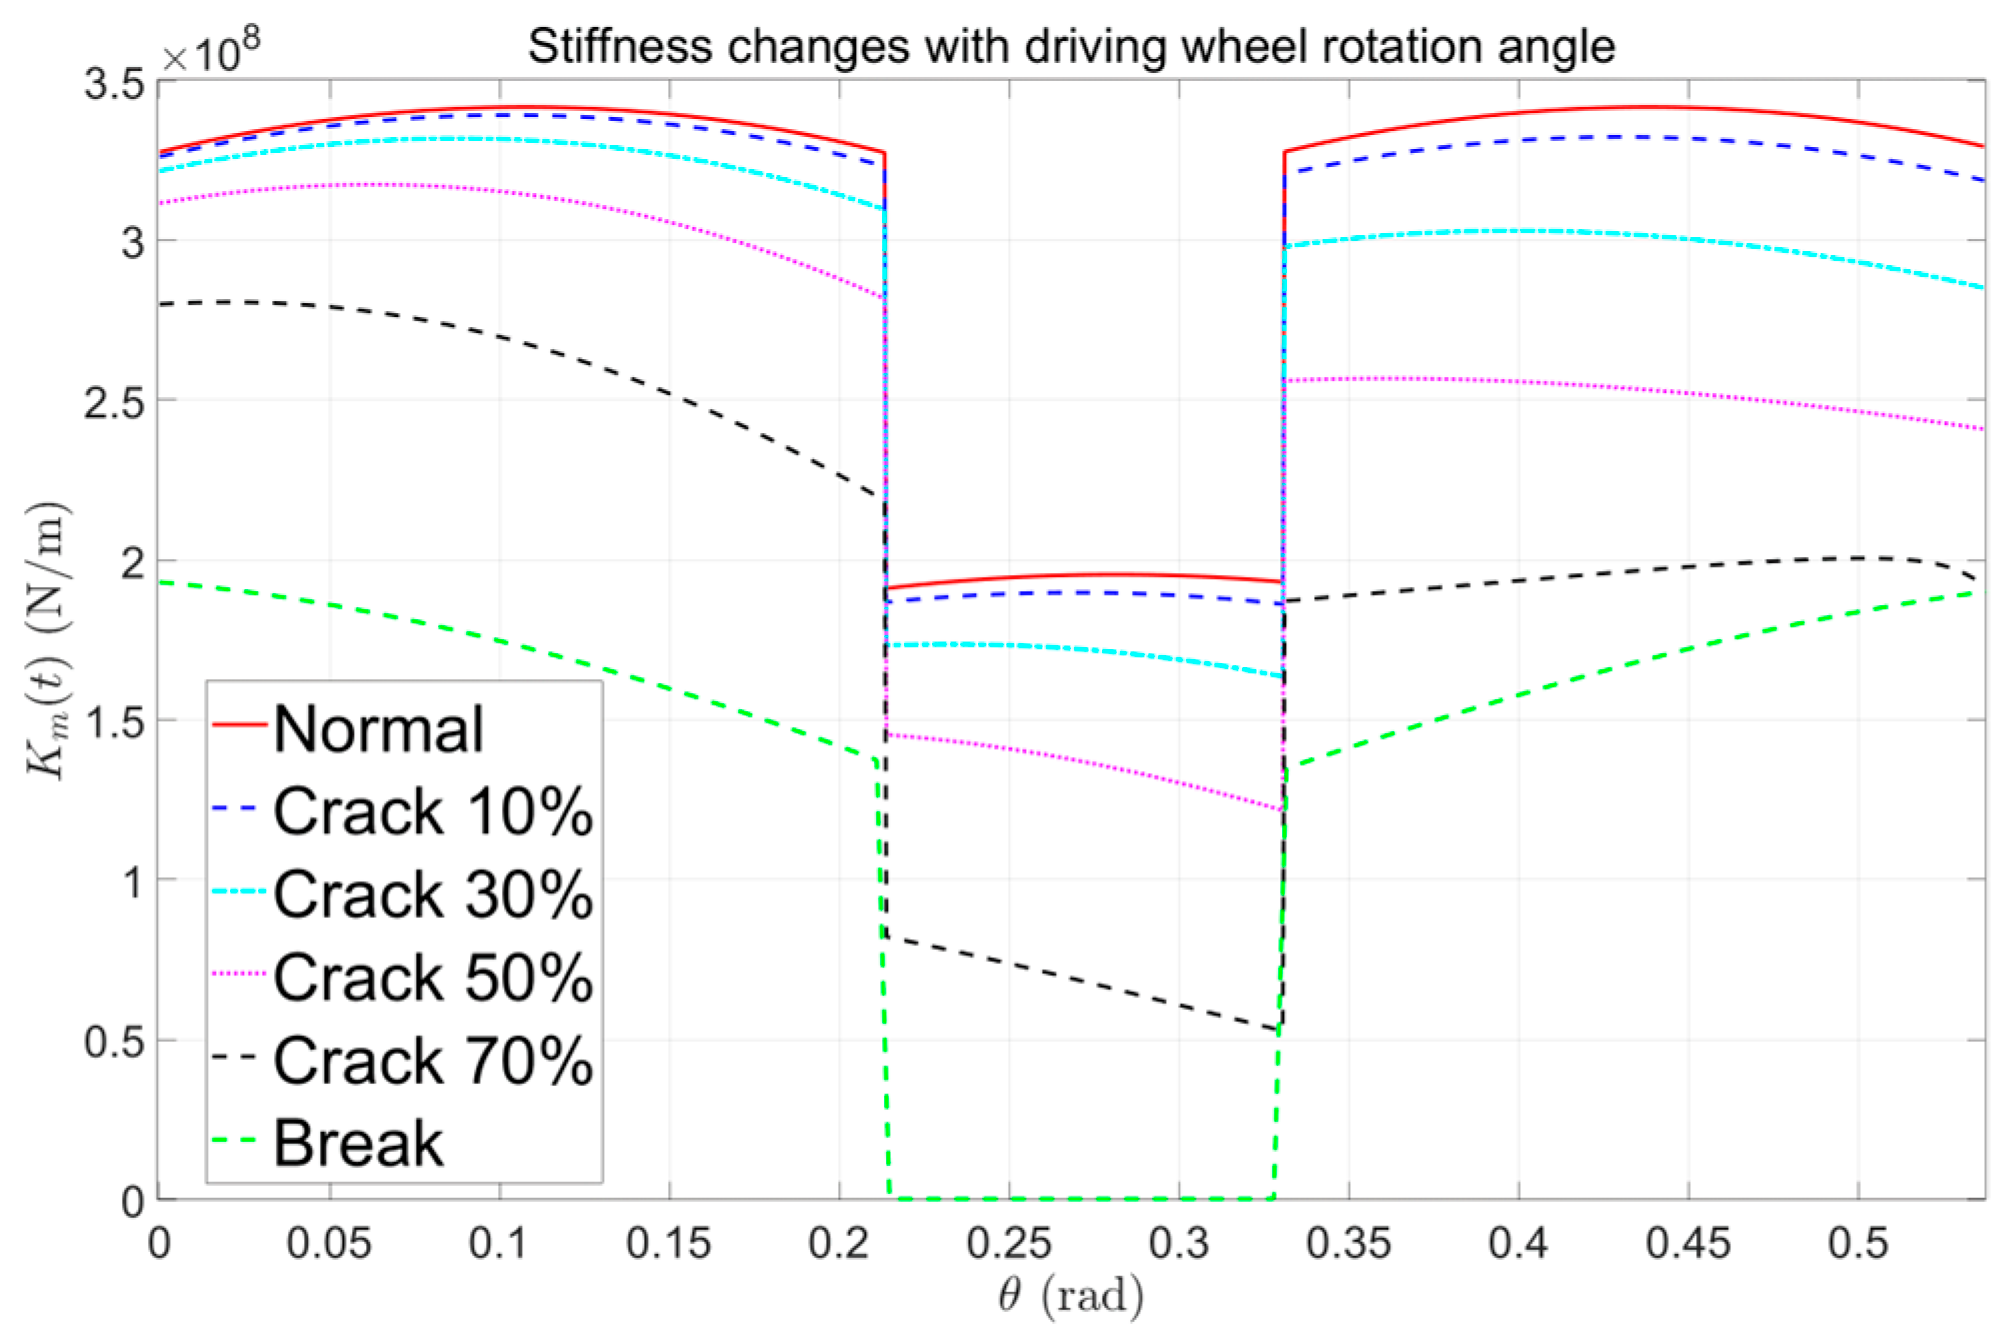
The time-varying mesh stiffness of gears at different crack depths is shown in Figure 7. Four different degrees of cracks were selected in Table 3:
When the crack reaches 100%, the gear is considered to have a broken tooth, and the meshing stiffness calculation formula at this stage is:
k t bro k e n = 1 k h , 1 + 1 k b 1 , 1 + 1 k s 1 , 1 + 1 k f 1 , 1 + 1 k a 1 , 1 + 1 k b 2 , 1 + 1 k s 2 , 1 + 1 k f 2 , 1 + 1 k a 2 , 1

3.3. Pitting-Fault Gear Time-Varying Stiffness

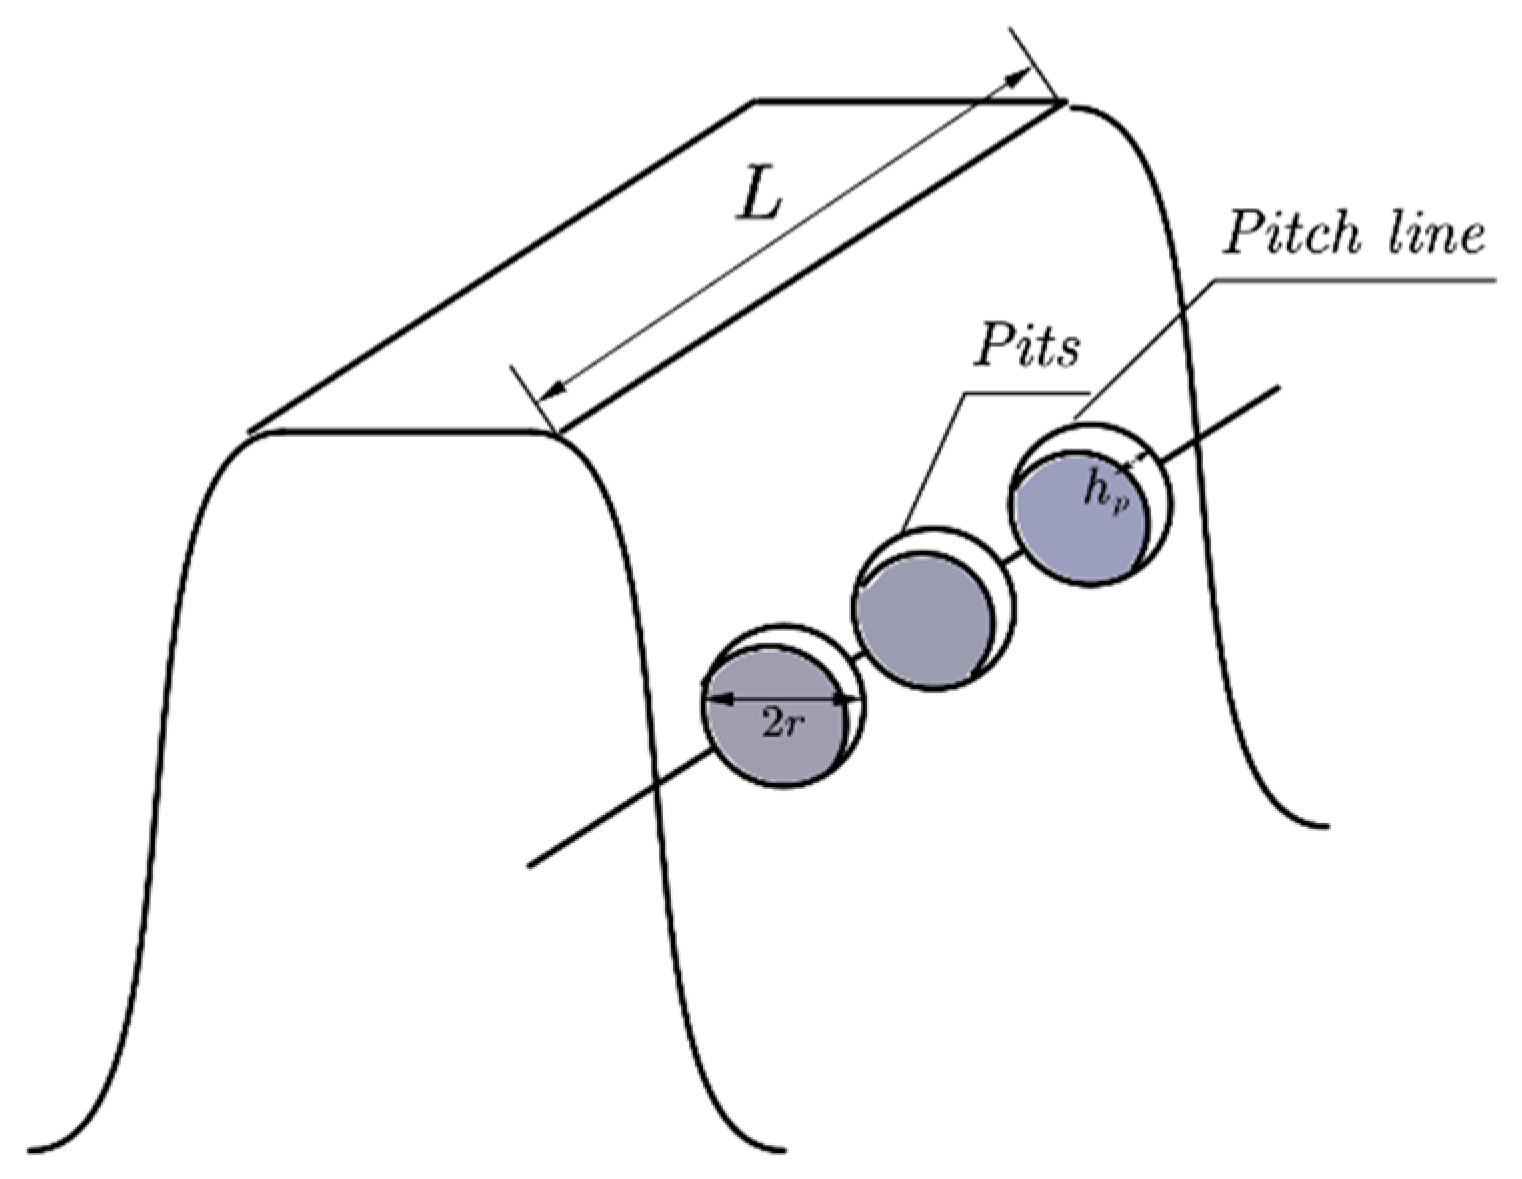
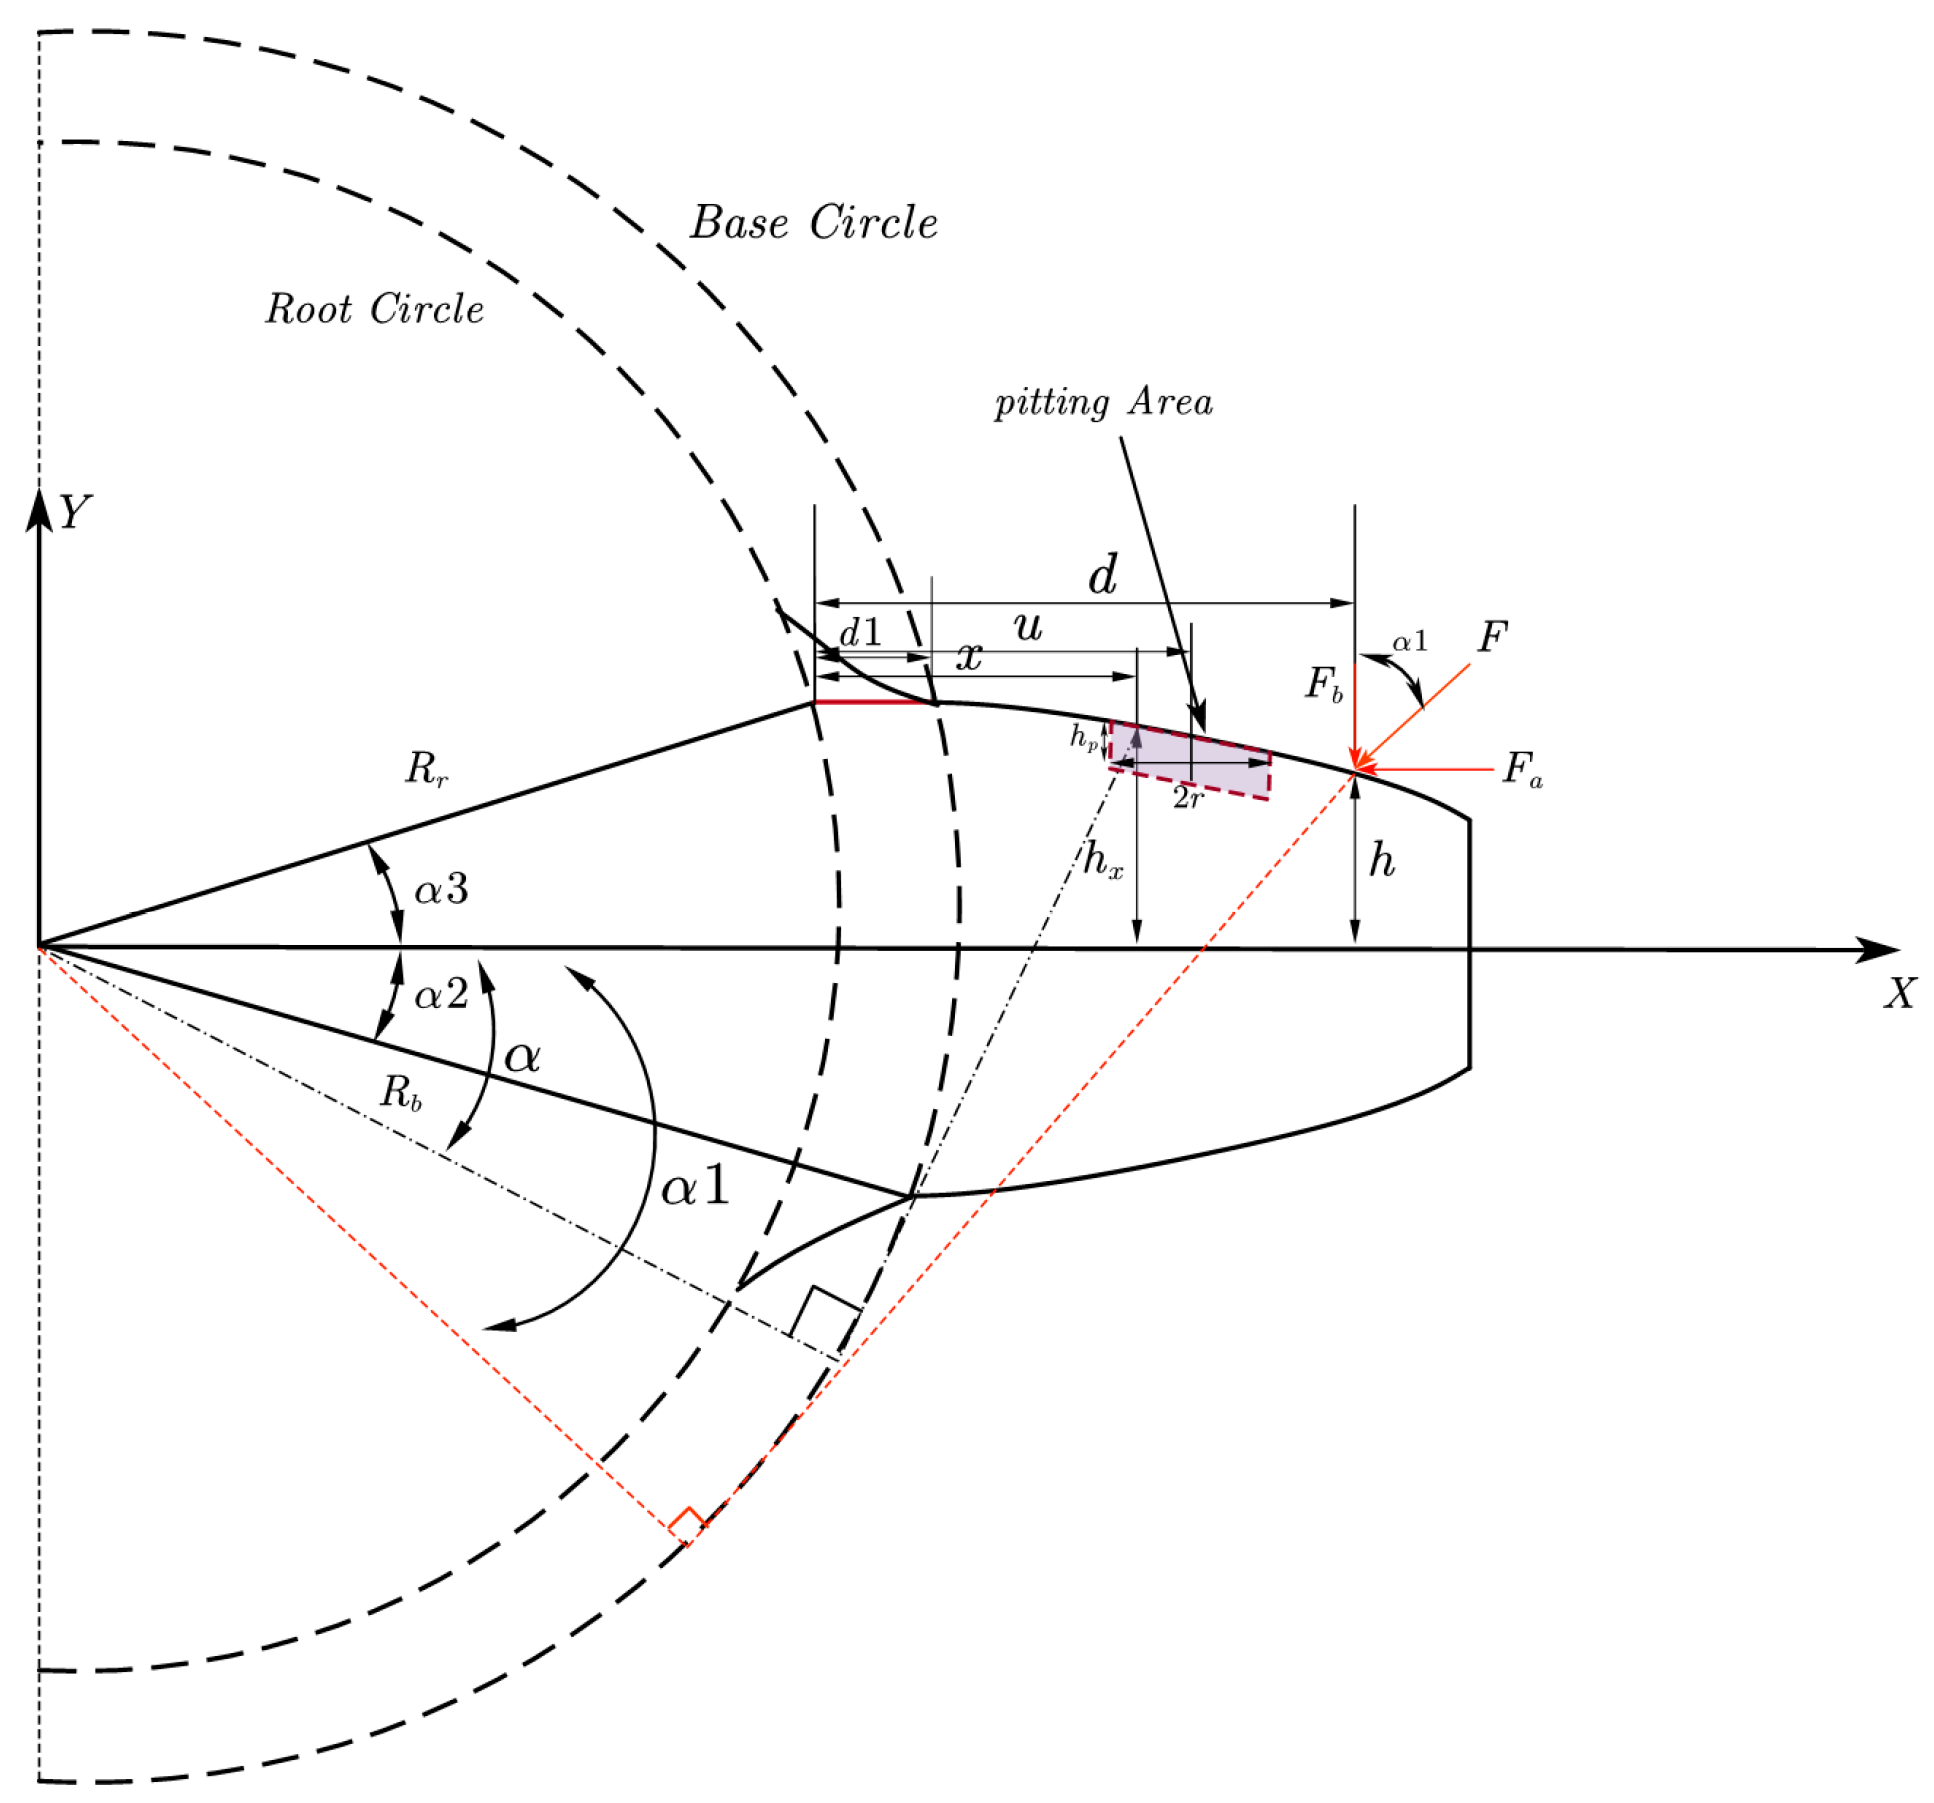
During gear transmission, insufficient lubrication or excessive stress often leads to tooth fatigue damage, where the tooth surface gradually deteriorates into pitting. This study adopts a circular pitting model to simulate gear pitting faults, as illustrated in Figure 8. The gear model with pitting failure is shown in Figure 9 [26].
Surface pitting induces material spalling, progressively reducing the effective load-bearing geometry: Cross-sectional area A x , Tooth width L , Moment of inertia I x . Where Δ A x , Δ L and Δ I x are the pitting-induced reductions [27].
Δ L x = 2 r 2 ( u x ) 2 , 0 , x [ u r , u + r ] e l s e
Δ A x = Δ L x h p , 0 , x [ u r , u + r ] e l s e
Δ I x = 1 12 Δ L x h p 3 + A x Δ A x ( h x h p / 2 ) 2 A x Δ A x , 0 , x [ u r , u + r ] e l s e
h p is the pitting depth, r is the Pitting radius, u is the distance from the pitting center to the tooth root.
After pitting effects, the updated geometric parameters of the gear tooth are defined as:
L ¯ = L Δ L x
A ¯ x = A x Δ A x
I ¯ x = I x Δ I x
By substituting Equations (41–43) into Equations (5)–(7), we derive the solutions for parameters k b , k s and k a .
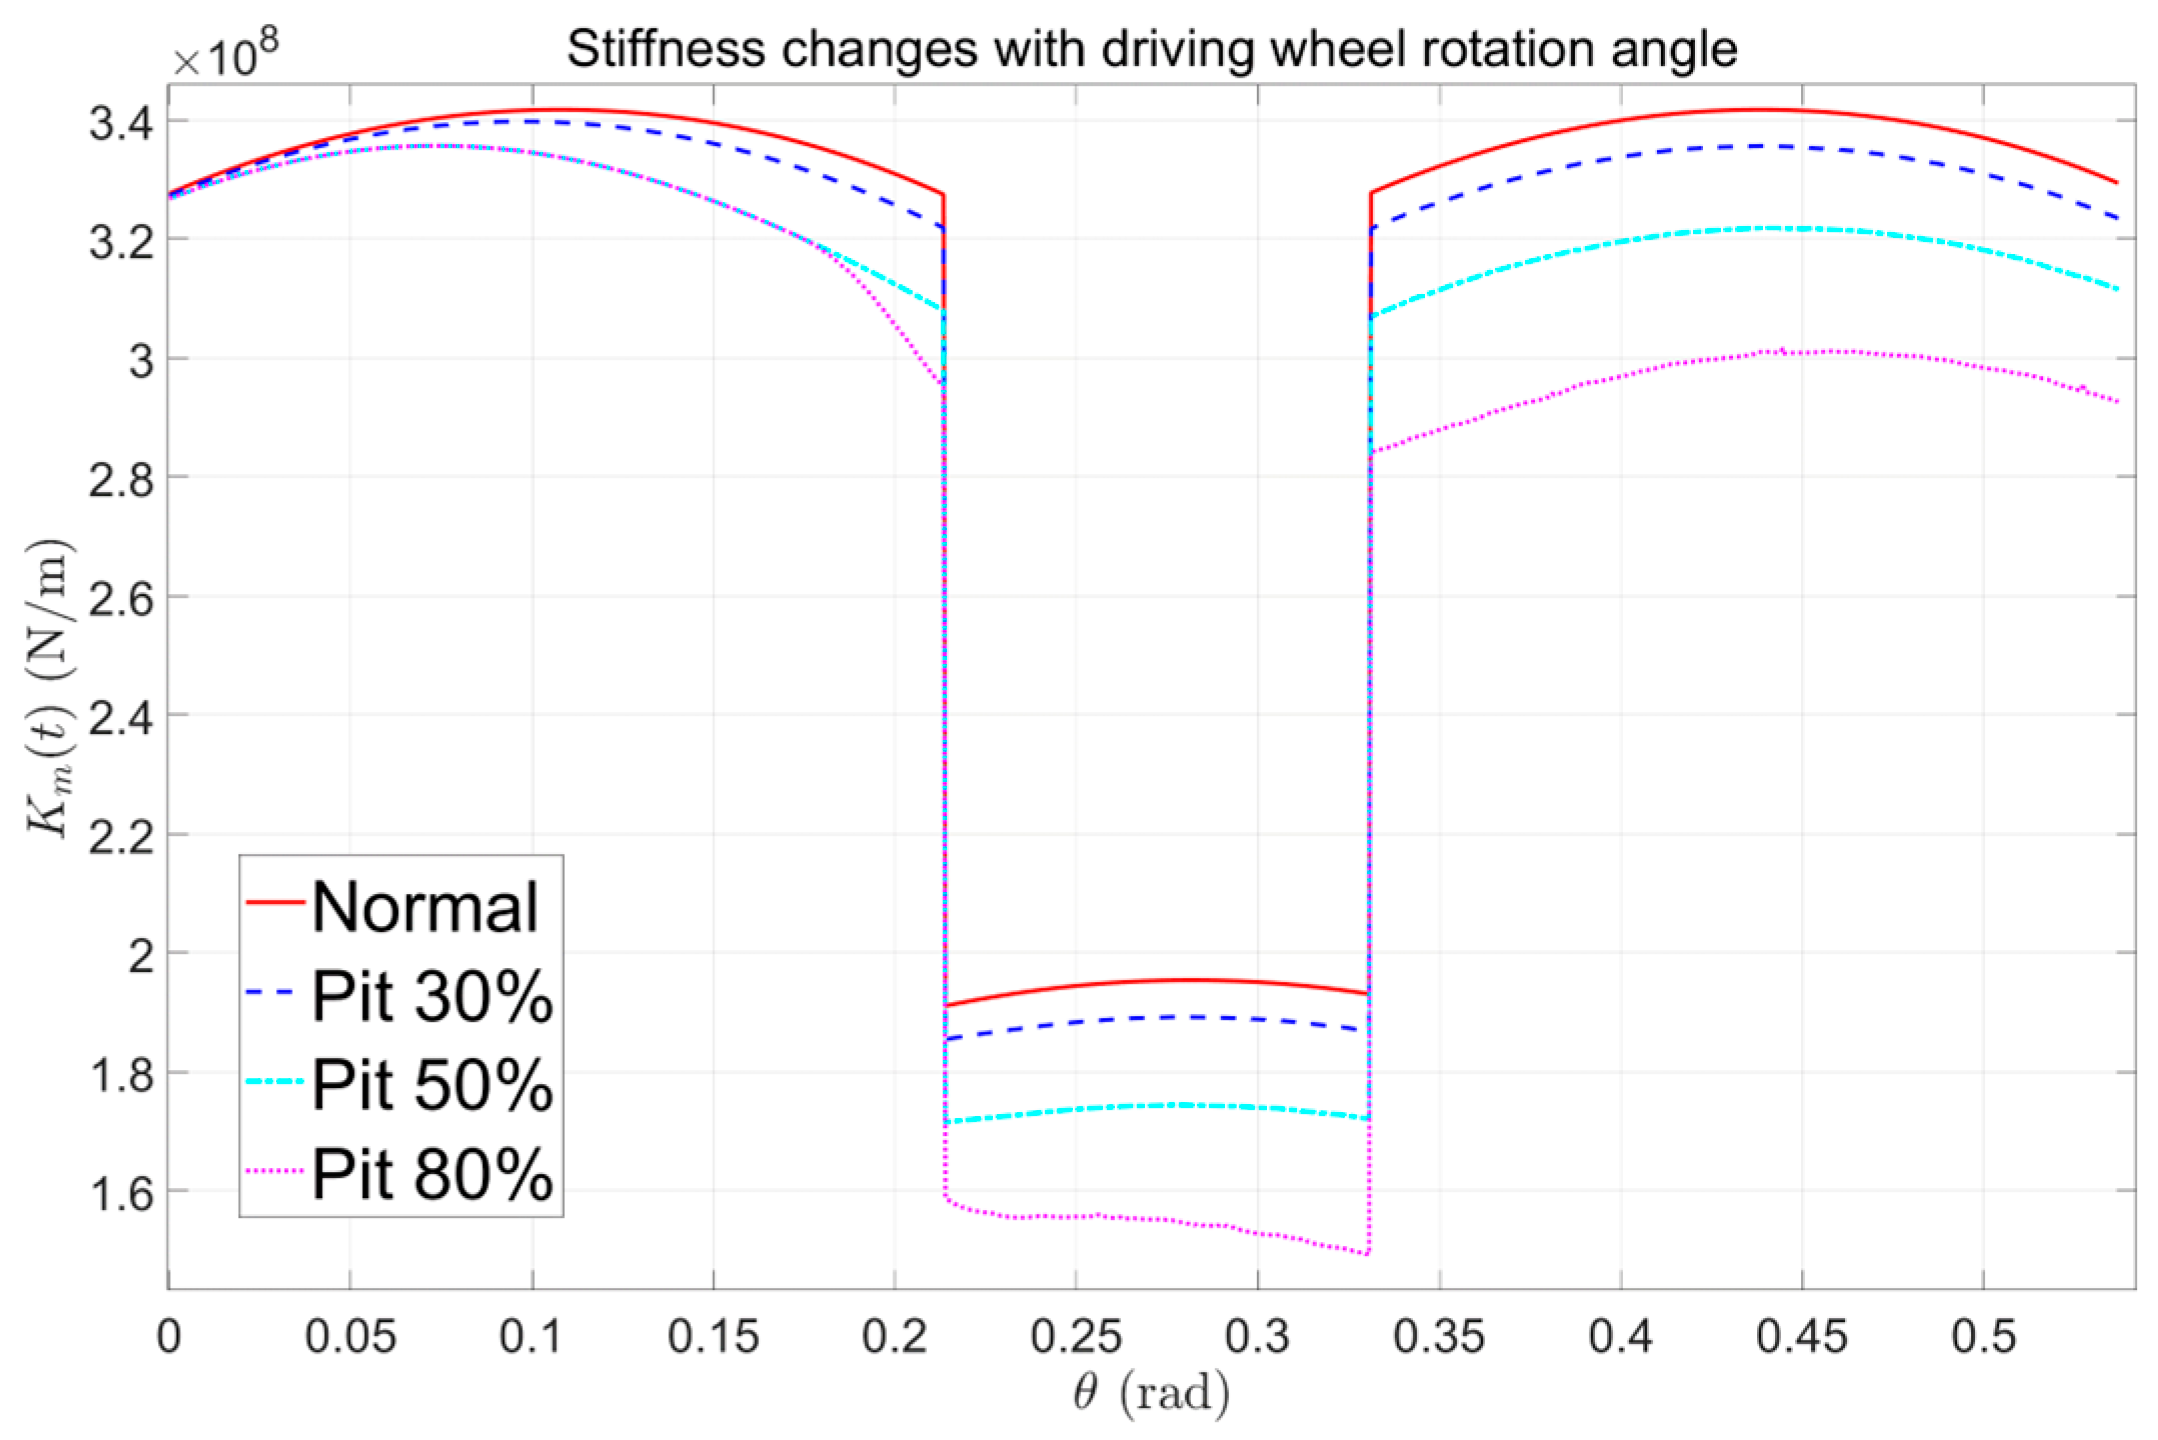
Figure 10 illustrates the time-varying mesh stiffness under different pitting severity levels, with four distinct pitting degrees:
30% ( r 1 = 0.001 , h p = 0.005 , N 1 = 4 ),
50% ( r 1 = 0.001 , h p = 0.005 , N 1 = 7 ),
80% ( r 1 = 0.001 , h p 1 = 0.005 , N 1 = 7 r 2 = 0.001 , h p 2 = 0.005 , N 2 = 5 , the secondary pitting damage was located at a 1.5 mm radial offset from the pitch circle toward the tooth tip).

4. Simulation Data Analysis and Fault Diagnosis

4.1. Calculation and Analysis of Transmission Error and Gear Vibration Signal of the Gear System

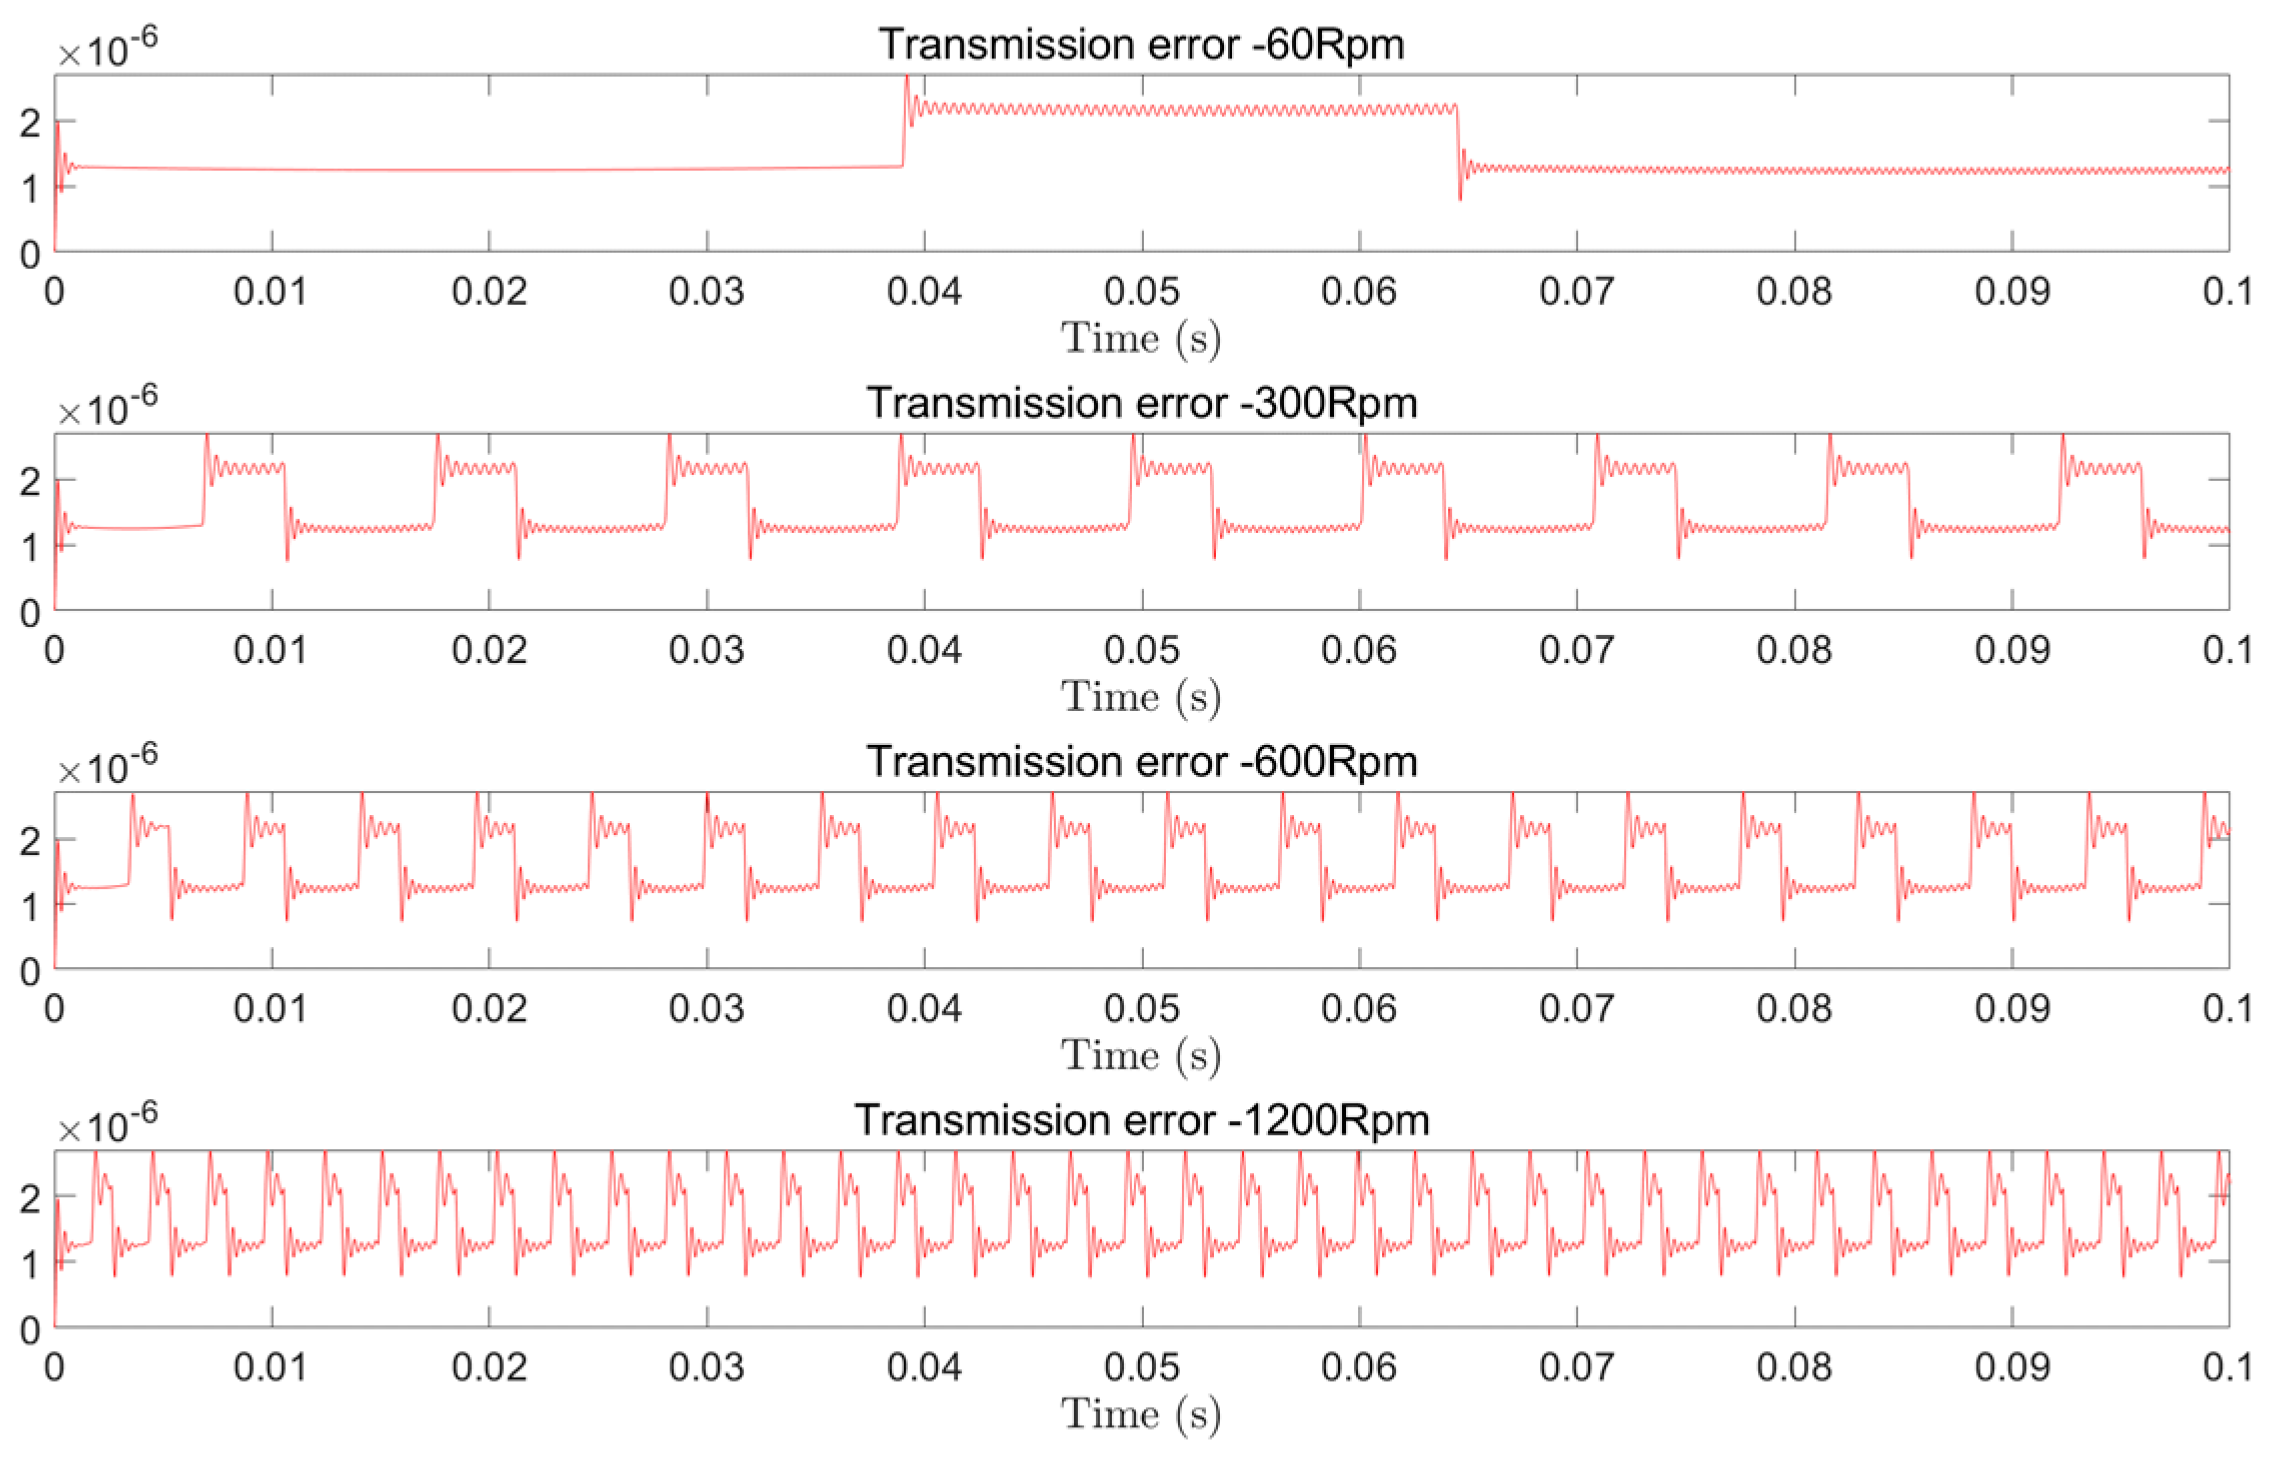
We now incorporate the time-varying mesh stiffness formulas for healthy, cracked, and pitted gears derived in Section 3 into the gear dynamics model presented in Section 2. The resulting transmission error for healthy teeth under rotational speeds of 60, 300, 600, and 1200 RPM is shown in Figure 11.
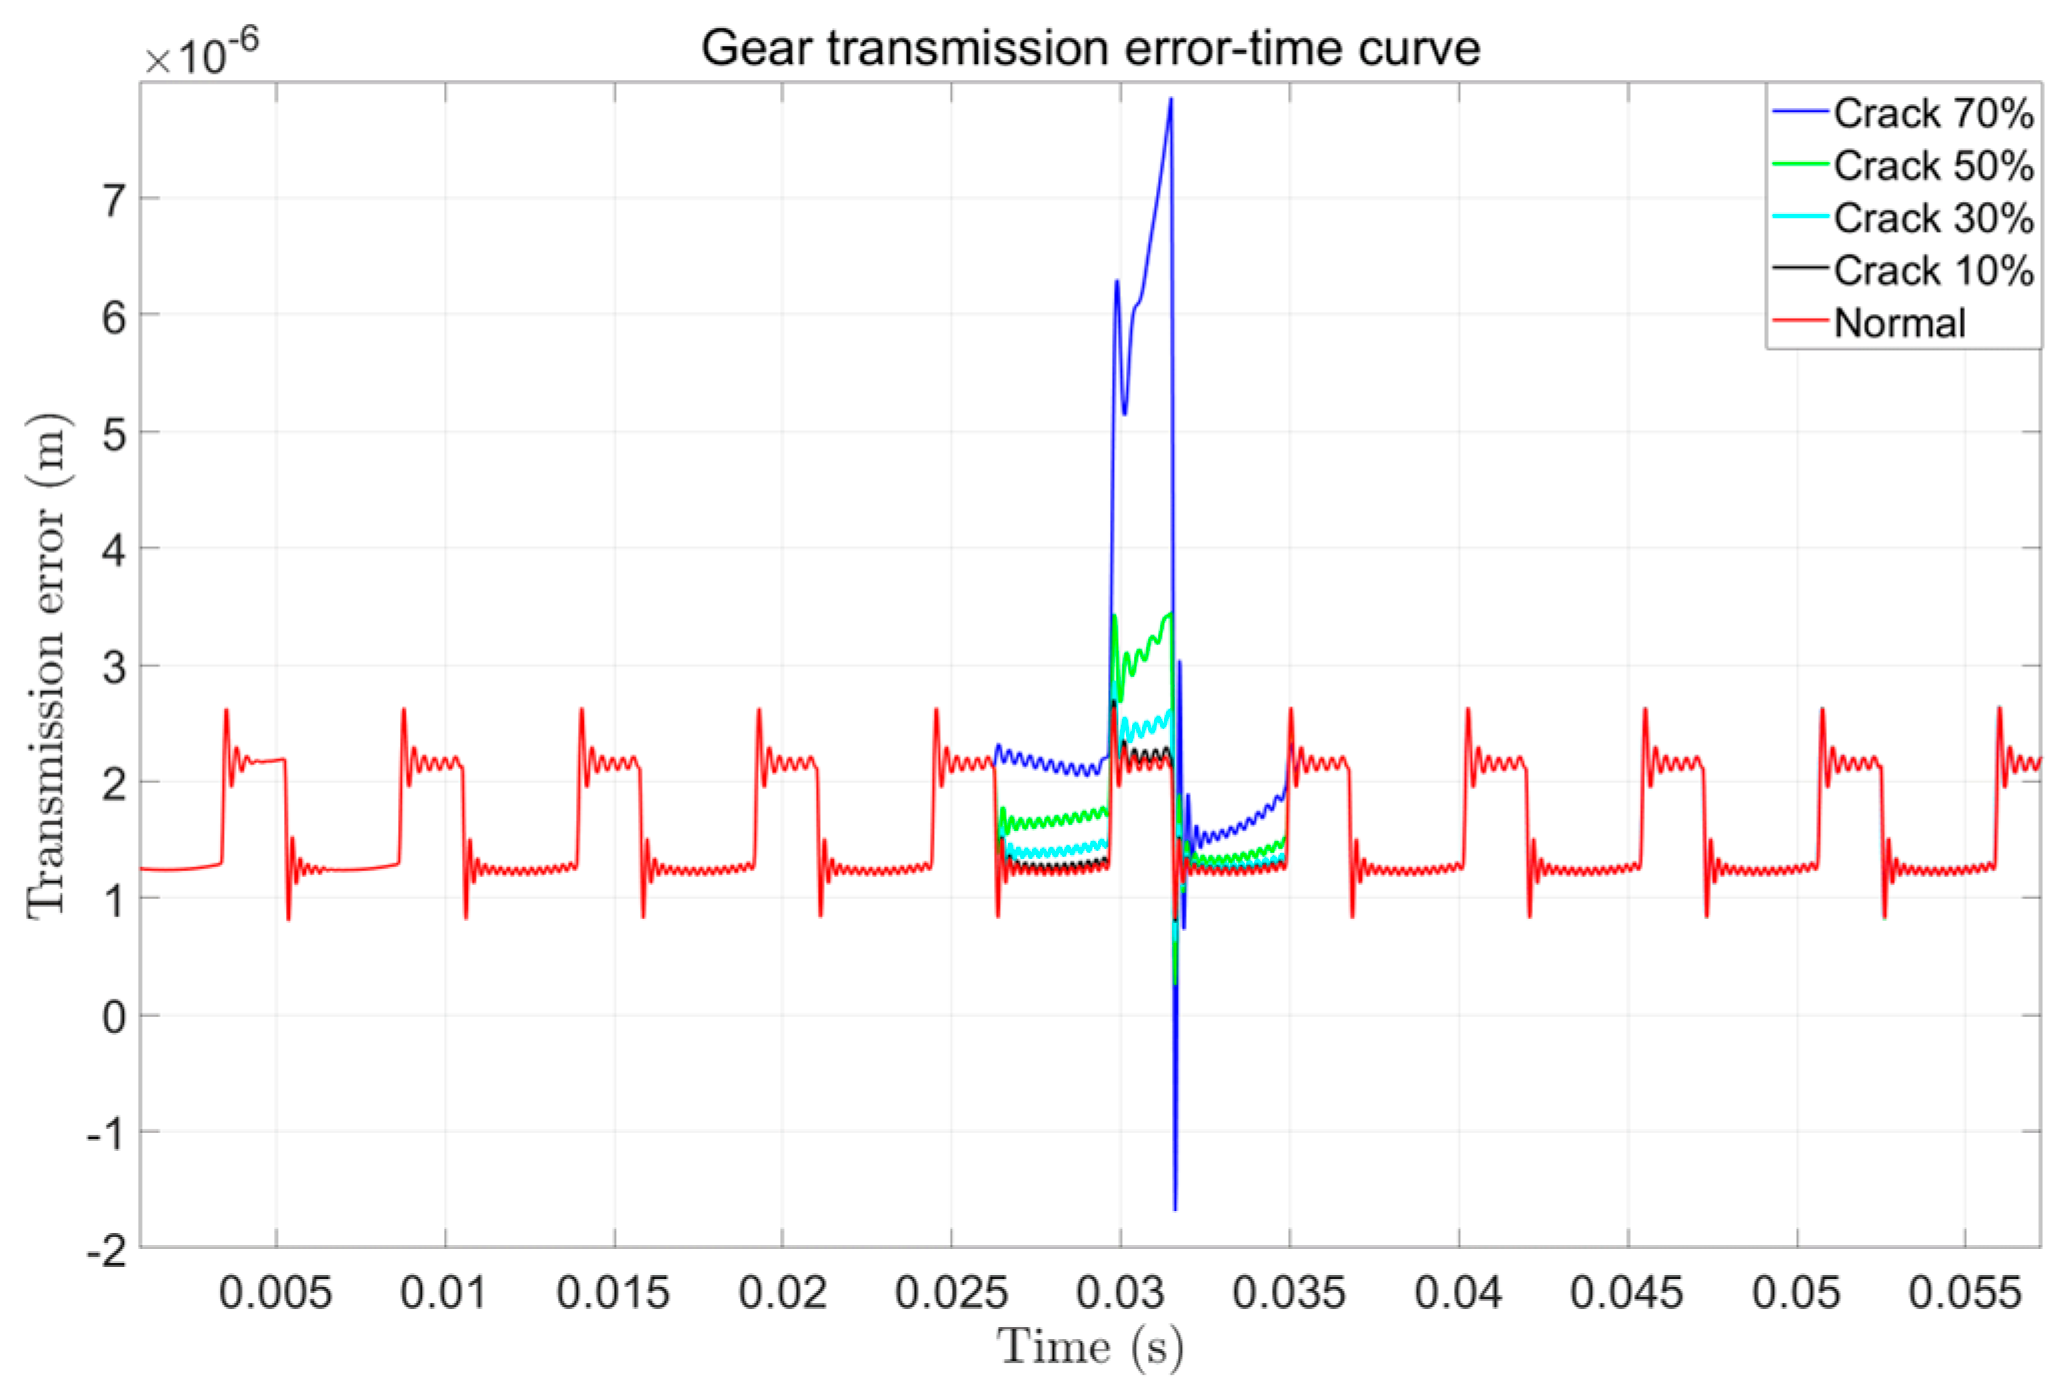
The simulated transmission error signal of healthy gears under noise-free conditions exhibits smooth and uniform characteristics without abnormal fluctuations. In contrast, faulted gears with varying crack severities show progressively amplified TE amplitudes as crack depth increases (Figure 12).
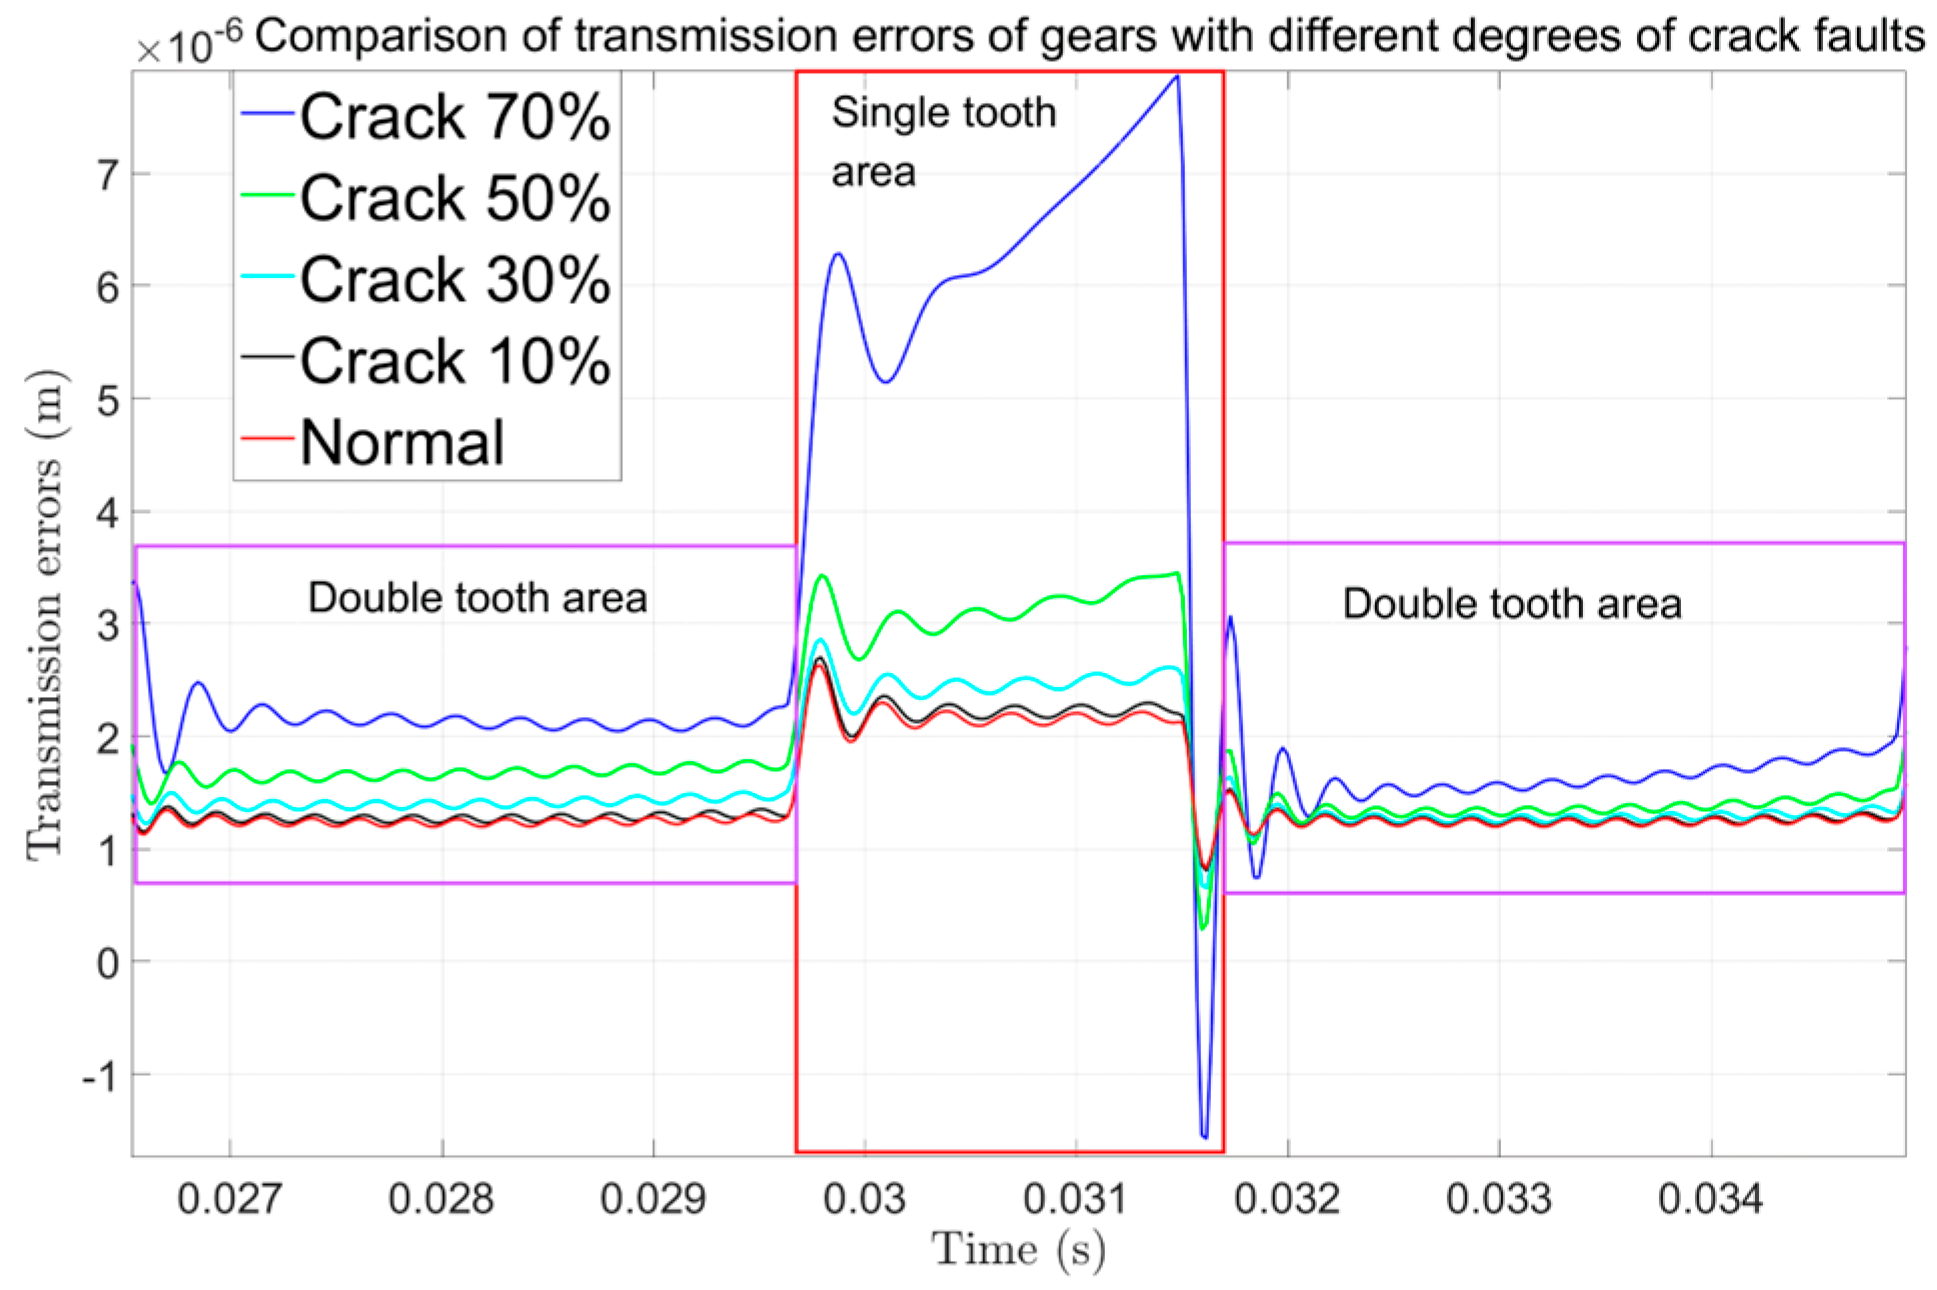
To elucidate these trends, the faulted TE curves are magnified and compared with the healthy baseline. Key observations include:
  • Amplitude Growth: The overall TE amplitude escalates with crack depth (Figure 13).
  • Single-Tooth Engagement Anomaly:
Healthy condition: Smooth curve during single-tooth engagement
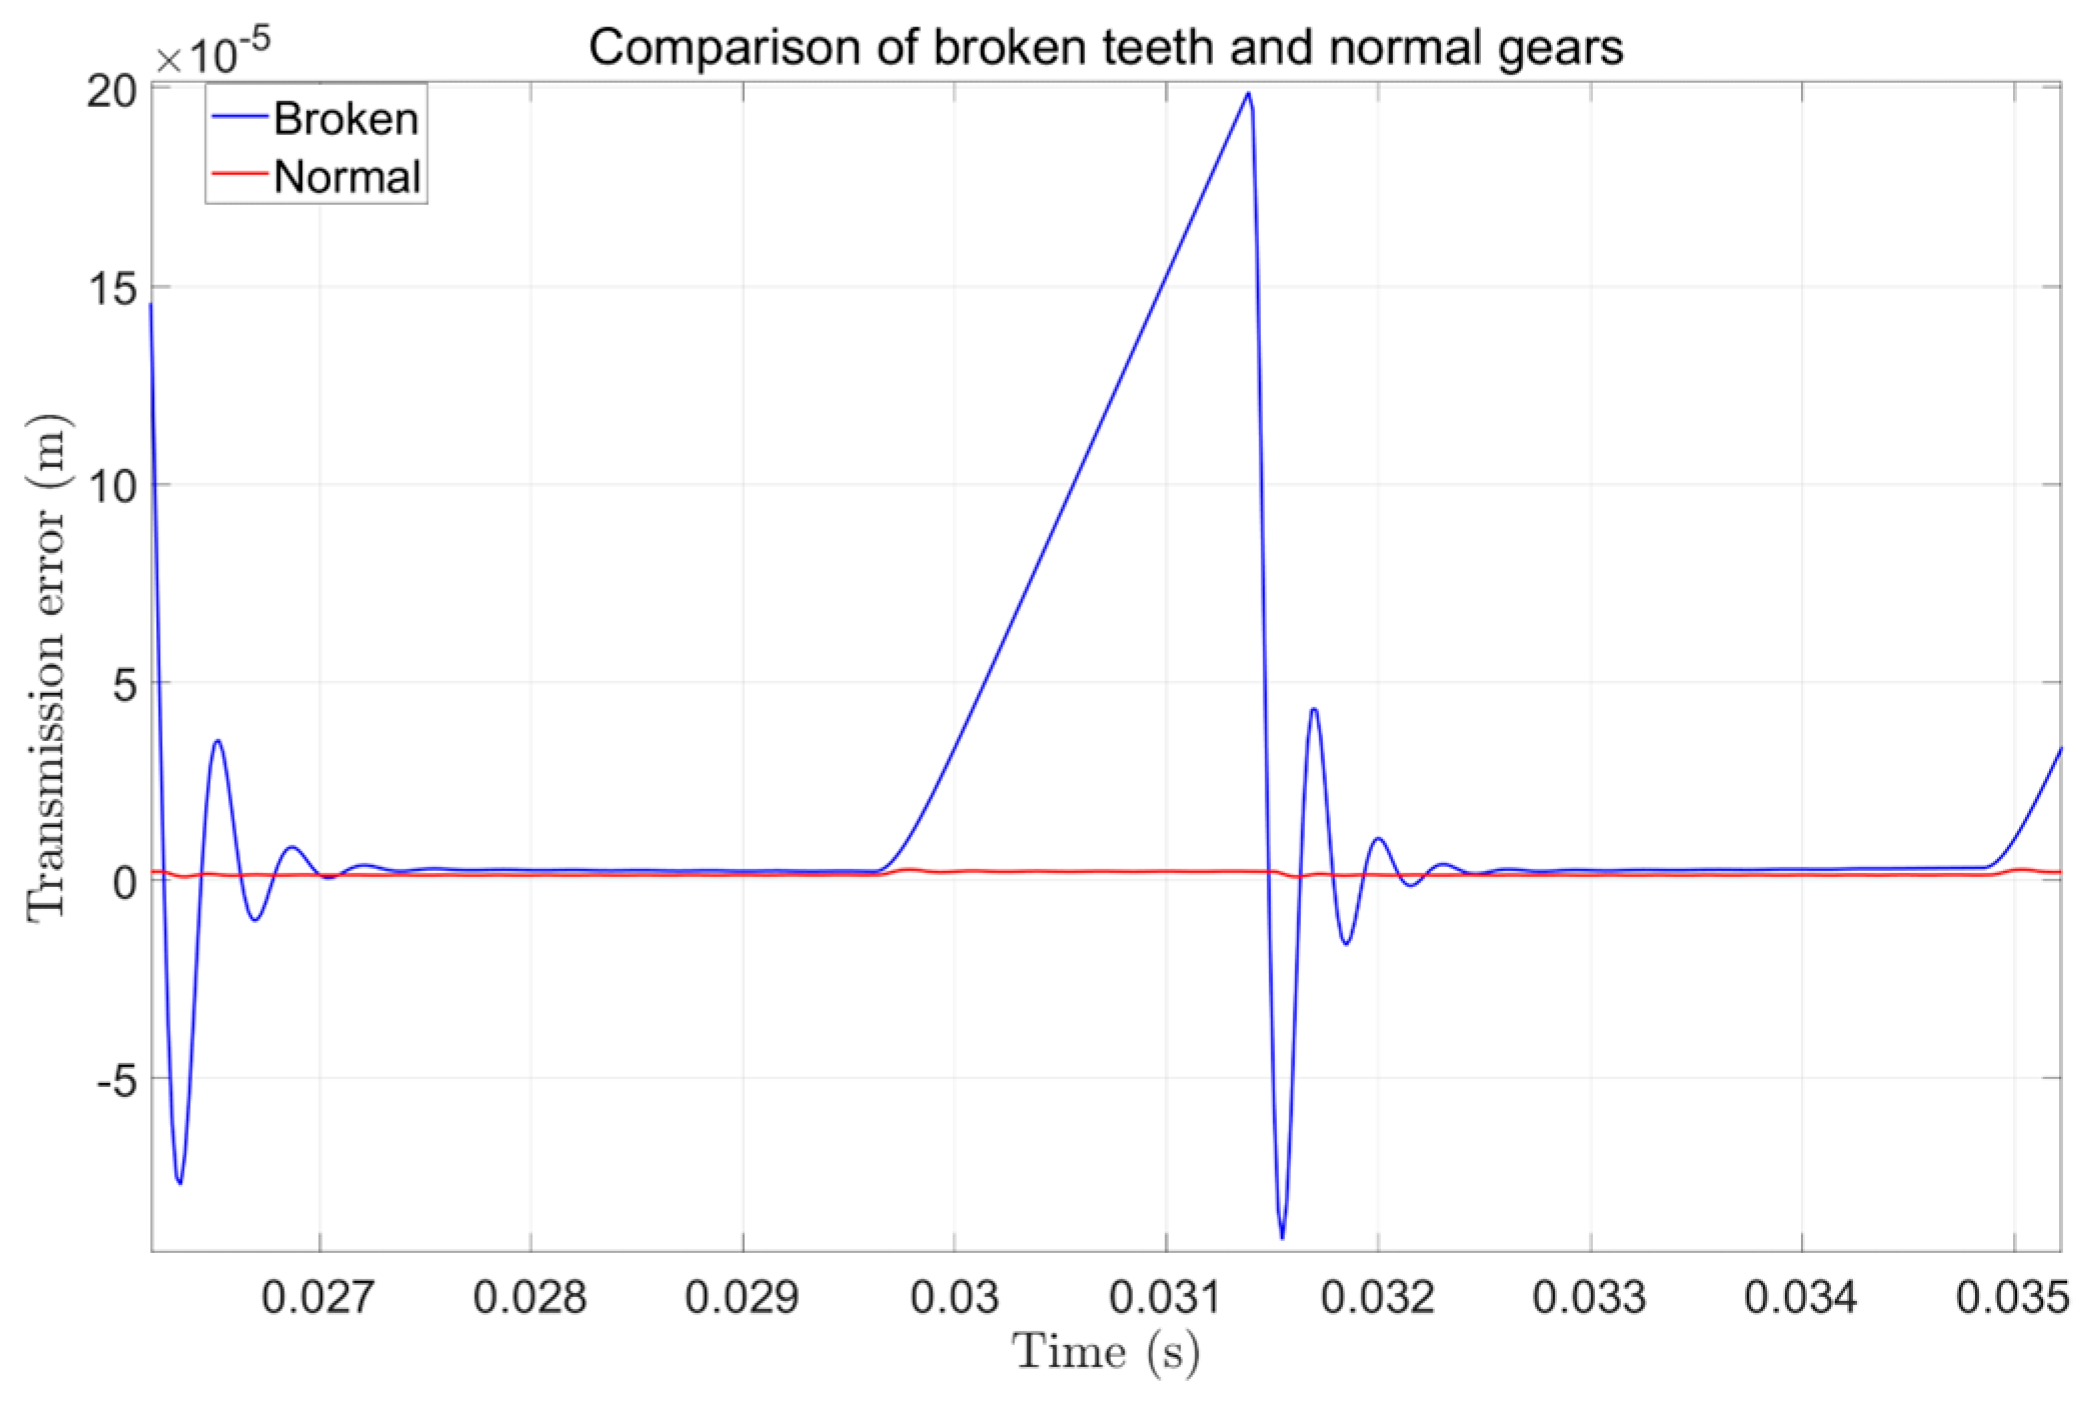
Cracked gears: Transition to linear growth patterns, with abruptness proportional to fault severity
3.
Tooth Breakage Limit Case: The TE amplitude peaks at maximum severity (tooth breakage), as demonstrated in Figure 14.
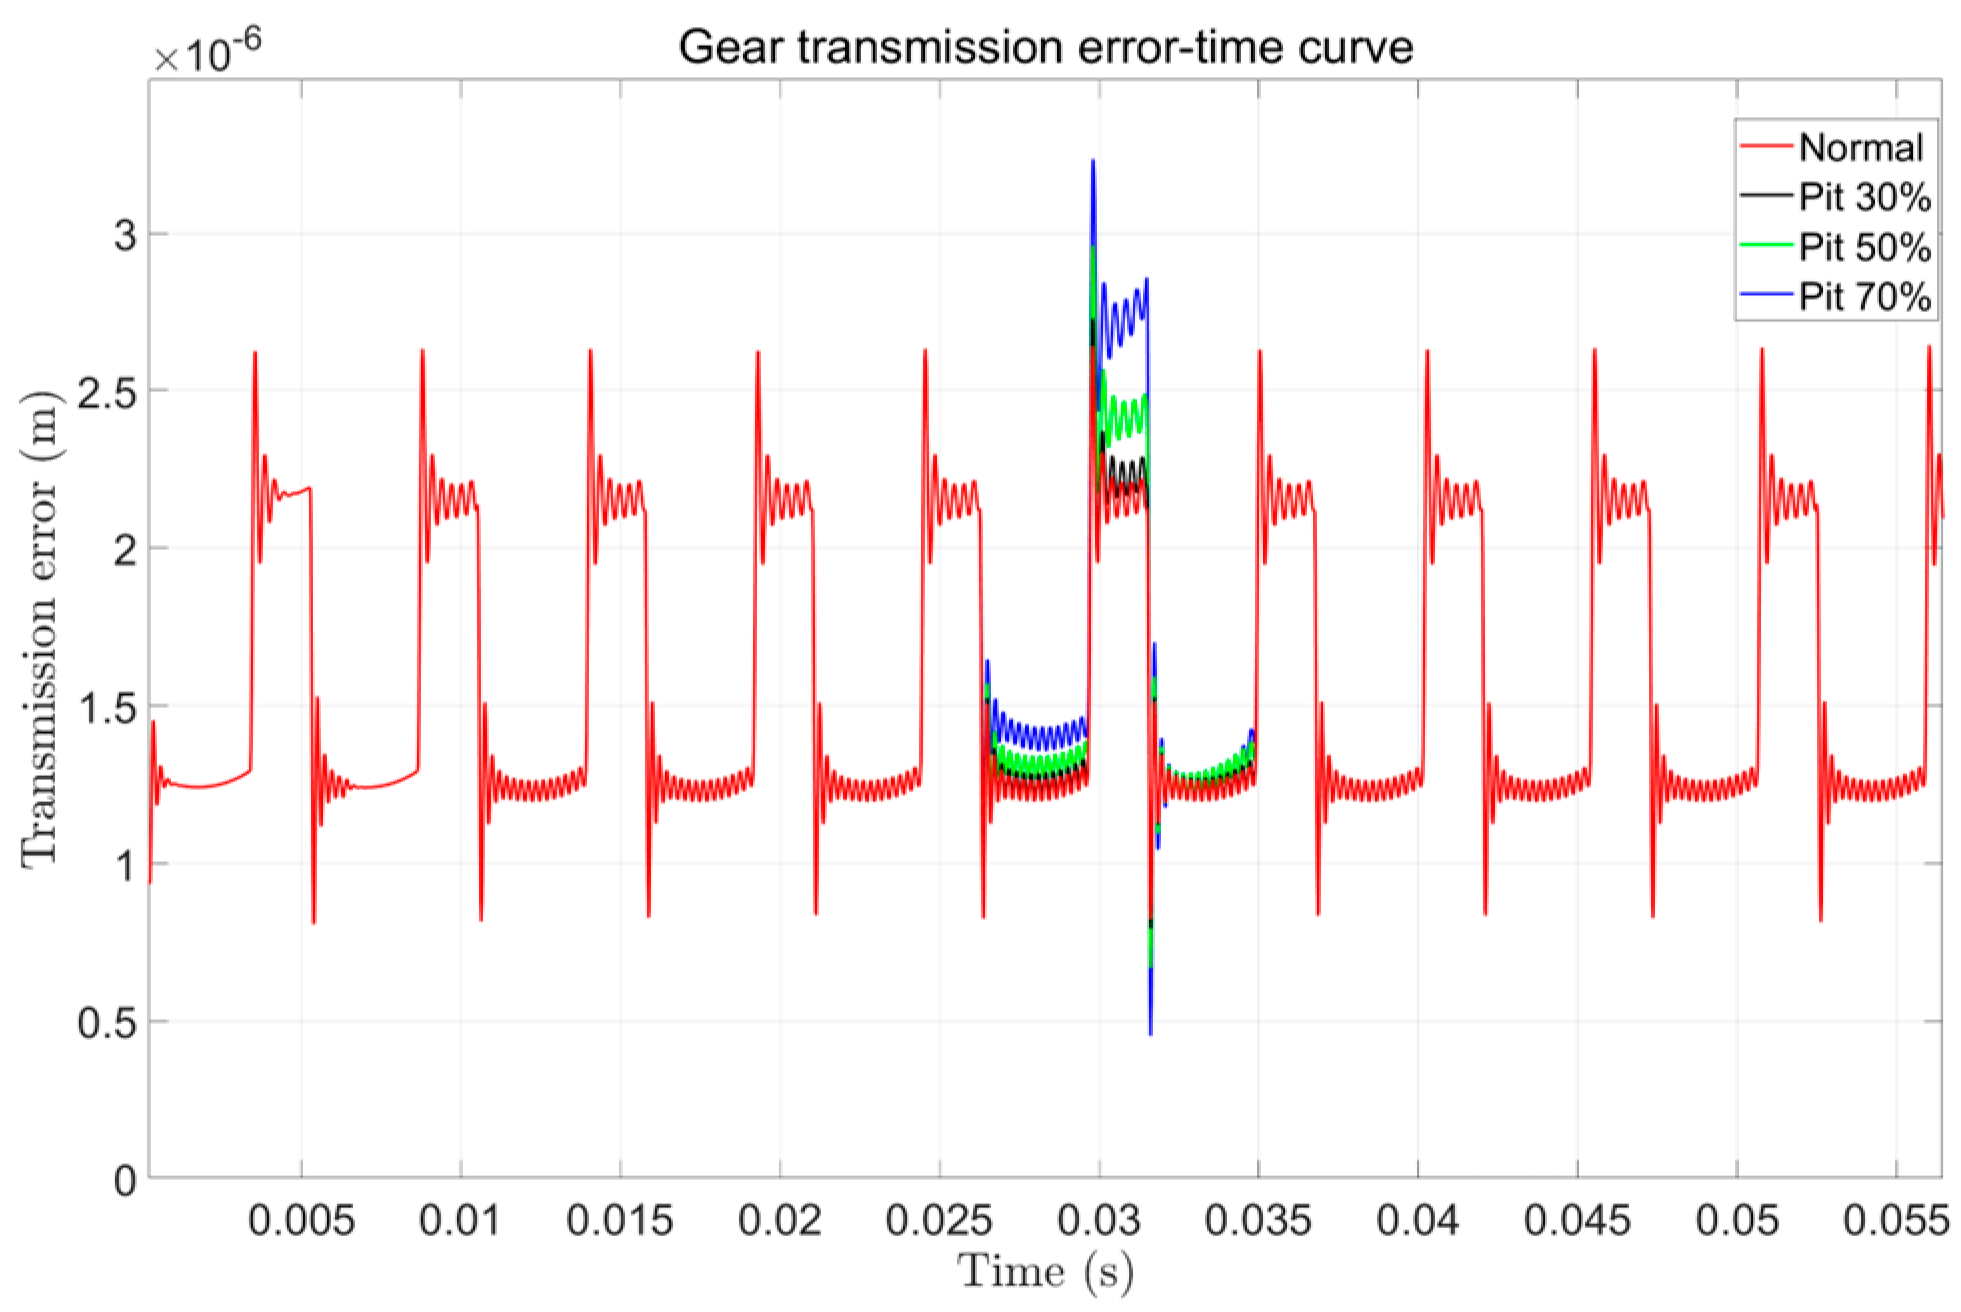
Compared to cracked gears, the transmission error amplitude in pitted gears also increases with pitting severity, though the effect is less pronounced. Since pitting primarily affects the tooth surface rather than the structural integrity, its impact on mesh stiffness is relatively smaller, resulting in more moderate TE variations (Figure 15).
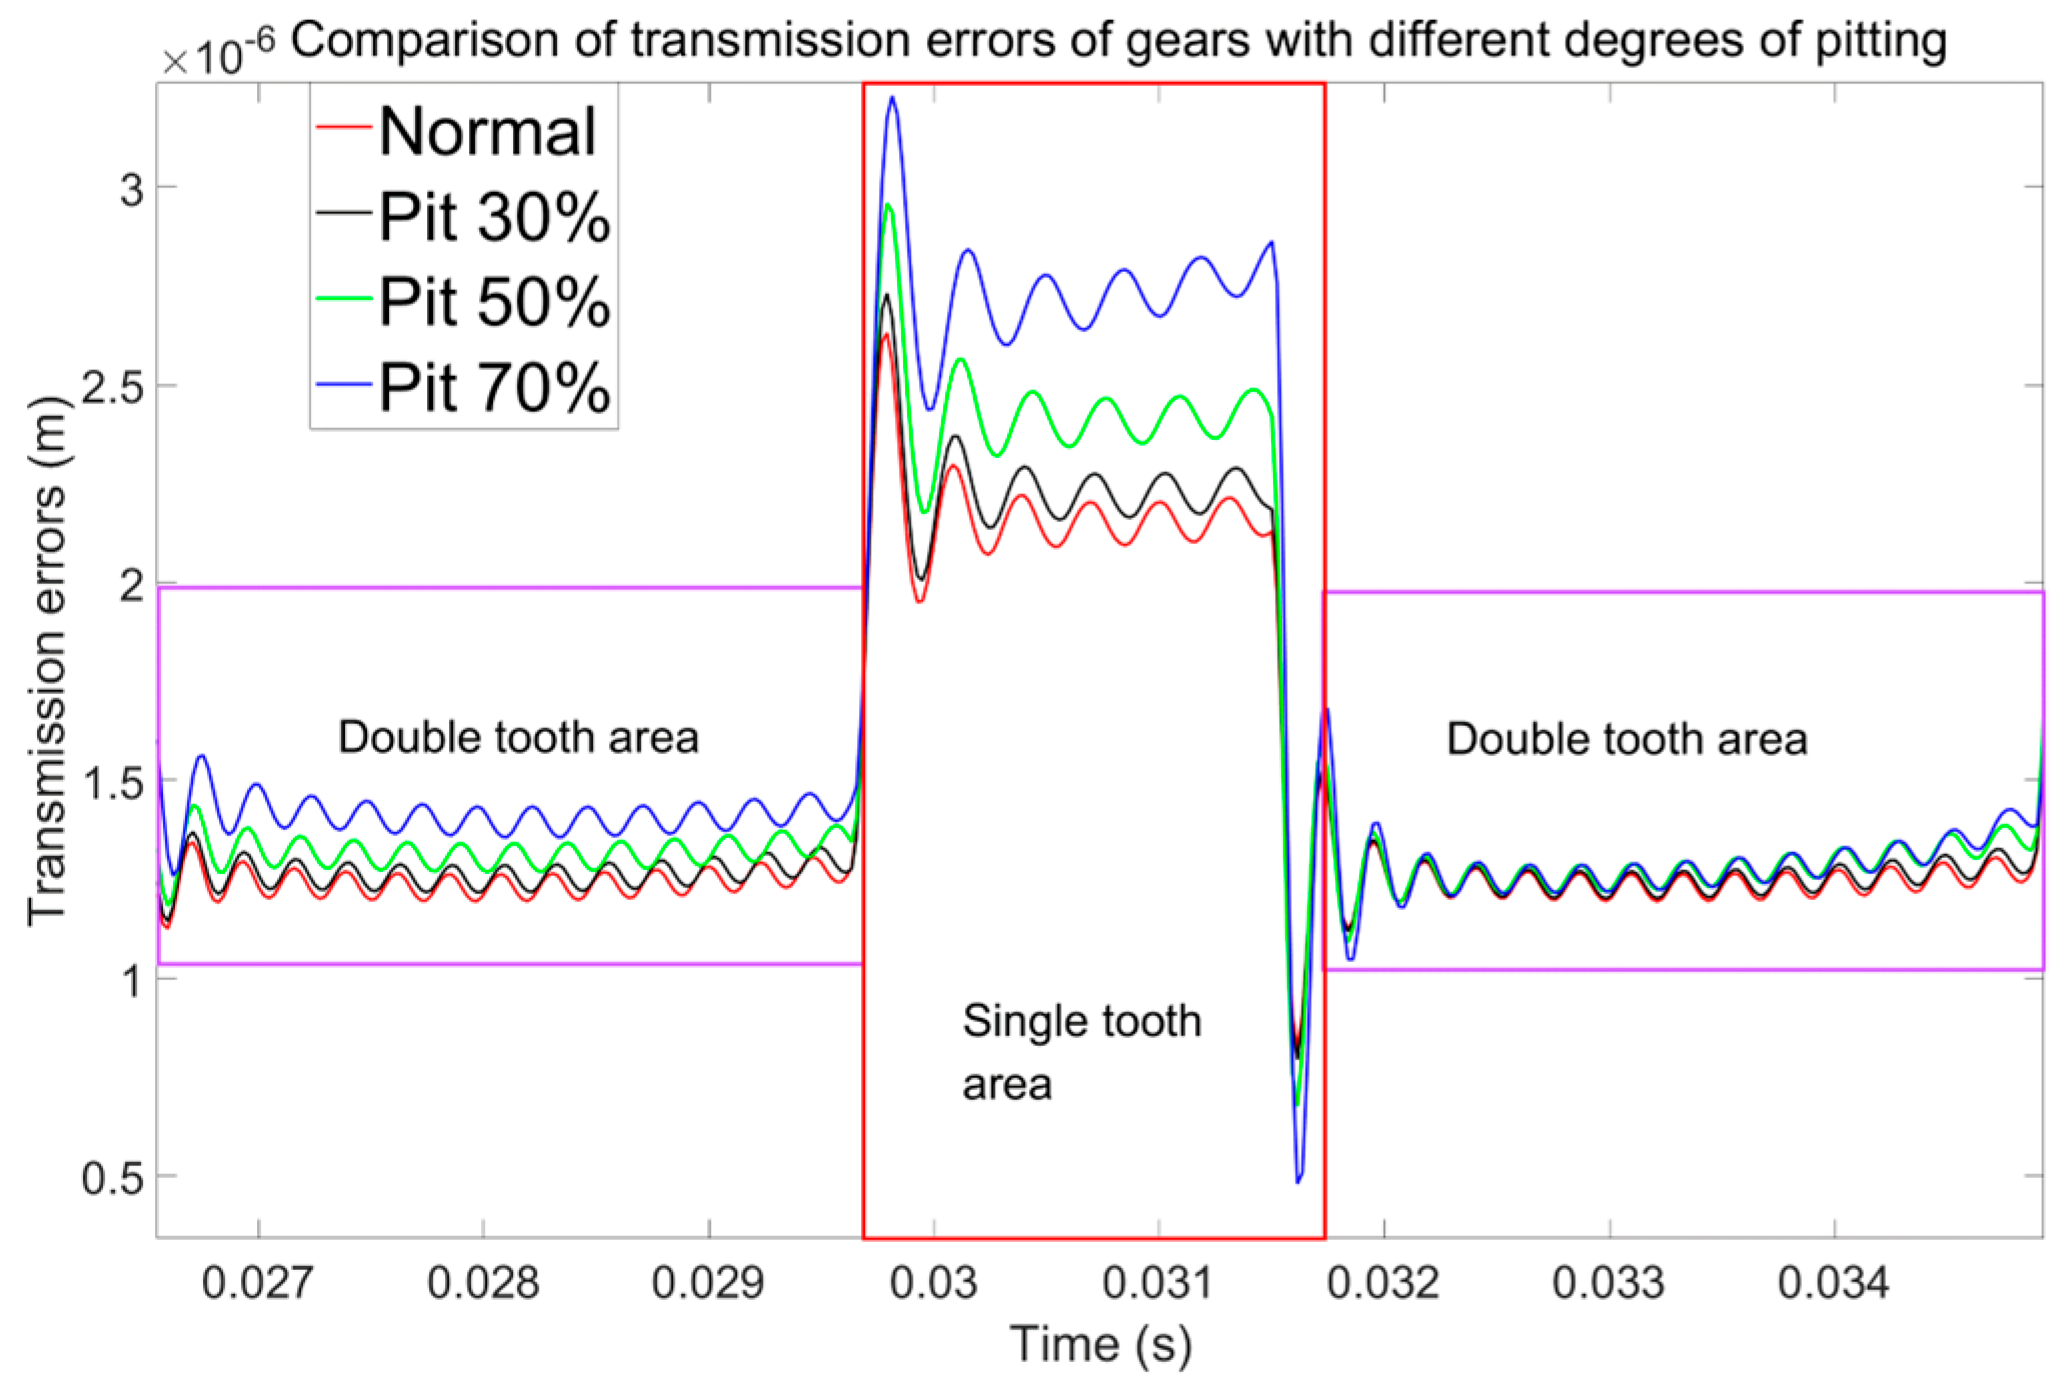
When magnifying localized pitting-induced TE signals and comparing them to healthy gears (Figure 16), two key characteristics emerge:
  • Smoother Curves: Pitting generates gentler TE fluctuations compared to the abrupt transitions seen in crack cases.
  • Reduced Amplitude Modulation: The maximum TE amplitude increase is 40–60% lower than equivalent-severity cracks.
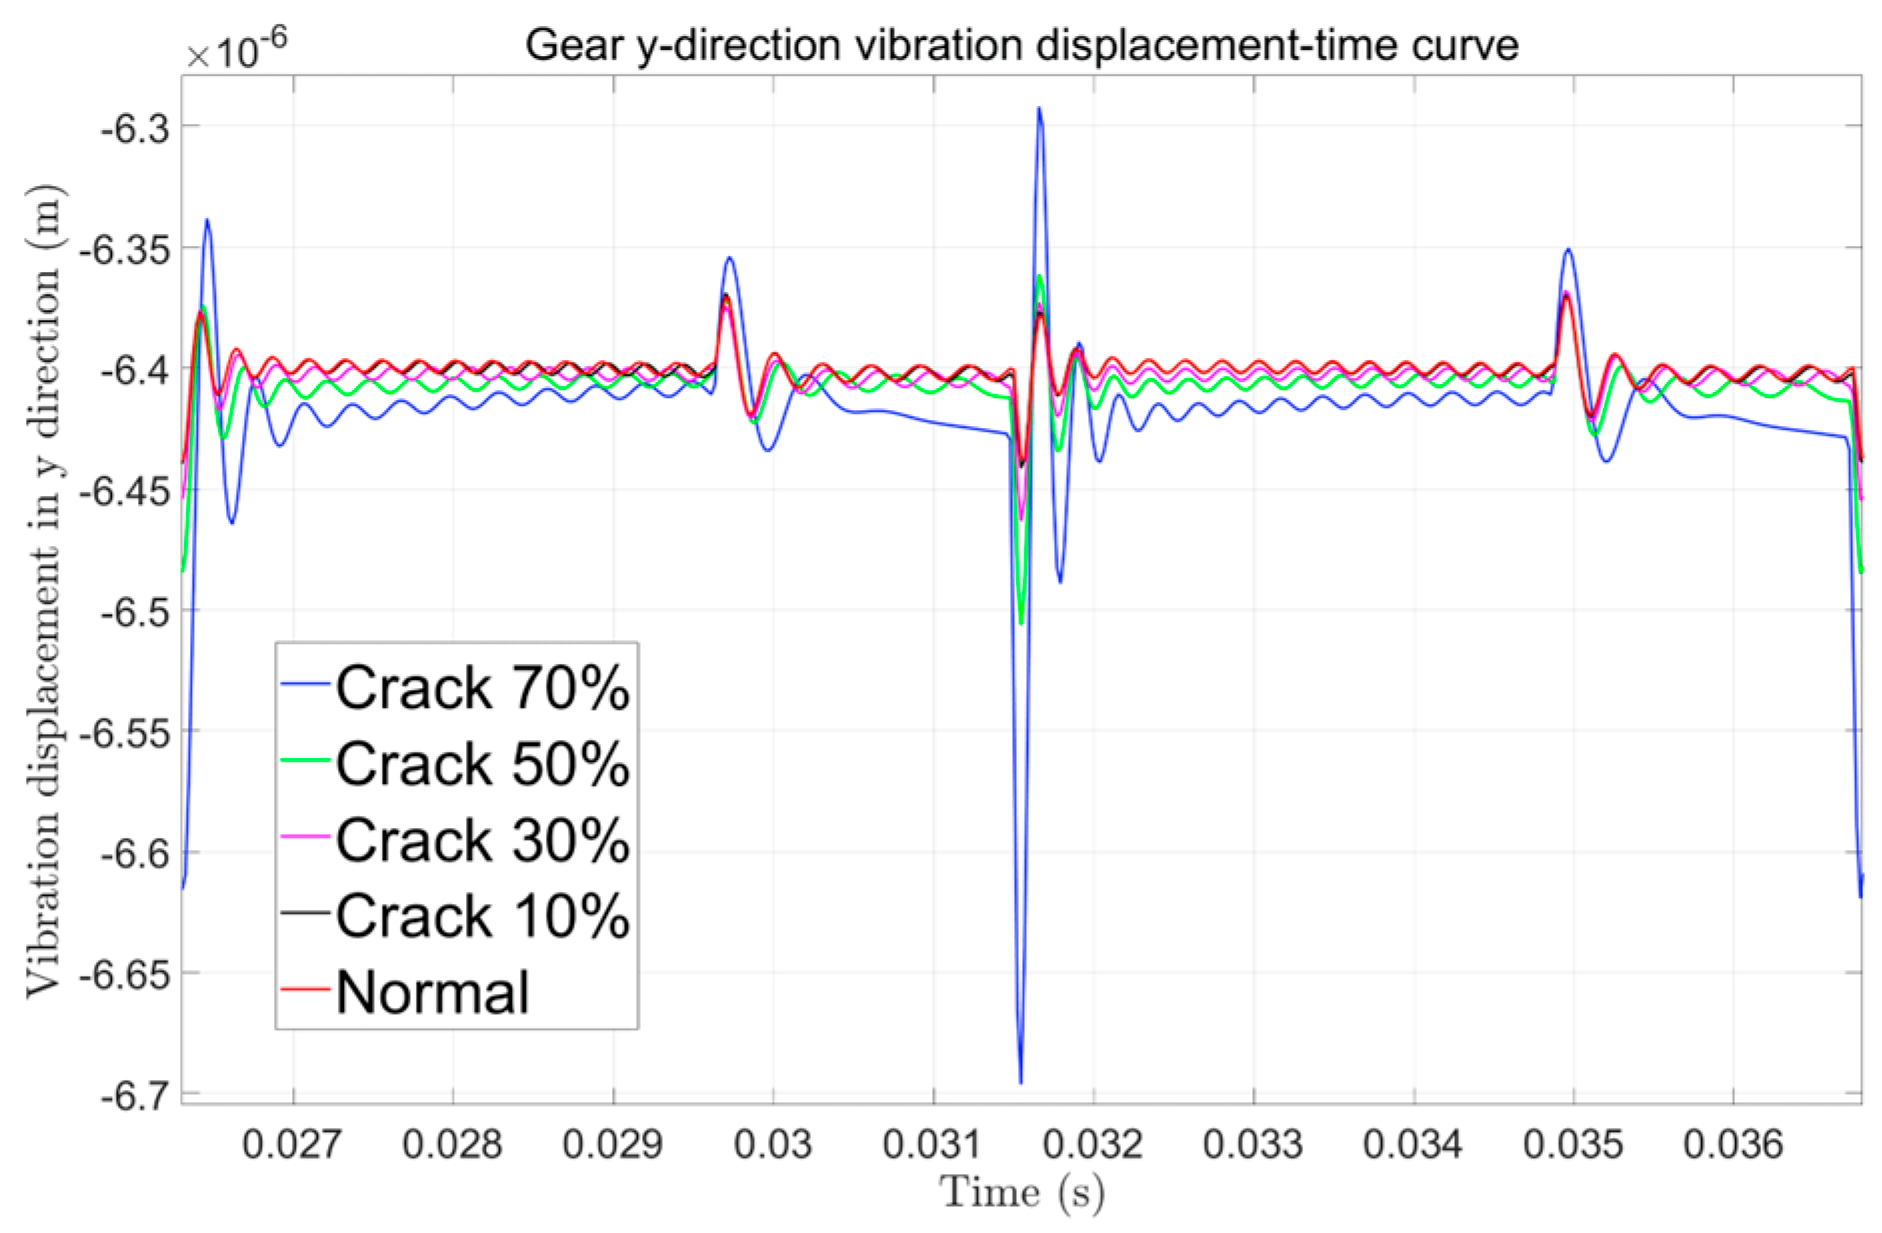
We now compute the vibration displacement signals for gears with varying crack depths under identical operating conditions, as shown in Figure 17. Compared to transmission error signals, the vibration displacements exhibit a smaller amplitude variation range (0.4 × 10⁻⁶ m), with noticeable fluctuations only emerging at severe crack depths. For cracks shallower than 70% of the tooth height, the displacement curves overlap significantly, demonstrating limited sensitivity to incipient faults.
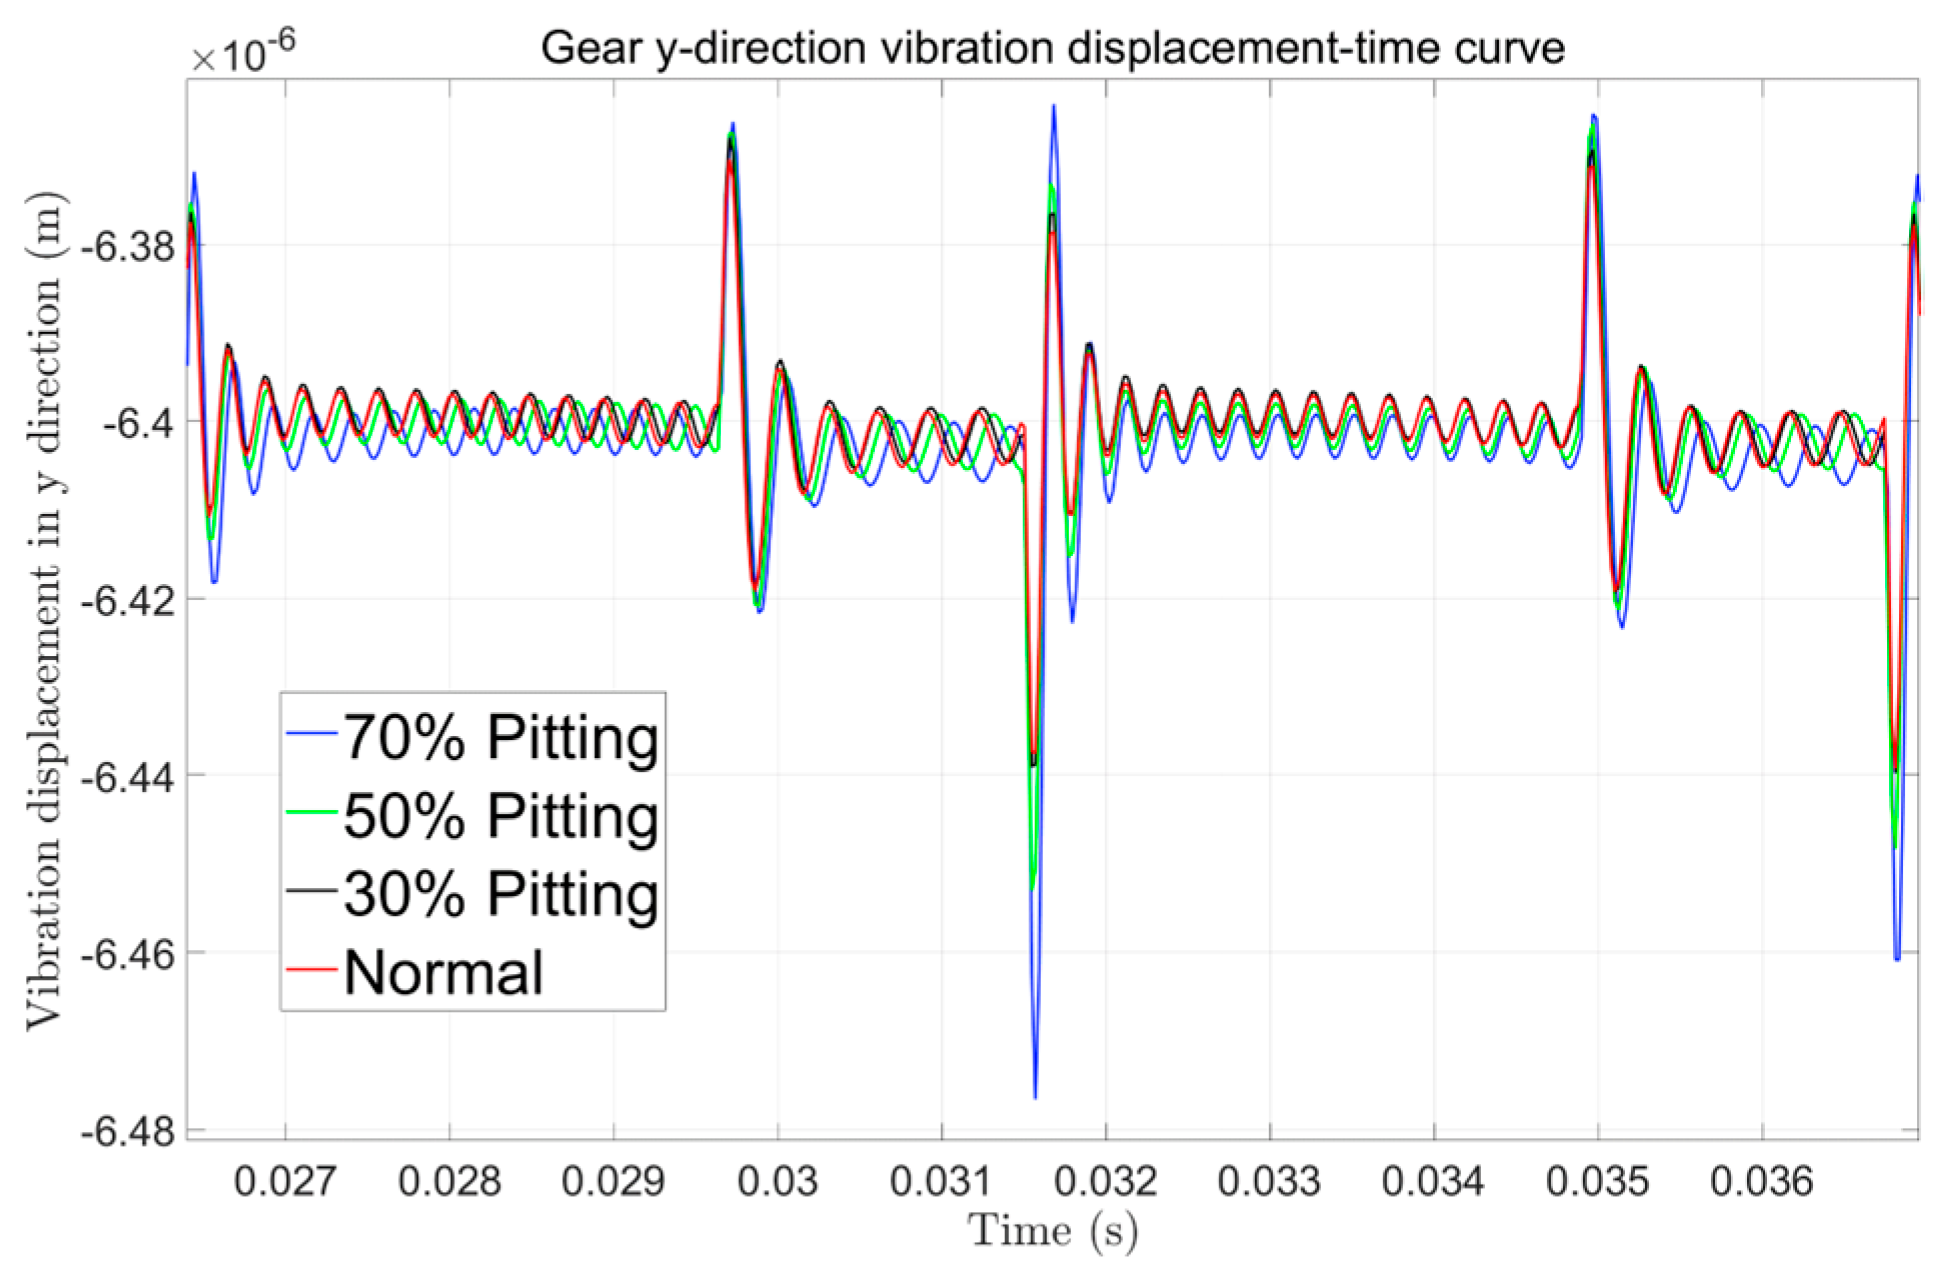
Figure 18 presents vibration displacement signals under different pitting severities. The amplitude variations are even more constrained (0.1 × 10⁻⁶ m) than crack cases, with pronounced curve overlap across pitting levels.

4.2. Fault Diagnosis Model Construction

Based on the previously established dynamic models of healthy and faulty gears, we will construct a neural network model to distinguish and diagnose system data under varying intensities of noise interference. While numerous network models exist for data classification diagnostics, we employ the fundamental one-dimensional convolutional neural network (1D-CNN) here. The 1D-CNN is specifically designed to process one-dimensional data, utilizing convolutional kernels to extract temporal features through localized sliding operations. Its strong local feature extraction capability makes it particularly suitable for capturing transient impact signals (pitting, cracks, tooth breakage), while offering relatively fast computational speeds. Prioritizing lightweight design considerations, the finalized model parameters are presented in Table 4.

4.3. Diagnostic Results Affected by Noise

Through experimental analysis and validation in Reference [27], we selected the Rectified Linear Unit (ReLU) as the activation function and Adaptive Moment Estimation (Adam) as the optimizer. The hyperparameters were configured with a learning rate of 0.0001, batch size of 16, and 50 training epochs. To mitigate overfitting, Dropout (rate = 0.1) and L2 regularization (λ = 0.001) were incorporated into the model.
The dataset was partitioned into training, validation, and test sets at a ratio of 5:3:2, with labeled categories: 0: Crack, 1: Healthy, 2: Pitting.
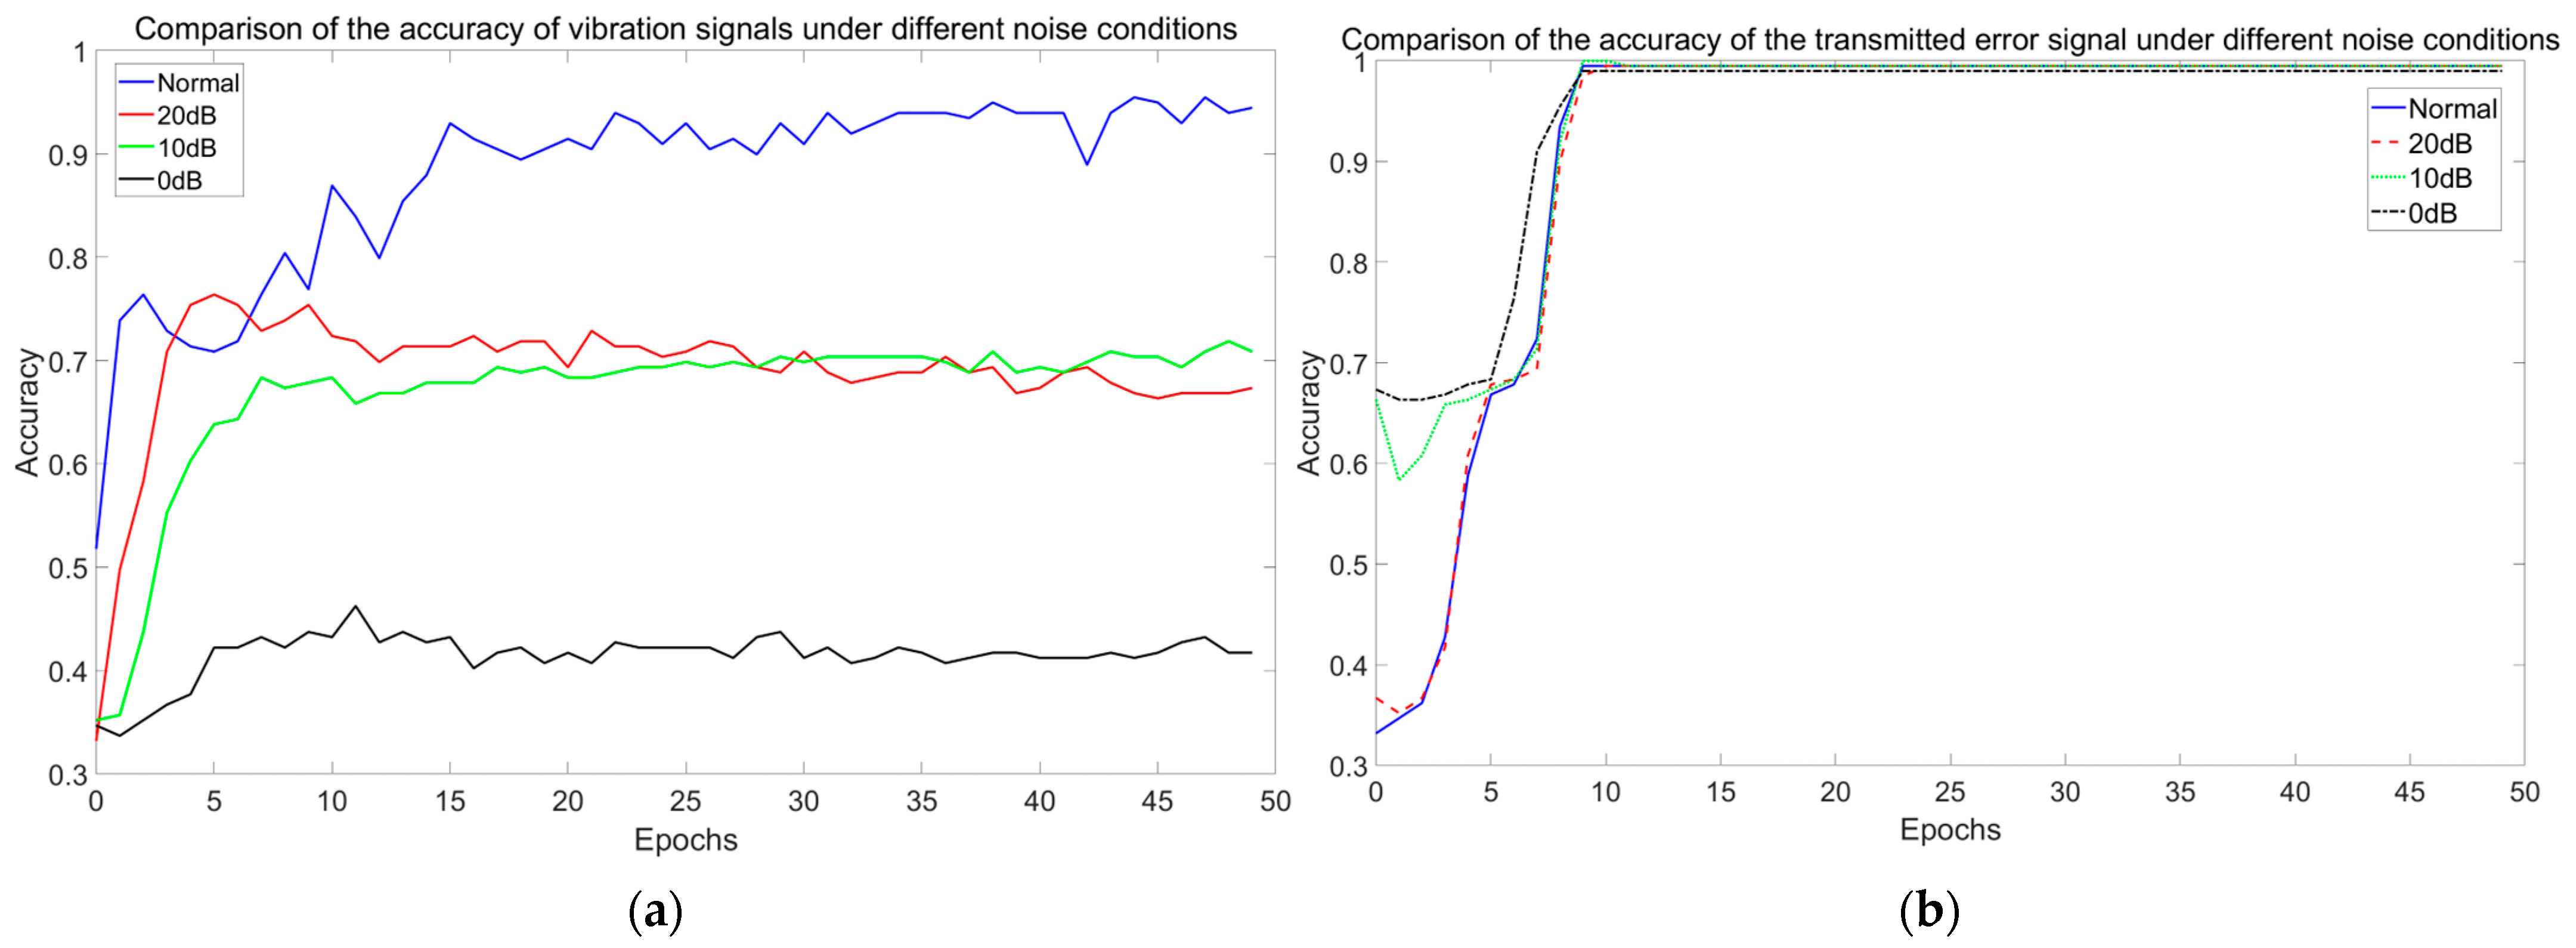
Gaussian white noise was added to simulated signals at varying signal-to-noise ratios (SNRs). Figure 19 illustrates the diagnostic accuracy trends across different SNR conditions.
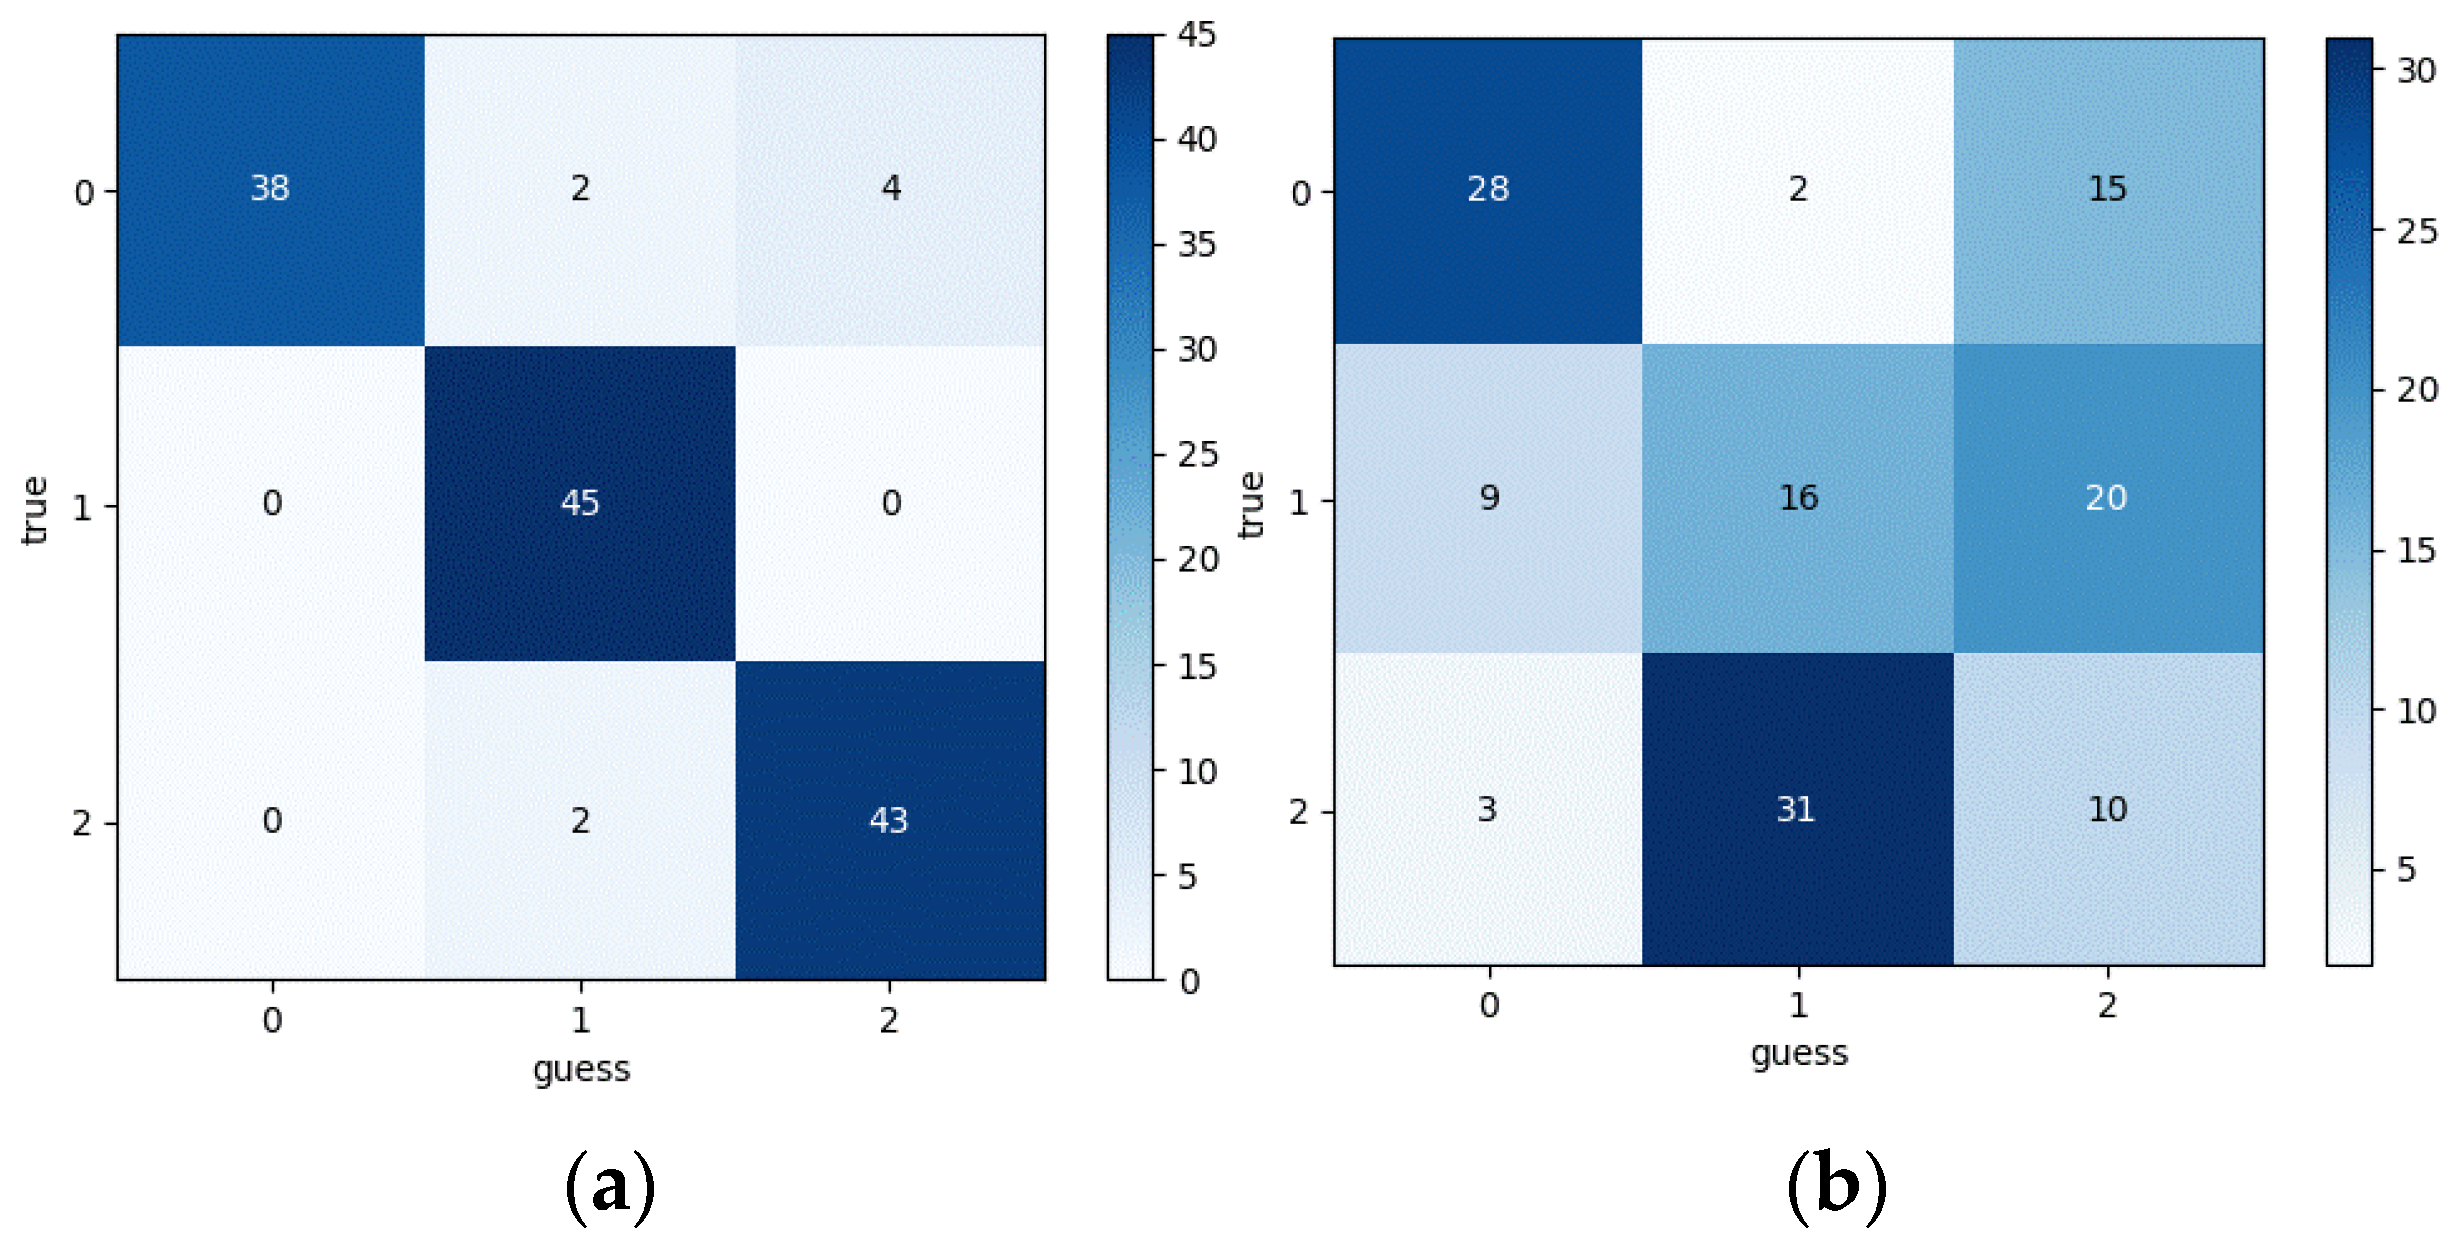
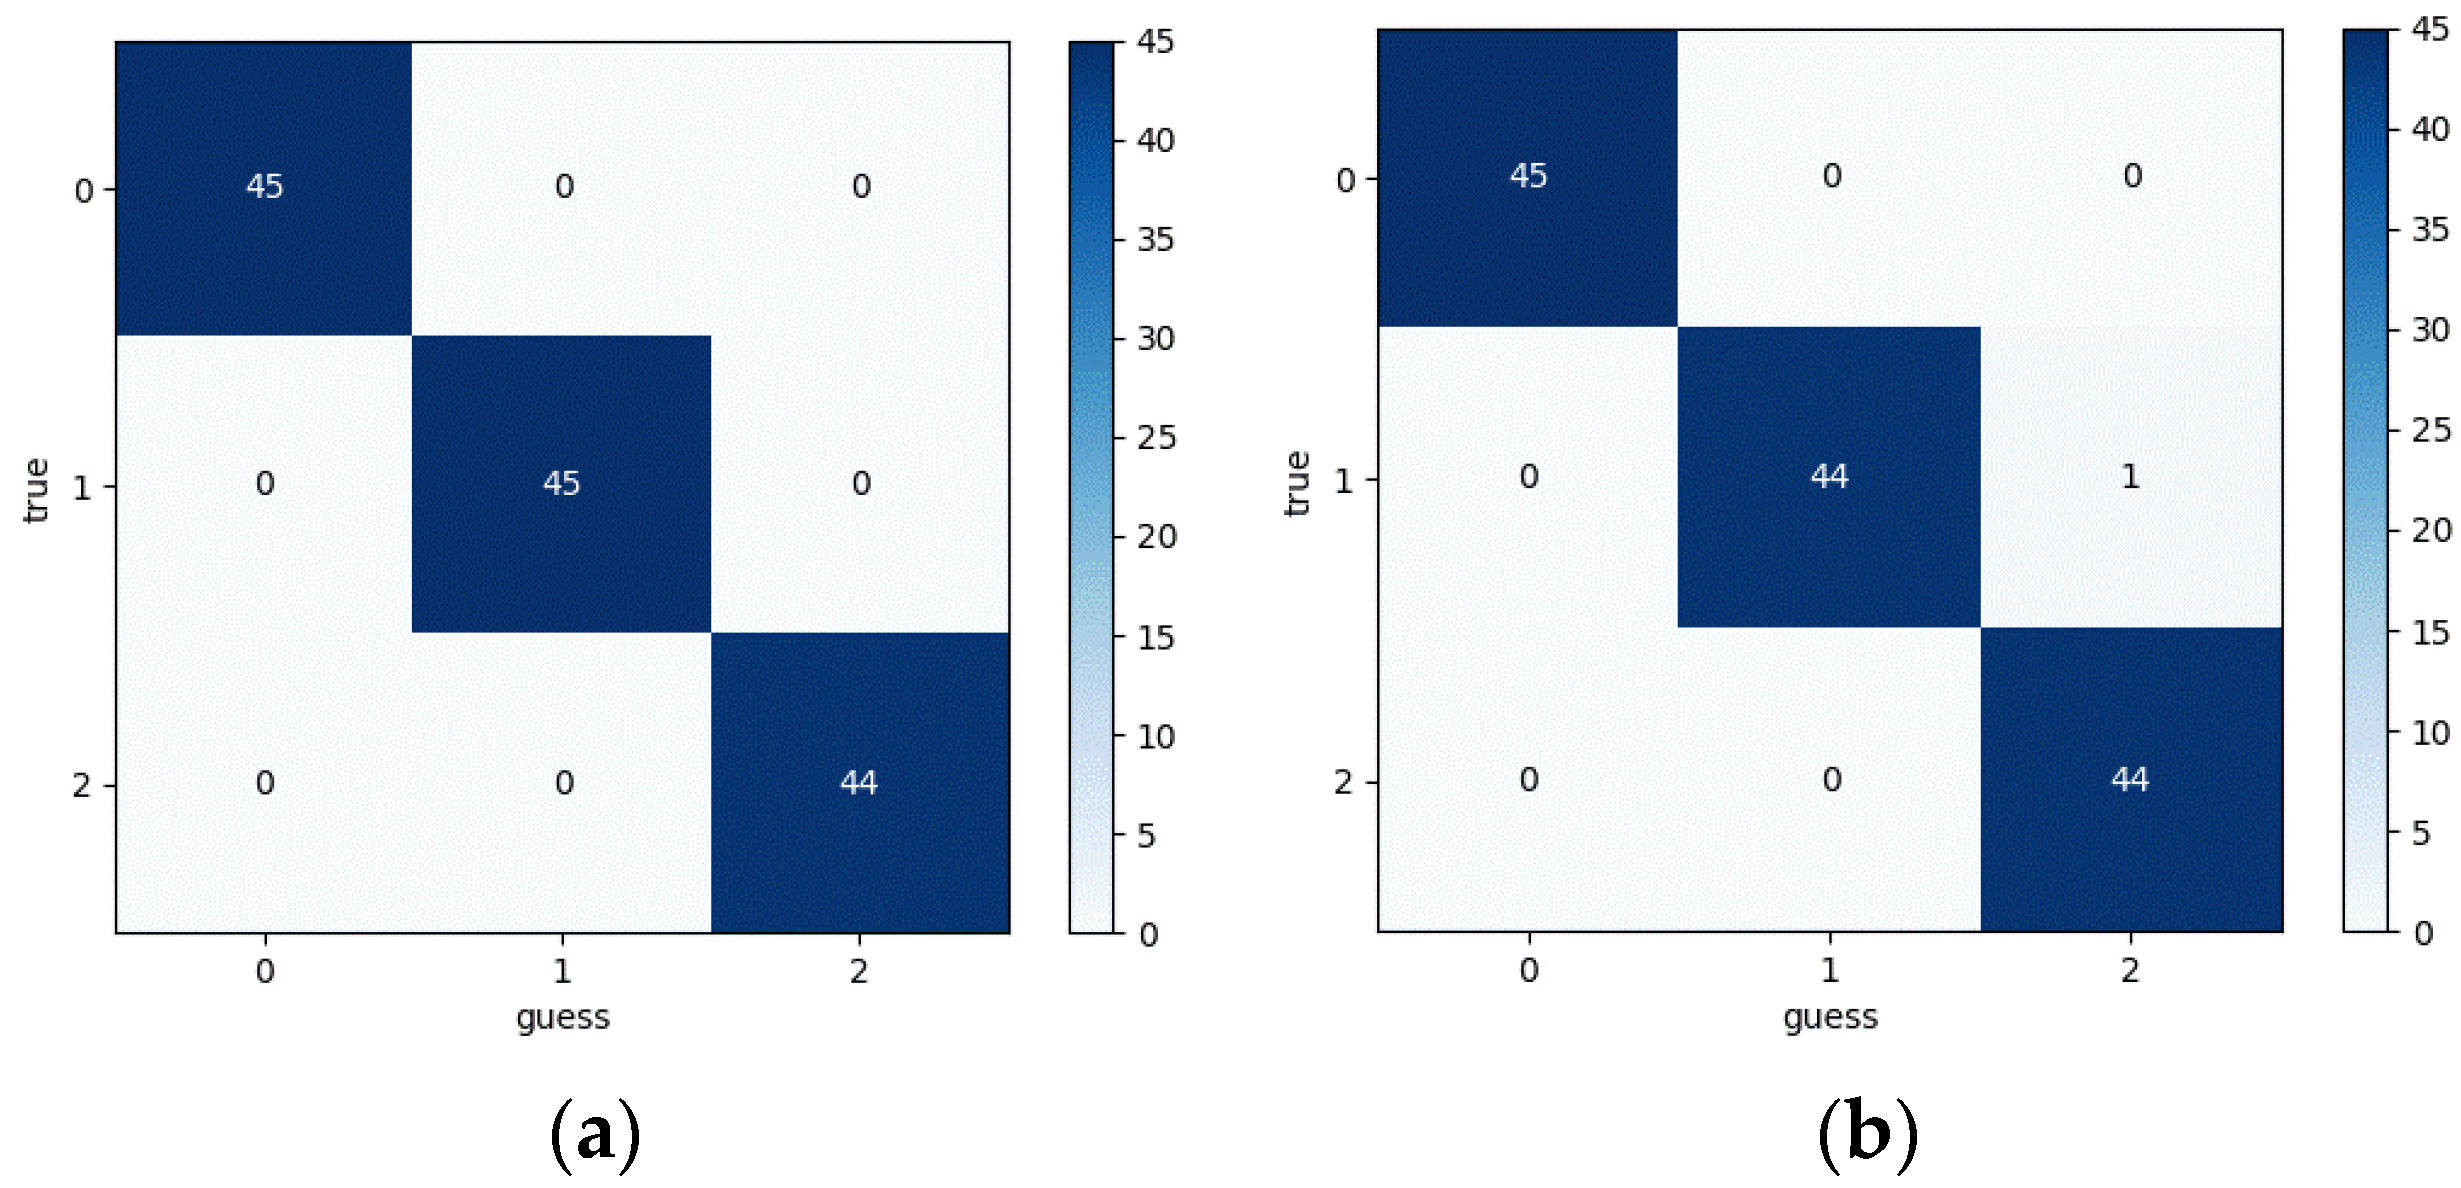
Figure 19 demonstrates that the transmission error (TE) signal achieves faster convergence with sustained accuracy of 99–100%, whereas the vibration signal exhibits slower convergence, pronounced fluctuations during training, and progressive accuracy degradation under noise interference. Table 5 quantifies the diagnostic accuracy of both signals across varying signal-to-noise ratios (SNRs). The confusion matrices for noiseless and 0 dB SNR conditions are presented in Figure 20 and Figure 21, respectively.

5. Gear Transmission Platform Construction and Experimental Verification

To validate the applicability of transmission error in gear fault diagnosis, an experimental gear transmission test rig was designed and implemented.

5.1. Platform Construction

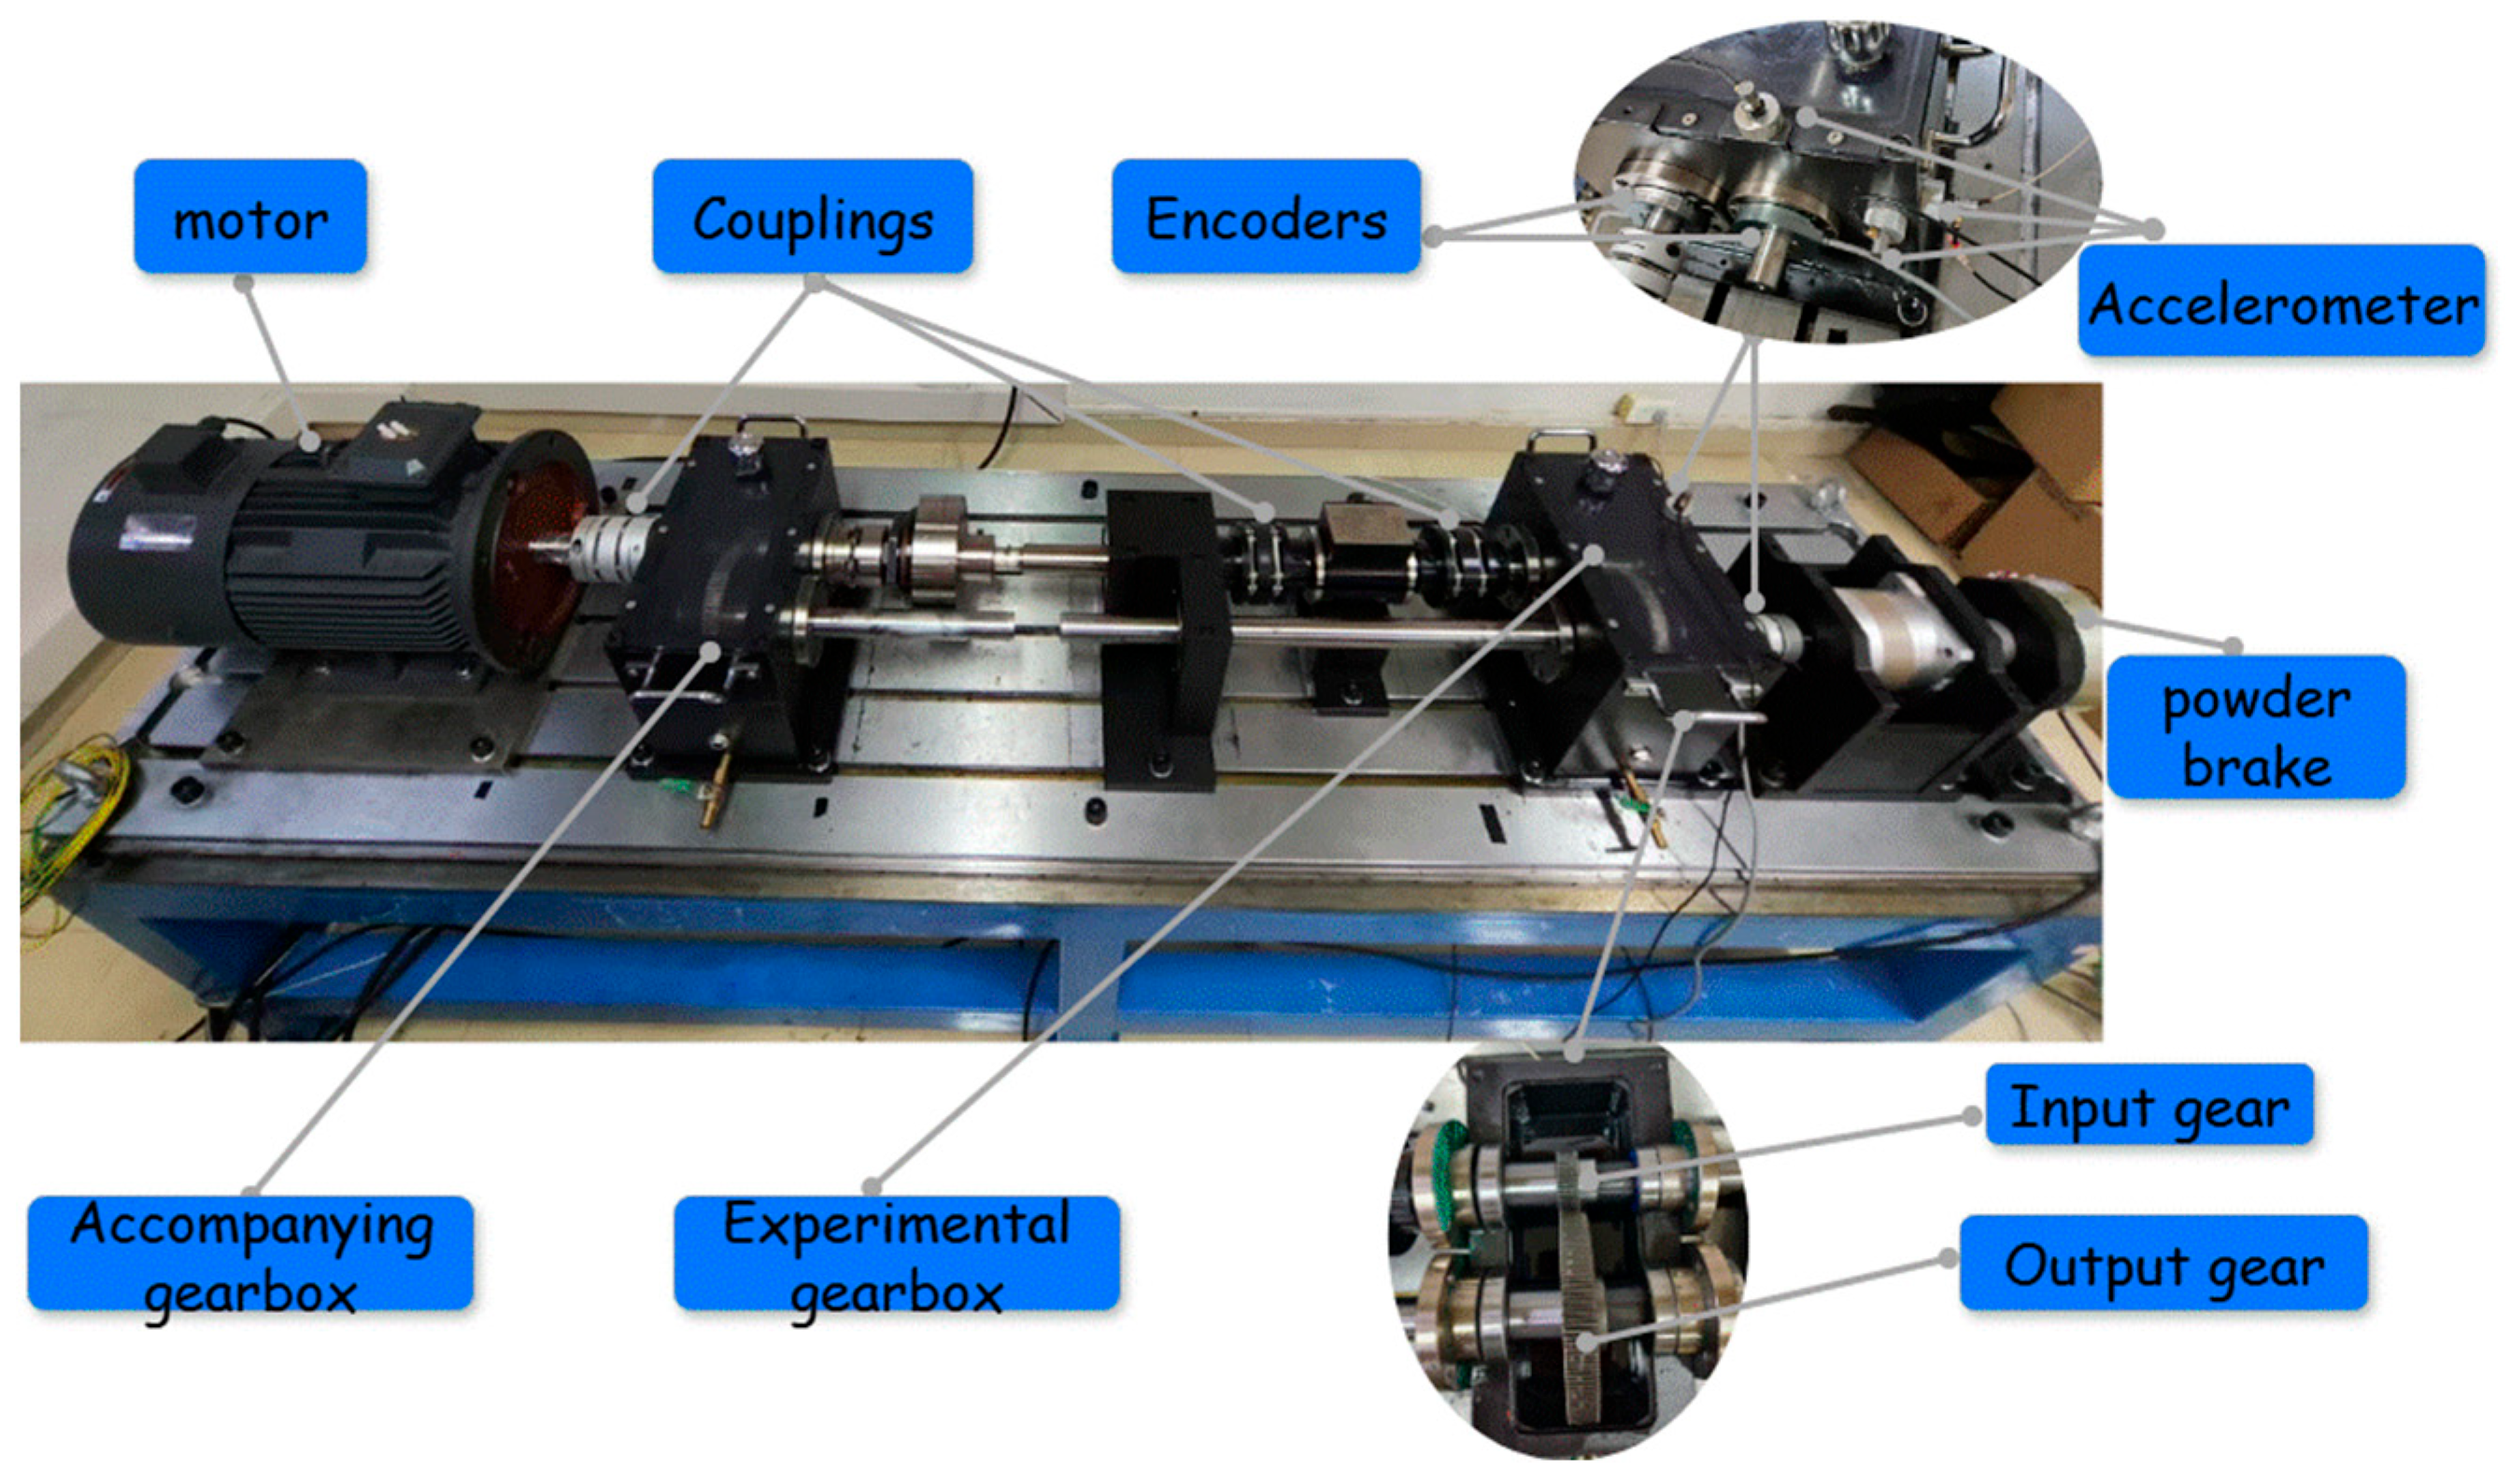
The layout of the spur gear experimental platform is shown in Figure 22.
The platform mainly consists of: a 45w G-132A servo motor, two gearboxes (The accompanying gearbox is always equipped with normal gears manufactured by Huafei from Beijing, China), a magnetic powder brake, two PN72-E6S10000 incremental photoelectric encoders(Manufactured by Hengxiang from Qingdao, China), and three acceleration sensors(from Washington, DC, USA). The module of the steel spur gear is 1 mm, the number of teeth is 50 and 150, respectively, the pitch radius is 25 mm and 75 mm, respectively, the tooth width is 16 mm and 20 mm, and the pressure angle is 20°. Among them, the smaller gear is the input gear. Cracks, pitting, broken teeth, double cracks and other faults are all processed on the input gear. The crack length is 0.2 mm and the crack angle is 0°. The second crack of the double crack is separated from the previous crack by one tooth. Broken tooth: one tooth is removed from the gear. The pitting lengths are 4 mm, 2 mm, and 4 mm, the width is 2 mm, and the depth is 1 mm. The three pitting areas are concentrated close to the top of the tooth. The physical resolution of the two encoders is 10,000 ppr, which are installed on the input and output shafts of the gearbox, respectively. The sampling frequency of the encoder acquisition card is set to 10,000 Hz, and the quadruple frequency counting is realized through the AB two-phase pulse to improve the position accuracy. Considering the cost, the experiment uses a vibration acceleration signal sensor to measure the vibration acceleration signal. The acceleration sensor model is PCB-352C33, the sensitivity is 10.25 mV/m/s2, and the sampling frequency is 10,240 HZ.
The faulty gears used four fault types, namely cracks, pitting, double cracks and broken teeth, as shown in Figure 23.
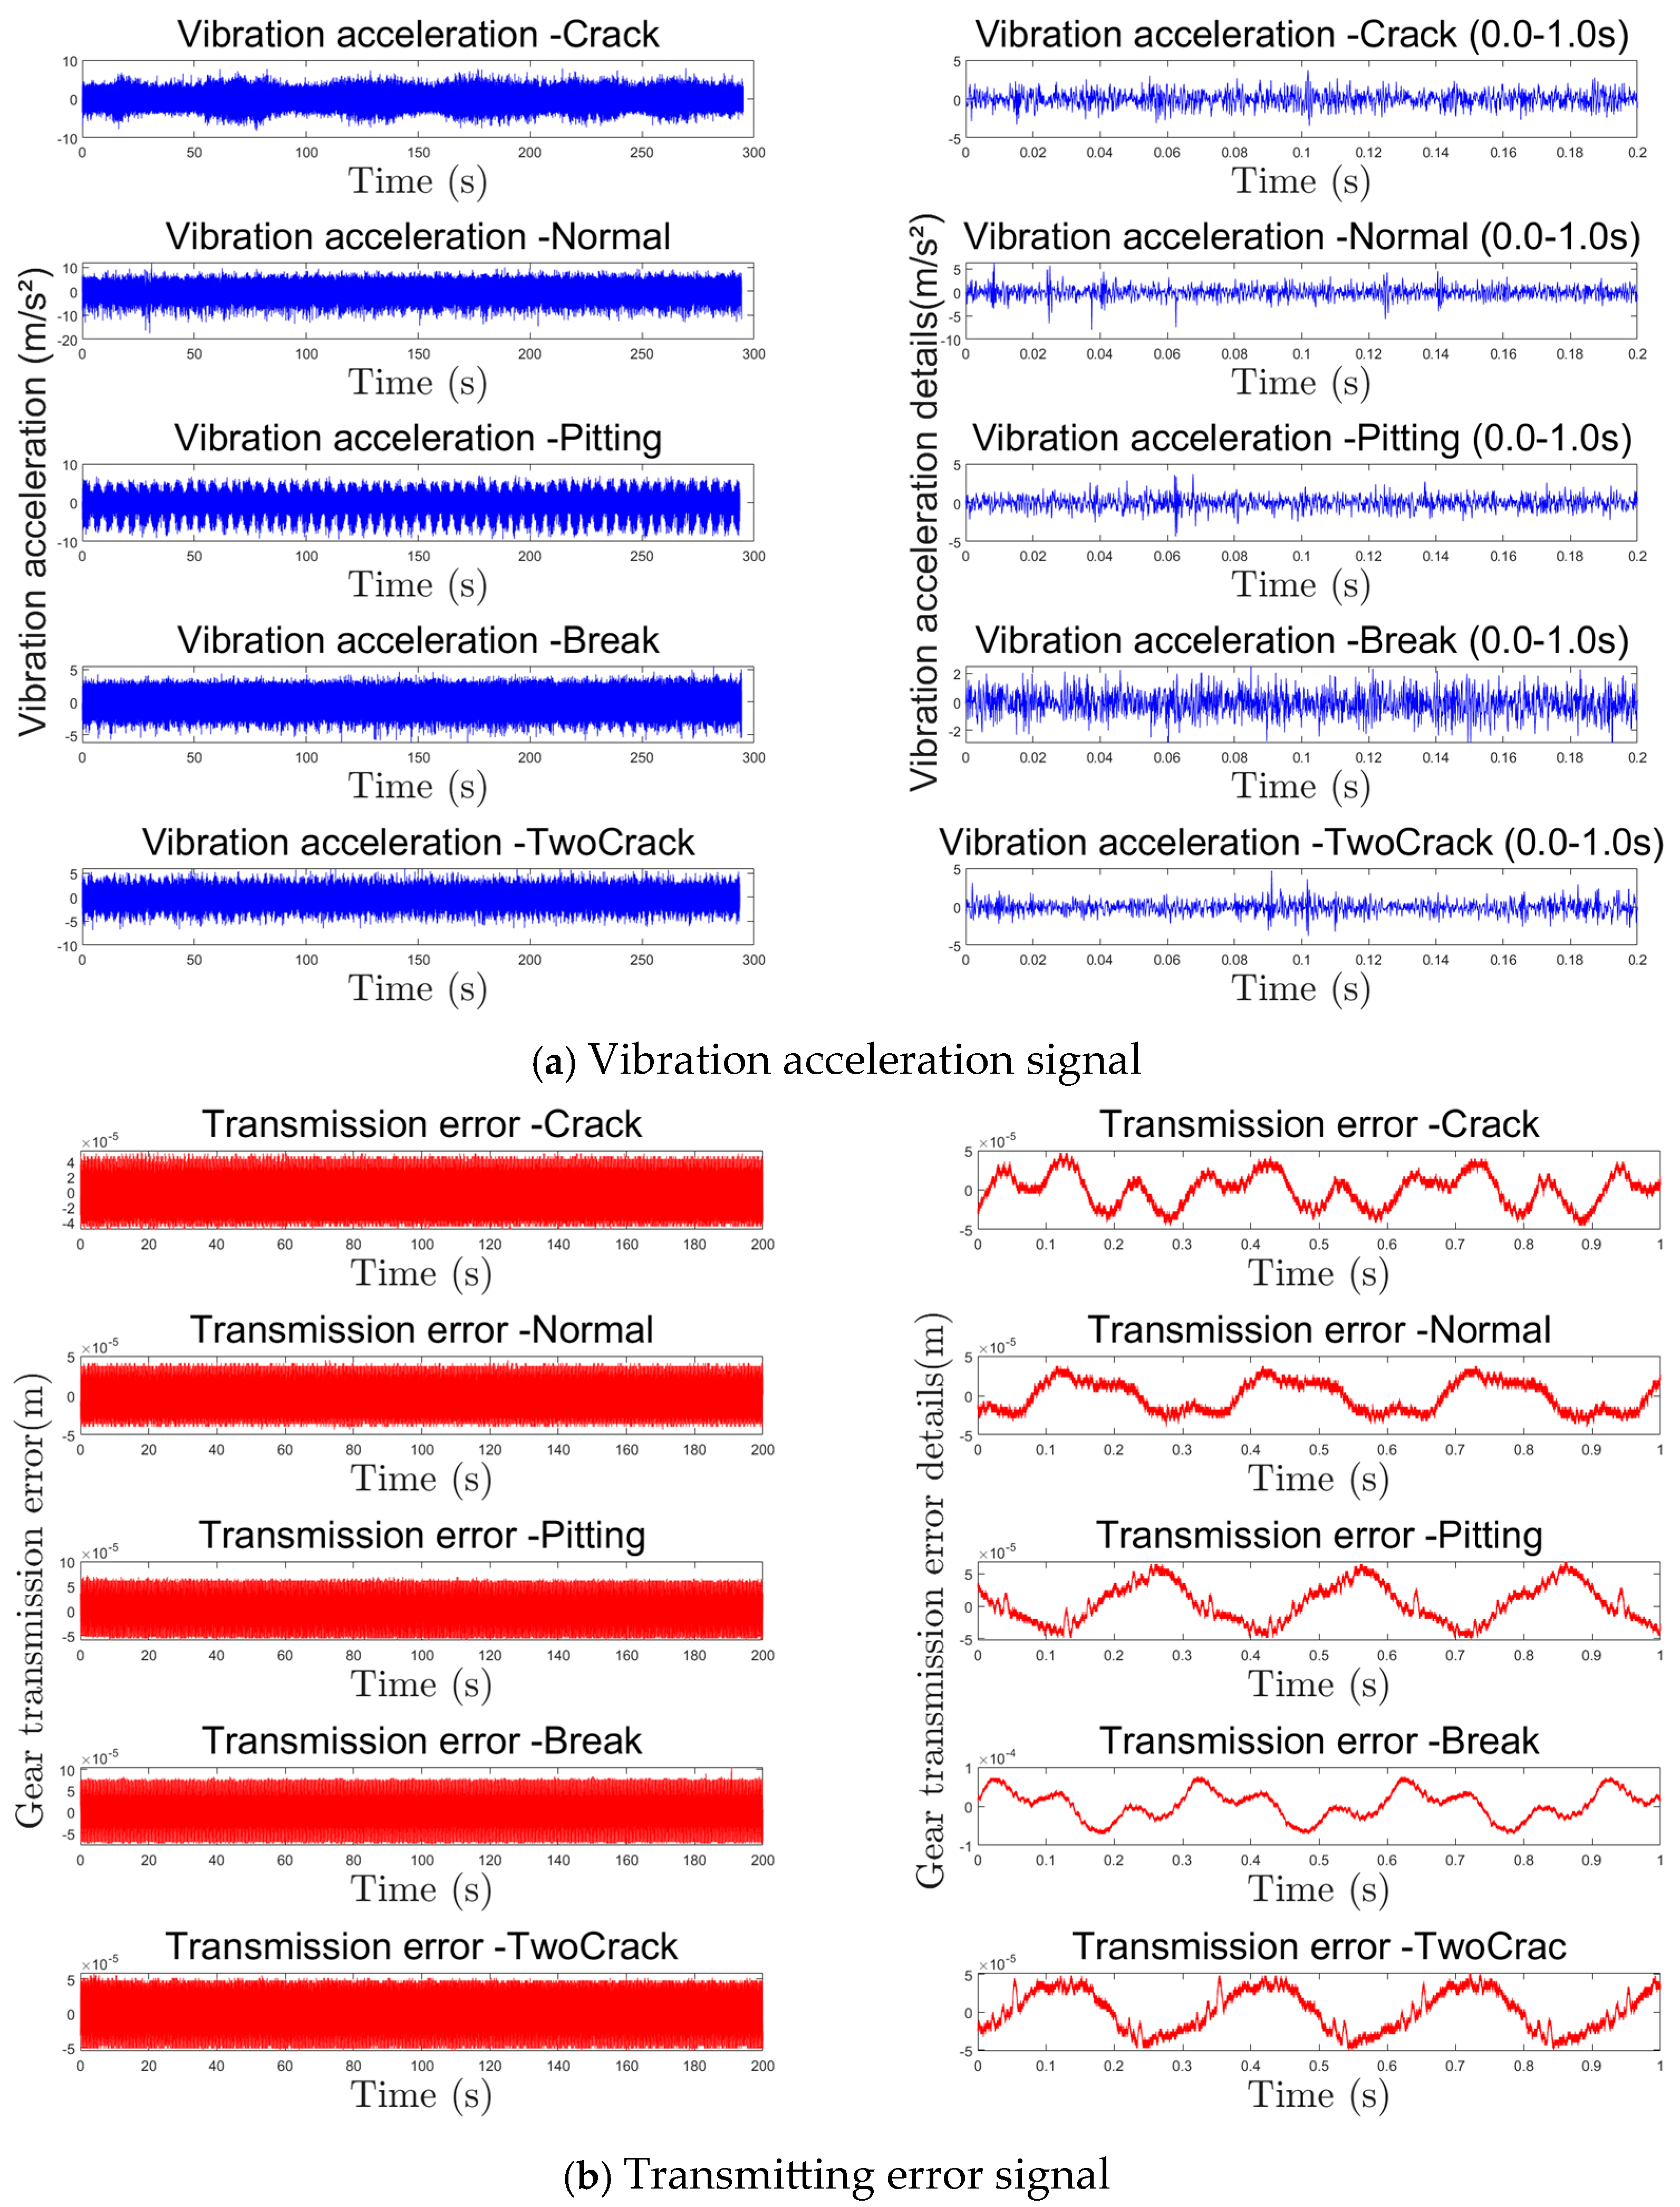
Under rated conditions (600 RPM, 0 Nm output shaft load), we conducted synchronous measurements of transmission error signals and vibration acceleration signals. To mitigate assembly-induced variability, the gear pair was repeatedly disassembled and reinstalled, with identical measurement procedures performed for each trial. This process yielded consistent TE and vibration datasets for both healthy and faulted gears under identical operating conditions, as visualized in Figure 24.
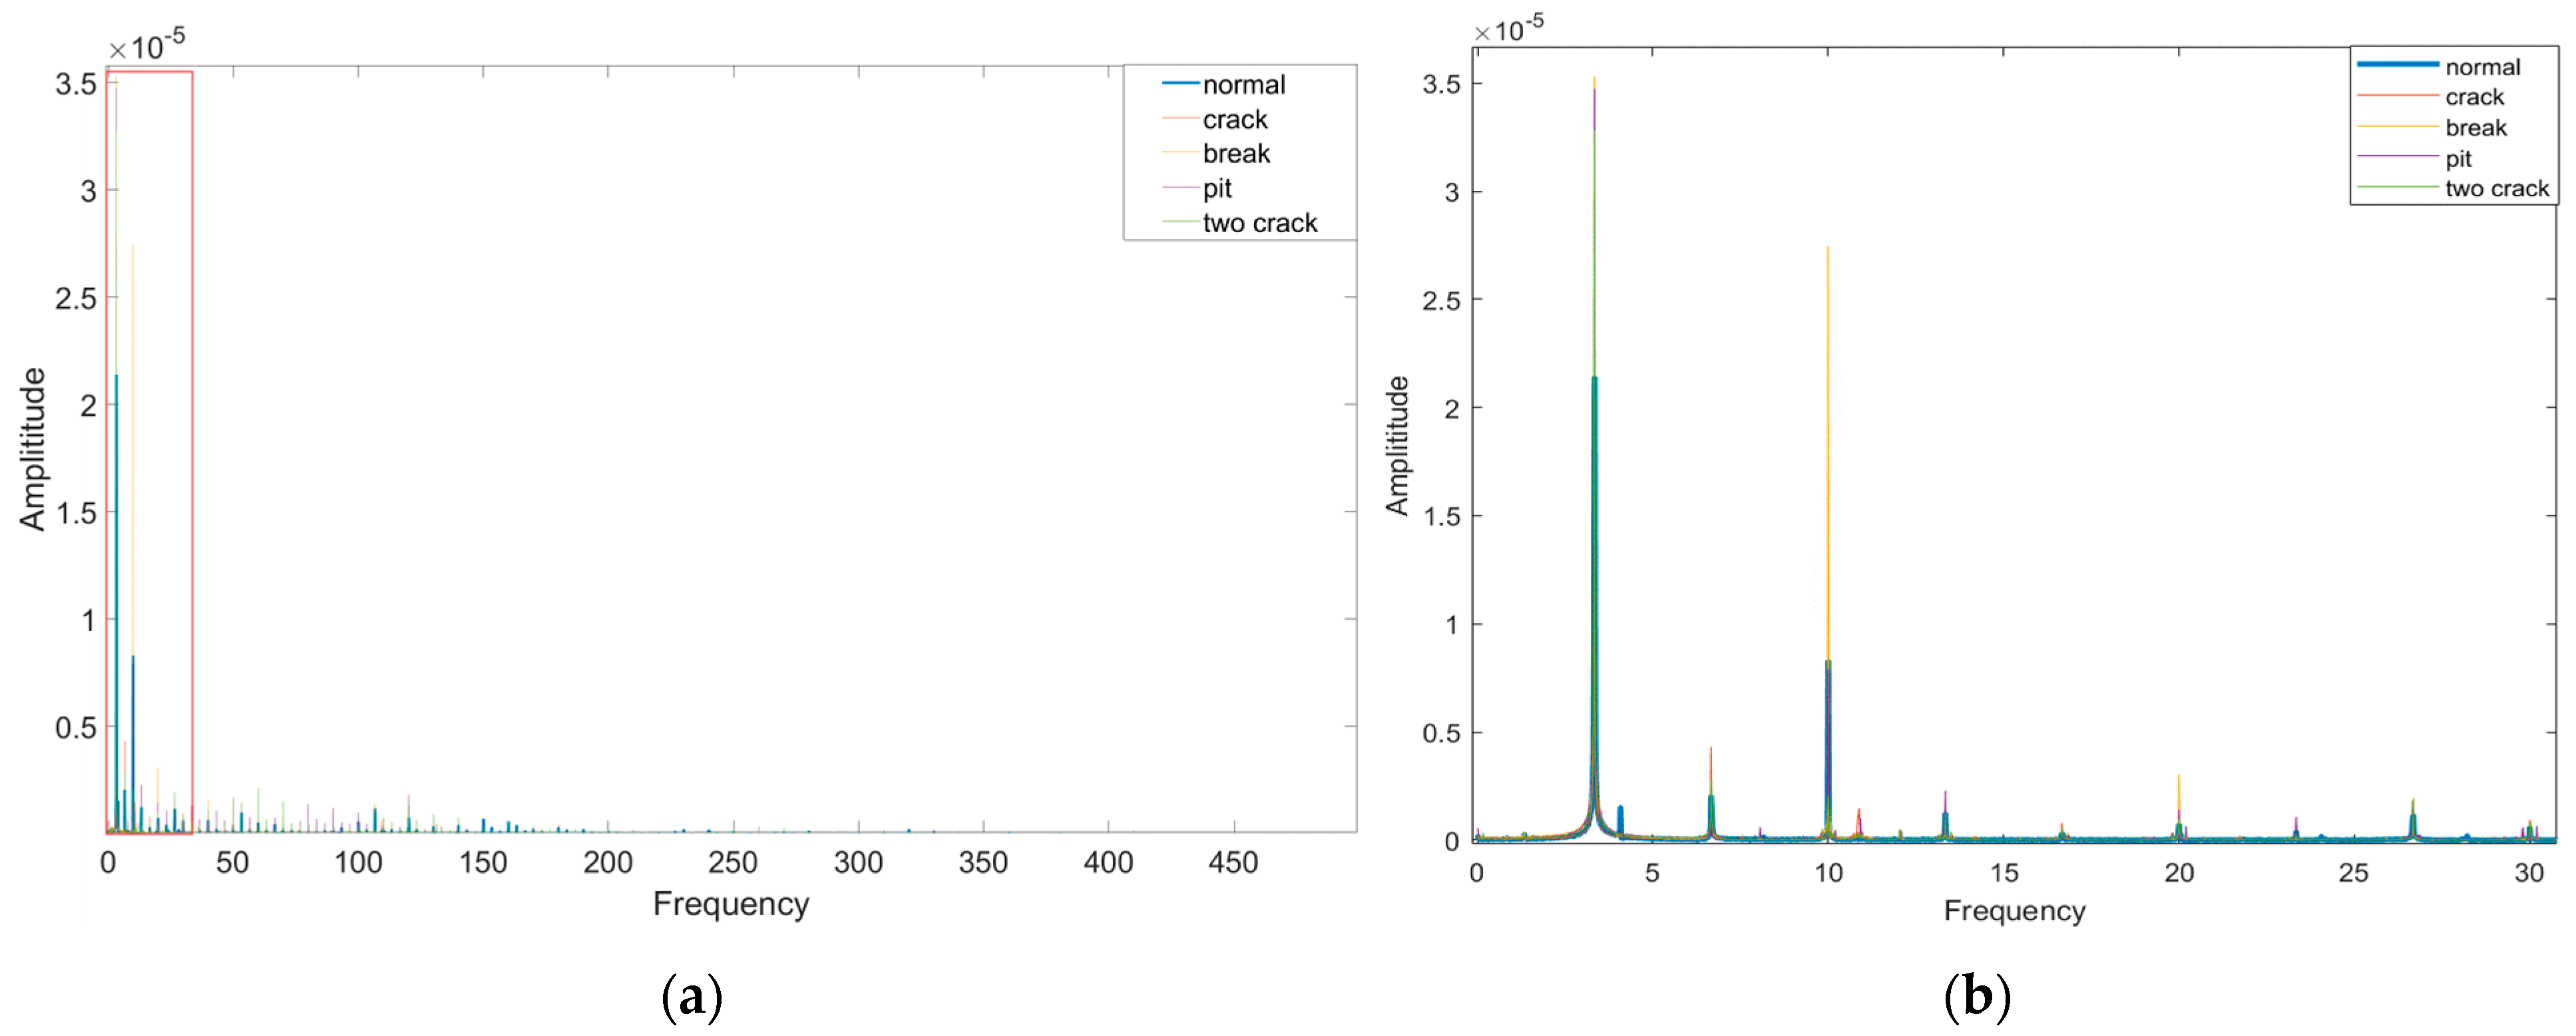
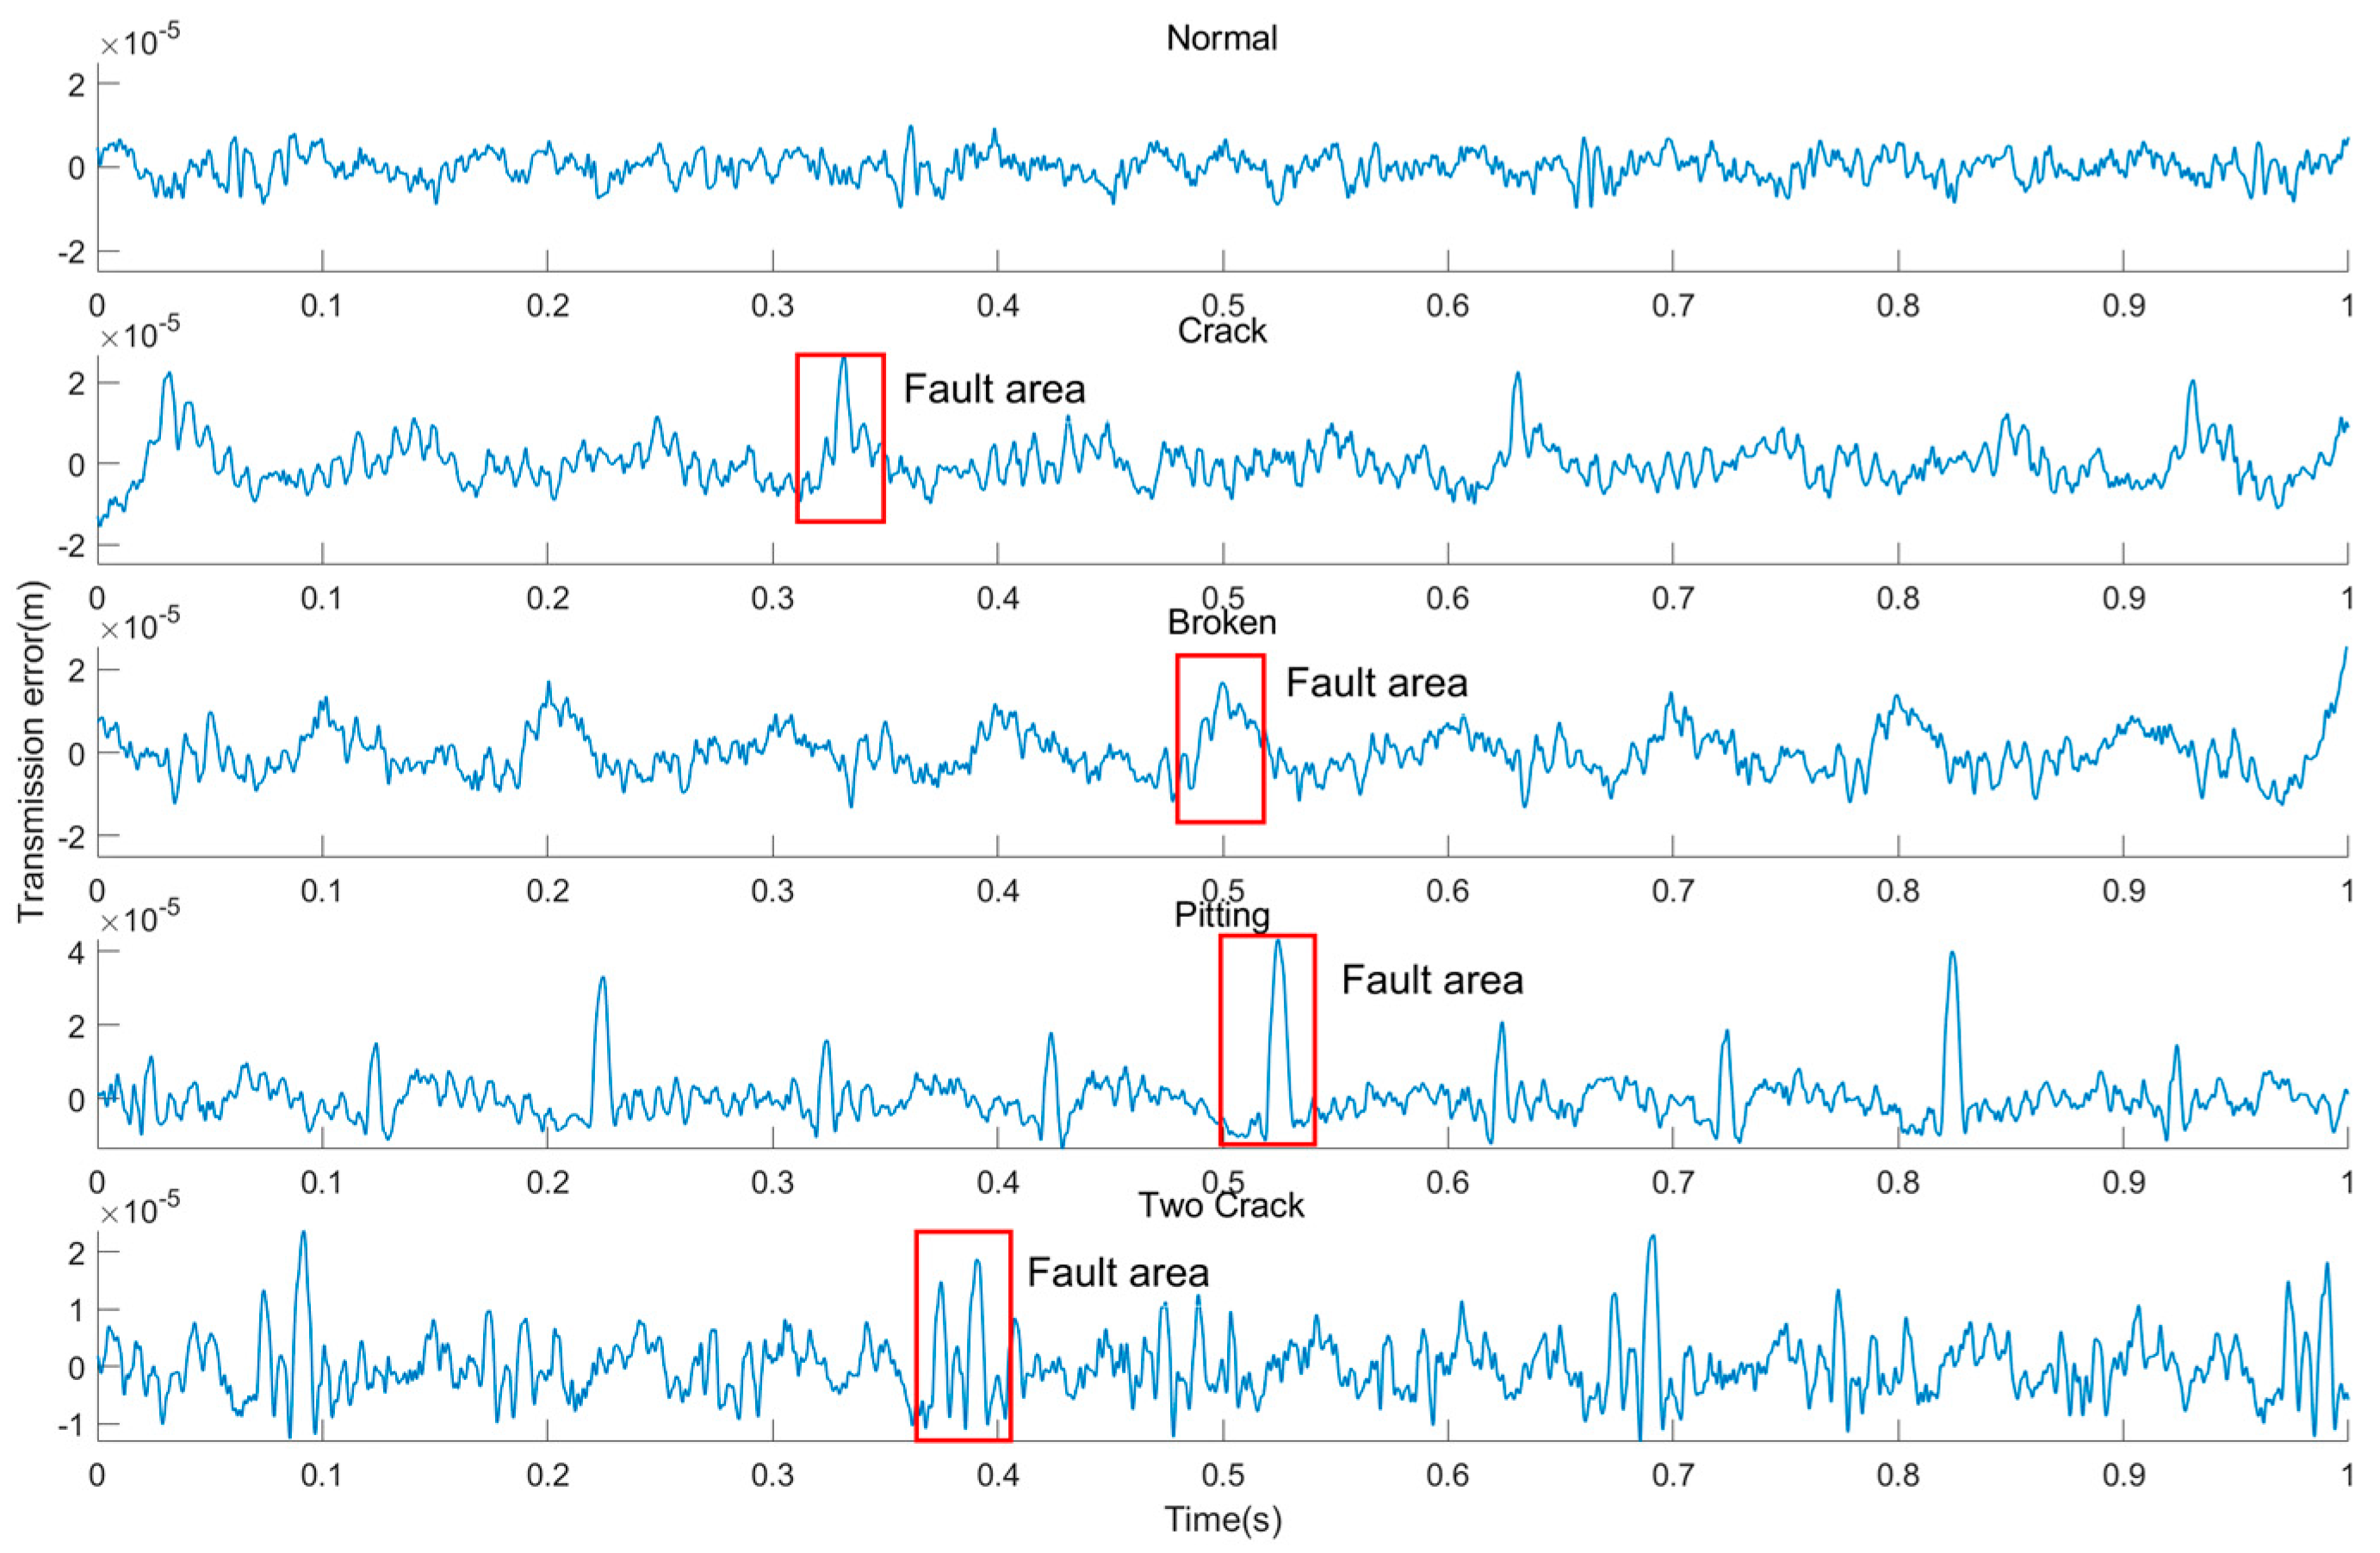
Figure 24a reveals distinct vibration acceleration characteristics across fault types. Especially in the case of broken teeth, the acceleration signal presents a significant periodic impact behavior, and its period is consistent with the rotation period of the faulty gear. Similarly, it can be seen from the transmission error signal of Figure 24b that the transmission error of the system also presents different signal characteristics. However, for the transmission error, no matter what kind of fault signal it is, it shows a periodicity of about 0.3 s, which is consistent with the rotation period of the large gear of the system. The 0.3 s periodicity shown by the system transmission error is not matched with the gear meshing period. In order to explore the cause of its formation, we perform a Fourier transform on the transmission error signal and obtain the frequency-amplitude characteristics shown in Figure 25. The spectral analysis reveals dominant energy concentrations at approximately 3.33 Hz and 10 Hz, corresponding directly to the rotational frequencies of the large gear and small gear, respectively. This frequency alignment indicates a potential dynamic imbalance in the gear system. Spectral analysis further identifies a significant amplitude peak at 6.66 Hz—precisely twice the fundamental rotational frequency of the large gear (3.33 Hz). This second harmonic component indicates probable angular misalignment in the large gear assembly. In order to reduce the impact of gear dynamic imbalance and misalignment on the transmission error signal, we bandpass filter the transmission error signal to filter out frequencies below 10 Hz and above 1000 Hz. The filtered transmission error signal is shown in Figure 26. It now clearly exhibit that the transmission error signals of different faults after filtering clearly show the fault characteristics unique to other faults. For example, if there is a crack in the gear, it can be seen that the transmission error signal has prominent periodic peaks; when there is a double crack in the gear, periodic double peaks appear, which is consistent with the results obtained by the theoretical model.
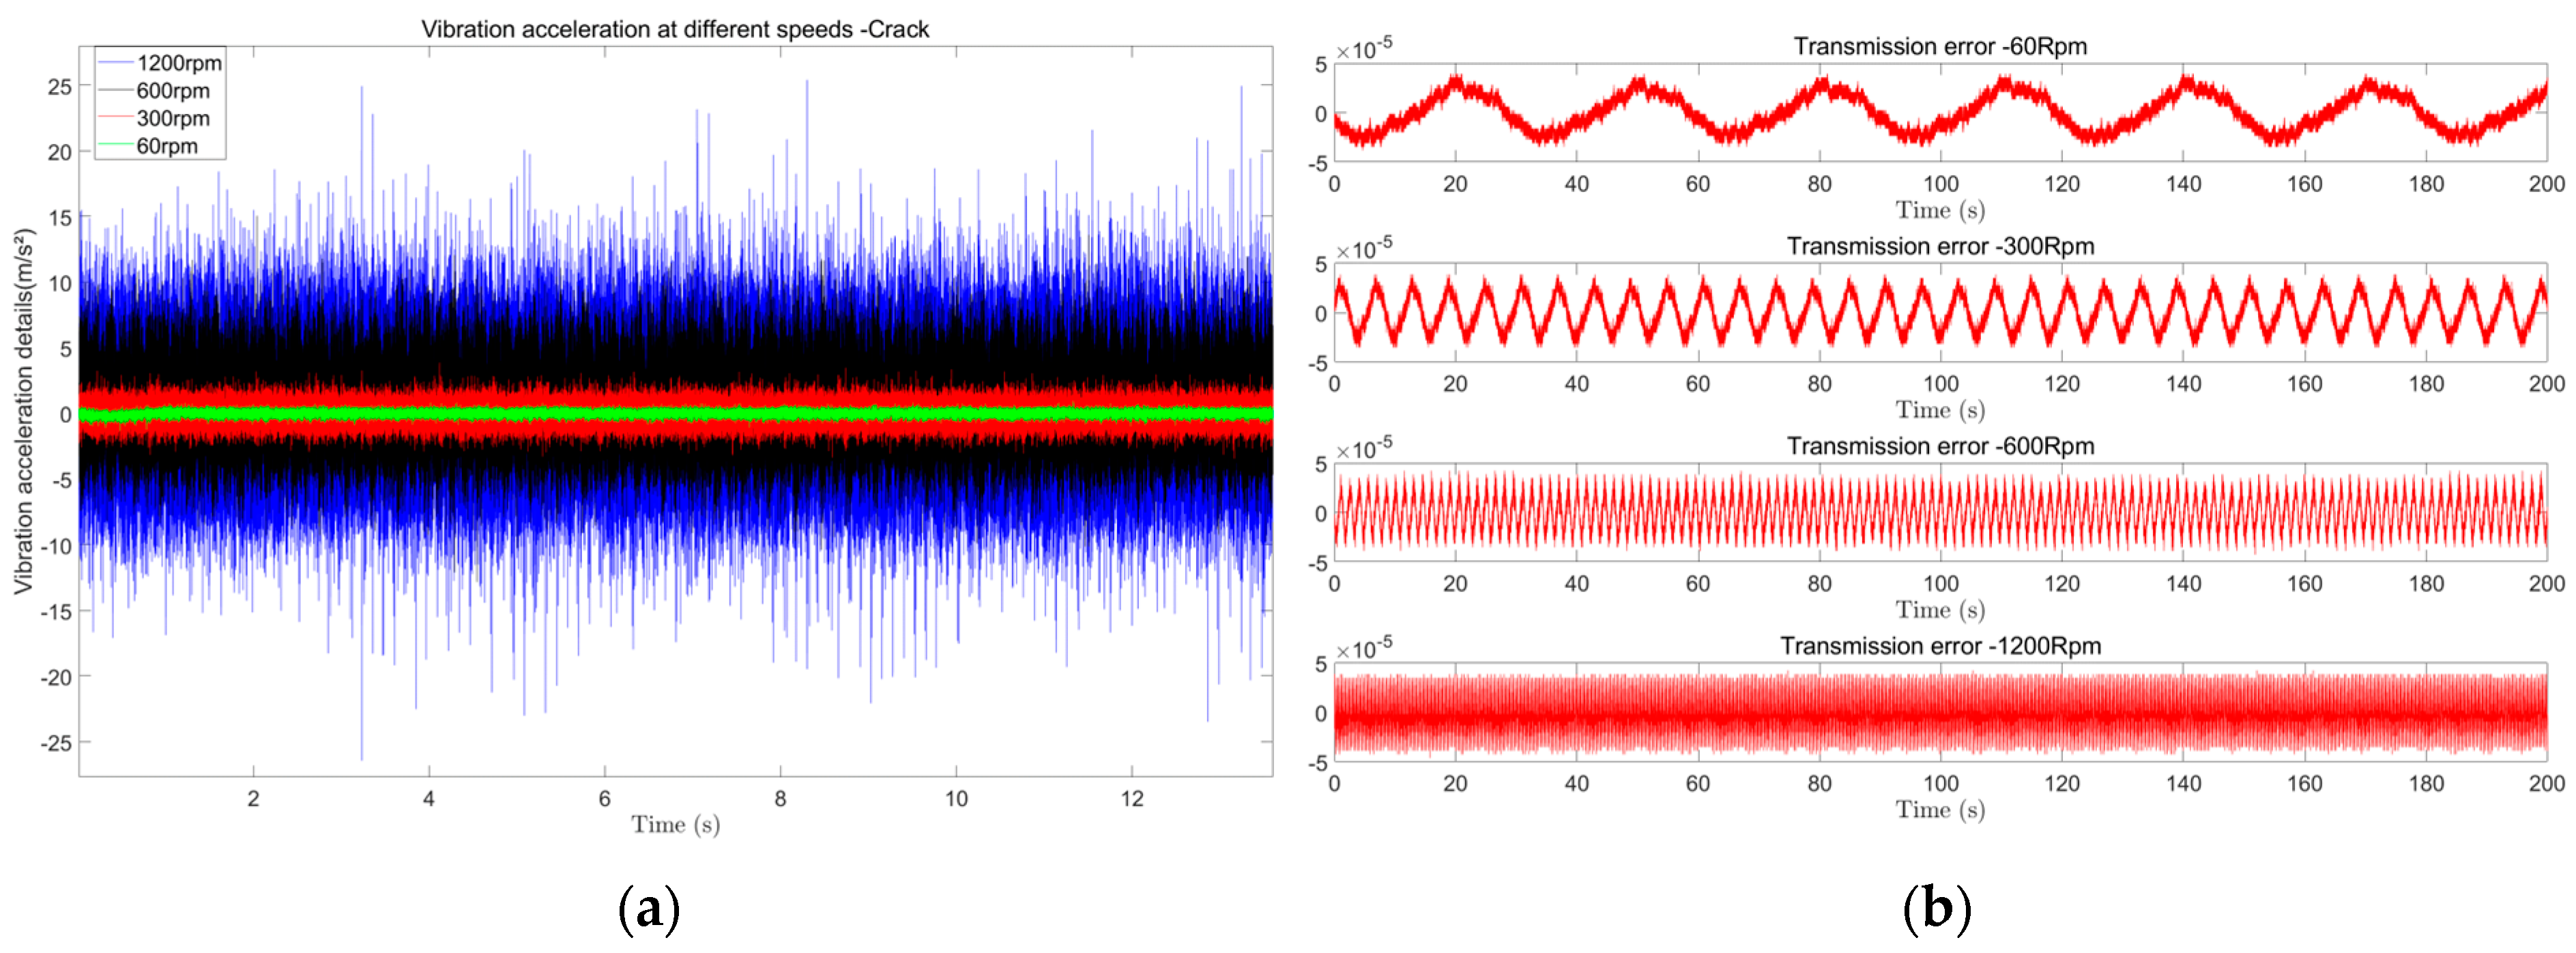
Subsequently, to assess rotational speed effects, we performed comparative testing on a cracked gear at four discrete speeds (60, 300, 600, and 1200 RPM), simultaneously recording vibration acceleration and transmission error signals. The acquired datasets are presented in Figure 27, highlighting speed-dependent dynamic behaviors.
As evident from Figure 27a, the vibration acceleration amplitude increases significantly with rotational speed. This amplification stems from heightened inertial forces at higher speeds (e.g., 1200 RPM), which enhance crack-induced impulse visibility, but it will also introduce broadband noise that may obscure faults. Conversely, low-speed operation (60 RPM) yields weaker vibration signals that risk being masked by sensor noise. Figure 27b demonstrates the transmission error signals’ superior robustness:
Speed invariance: Amplitude variation <5% across tested speeds (60–1200 RPM)
Diagnostic consistency: Fault features (e.g., crack-induced stiffness drops) remain identifiable regardless of speed.
Early fault sensitivity: Detects incipient cracks even at 60 RPM
These findings align with the dynamic model predictions in Figure 11, validating the theoretical framework.
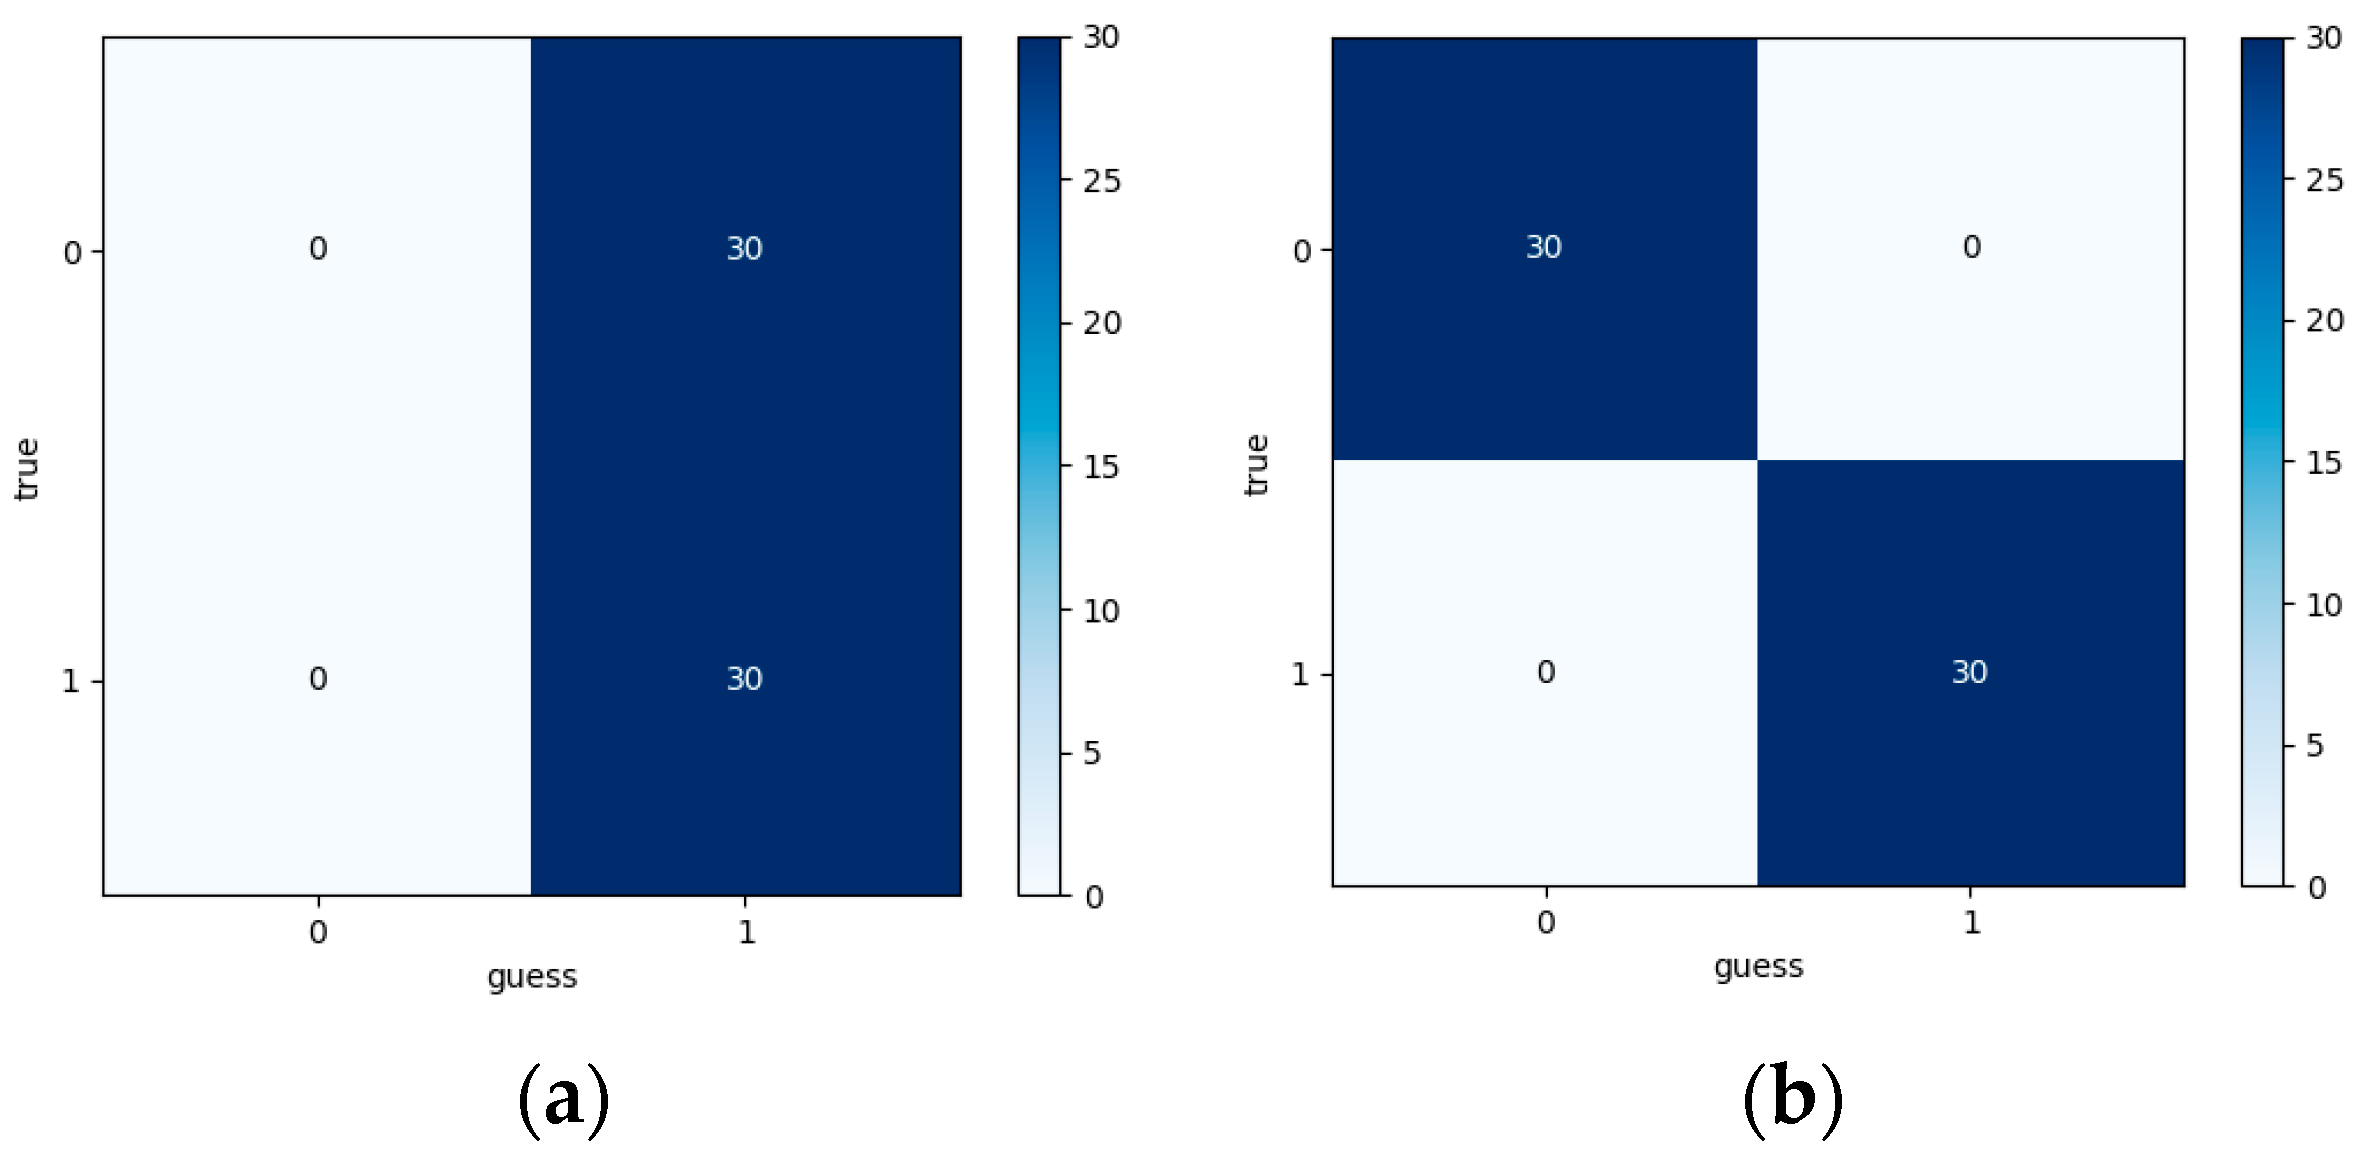
Using an existing 1DCNN model, the model was trained on normal (label 0) and crack (label 1) fault data under a 600 RPM and 10 Nm load. The vibration acceleration signal and the transmission error signal both achieved 100% accuracy.
This trained model was then used to identify normal and crack fault data under a 10 Nm load at 60 RPM. To ensure the data length used for identification remained the same as at 600 RPM the sampling frequency for the 60 RPM propagation error data was changed to 1000 Hz, and the sampling frequency for the vibration acceleration signal was changed to 1024 Hz.
The model trained using the 600 RPM normal and crack fault data was then used to identify normal and crack fault data at 60 RPM. At different speeds, the propagation error signal still achieved 100% accuracy, while the vibration acceleration signal showed 50% accuracy. As shown in Figure 28.
5.2. Gear Fault Diagnosis

Now, we use the vibration acceleration signal and transmission error signal obtained from the experiment as the data source for neural network training and fault diagnosis.

5.2.1. Diagnostic Results Under Different Loads

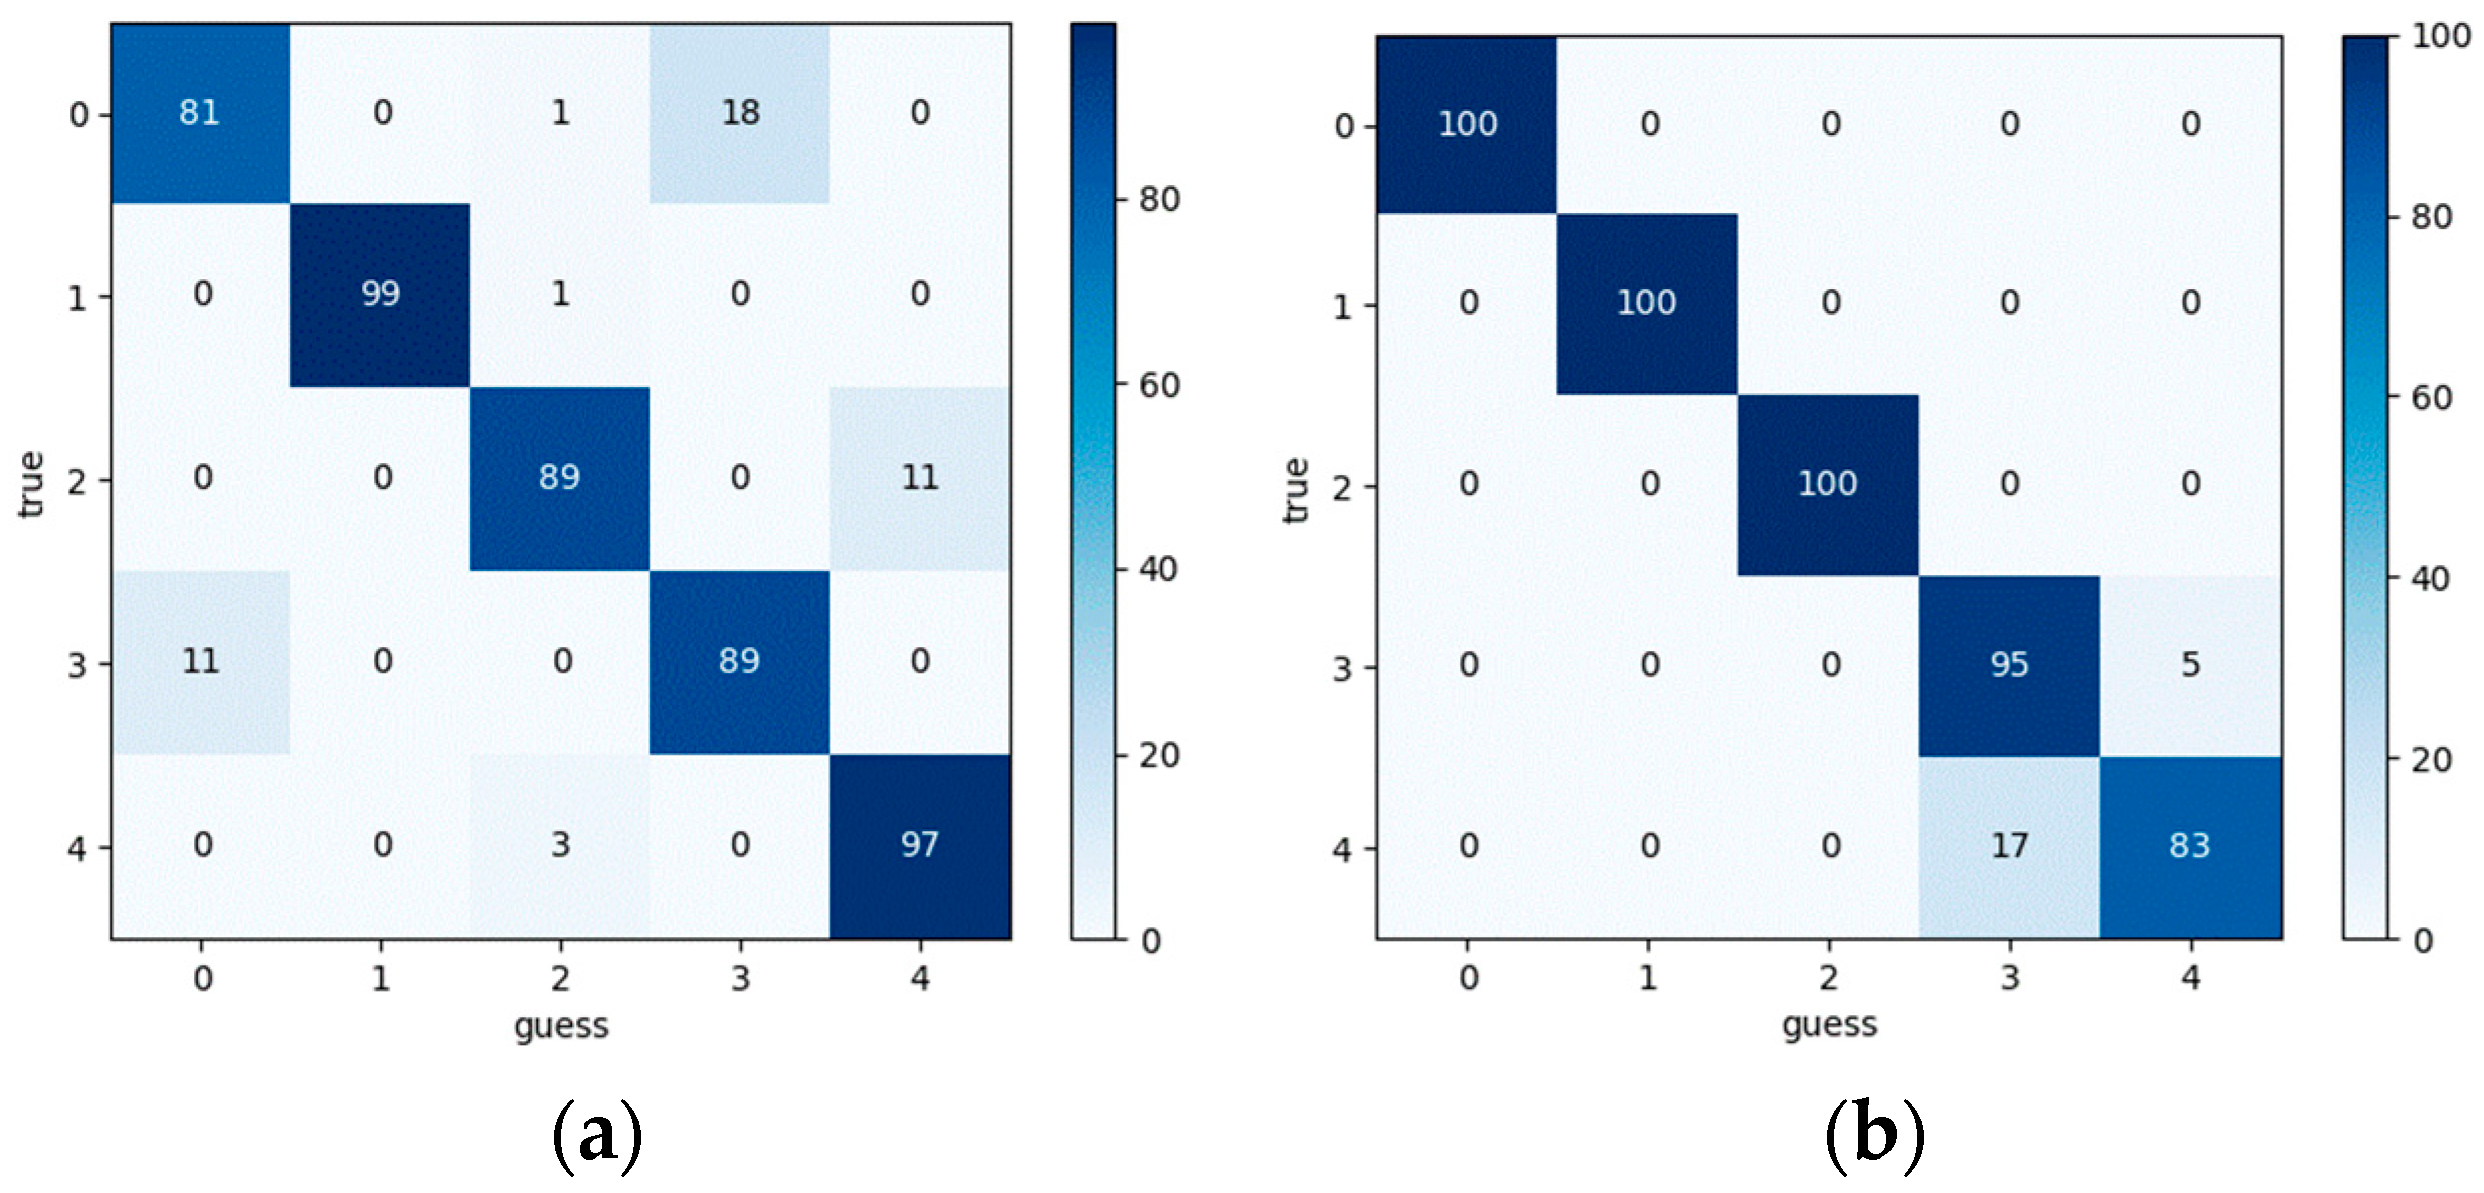
The experimental configuration was as follows: The input shaft speed was maintained at a constant 600 RPM. In contrast, the output shaft load was set to two operating conditions—0 Nm and 10 Nm—for data acquisition. All data were collected from the same test rig, ensuring consistency in neural network model architecture, parameter configuration, and dataset size. The dataset was partitioned into training (50%), validation (30%), and test (20%) subsets. Fault types were encoded as: 0—crack, 1—healthy, 2—pitting, 3—tooth breakage, 4—double cracks.
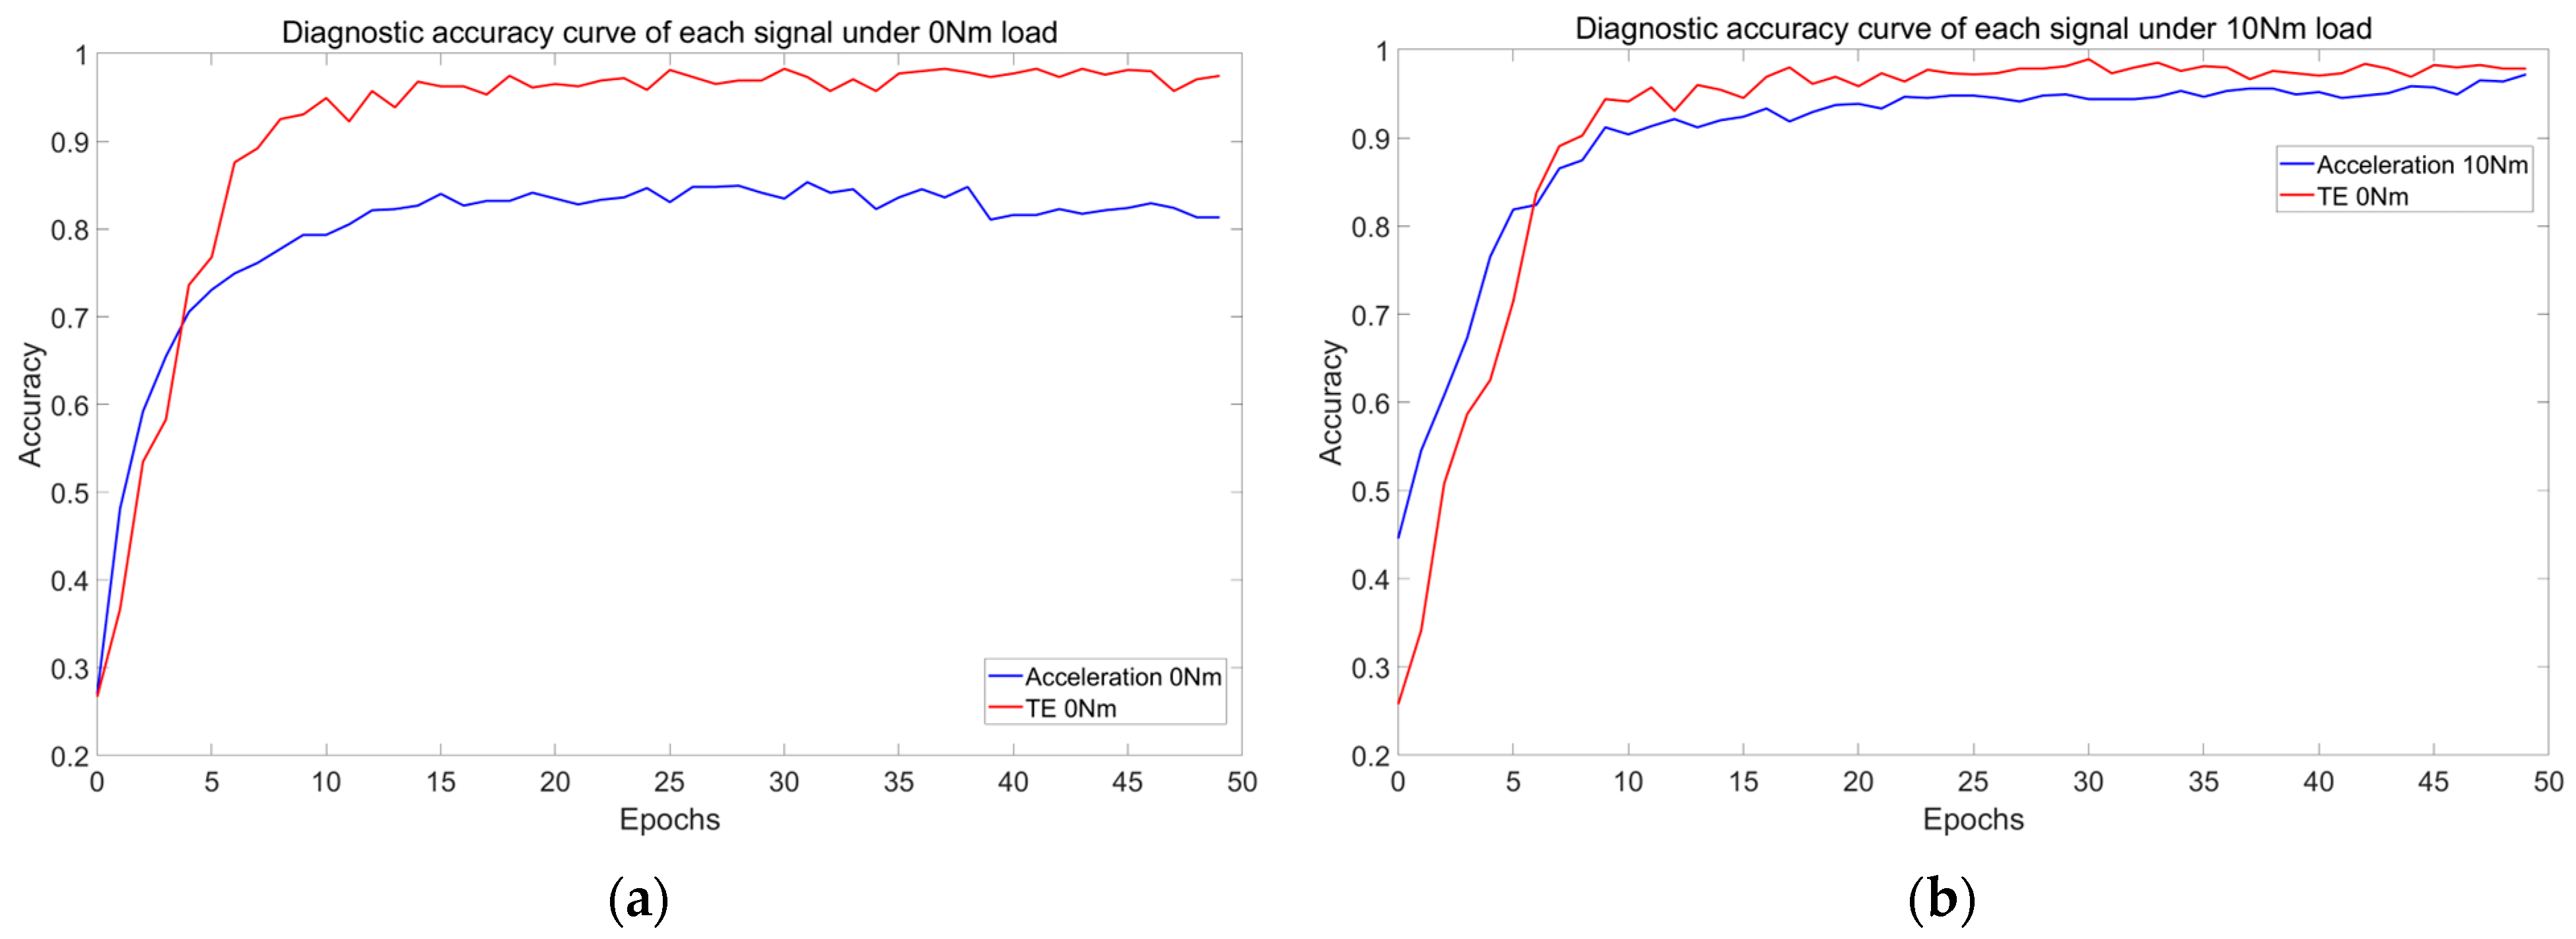
Figure 29 illustrates the diagnostic accuracy trends of different signals under varying load conditions.
As evidenced in Figure 29, the transmission error signals maintain stable diagnostic accuracy (99–100%) across varying load conditions, demonstrating exceptional robustness. In contrast, while vibration signals exhibit improved accuracy at higher loads (10 Nm), their overall performance remains inferior to TE.
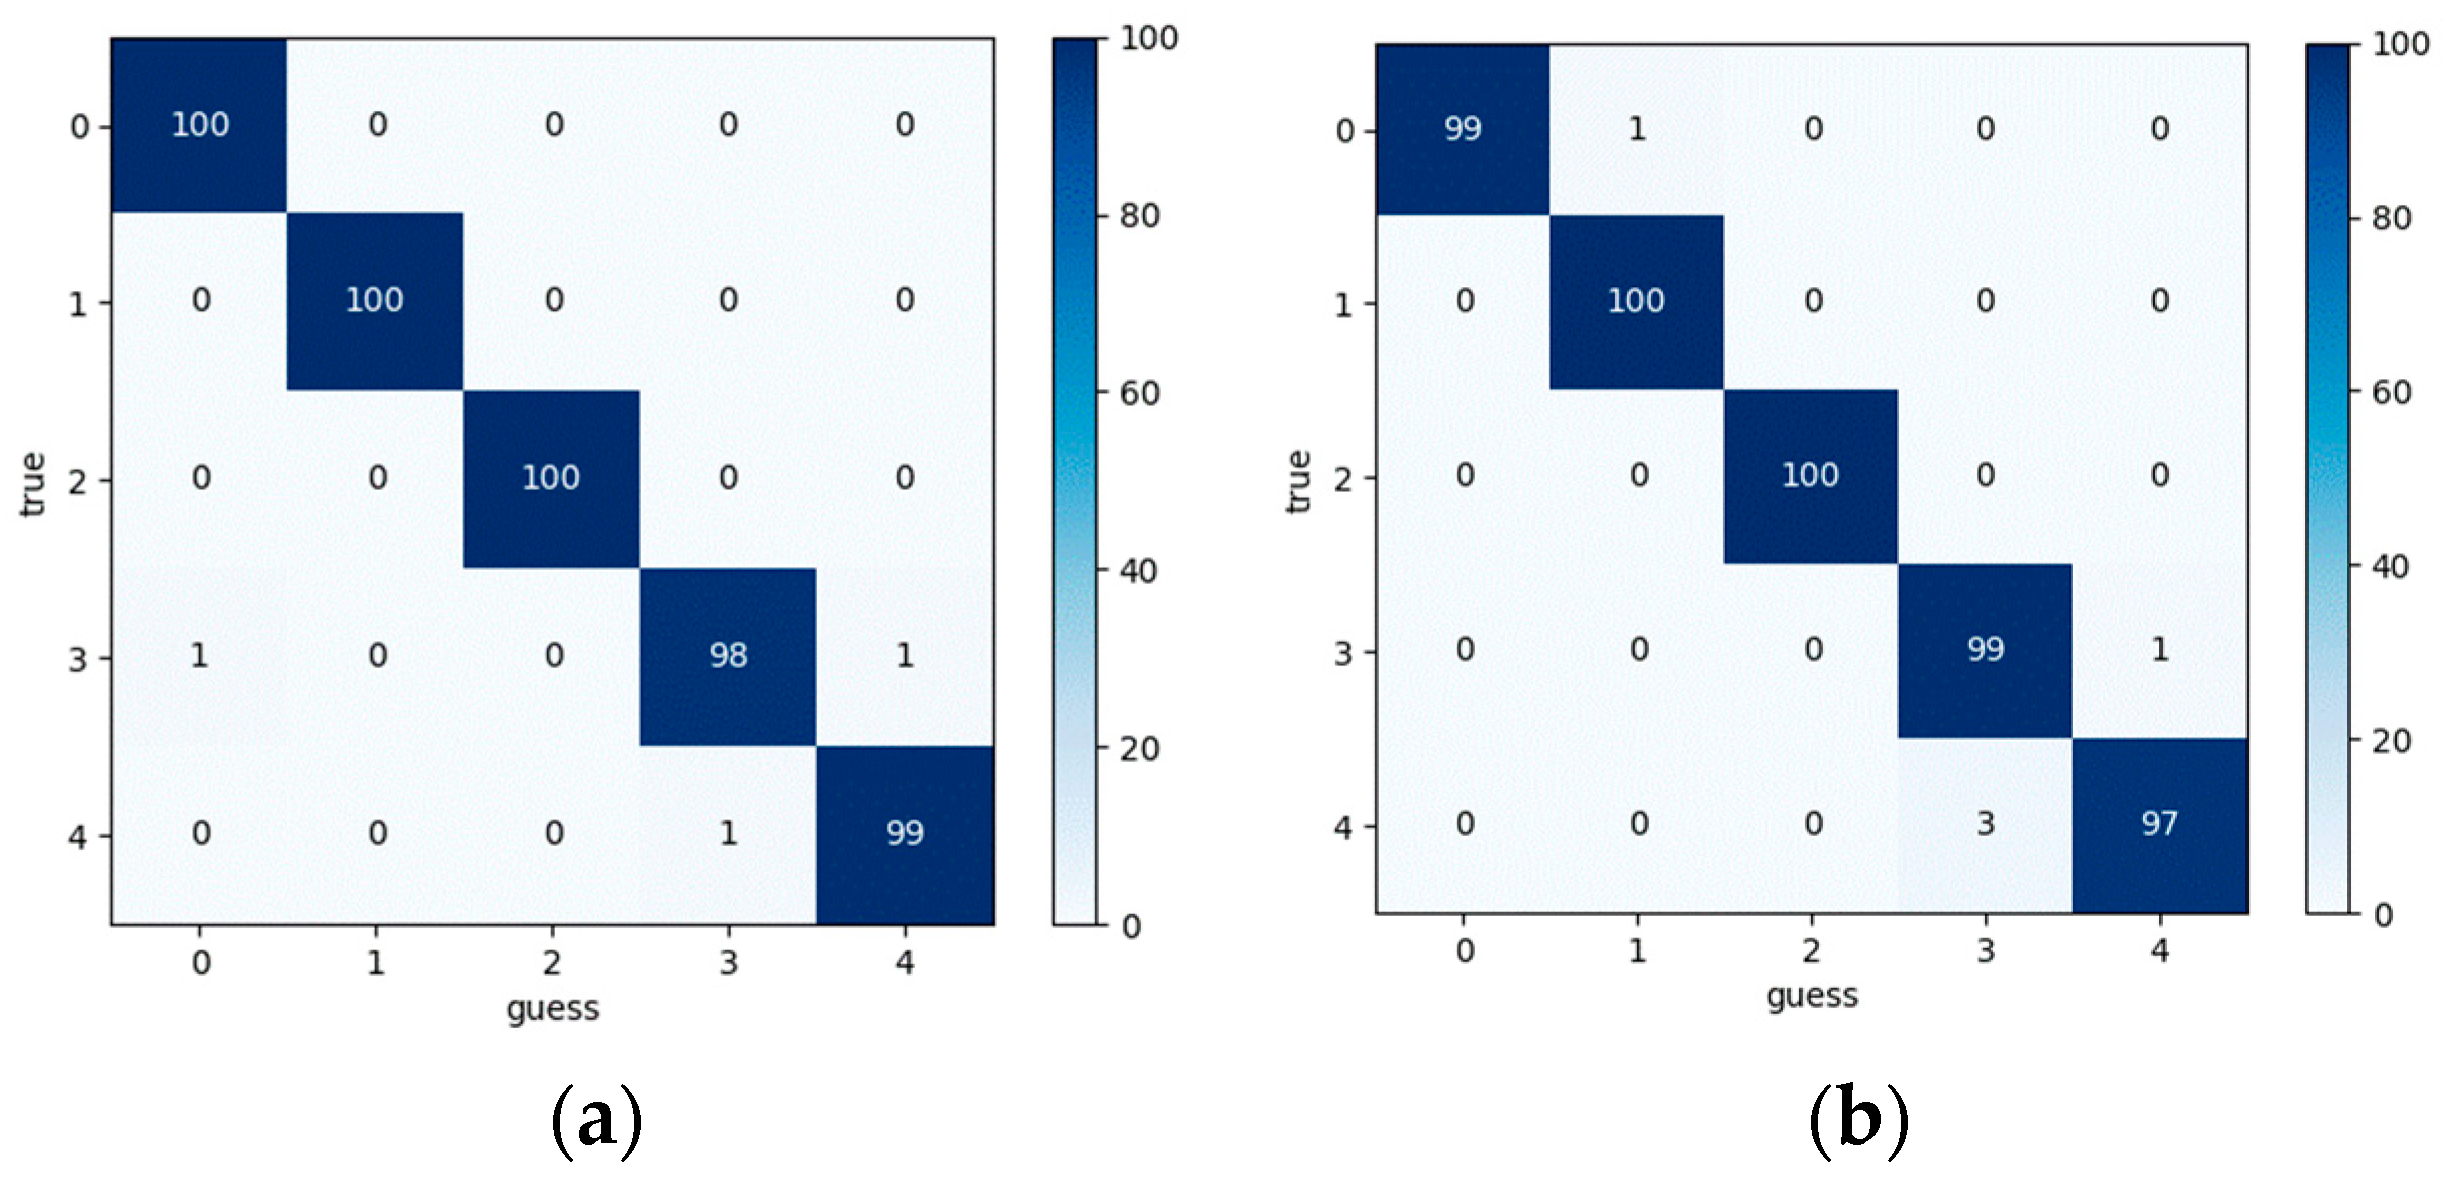
Key quantitative comparisons are summarized in Table 6, while Figure 30 and Figure 31 present the detailed confusion matrices for 0 Nm and 10 Nm conditions, respectively.

5.2.2. Fault Diagnosis Outcomes Using Limited Short-Time Samples

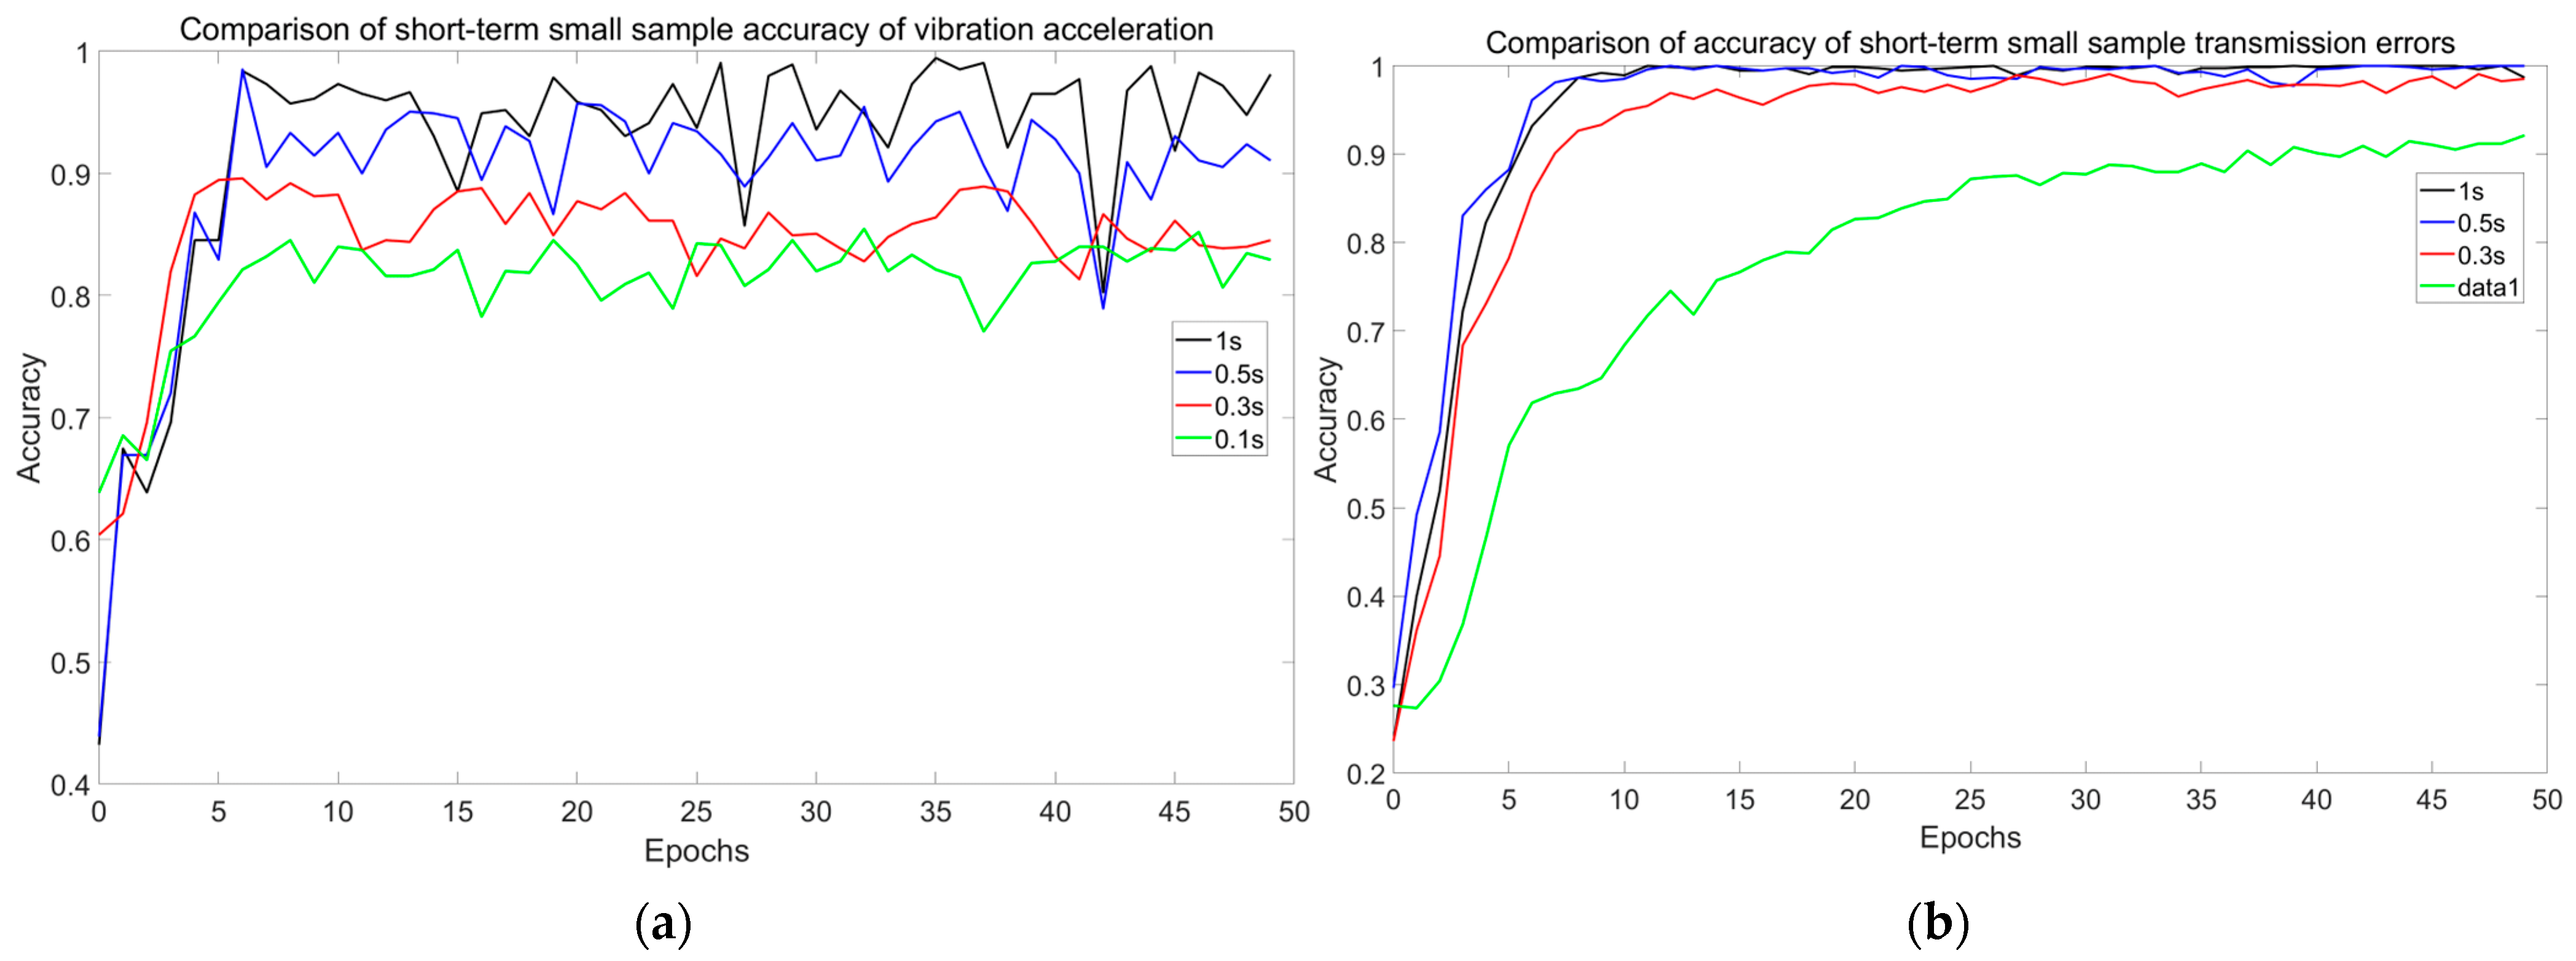
Now, let us compare the diagnostic accuracy of vibration acceleration signals and transmission error signals under different sample lengths. The signals were collected under the rated input shaft speed of 600 RPM and a no-load (0 Nm) condition on the output shaft. The experiment maintained the original neural network architecture, hyperparameter configuration, dataset splitting method (unchanged training/validation/test set ratio), and fault labeling system. For each fault type, the single-sample length was set to 0.5 s, 0.2 s, and 0.1 s, while keeping the total number of samples fixed at 500 and the step size at 100.
The variation curves of diagnostic accuracy for each signal under different sample lengths are shown in Figure 32.
As demonstrated in Figure 32, both signal types exhibit accuracy degradation and increased curve fluctuations with reduced sample lengths. However, compared to the vibration signal, the transmission error signal converges faster, experiences a slower decline in accuracy (6.8% drop at 90% sample reduction vs. vibration’s 13.8%), and remains relatively stable. These results indicate that the transmission error (TE) signal is less sensitive to reductions in data size and remains more accurate and stable than the vibration signal, making it a more reliable option for fault diagnosis when only limited data is available.
The diagnostic accuracy of the two signals at different sample lengths is shown in Table 7.
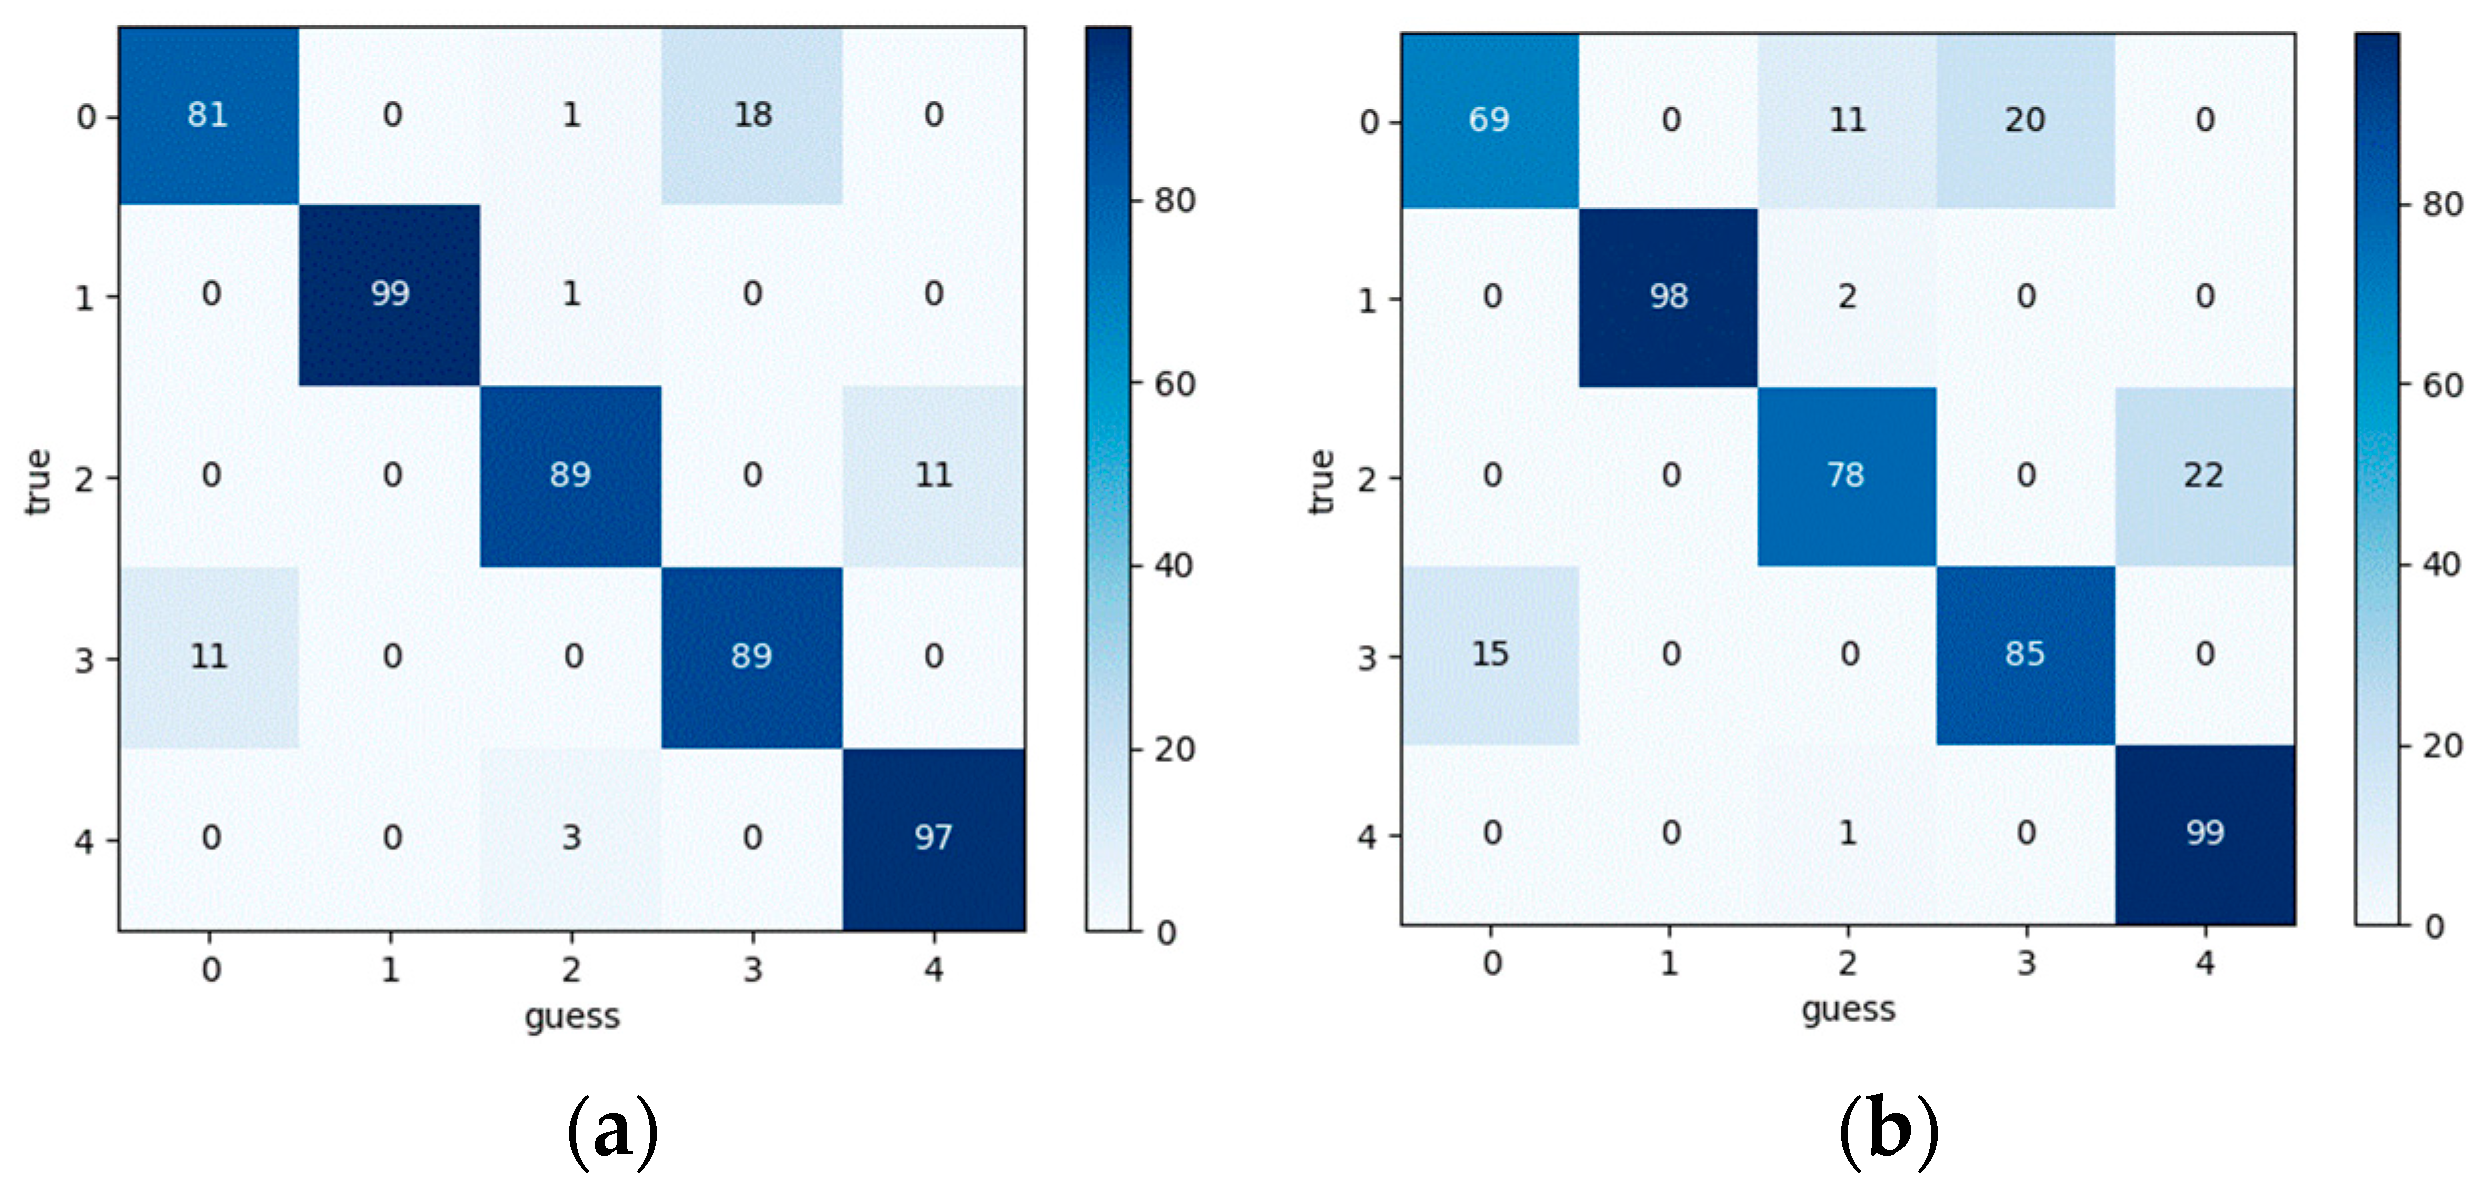
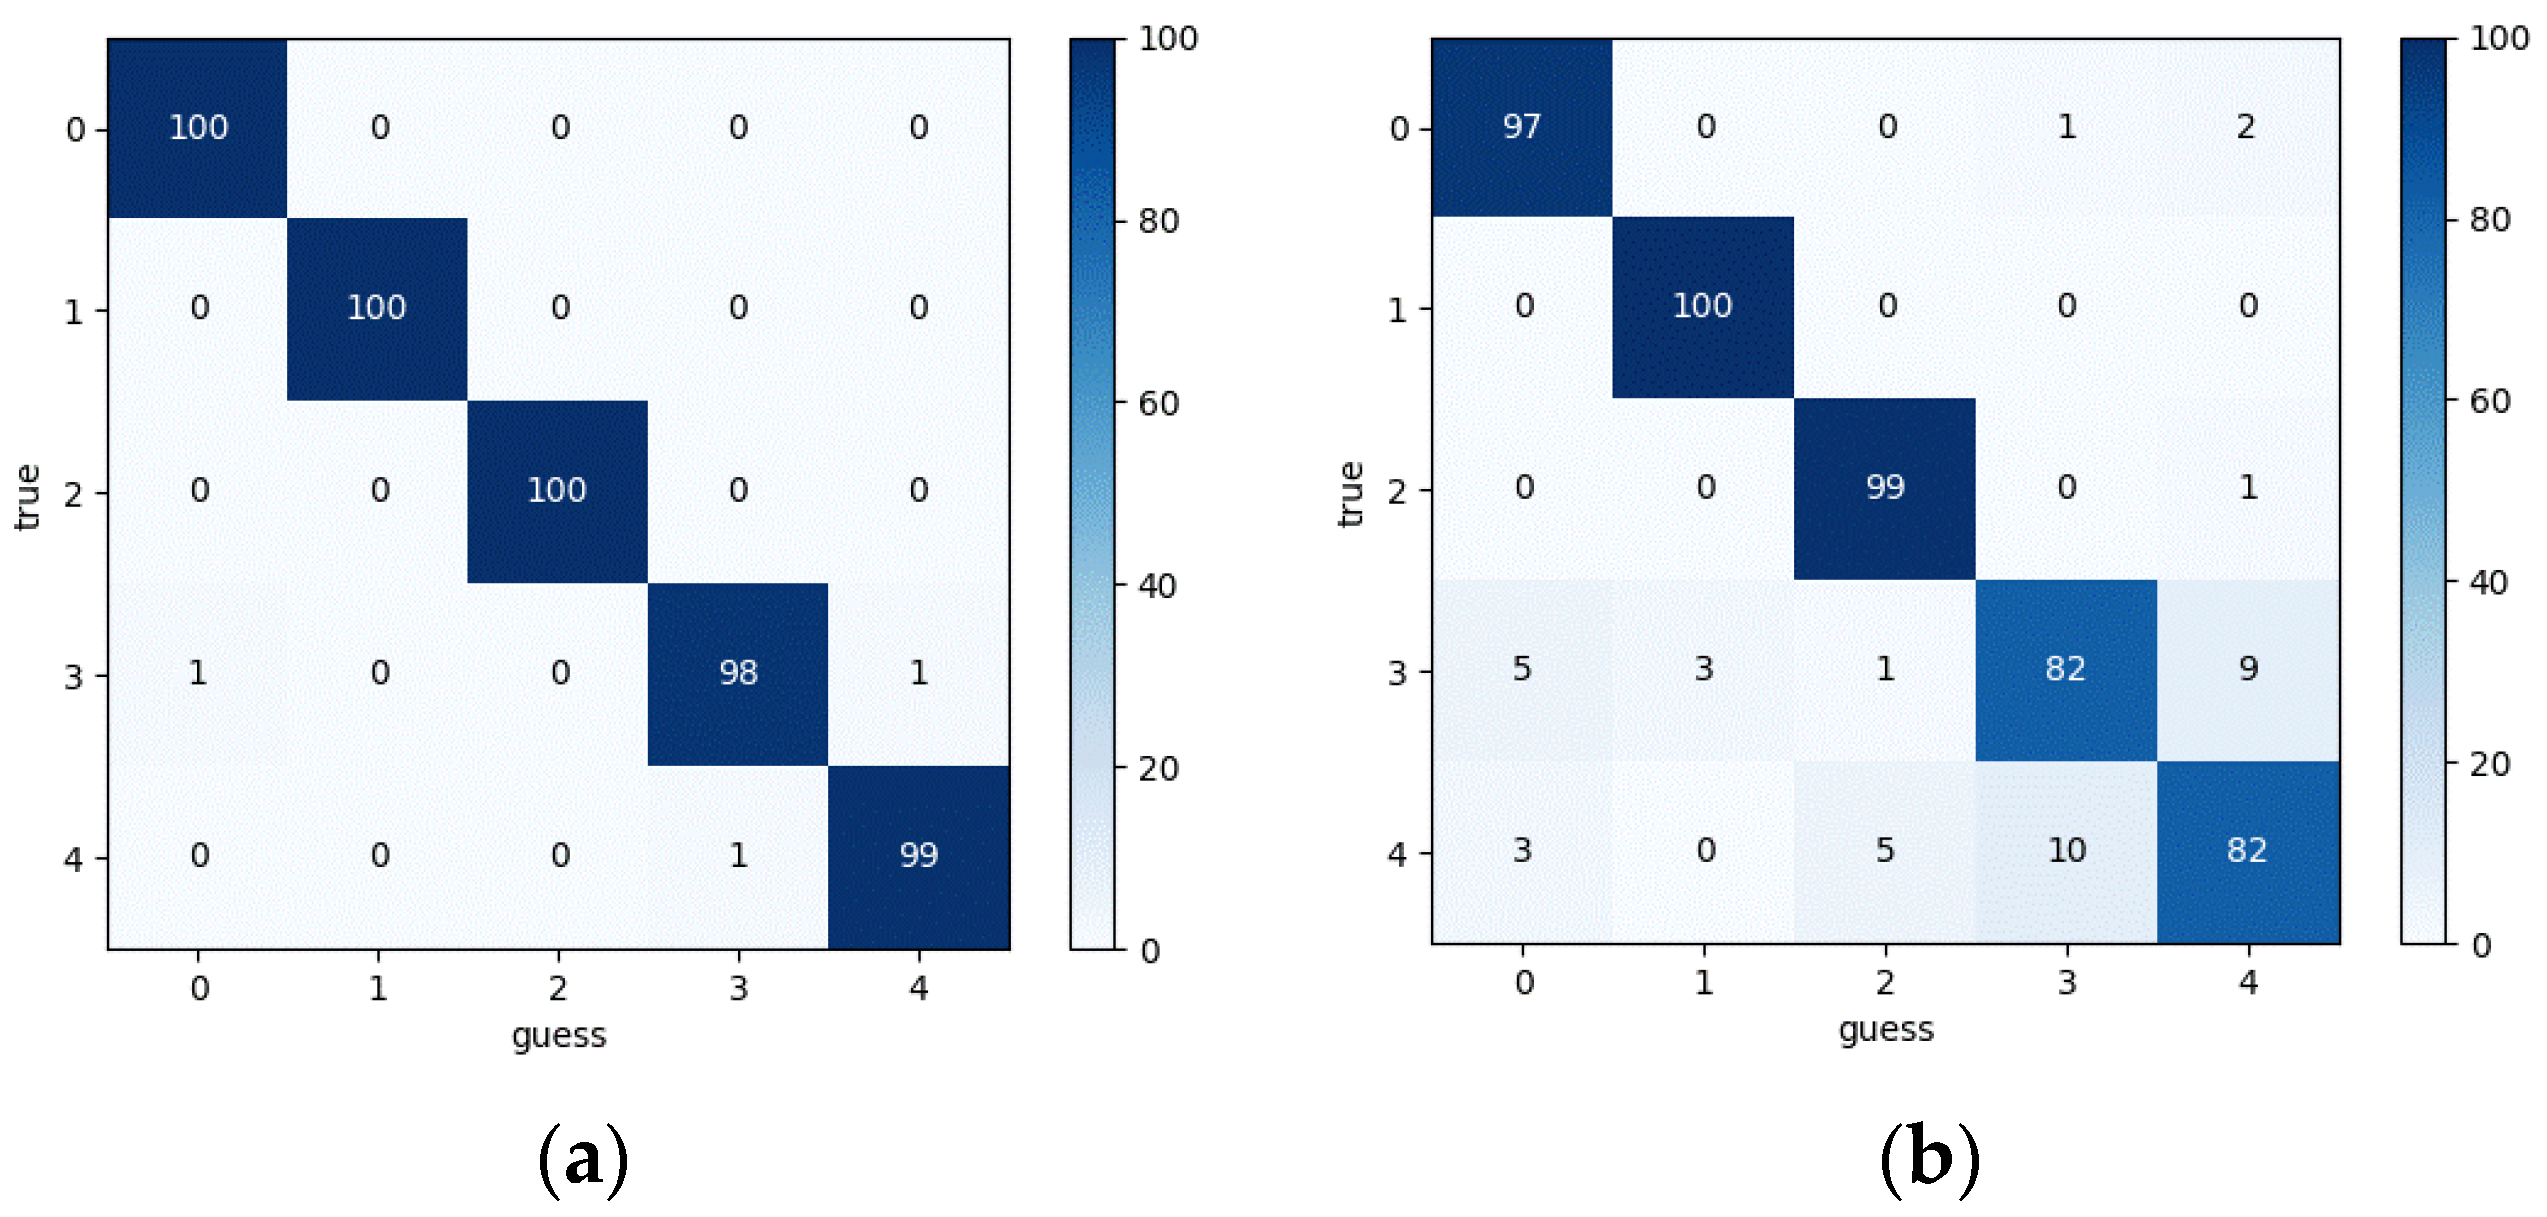
As demonstrated in Table 7, the vibration signal exhibits a significant accuracy decline when sample lengths are reduced below 0.5 s, whereas the transmission error signals maintain consistent accuracy (>90%) across all tested durations. To identify the specific fault classes contributing to this performance degradation, Figure 33 and Figure 34 present confusion matrices for both signal types at shortened sample lengths (0.2 s and 0.1 s).
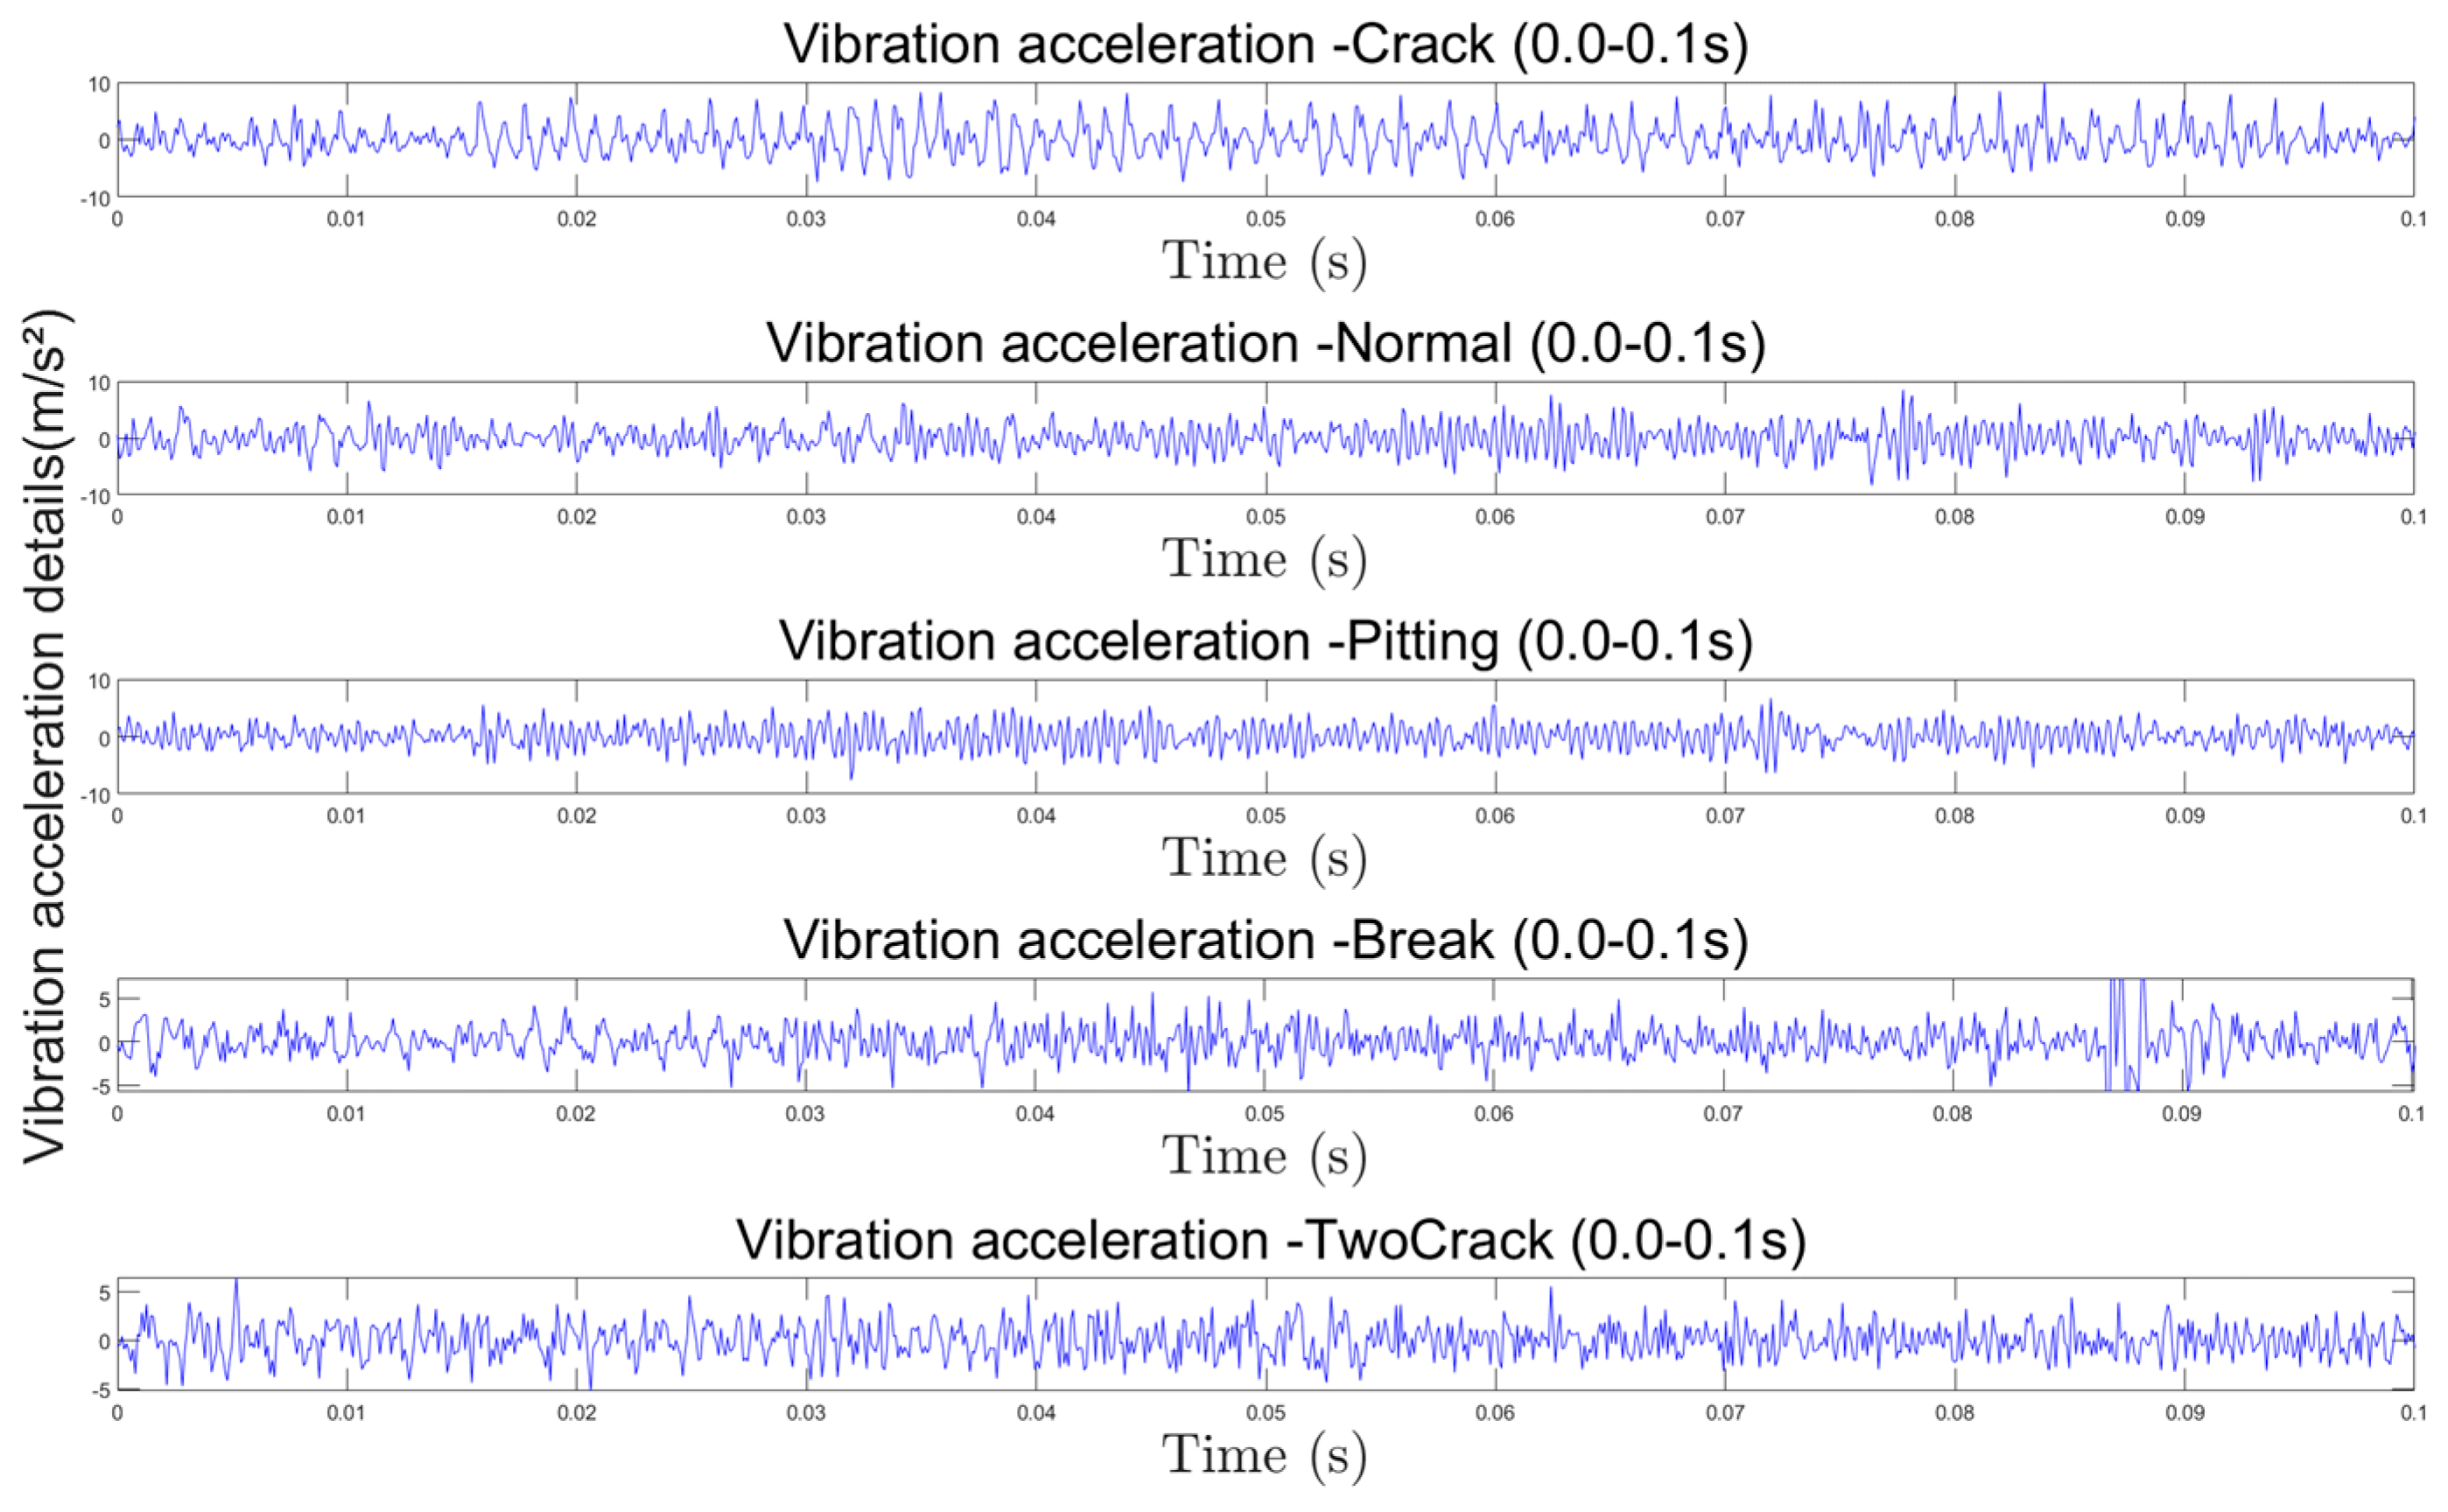
Figure 33 reveals significant misclassification in vibration-based diagnosis, particularly for Label 1 (healthy), Label 3 (tooth breakage), and Label 4 (double cracks). Observing the vibration acceleration signal in Figure 24a, it can be found that the fault area of the broken tooth fault signal is the most obvious, and an obvious mutation will appear in each rotation cycle. The amplitude of the normal gear signal is similar to that of the pitting signal, and the amplitude of the broken tooth signal outside the obvious mutation is similar to that of the double crack. It is more obvious when the details are magnified to 0 s to 0.1 s, as shown in Figure 35.
Figure 34 reveals significant misclassification between Label 3 (tooth breakage) and Label 4 (double cracks) during transmission error signal diagnosis. Referring to Figure 24b, the TE signals for these two fault types exhibit similar waveform trends, with tooth breakage showing marginally higher amplitudes and smoother profiles. However, under short sample lengths, the subtle distinctions between these fault signatures become indistinguishable, leading to reduced diagnostic accuracy.

6. Conclusions

Currently, gear fault diagnosis primarily utilizes vibration displacement signals and vibration acceleration signals as input data. However, vibration signals are susceptible to environmental noise interference, typically requiring longer data samples for reliable fault diagnosis. To address these issues, this paper proposes utilizing the influence relationship between meshing stiffness and transmission error during gear transmission to identify typical gear tooth faults.
This study first established a gear dynamics simulation model based on gear transmission system dynamics theory, incorporating three fault states: normal condition, wear, and cracks. Through numerical computation, the time-varying stiffness characteristics of gear teeth were obtained, while vibration displacement signals and transmission error signals were synchronously extracted as fault features. Analysis using a lightweight 1DCNN under different signal-to-noise ratios (SNRs) demonstrated that transmission error signals exhibit significant advantages, maintaining over 99% recognition accuracy across various noise conditions. In contrast, vibration displacement signals saw their accuracy sharply decrease to 40.3% at 0 dB SNR, fully validating the robustness of this method.
To validate the reliability of the theoretical model, the research further constructed a gear experimental platform with precise speed and load control. Comparative analysis of collected vibration acceleration and transmission error signals revealed that transmission error signals demonstrate better stability and fault diagnosis efficiency compared to vibration acceleration signals. Moreover, in fault diagnosis experiments with shortened sample durations, the study found that when other conditions remain consistent, transmission error signals still achieve higher diagnostic accuracy using shorter data samples.
Looking ahead, this approach can be extended in three crucial directions: Development of gear remaining lifespan prediction models; fault diagnosis of critical rotor system components (such as bearings and couplings); precise identification of compound faults.
Notably, these studies only require installing low-cost, easily deployable rotary encoders on transmission shafts. Although embedded sensor deployment still presents challenges, with the advancement of Industrial Internet of Things and standardized designs, a significant portion of machinery will have encoders or other basic sensors installed on critical internal components. This will provide richer data support for intelligent operation and maintenance.

Author Contributions

S.W.: Writing—original draft, Writing—review and editing, Investigation, Methodology. J.W.: Writing—review and editing, Funding acquisition, Conceptualization. N.W.: Validation, Supervision. A.K.: Formal analysis, Supervision. All authors have read and agreed to the published version of the manuscript.

Funding

This research was supported by the National Natural Science Foundation of China (Grant No. 12202318) and the Basic Scientific Research Project of Wenzhou City (G2023066).

Data Availability Statement

Data will be made available on request.

Acknowledgments

The authors acknowledge the use of ChatGPT 4.0 (OpenAI, https://chat.openai.com accessed on 1 October 2025.) for language improvement purposes only.

Conflicts of Interest

The authors declare no conflicts of interest. The funders had no role in the design of the study; in the collection, analyses, or interpretation of data; in the writing of the manuscript; or in the decision to publish the results.

References

  1. Márquez, F.P.G.; Tobias, A.M.; Pérez, J.M.P.; Papaelias, M. Condition monitoring of wind turbines: Techniques and methods. Renew. Energy 2021, 46, 169–178. [Google Scholar] [CrossRef]
  2. Scheu, M.N.; Tremps, L.; Smolka, U.; Kolios, A.; Brennan, F. A systematic failure mode effects and criticality analysis for offshore wind turbine systems towards integrated condition based maintenance strategies. Ocean Eng. 2019, 176, 118–133. [Google Scholar] [CrossRef]
  3. Wu, L.; Zhang, X.; Wang, J.; Liu, Z.; Gong, Z. An enhanced minimum entropy deconvolution with adaptive filter parameters for gear fault diagnosis. Measurement 2023, 206, 112346. [Google Scholar] [CrossRef]
  4. Lei, Y.; Lin, J.; Zuo, M.J.; He, Z. Condition monitoring and fault diagnosis of planetary gearboxes: A review. Measurement 2014, 48, 292–305. [Google Scholar] [CrossRef]
  5. Smith, J.D. Gear Noise and Vibration, 2nd ed.; Marcel Dekker Inc.: New York, NY, USA, 2003. [Google Scholar]
  6. Kong, Y.; Jiang, H.; Dong, N.; Shang, J.; Yu, P.; Li, J. Manhua Yu and Lan Chen. Analysis of Time-Varying Mesh Stiffness and Dynamic Response of Gear Transmission System with Pitting and Cracking Coupling Faults. Machines 2023, 11, 500. [Google Scholar] [CrossRef]
  7. Yu, J.; Wang, S.; Wang, L.; Sun, Y. Gearbox fault diagnosis based on a fusion model of virtual physical model and data-driven method. Mech. Syst. Signal Process. 2023, 188, 109980. [Google Scholar] [CrossRef]
  8. Niu, H.; Chen, H.; Hu, A.; Zhai, Y. Investigation of mesh force features under different planet tooth faults in planetary gearboxes. Eng. Fail. Anal. 2024, 159, 108122. [Google Scholar] [CrossRef]
  9. He, G.; Ding, K.; Wu, X.; Yang, X. Dynamics modeling and vibration modulation signal analysis of wind turbine planetary gearbox with a floating sun gear. Renew. Energy 2019, 139, 718–729. [Google Scholar] [CrossRef]
  10. McFadden, P.D. Examination of a technique for the early detection of failure in gears by signal processing of the time domain average of the meshing vibration. Mech. Syst. Signal Process. 1987, 1, 173–183. [Google Scholar] [CrossRef]
  11. Feng, Z.; Liang, M.; Zhang, Y.; Hou, S. Fault diagnosis for wind turbine planetary gearboxes via demodulation analysis based on ensemble empirical mode decomposition and energy separation. Renew. Energy 2012, 47, 112–126. [Google Scholar] [CrossRef]
  12. Zarei, J.; Tajeddini, M.A.; Karimi, H.R. Vibration analysis for bearing fault detection and classification using an intelligent filter. Mechatronics 2014, 24, 151–157. [Google Scholar] [CrossRef]
  13. Chin, Y.; Borghesani, P.; Mao, Y.; Smith, W.A.; Randall, R.B. Use of transmission error for a quantitative estimation of root-crack severity in gears. Mech. Syst. Signal Process. 2022, 171, 108957. [Google Scholar] [CrossRef]
  14. Randall, R.B.; Peng, D.; Smith, W.A. Using measured transmission error for diagnostics of gears. In Proceedings of the SIRM 2019—13th International Conference on Dynamics of Rotating, Copenhagen, Denmark, 13–15 February 2019. [Google Scholar]
  15. Chaari, F.; Fakhfakh, T.; Haddar, M. Analytical modelling of spur gear tooth crack and influence on gearmesh stiffness. Eur. J. Mech.-A/Solids 2009, 28, 461–468. [Google Scholar] [CrossRef]
  16. Ma, H.; Song, R.; Pang, X.; Wen, B. Time-varying mesh stiffness calculation of cracked spur gears. Eng. Fail. Anal 2014, 44, 179–194. [Google Scholar] [CrossRef]
  17. Yang, D.C.H.; Lin, J.Y. Hertzian damping, tooth friction and bending elasticity in gear impact dynamics. J. Mech. Des. Trans. ASME 1987, 109, 189–196. [Google Scholar] [CrossRef]
  18. Wang, J.; He, G.; Zhang, J.; Zhao, Y.; Yao, Y. Nonlinear dynamics analysis of the spur gear system for railway locomotive. Mech. Syst. Signal Process. 2017, 85, 41–55. [Google Scholar] [CrossRef]
  19. Wan, Z.; Cao, H.; Zi, Y.; He, W.; Chen, Y. Mesh stiffness calculation using an accumulated integral potential energy method and dynamic analysis of helical gears. Mech. Mach. Theory 2015, 92, 447–463. [Google Scholar] [CrossRef]
  20. Bartelmus, W. Mathematical Modeling and Computer Simulations as An Aid to Gearbox Diagnostics. Mech. Syst. Signal Process. 2001, 15, 855–871. [Google Scholar] [CrossRef]
  21. Tian, X.H. Dynamic Simulation for System Response of Gearbox Including Localized Gear Faults. Master’s Thesis, University of Alberta, Edmonton, AB, Canada, 2004. [Google Scholar]
  22. Chaari, F.; Baccar, W.; Abbes, M.S.; Haddar, M. Effect of spalling or tooth breakage on gearmesh stiffness and dynamic response of a one-stage spur gear transmission. Eur. J. Mech. A–Solids 2008, 27, 691–705. [Google Scholar] [CrossRef]
  23. Chen, Z.; Shao, Y. Dynamic simulation of spur gear with tooth root crack propagating along tooth width and crack depth. Eng. Fail. Anal. 2011, 18, 2149–2164. [Google Scholar] [CrossRef]
  24. Wu, S.; Zuo, M.J.; Parey, A. Simulation of spur gear dynamics and estimation of fault growth. J. Sound Vib. 2008, 317, 608–624. [Google Scholar] [CrossRef]
  25. Liang, X.; Zuo, M.J.; Pandey, M. Analytically evaluating the influence of crack on the mesh stiffness of a planetary gear set. Mech. Mach. Theory 2014, 76, 20–38. [Google Scholar] [CrossRef]
  26. Liang, X.H.; Zhang, H.S.; Liu, L.B.; Zuo, M.J. The influence of tooth pitting on the mesh stiffness of a pair of external spur gears. Mech. Mach. Theory 2016, 106, 1–15. [Google Scholar] [CrossRef]
  27. Wang, Q.; Xu, F. A novel rolling bearing fault diagnosis method based on Adaptive Denoising Convolutional Neural Network under noise background. Measurement 2023, 218, 113209. [Google Scholar] [CrossRef]
Figure 1. Gear transmission system dynamic model.
Machines 13 01093 g001
Figure 2. Gear tooth equivalent calculation model.
Machines 13 01093 g002
Figure 3. Matrix deformation stiffness model.
Machines 13 01093 g003
Figure 4. Gear meshing diagram.
Machines 13 01093 g004
Figure 5. Time-varying mesh stiffness of gears under normal conditions.
Machines 13 01093 g005
Figure 6. Cracked gear model.
Machines 13 01093 g006
Figure 7. Meshing stiffness at different crack depths.
Machines 13 01093 g007
Figure 8. Circular pitting model.
Machines 13 01093 g008
Figure 9. Pitting gear model.
Machines 13 01093 g009
Figure 10. Meshing stiffness at different pitting levels.
Machines 13 01093 g010
Figure 11. Gear transmission error at different speeds under normal circumstances.
Machines 13 01093 g011
Figure 12. Gear transmission error at different crack depths.
Machines 13 01093 g012
Figure 13. Amplified diagram of gear transmission error at different crack depths.
Machines 13 01093 g013
Figure 14. Comparison of broken teeth and normal gears.
Machines 13 01093 g014
Figure 15. Comparison of pitting teeth and normal gears.
Machines 13 01093 g015
Figure 16. Amplified diagram of gear transmission error at different pitting degrees.
Machines 13 01093 g016
Figure 17. Gear vibration signals at different crack depths.
Machines 13 01093 g017
Figure 18. Gear vibration signals at different pitting degrees.
Machines 13 01093 g018
Figure 19. Diagnostic accuracy curve of the signal under different signal-to-noise ratios (a) Vibration signal; (b) Transmission error signal.
Machines 13 01093 g019
Figure 20. Vibration acceleration signal diagnosis confusion matrix (a) Noise-free; (b) 0 dB.
Machines 13 01093 g020
Figure 21. Vibration transmission error signal diagnosis confusion matrix (a) Noise-free; (b) 0 dB.
Machines 13 01093 g021
Figure 22. Test rig of spur gears.
Machines 13 01093 g022
Figure 23. Faulty gear teeth.
Machines 13 01093 g023
Figure 24. Normal and faulty gear vibration acceleration and transmission error signals.
Machines 13 01093 g024
Figure 25. Frequency characteristics of transmission error signal (a) overall situation; (b) local situation.
Machines 13 01093 g025
Figure 26. The transmission error signal after filtering.
Machines 13 01093 g026
Figure 27. Vibration acceleration signal and transmission error signal at different speeds (a) Vibration acceleration signal; (b) Transmitting error signal.
Machines 13 01093 g027
Figure 28. Diagnostic confusion matrix of vibration acceleration signal and transmission error signal at 60 RPM (a) Vibration acceleration; (b) Transmission error.
Machines 13 01093 g028
Figure 29. Diagnostic accuracy curve of the signal under different loads (a) 0 Nm Load; (b) 10 Nm Load.
Machines 13 01093 g029
Figure 30. Vibration acceleration signal diagnosis confusion matrix (a) 0 Nm; (b) 10 Nm.
Machines 13 01093 g030
Figure 31. Transmission error signal diagnosis confusion matrix (a) 0 Nm; (b) 10 Nm.
Machines 13 01093 g031
Figure 32. Diagnostic accuracy curve of each signal under short-term and small sample conditions (a) vibration acceleration signal; (b) transmission error signal.
Machines 13 01093 g032
Figure 33. Vibration acceleration signal diagnosis confusion matrix (a) 0.2 s; (b) 0.1 s.
Machines 13 01093 g033
Figure 34. Transmission error signal diagnosis confusion matrix (a) 0.2 s; (b) 0.1 s.
Machines 13 01093 g034
Figure 35. The 0 s–0.1 s vibration signal details.
Machines 13 01093 g035
Table 1. The coefficient values in (23) [22,23].
A i B i C i D i E i F i
L * −5.574 × 10−51.9986 × 10−3−2.3015 × 10−44.7702 × 10−30.02716.8045
M * 60.111 × 10−5−28.10 × 10⁻³−83.431 × 10⁻⁴−9.9256 × 10−30.16240.9086
P * −50.952 × 10−5185.50 × 10−30.0538 × 10−453.3 × 10−30.28950.9236
Q * −6.2042 × 10−59.0889 × 10−3−4.0964 × 10−47.8297 × 10−3−0.14720.6904
Table 2. Main parameters of the spur gear meshing gear pair [21].
Driving GearDriven Gear
Modulus (mm)3.1753.175
Pressure Angle (°)2020
Clearance coefficient0.250.25
Addendum coefficient11
Young’s modulus (Pa)2.068 × 10112.068 × 1011
Poisson’s ratio0.30.3
Number of teeth1948
Tooth width (mm)1616
Aperture (mm)1743
Mass moment of inertia of the pinion (kg m2)4.3659 × 10−48.3602 × 10−3
Radial stiffness of the bearing (N/m)6.56 × 1076.56 × 107
Damping coefficient of the bearing (Ns/m)1.8 × 1051.8 × 105
Table 3. Different degrees of cracks.
10%30%50%70%100%
c 1 mm 0.78222.34663.9113.911-
c 2 mm 0001.5644-
Table 4. Model parameter table.
Network LayerKernel SizeStride ChannelsData Dimension
Input Layer---2000 × 1
Conv13142000 × 4
MaxPool122-1000 × 4
Conv23181000 × 8
MaxPool222-500 × 8
Flatten---4000
Dense---32
SoftMax---5
Table 5. Diagnostic accuracy of signals at different signal-to-noise ratios.
Noise-Free20 dB10 dB0 dB
Vibration signal94.03%75.37%64.93%40.30%
Transmission error100%100%100%99.25%
Table 6. Diagnostic accuracy of signals under different loads ratios.
0 Nm10 Nm
Vibration acceleration91.00%95.60%
Transmission error99.4%99%
Table 7. Diagnostic accuracy of signals at different sample lengths.
1.0 s0.5 s0.2 s0.1 s
Vibration acceleration98.60%97.60%91.00%85.80%
Transmission error100%99.80%98.80%93.20%
Disclaimer/Publisher’s Note: The statements, opinions and data contained in all publications are solely those of the individual author(s) and contributor(s) and not of MDPI and/or the editor(s). MDPI and/or the editor(s) disclaim responsibility for any injury to people or property resulting from any ideas, methods, instructions or products referred to in the content.