1. Introduction
Driven by the rapid advancement of intelligent manufacturing and Industry 4.0, the global manufacturing industry is progressively evolving toward higher levels of intelligence, automation, and efficiency [
1]. As a fundamental pillar of modern production systems, computer numerical control (CNC) machining technology is undergoing a paradigm shift from traditional experience-driven methods to data-driven intelligent optimization [
2]. Within this framework, cutting tools, as the core executive components of CNC machine tools, play a decisive role in determining machining precision, surface integrity, and operational stability [
3]. However, abnormal tool wear not only deteriorates product quality but may also cause tool breakage, machine damage, or even safety accidents, thereby severely compromising production efficiency and economic performance [
4]. Studies indicate that unplanned downtime resulting from tool wear can account for up to 20% of total machine downtime, while tool replacement and maintenance expenses represent approximately 3–12% of total manufacturing costs [
5]. Furthermore, due to the inherent complexity, nonlinearity, and irreversibility of the machining process, tool wear behavior varies significantly under different cutting conditions, exhibiting strong uncertainty and nonstationarity [
6]. Consequently, the development of real-time, accurate, and reliable tool wear monitoring systems has become a critical scientific and engineering challenge in the field of intelligent manufacturing [
7].
Currently, cutting force and vibration signals have become the two most commonly used types of data in tool condition monitoring. Cutting force signals primarily capture the steady-state mechanical variations that occur during machining, while vibration signals are more sensitive to transient dynamic behaviors and high-frequency responses [
8]. By integrating additional modalities such as acoustic emission and temperature signals, a more comprehensive characterization of the tool wear process can be achieved [
9]. Traditional machine learning algorithms, such as Support Vector Machines (SVM) and Random Forests (RF), have achieved certain success in tool condition classification [
10]. However, these approaches rely heavily on handcrafted feature extraction and expert domain knowledge, which limits their adaptability to complex multimodal signal environments and reduces their ability to generalize under varying cutting conditions [
11].
To overcome the aforementioned limitations, deep learning techniques have been extensively applied in the field of tool wear monitoring [
12]. Compared with traditional approaches, deep learning enables automatic extraction of high-dimensional and complex features through an end-to-end network architecture, effectively eliminating the need for manual feature engineering [
13]. Among these methods, convolutional neural networks (CNNs) have demonstrated exceptional performance in processing signal representations such as time–frequency maps and spectrograms, allowing for the in-depth mining of latent correlations between cutting force and vibration signals [
14]. For instance, Abdeltawab et al. [
15] developed a CNN-based model that integrates continuous wavelet transform (CWT), short-time Fourier transform (STFT), and Gramian angular field (GAF) to convert cutting force signals into two-dimensional time–frequency images for tool wear classification. Sun et al. [
16] combined the dual-tree complex wavelet transform (DWT) with CNNs to achieve multi-scale feature extraction from spindle vibration signals. Li et al. [
17] further proposed deep models incorporating a dual-channel spatial attention mechanism and a lightweight MobileViT architecture, achieving high-precision tool wear recognition under varying machining conditions. Rezazadeh et al. proposed WaveCORAL-DCCA, an unsupervised domain adaptation framework that integrates discrete wavelet transformation with an enhanced deep canonical correlation analysis network regularized by CORAL loss, achieving around 95% diagnostic accuracy and outperforming several State-of-the-Art UDA benchmarks in cross-domain rotor fault diagnosis [
18].
Although deep learning has achieved remarkable progress in single-modal signal analysis, relying on a single source of information remains insufficient to fully characterize the nonlinear degradation patterns of tool wear under complex machining conditions. To address this limitation, researchers have increasingly focused on multimodal information fusion [
19]. By integrating heterogeneous signals—such as cutting force, vibration, acoustic emission, and temperature—multimodal frameworks enable feature complementarity and information enhancement, thereby improving the comprehensiveness and robustness of tool condition monitoring systems [
19]. For instance, Wei et al. [
20] proposed an intelligent wear detection approach based on multi-source data fusion combined with a channel–spatial attention mechanism, which achieved higher recognition accuracy. Hou et al. [
21] developed the Swin-Fusion framework, integrating convolutional neural networks (CNNs) with Transformers to realize dynamic wear monitoring through local–global feature extraction and cross-attention fusion. Peng et al. [
22] introduced a multi-source information fusion method based on the MKW-GPR model, achieving high-precision monitoring even with small sample sizes. Song et al. [
23] enhanced the predictive robustness of multi-signal fusion by combining the Whale Optimization Algorithm (WOA) and XGBoost to optimize the performance of a GRU network. Hao et al. [
24] proposed a multimodal information-based monitoring and multi-step prediction framework for ball-end milling tool wear. This framework monitors cutting vibration and spindle power signals and adopts a two-stage deep feature extraction method for real-time wear monitoring., Gao et al. [
25] developed a multi-source, multibranch metric ensemble deep transfer learning algorithm (MS-MMEDTL), which employs metric learning to enhance feature discriminability in the target domain and improve cross-condition recognition performance.
Building upon the aforementioned research, this study proposes a novel tool wear state recognition framework that integrates a Sparrow Search Algorithm (SSA)-optimized Continuous Wavelet Transform (SSA-CWT) with a Cross-Modal Time–Frequency Fusion Network (TFF-Net). To the best of our knowledge, this is the first work that combines SSA with wavelet parameter optimization for time–frequency analysis of tool wear signals, where SSA is specifically employed to adaptively tune the center frequency and bandwidth of the complex Morlet wavelet. By using minimum energy entropy as the optimization objective, the SSA-CWT module yields a more concentrated time–frequency energy distribution while effectively suppressing noise, thereby generating highly discriminative time–frequency representations as inputs for subsequent modeling.
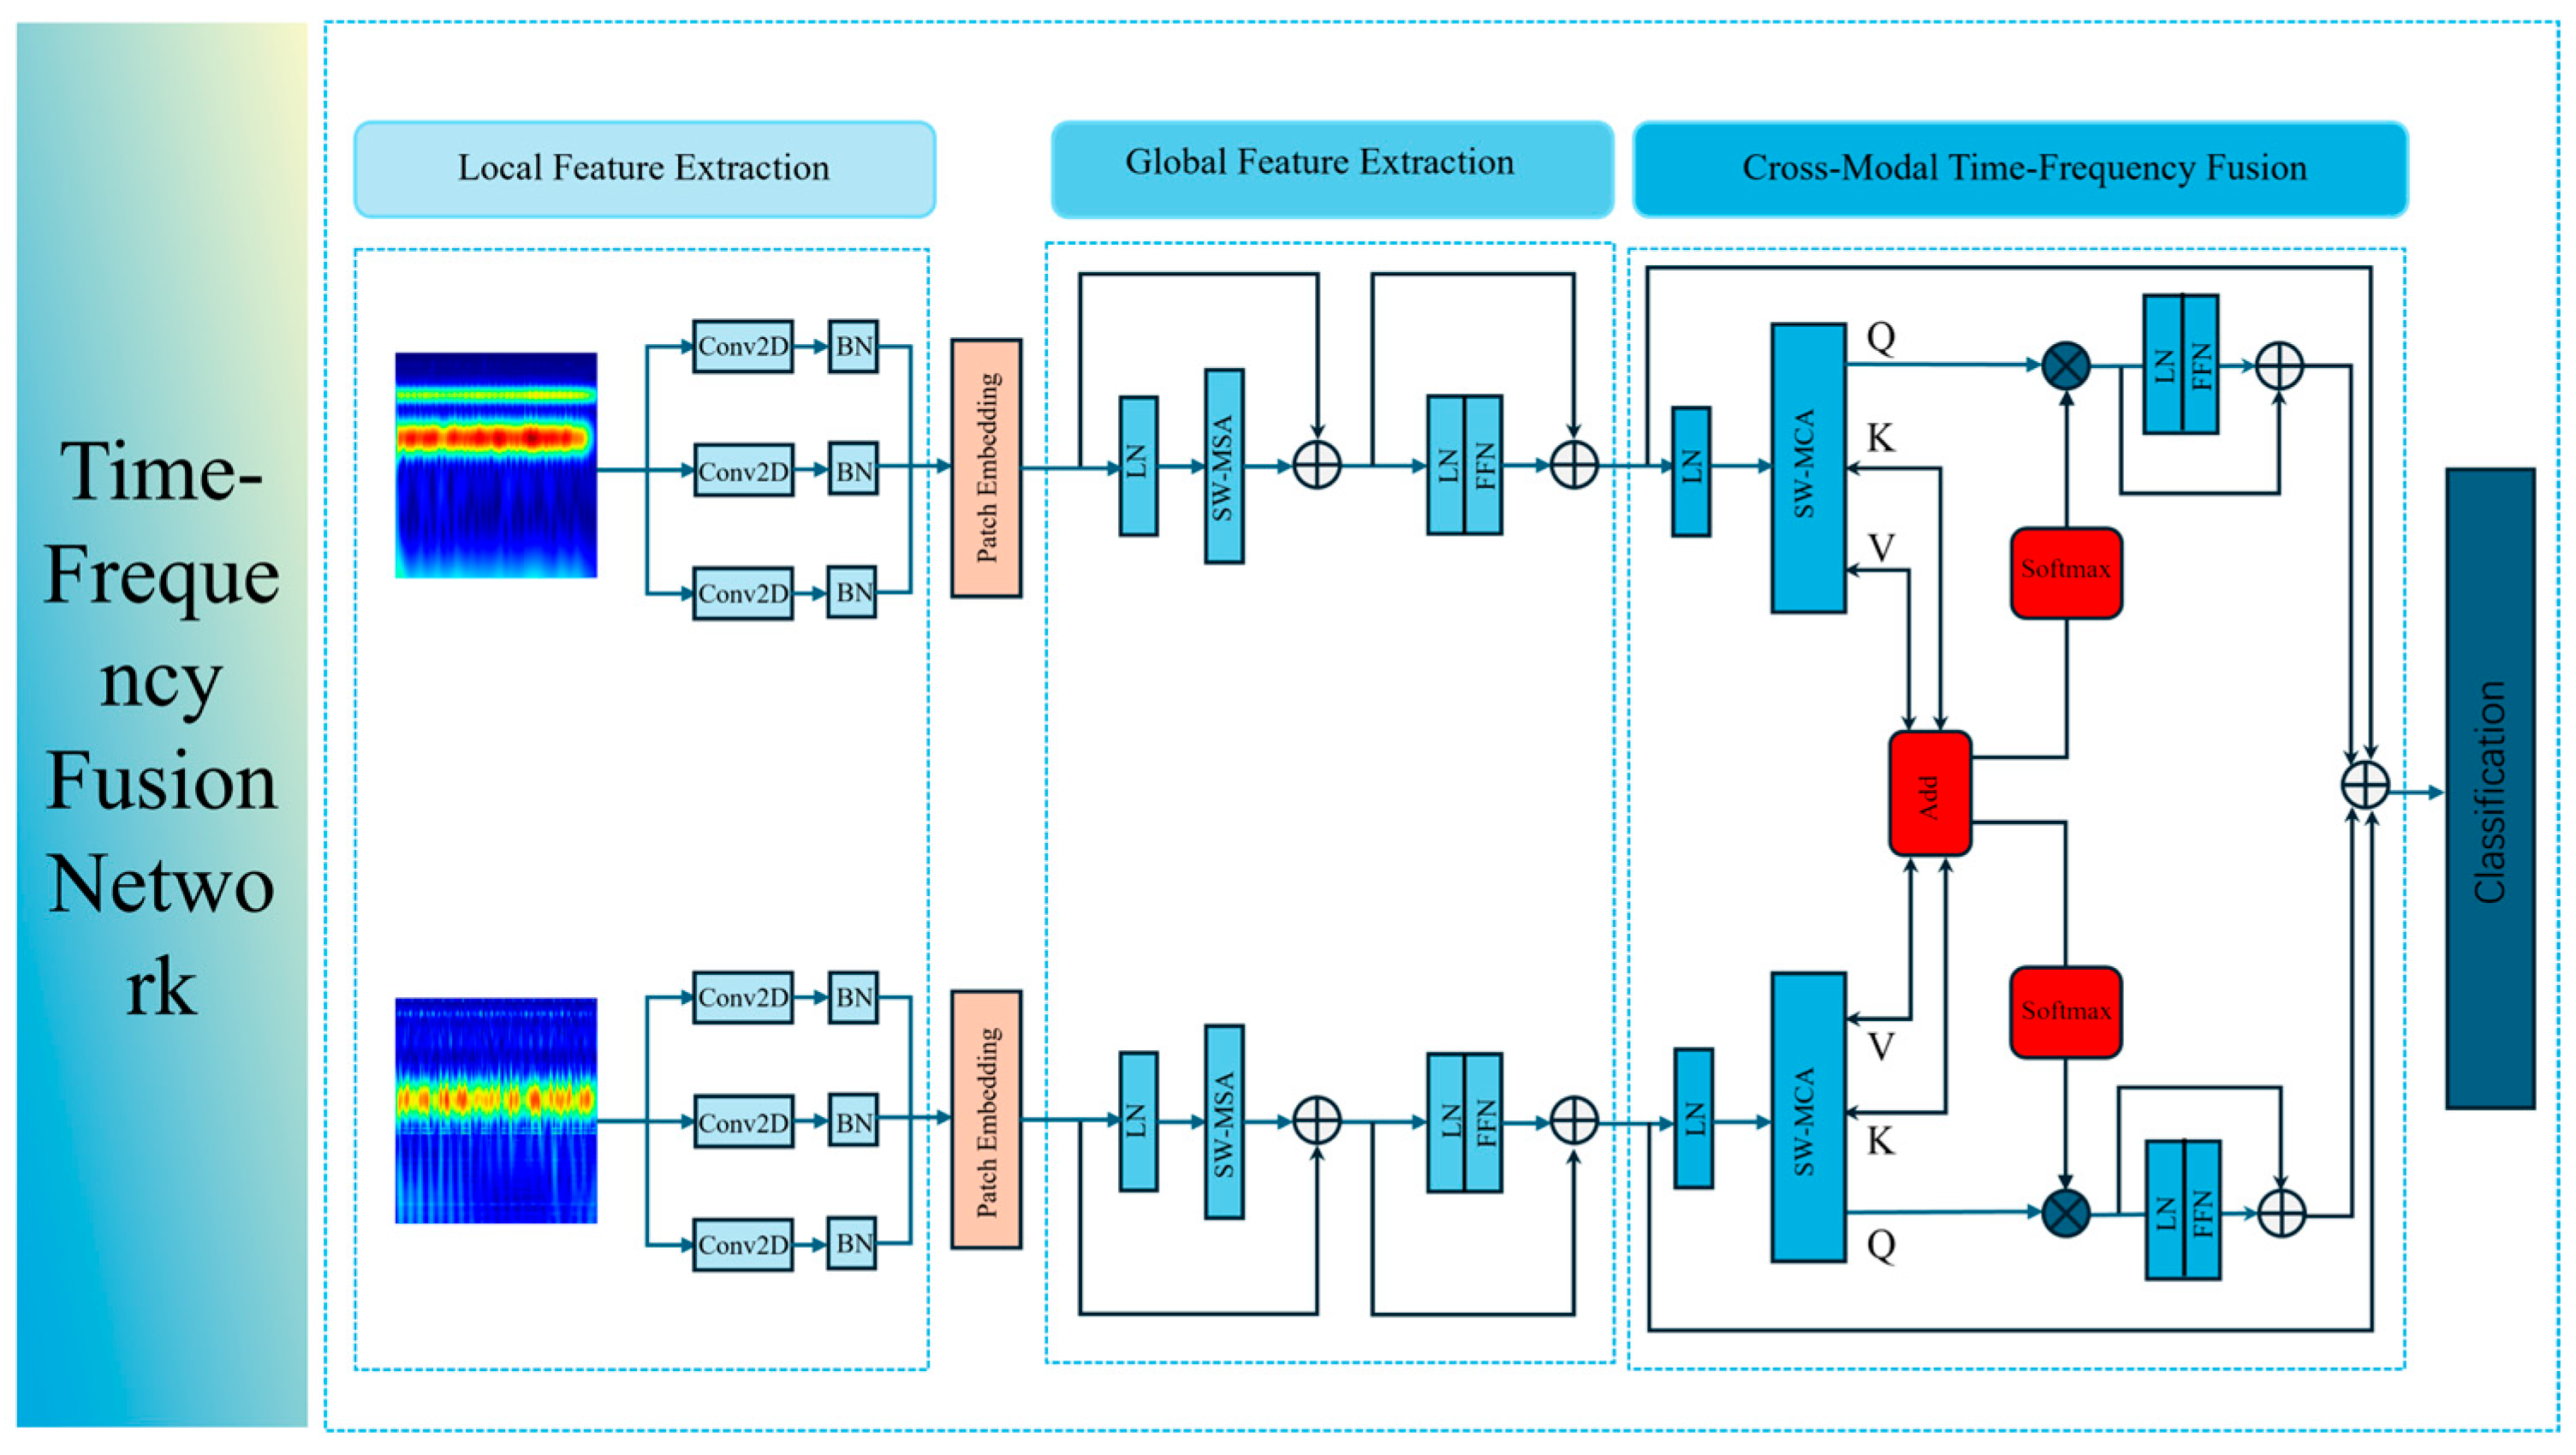
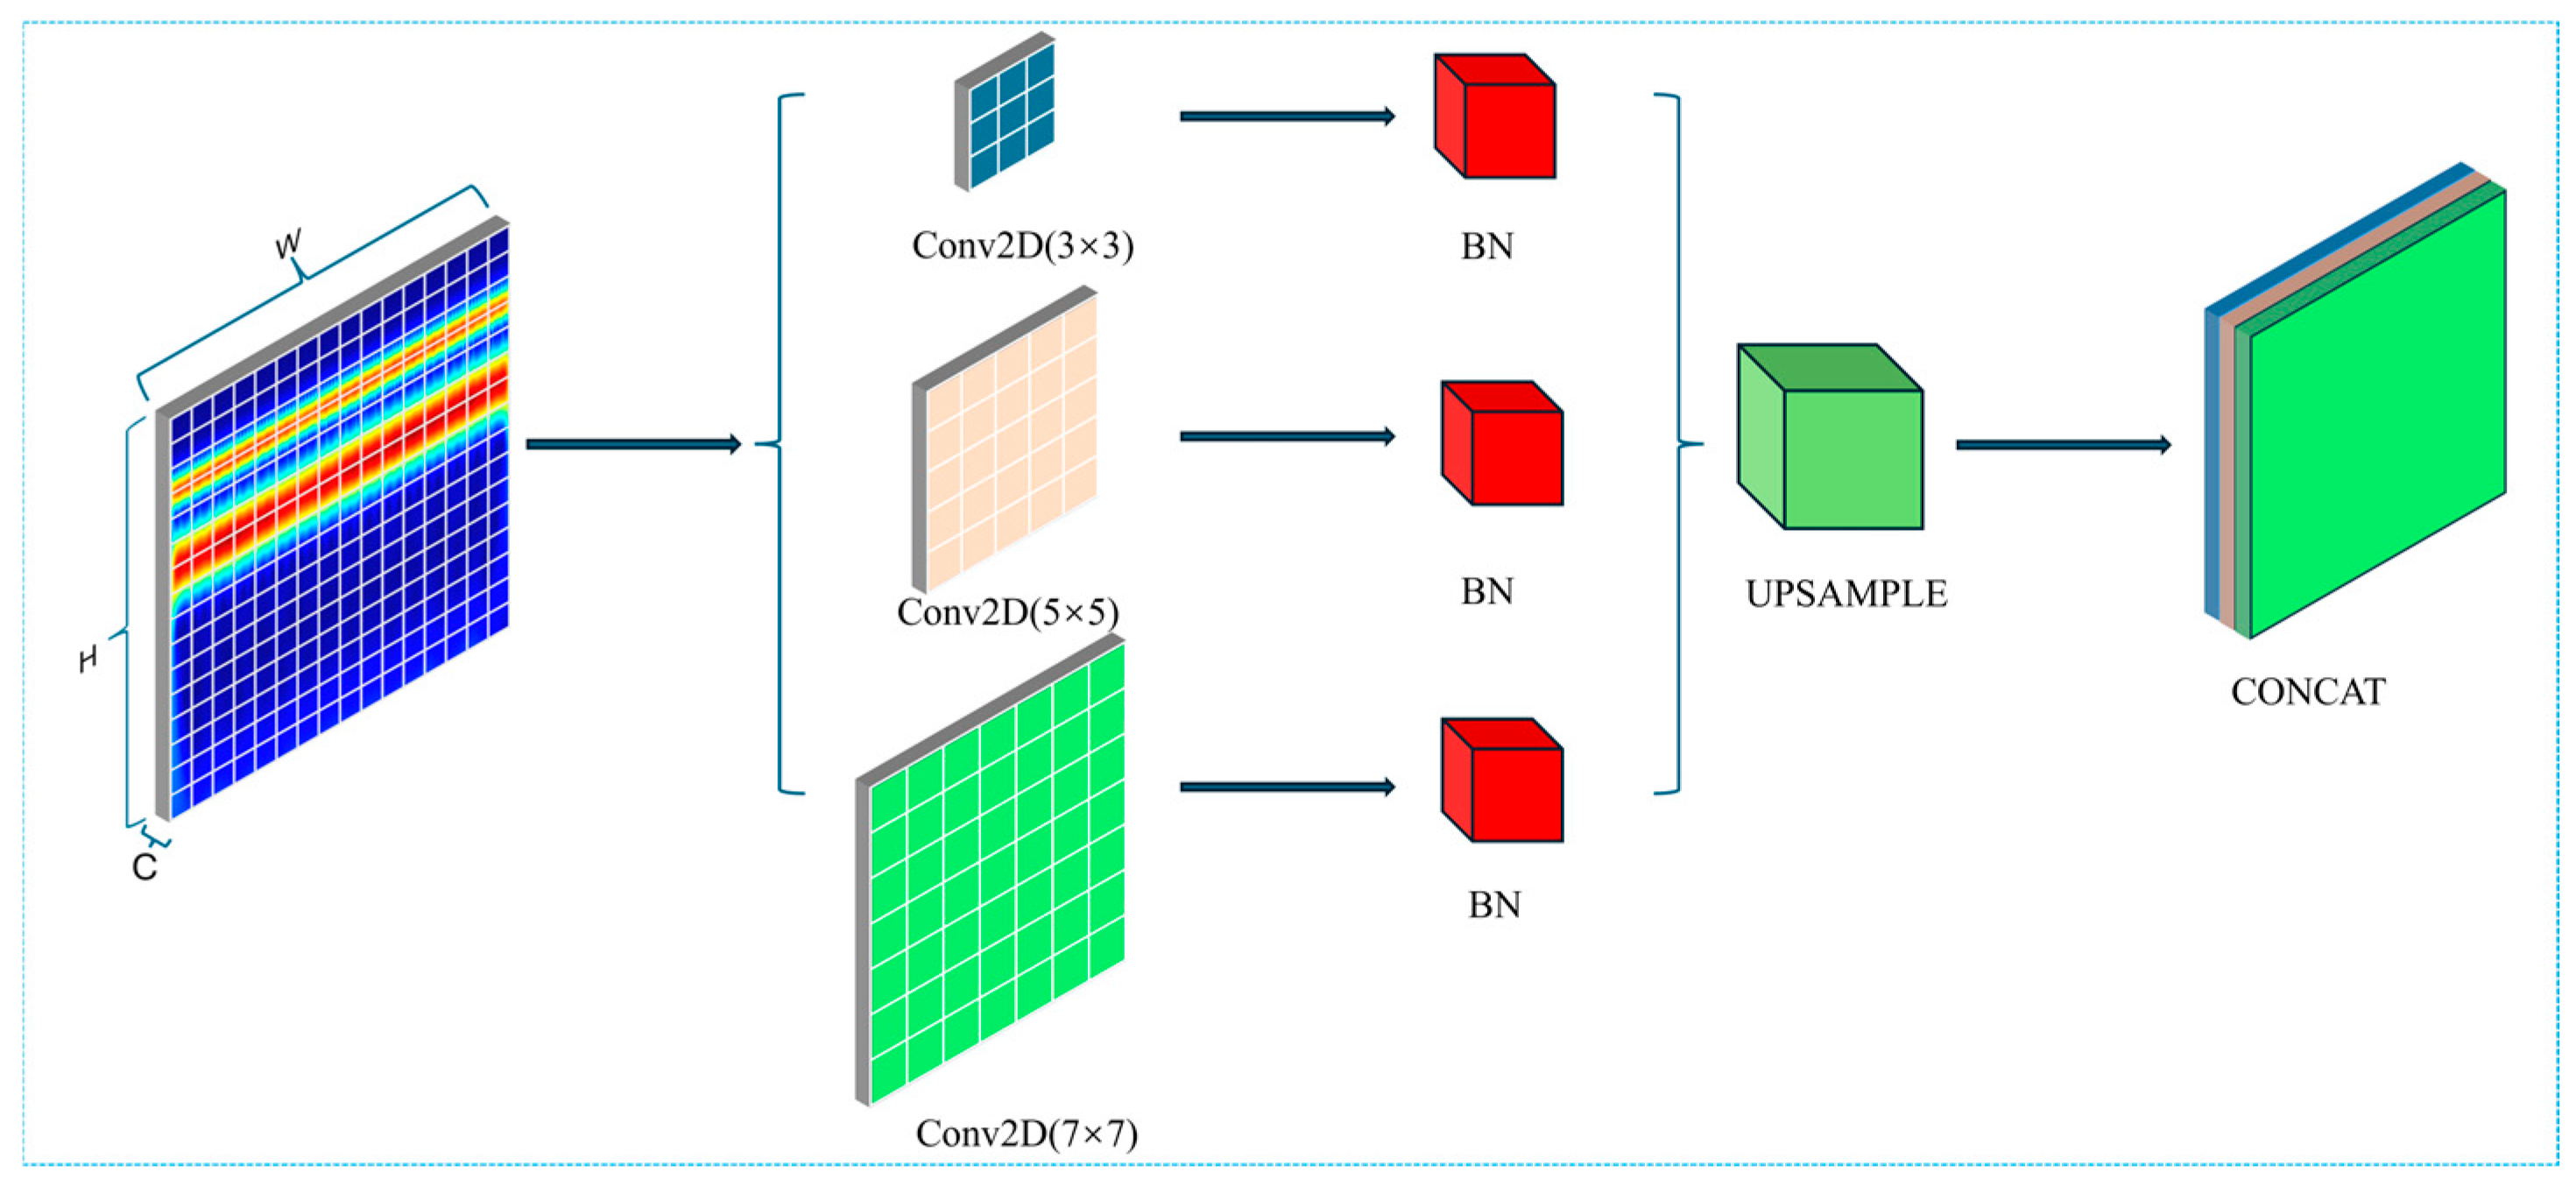
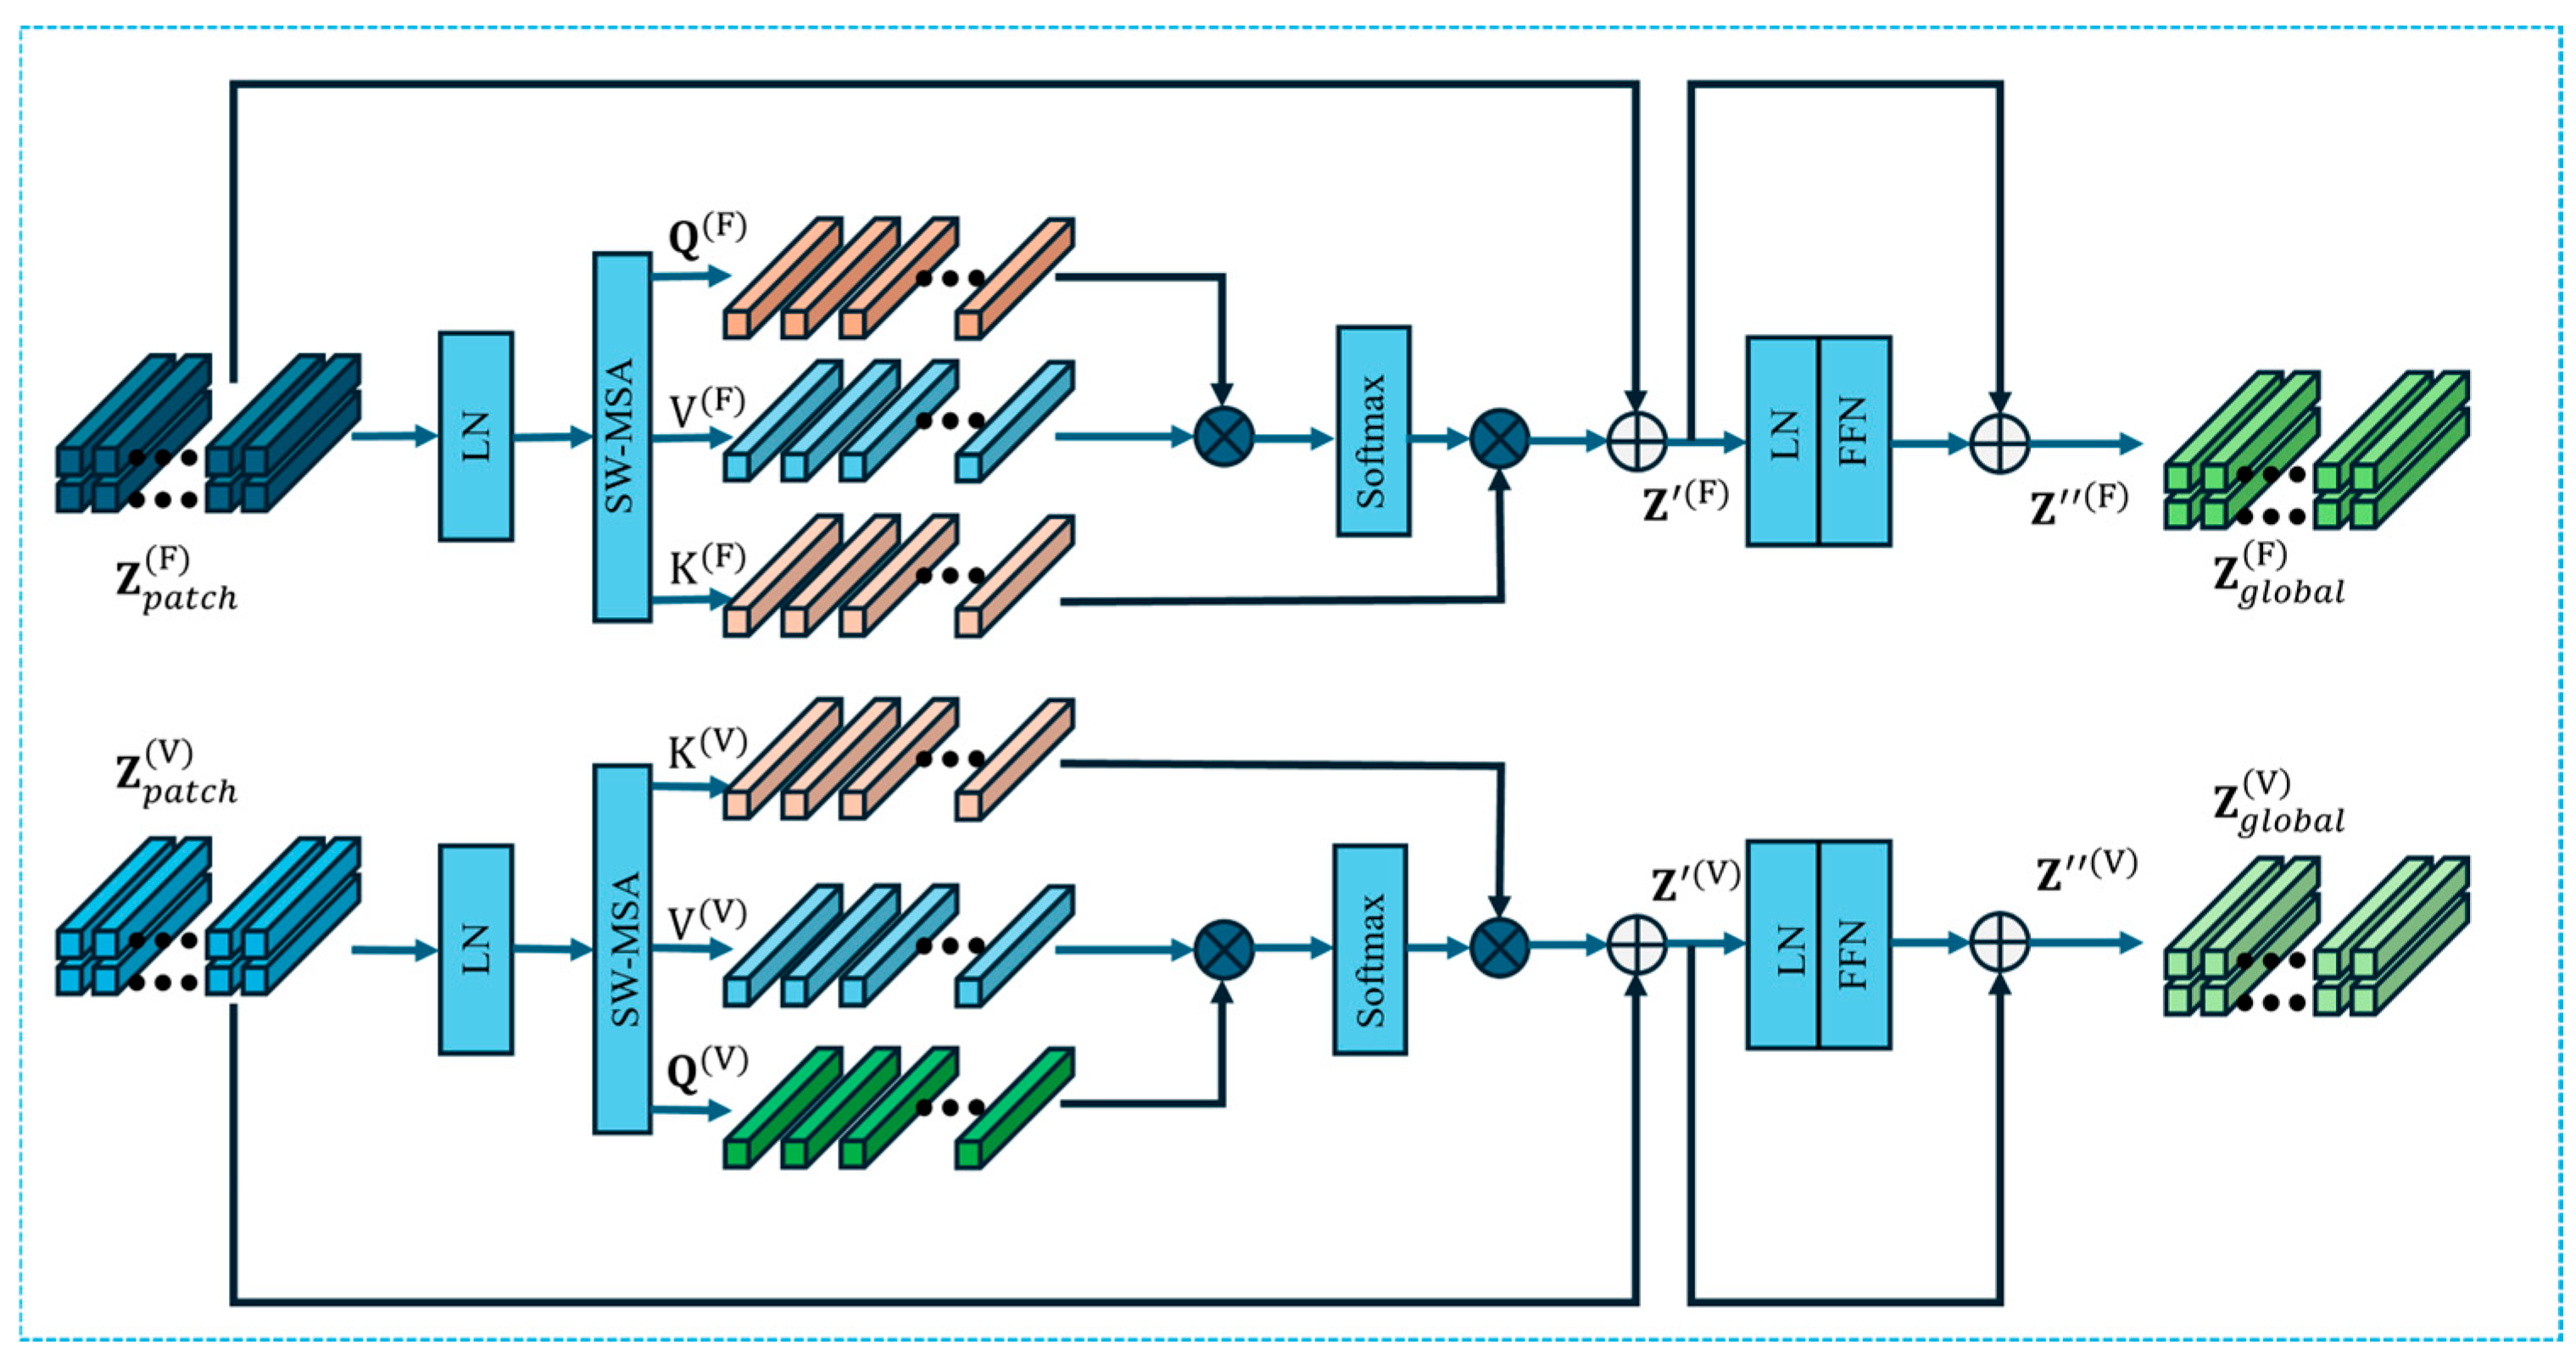
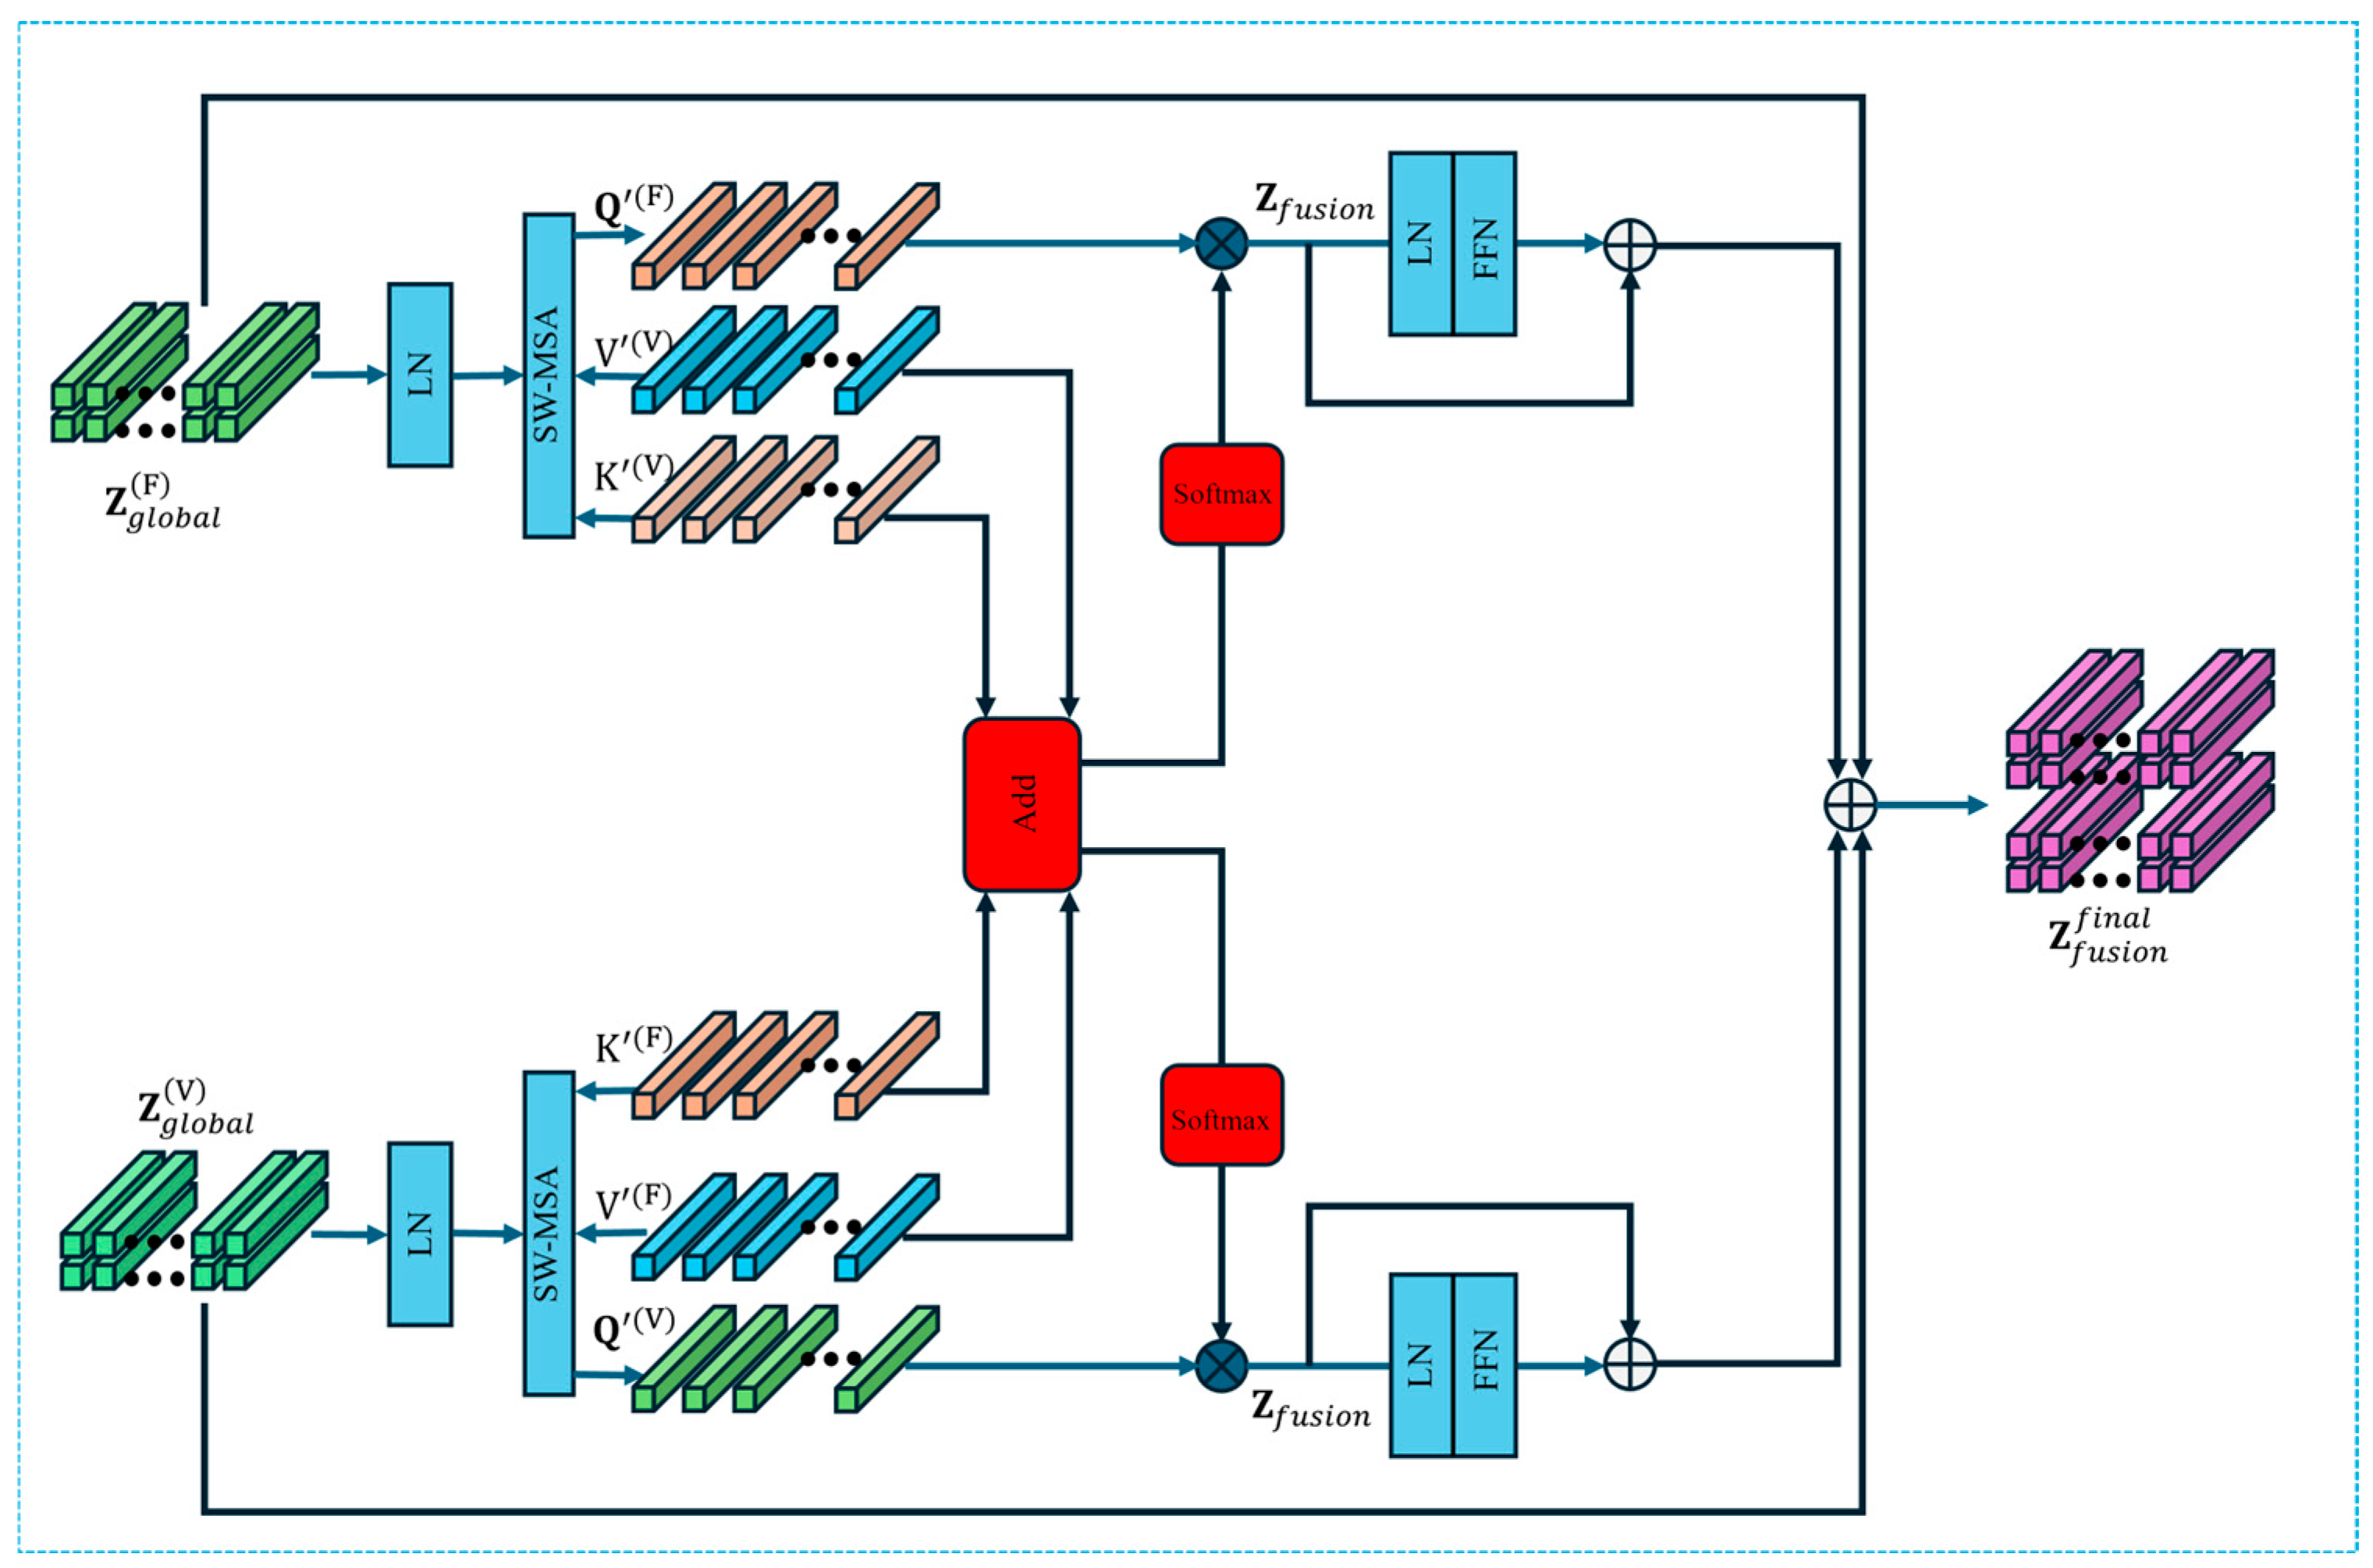
The proposed TFF-Net further combines multi-scale convolutional feature extraction, global representation modeling, and a sliding-window multi-head cross-modal attention mechanism (SW-MCA) to achieve deep fusion of cutting force and vibration signals in the time–frequency domain. In contrast to conventional feature stacking or global attention schemes, the SW-MCA module explicitly models local, window-based cross-modal interactions, enabling more precise temporal alignment between modalities. This design effectively captures inter-modal complementary information and enhances the precision and robustness of tool wear recognition under complex operating conditions.
The main contributions of this study are summarized as follows:
- (1)
An adaptive time–frequency analysis method (SSA-CWT) optimized via the Sparrow Search Algorithm is proposed, which automatically adjusts the center frequency and bandwidth of the complex Morlet wavelet based on energy entropy. This enables high energy concentration in critical frequency bands, effective noise suppression, and the generation of highly discriminative time–frequency representations for tool wear signals. To the best of our knowledge, this is the first application of SSA-driven wavelet parameter optimization to tool wear time–frequency analysis.
- (2)
A Cross-Modal Time–Frequency Fusion Network (TFF-Net) is developed, which integrates local convolutional feature extraction, global dependency modeling, and a sliding-window multi-head cross-modal attention mechanism. This architecture enables adaptive alignment and deep fusion of cutting force and vibration modalities across multiple scales. Compared with conventional early/late fusion or global attention-based fusion, the proposed SW-MCA module provides a more targeted cross-modal interaction scheme, thereby significantly improving robustness and recognition accuracy under non-stationary machining conditions.
- (3)
Extensive experiments on the public PHM2010 dataset demonstrate the superior performance of the proposed framework, achieving recognition accuracies of 100%, 98.7%, and 98.7% for the initial, normal, and severe wear stages, respectively. Ablation studies further validate the specific contributions of SSA-based wavelet optimization and cross-modal fusion, while external validation on the HMoTP dataset confirms strong generalization capability across different tools, materials, and acquisition conditions.
3. Results
3.1. PHM2010 Dataset
3.1.1. Experimental Equipment and Parameters
To evaluate the effectiveness and generalization capability of the proposed model, experiments were conducted using the PHM2010 [
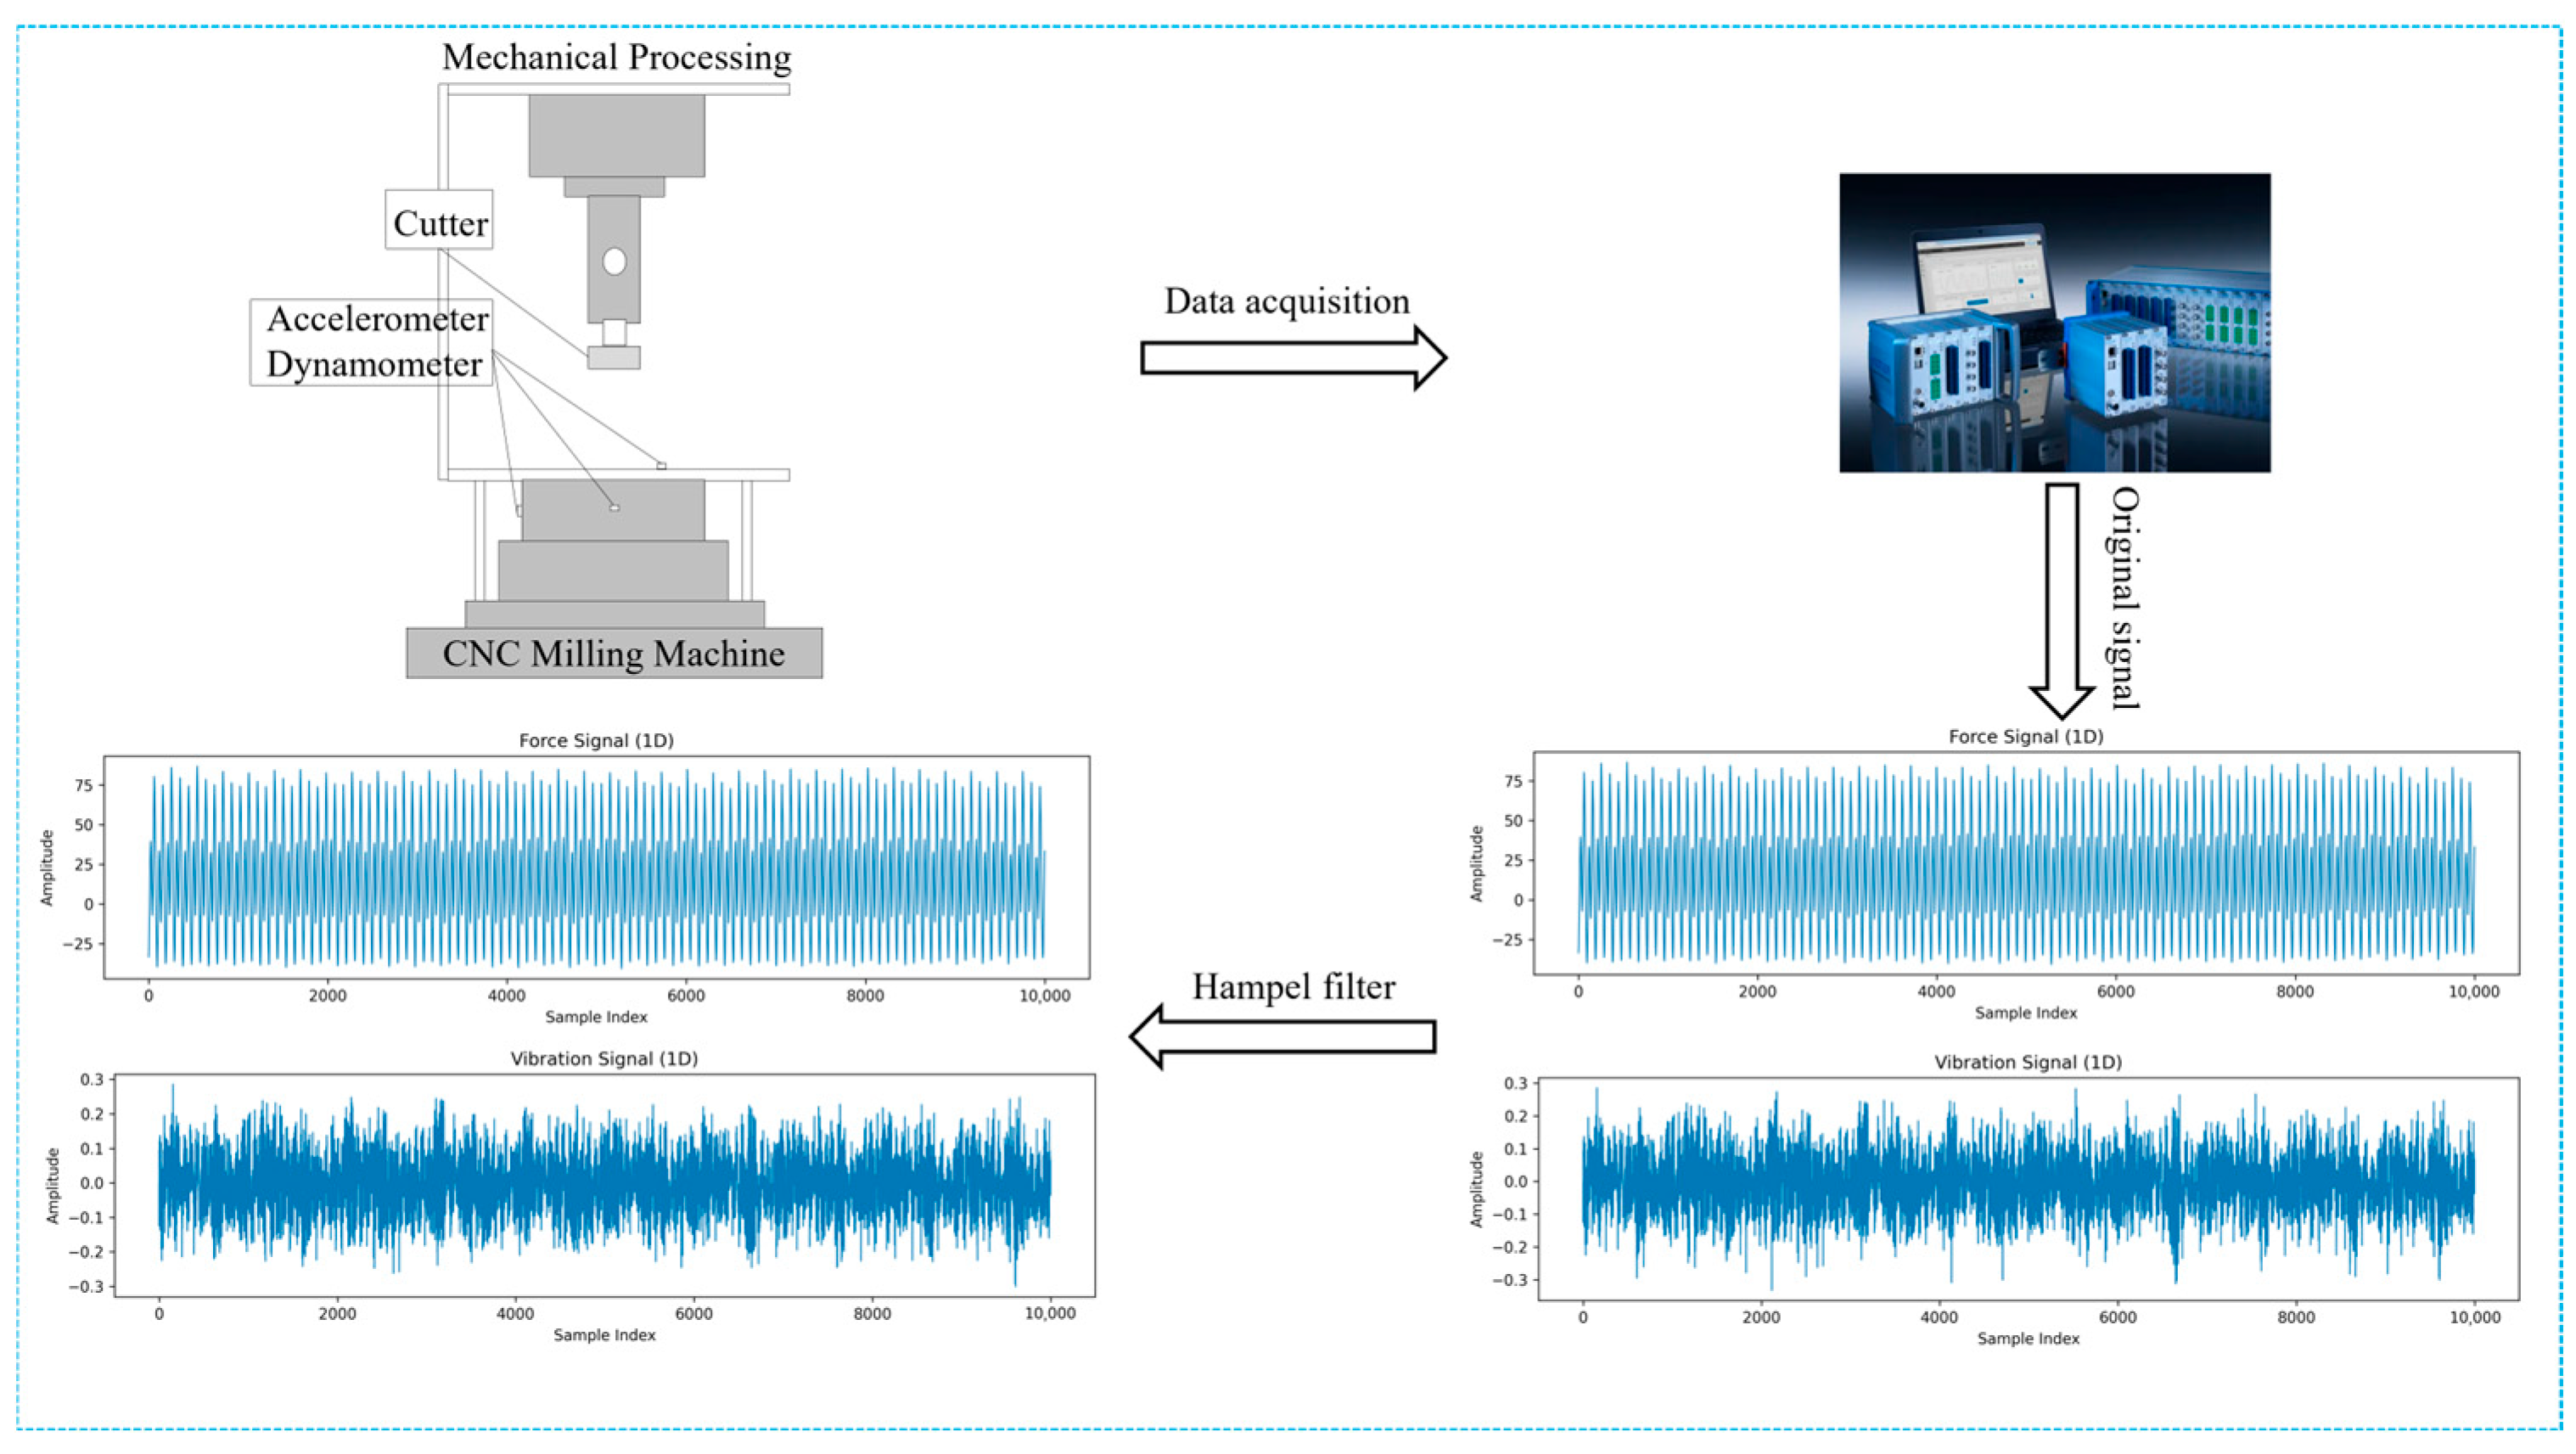
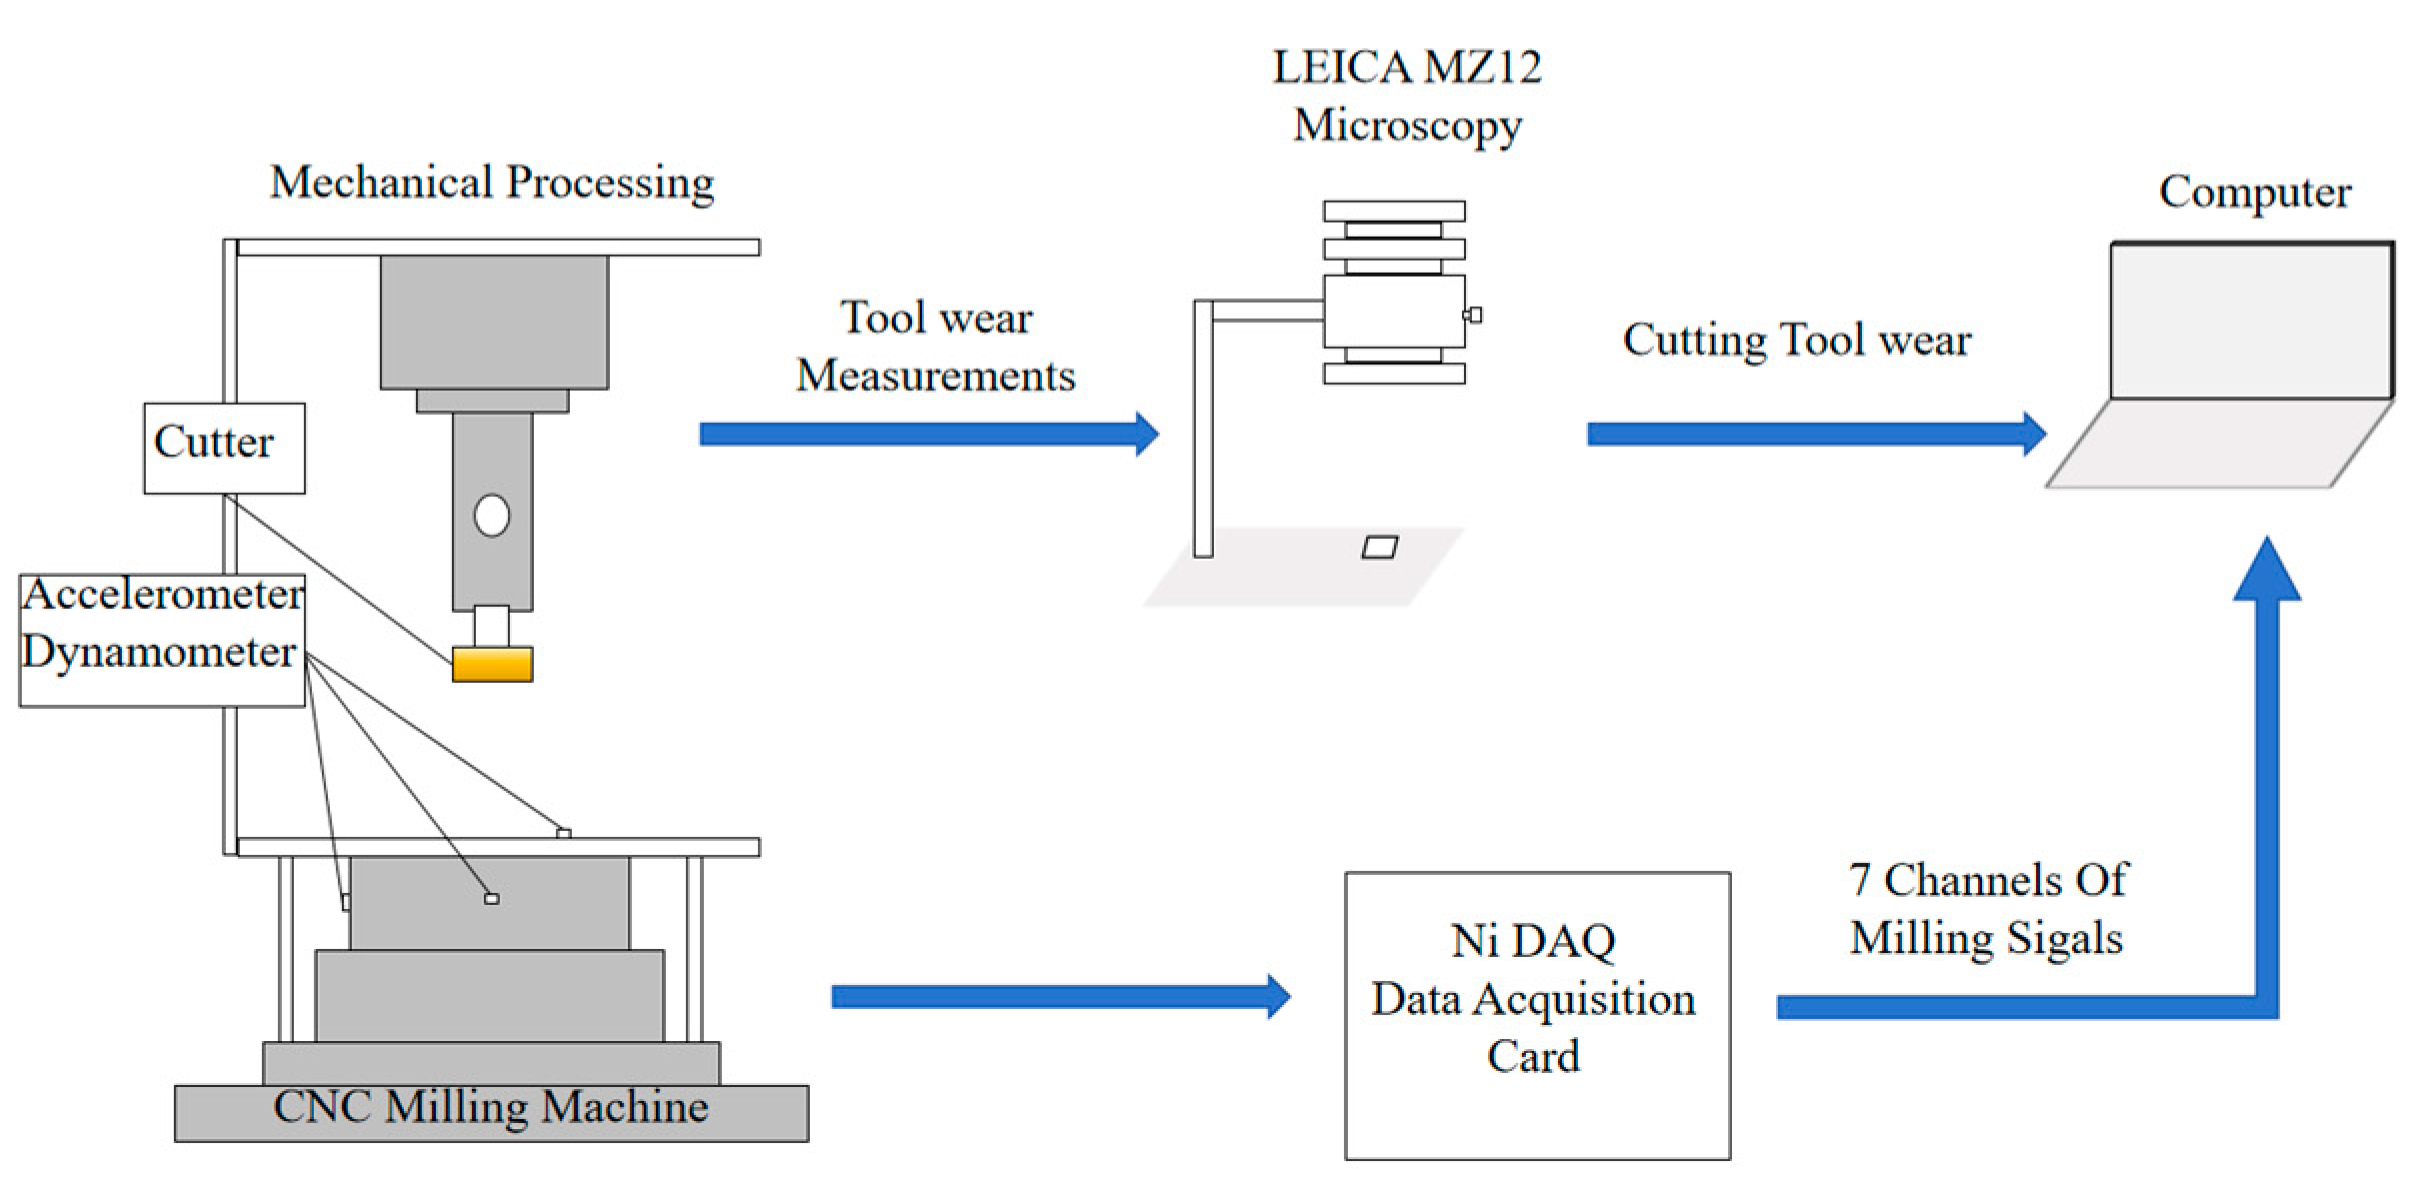
29] open tool wear dataset. The experimental setup and data acquisition system are illustrated in
Figure 8. The workpiece material was Inconel 718, a nickel-based superalloy commonly used in aerospace applications. A 6 mm diameter, three-flute carbide ball-end milling cutter was employed under dry side-milling conditions. All experiments were performed on a Roders Tech RFM760 high-speed CNC milling machine (Röders GmbH & Co. KG, Soltau, Germany).
The signal acquisition system integrated multiple types of sensors. Specifically, a Kistler three-component dynamometer was used to capture the cutting force signals in the x, y, and z directions (Fx, Fy, Fz). A Kistler piezoelectric accelerometer simultaneously collected vibration signals along the same three axes (Vx, Vy, Vz). In addition, an acoustic emission (AE) sensor was used to capture transient high-frequency events associated with tool wear progression. All signals were recorded at a sampling frequency of 50 kHz and conditioned using a Kistler multi-channel charge amplifier(Kistler Instrumente AG, Winterthur, Switzerland). Each cutting trial involved a cutting length of 108 mm, and the milling process was performed in a row-by-row manner on the workpiece surface. The system enabled the real-time acquisition of seven signal channels, including tri-axial force, tri-axial vibration, and AE signals.
Tool wear was measured offline using a LEICA MZ12 optical microscope(Leica Microsystems GmbH, Wetzlar, Germany), where the flank wear width (VB) of the cutter was used as the evaluation metric. Based on the measured VB values, the tool wear condition was categorized into three stages: initial wear, normal wear, and severe wear. The detailed experimental parameters are summarized in
Table 1.
3.1.2. Dataset Division
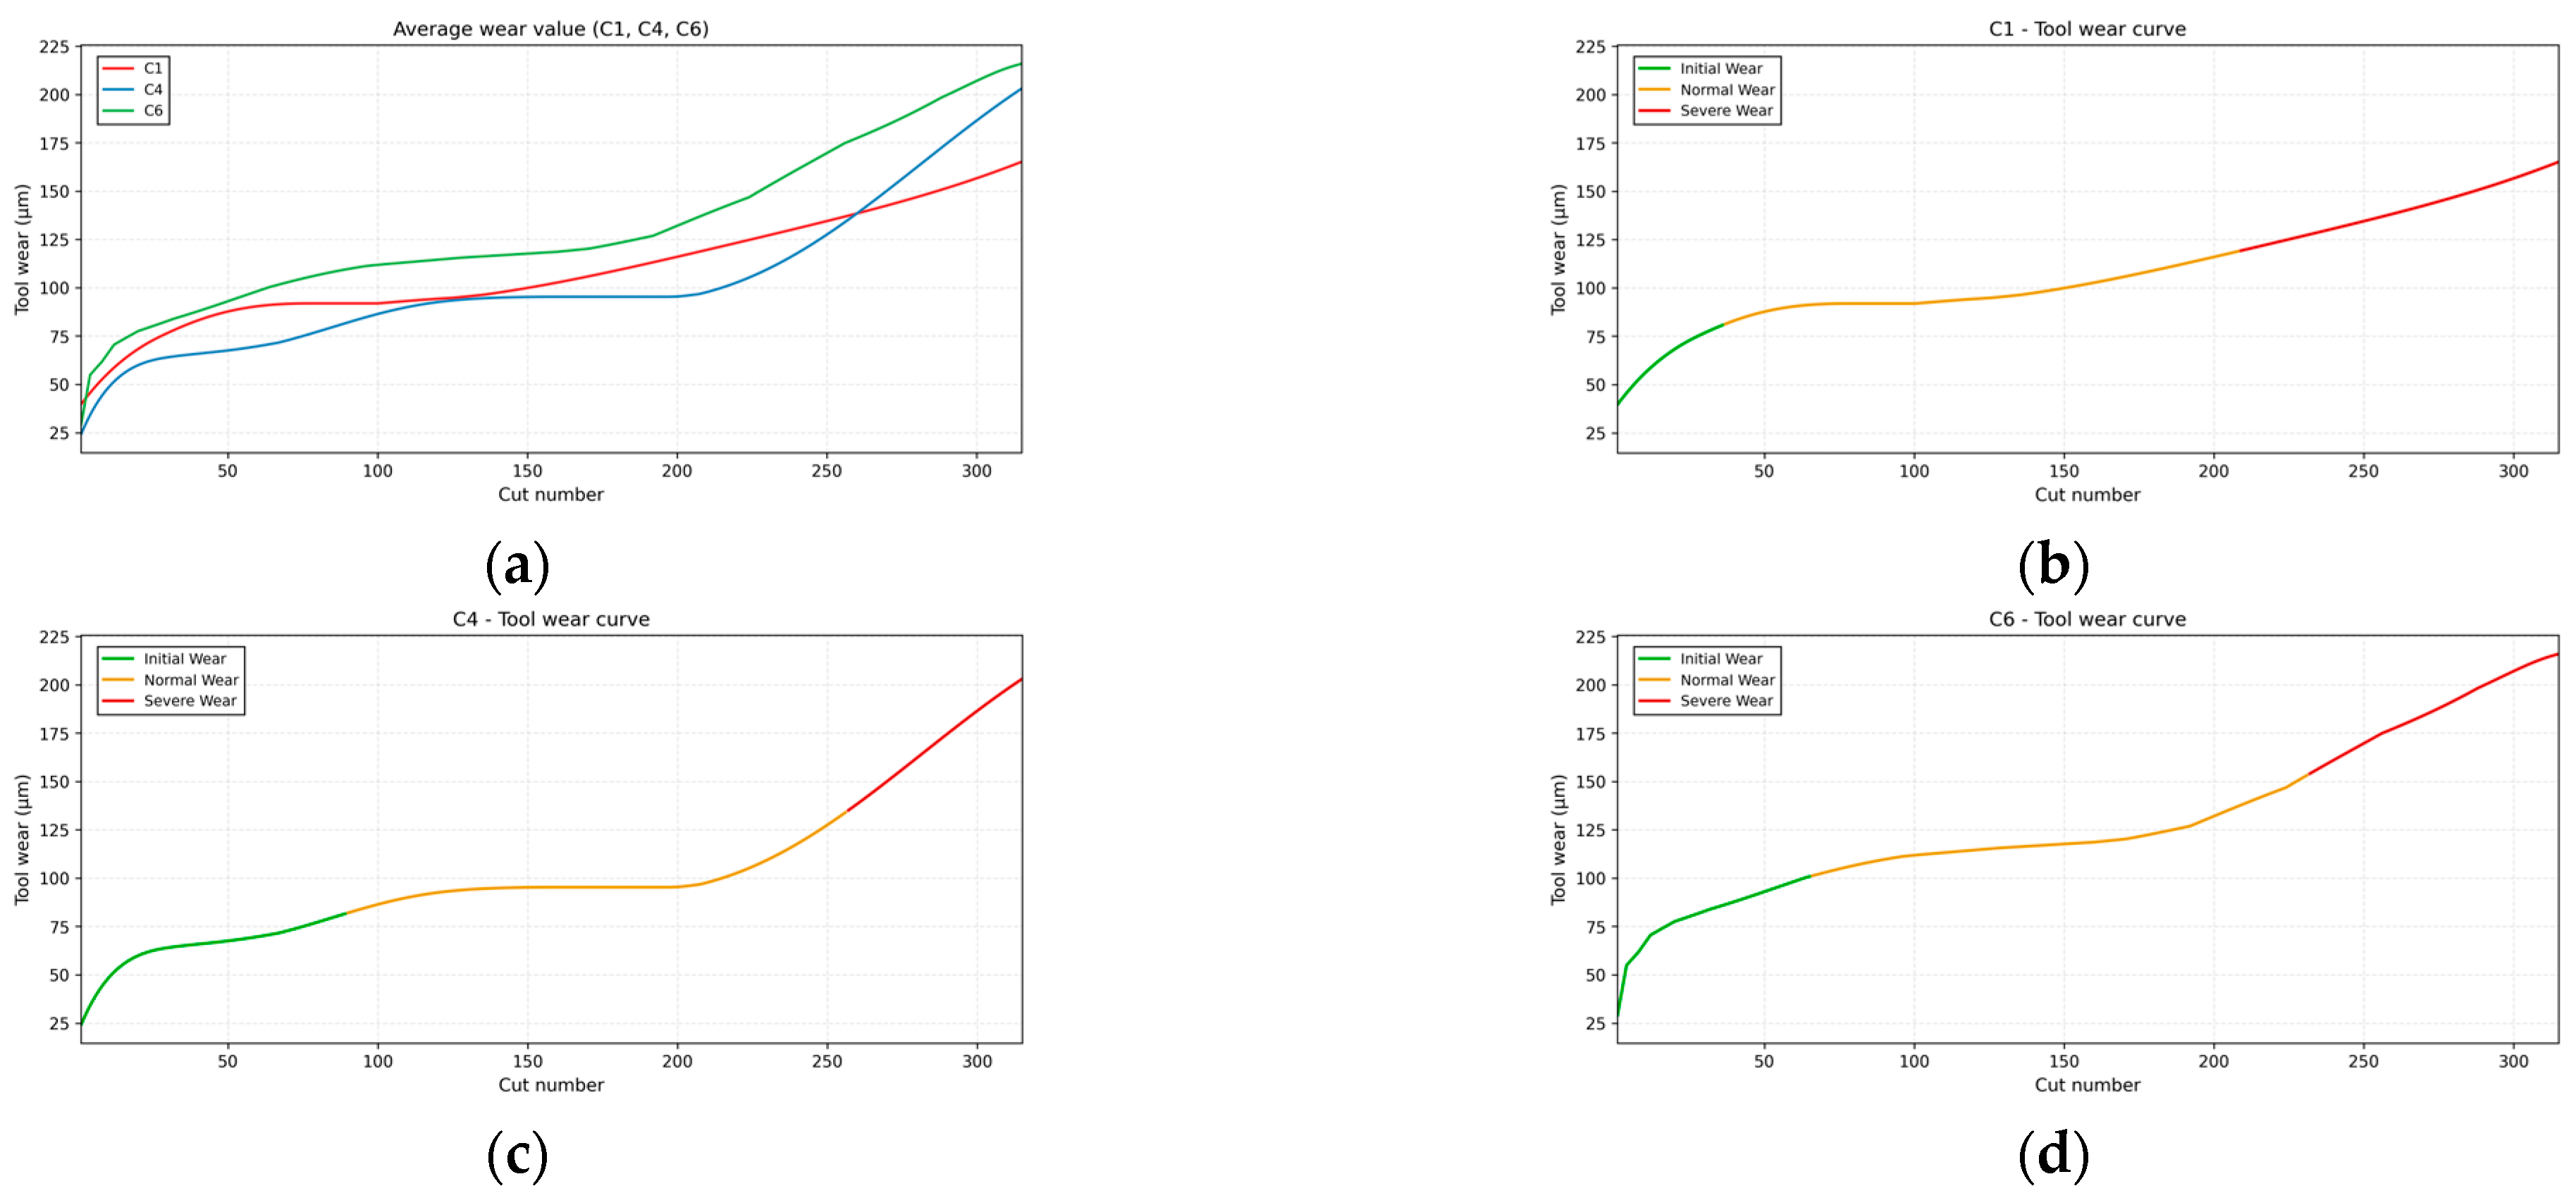
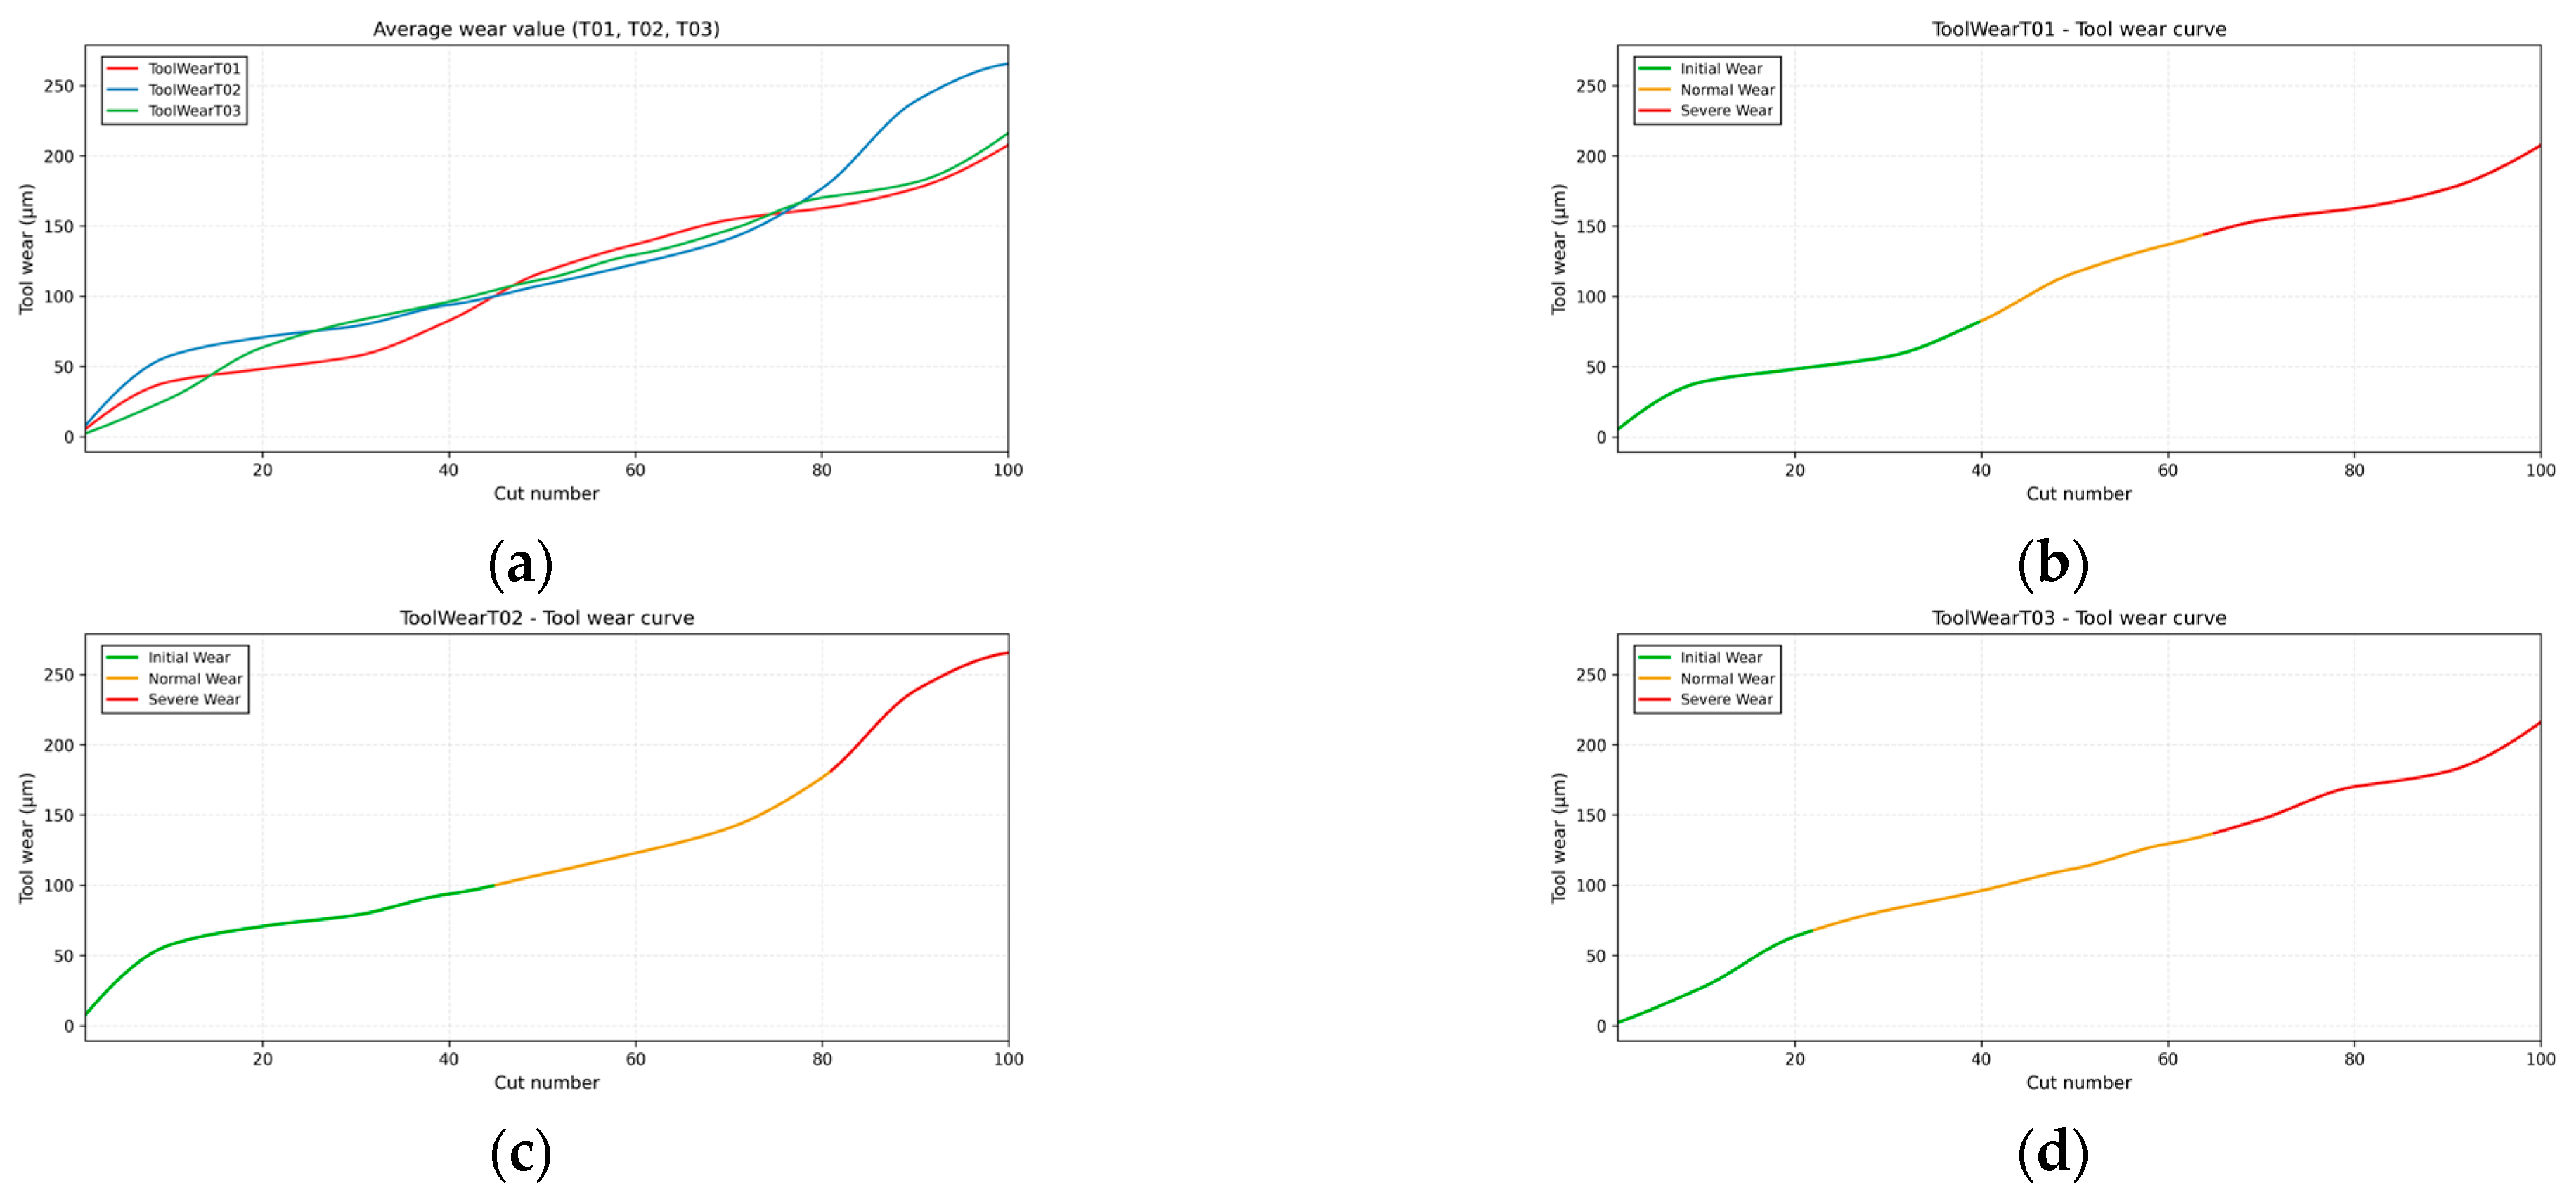
In this study, a total of 315 tool wear data points from three experimental sets, C1, C4, and C6, were used, with each data point consisting of wear values from three cutting edges. Since using the wear value from a single cutting edge does not accurately reflect the overall tool wear, the average wear value of the three cutting edges is used to determine the tool’s wear state.
Figure 9a shows the average wear value of each dataset’s three cutting edges, intuitively reflecting the overall wear evolution.
To accurately classify the tool’s wear state, the K-means clustering algorithm was employed to categorize the data from C1, C4, and C6 into three wear states: initial wear, normal wear, and severe wear.
Figure 9b–d present the wear curves for each of the three wear states, clearly depicting the evolution of wear across different stages. The classification results are shown in
Table 2.
After classification, the datasets were split into training and validation sets in a 7:3 ratio to ensure proper data distribution during the training and validation process.
Table 3 provides the specific division of the training and validation datasets. This ensures the accurate classification of tool wear data for subsequent model training and performance evaluation.
3.2. Baseline System Comparison
To ensure the rigor of the experimental methodology, the number of images and the data splitting ratio for each method were kept consistent with the SSA-CWT approach, and all experiments were conducted using the same equipment. The experiments were performed on a computer running Windows 11 64-bit Professional, equipped with a 13th Gen Intel® Core™ i5-13600KF processor, 32 GB RAM, and an NVIDIA GeForce RTX 4070 GPU (12 GB of VRAM). The programming environment was Python 3.12, with the deep learning framework PyTorch GPU 2.1.0 + cu118 and the GPU acceleration library cuDNN 8.9.5, developed in PyCharm 2024.1.4 (Community Edition).
To evaluate the superiority and effectiveness of the proposed SSA-CWT method in tool wear state recognition, five typical image transformation methods were selected as baseline comparisons. These methods, widely used in the field of tool wear state recognition, include Recursion Plot (RP), Markov Transition Field (MTF), Gram Angular Field (GAF), Short-Time Fourier Transform (STFT), and Continuous Wavelet Transform (CWT). For each of these methods, the cutting force and vibration signals were processed to extract features and generate corresponding time-frequency or feature images, which were then used for performance comparison with the SSA-CWT method. The time-frequency image datasets for cutting force signals are presented in
Table 4, while the datasets for vibration signals are provided in
Table 5. The core formulas and typical time-frequency spectrograms for each method are also listed in the tables.
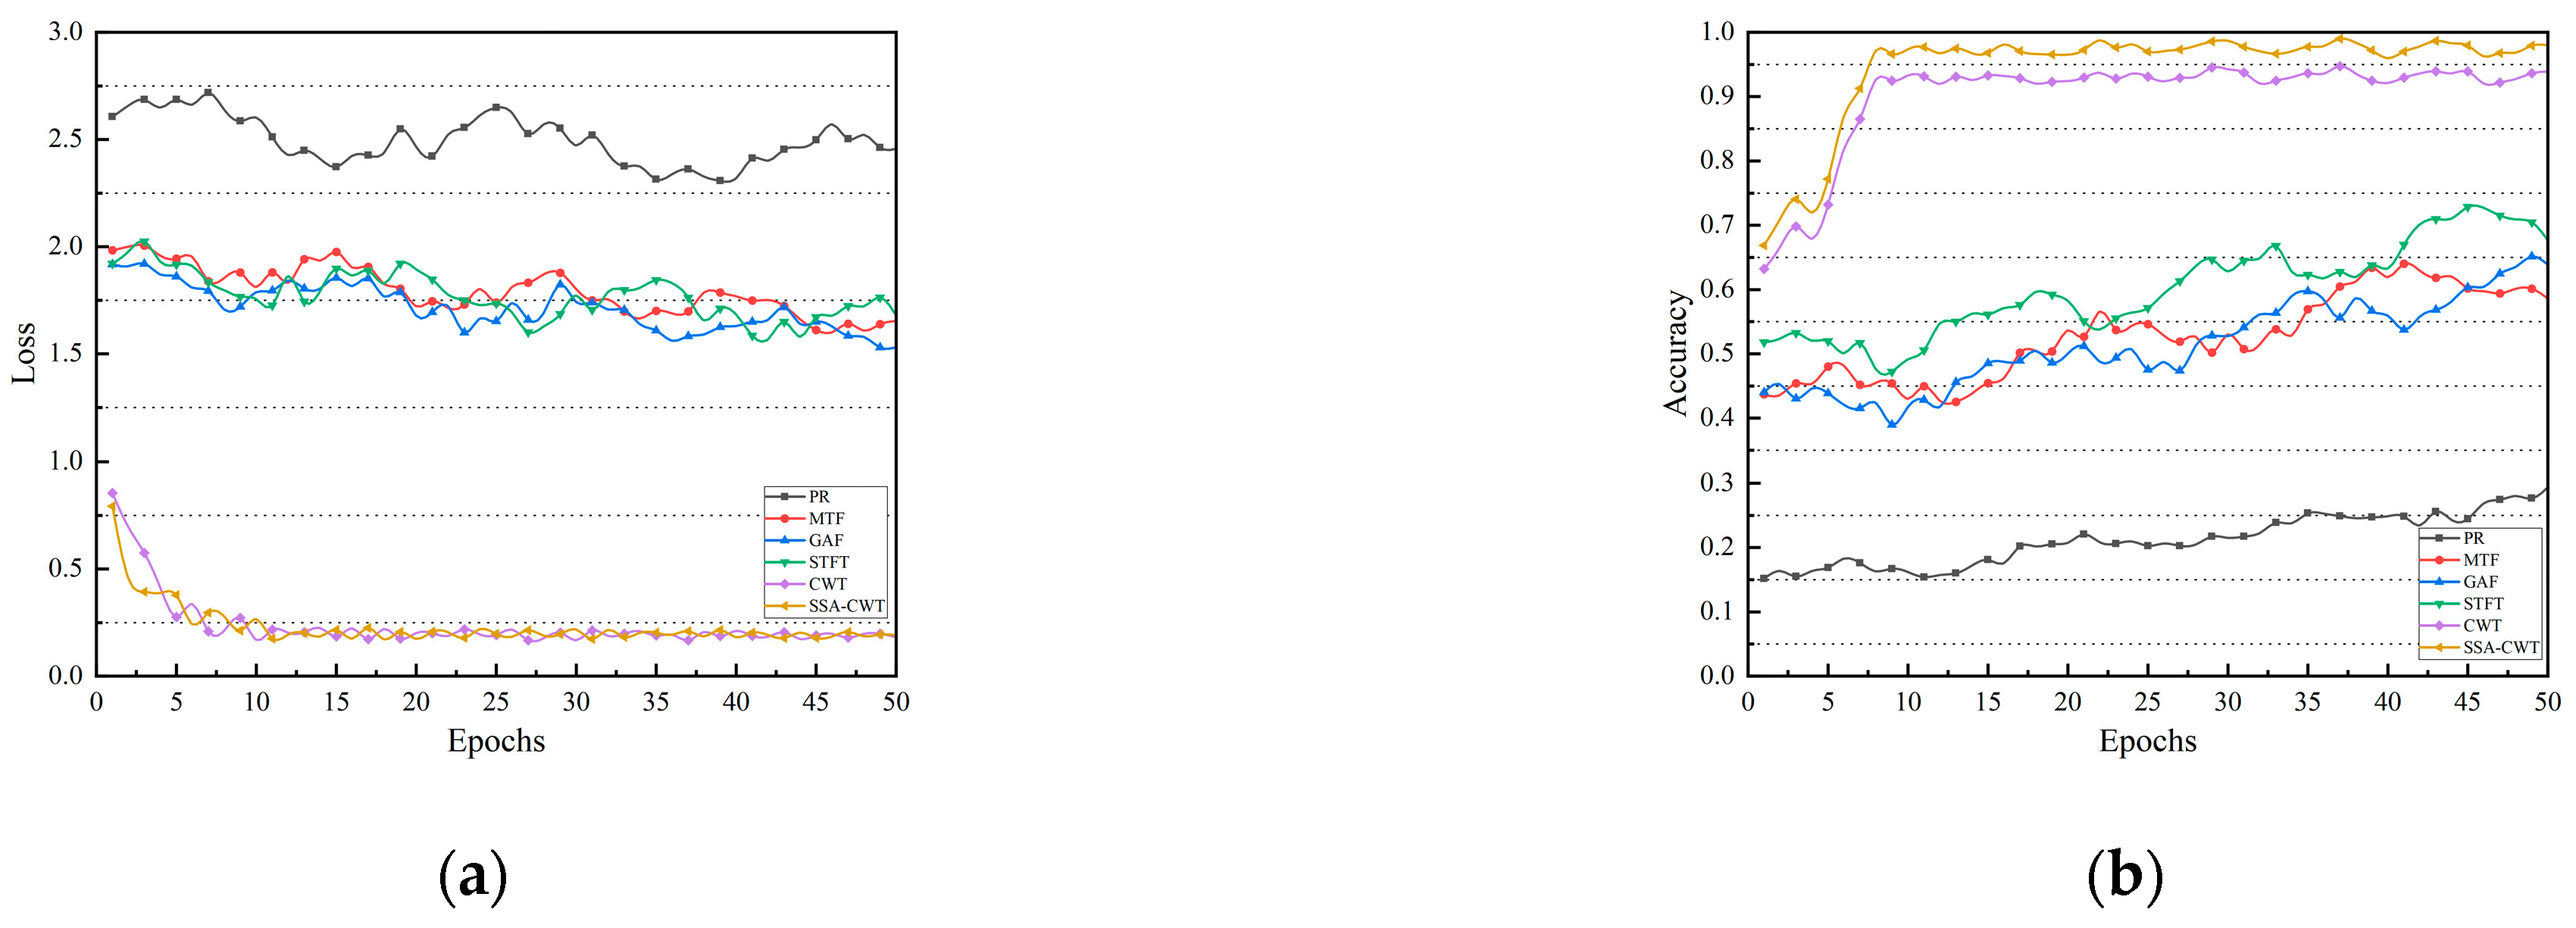
To evaluate the effectiveness of different time–frequency feature transformation methods in tool wear state recognition, we compared the performance of six feature representation methods—PR, MTF, GAF, STFT, CWT, and SSA-CWT—in terms of accuracy and loss. All experiments were conducted under the same network architecture and hyperparameter settings. The corresponding hyperparameters are listed in
Table 6, and the results are illustrated in
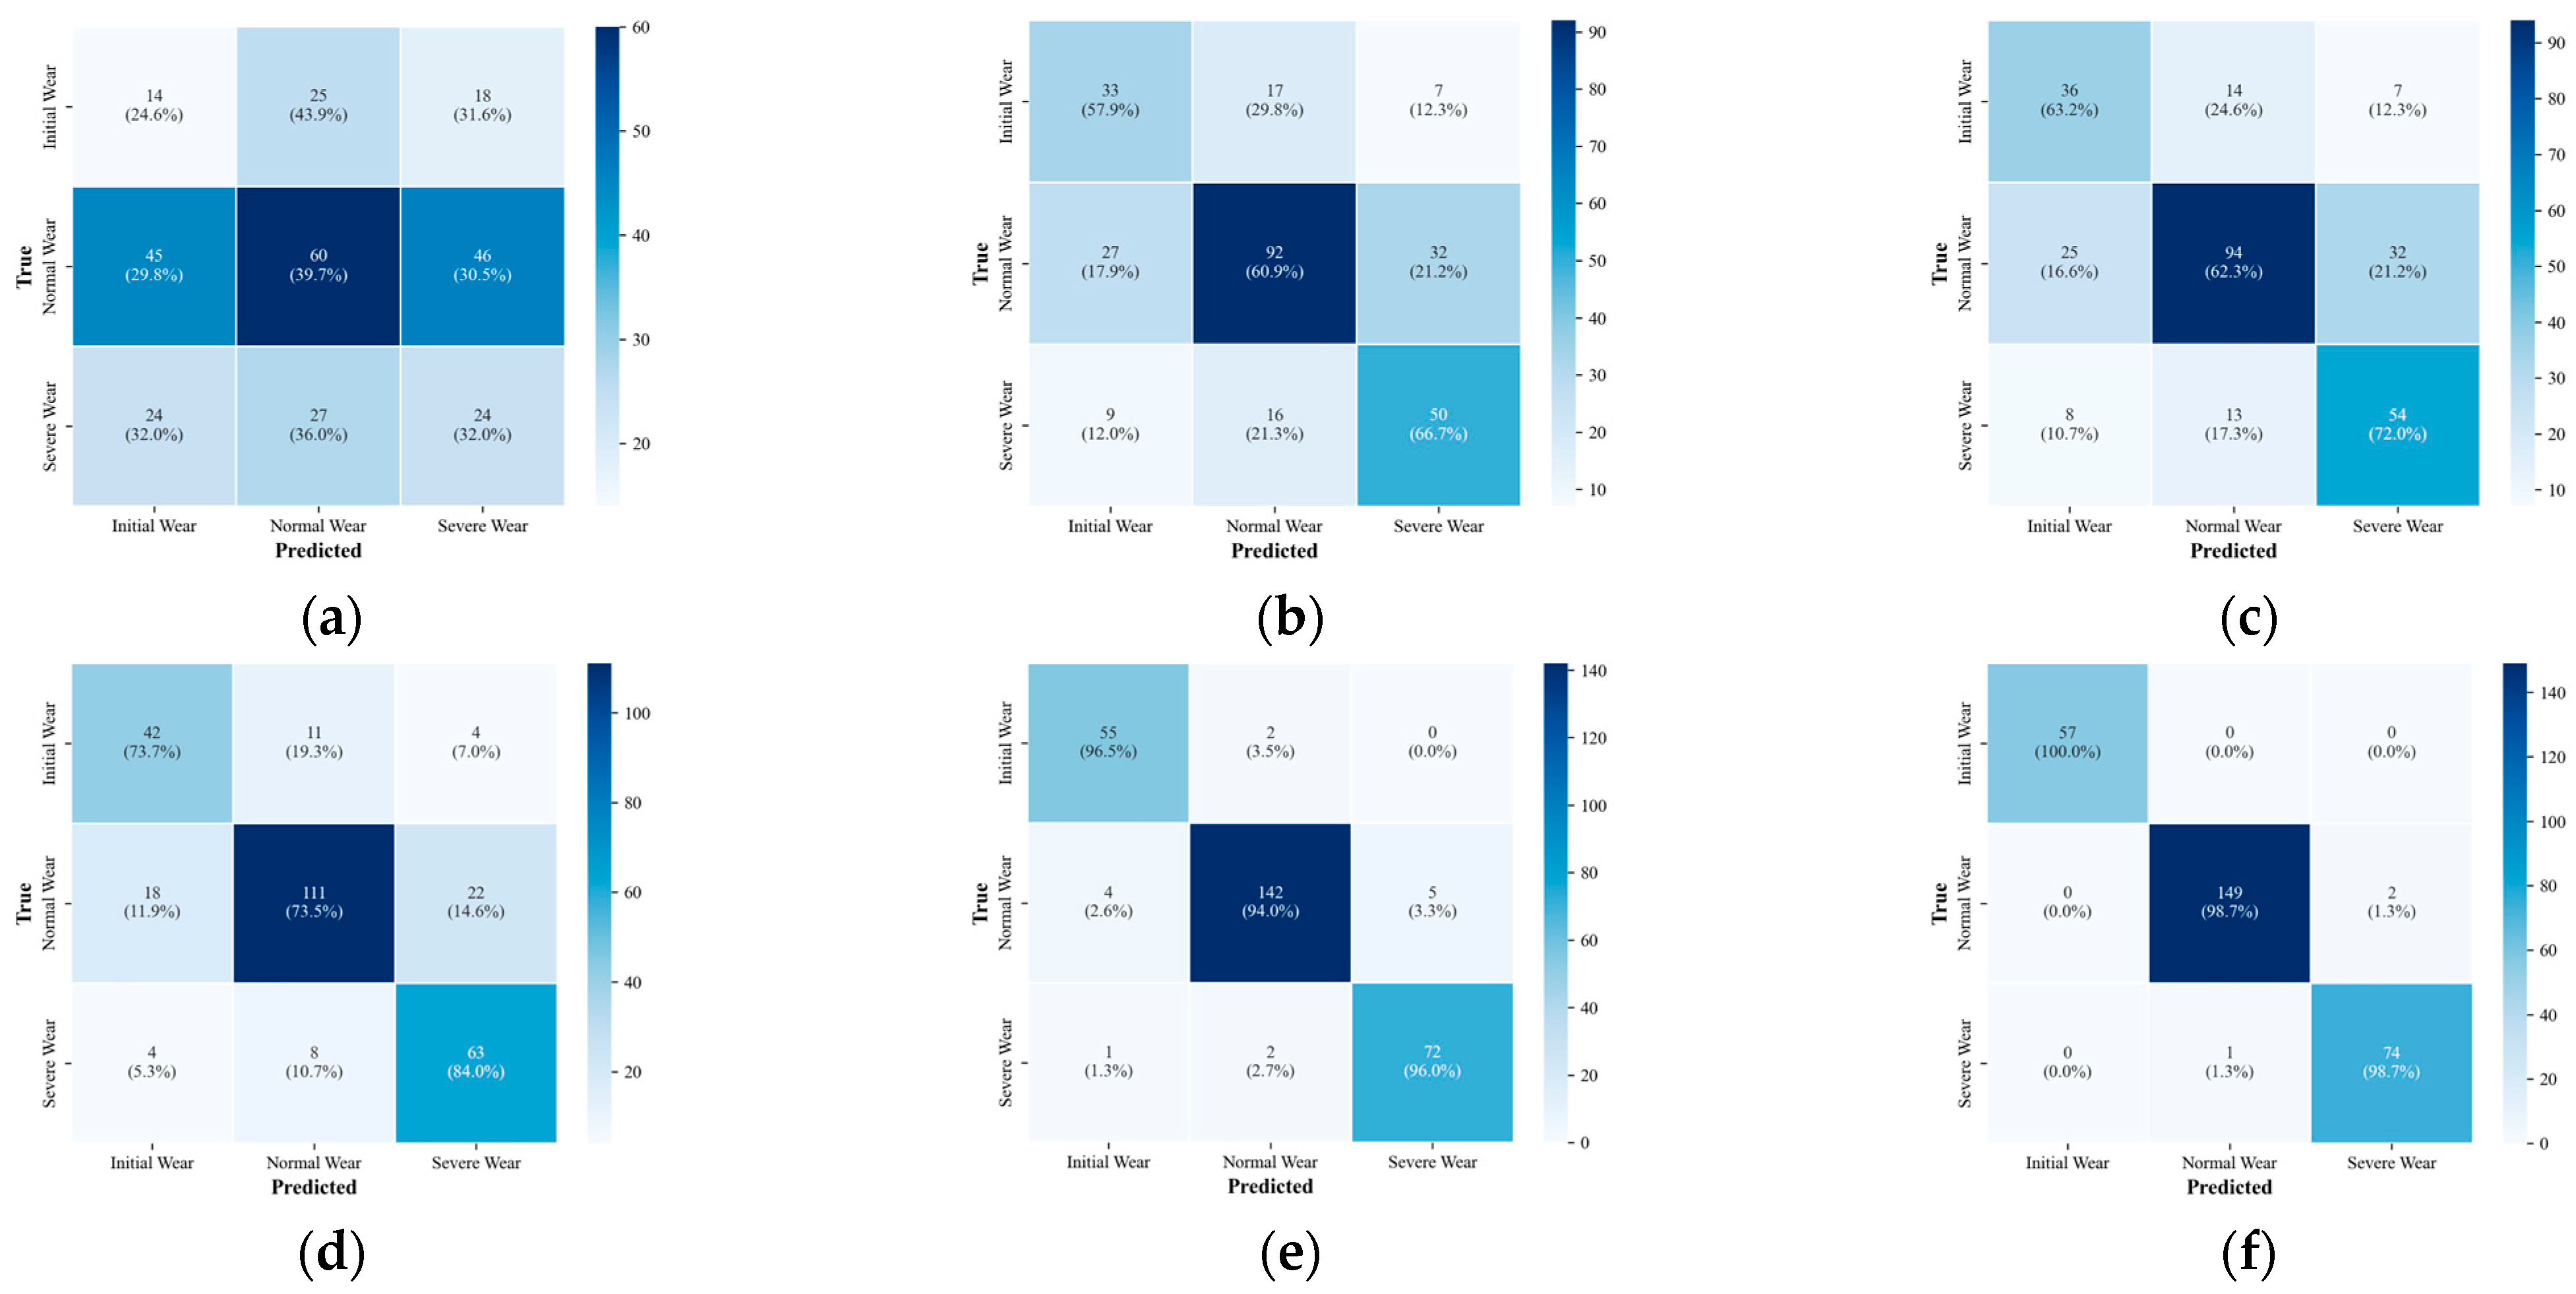
Figure 10. Additionally, the confusion matrices for the output results are shown in
Figure 11, providing a comprehensive view of the recognition accuracy across different tool wear stages.
3.3. Single-Signal and Multi-Signal Fusion Experiments
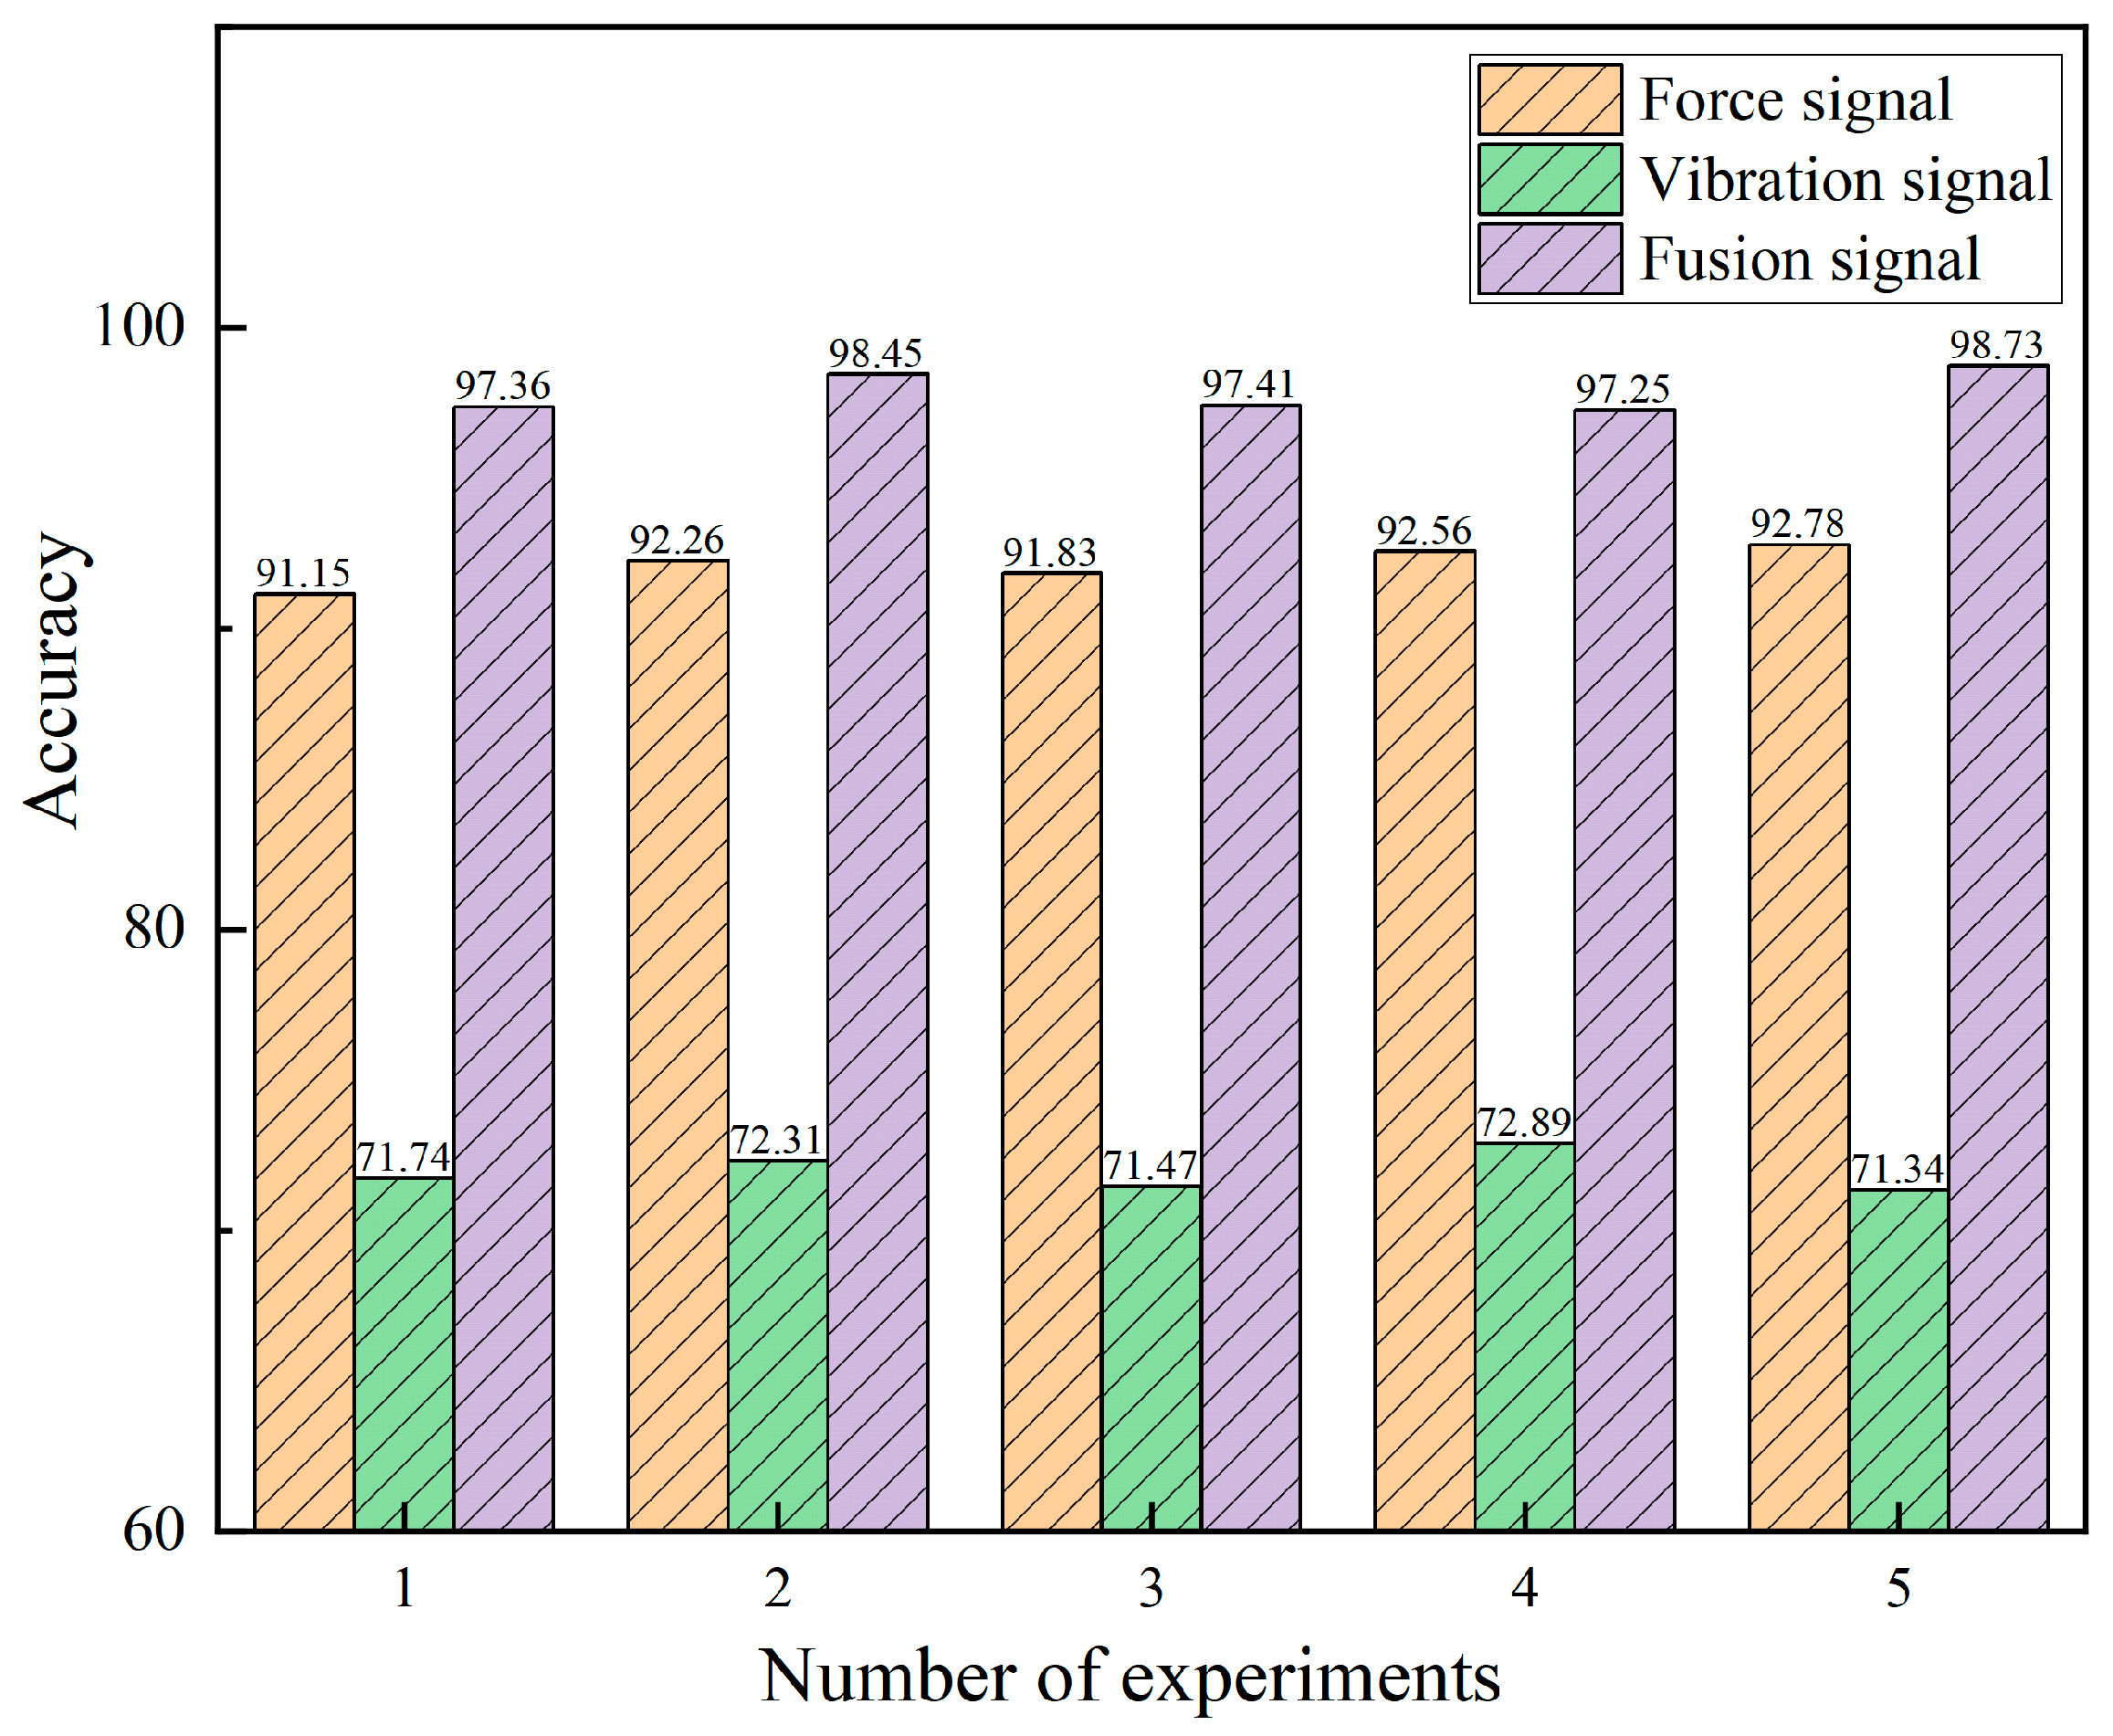
To evaluate the effectiveness of the proposed multi-signal fusion strategy, comparative experiments were conducted between single-signal and multi-signal configurations. In the single-signal mode, either vibration or cutting force data was used as the model input. All signals underwent identical preprocessing procedures, including the generation of time–frequency spectrograms using the SSA-optimized Continuous Wavelet Transform (SSA-CWT). These were then fed into a single branch of the Time–Frequency Fusion Network (TFFN), with the cross-modal fusion module disabled to maintain structural consistency. Each configuration was trained and evaluated five times independently, and the average classification accuracy was recorded to ensure statistical stability and reliability.
In the multi-signal mode, both vibration and cutting force signals were simultaneously used as inputs. Each modality passed through the local feature extraction and global feature modeling modules before being fused via the Shifted Window Multi-Head Cross-Attention (SW-MCA) mechanism. This enabled adaptive cross-modal interaction and complementary enhancement in the time–frequency domain. All models shared identical hyperparameters, training epochs, and data partitioning to ensure fair comparison. The experimental results are presented in
Figure 12 and
Table 7, while the corresponding confusion matrices for different input configurations are illustrated in
Figure 13.
3.4. Ablation Study on SSA-Optimized CWT Parameters
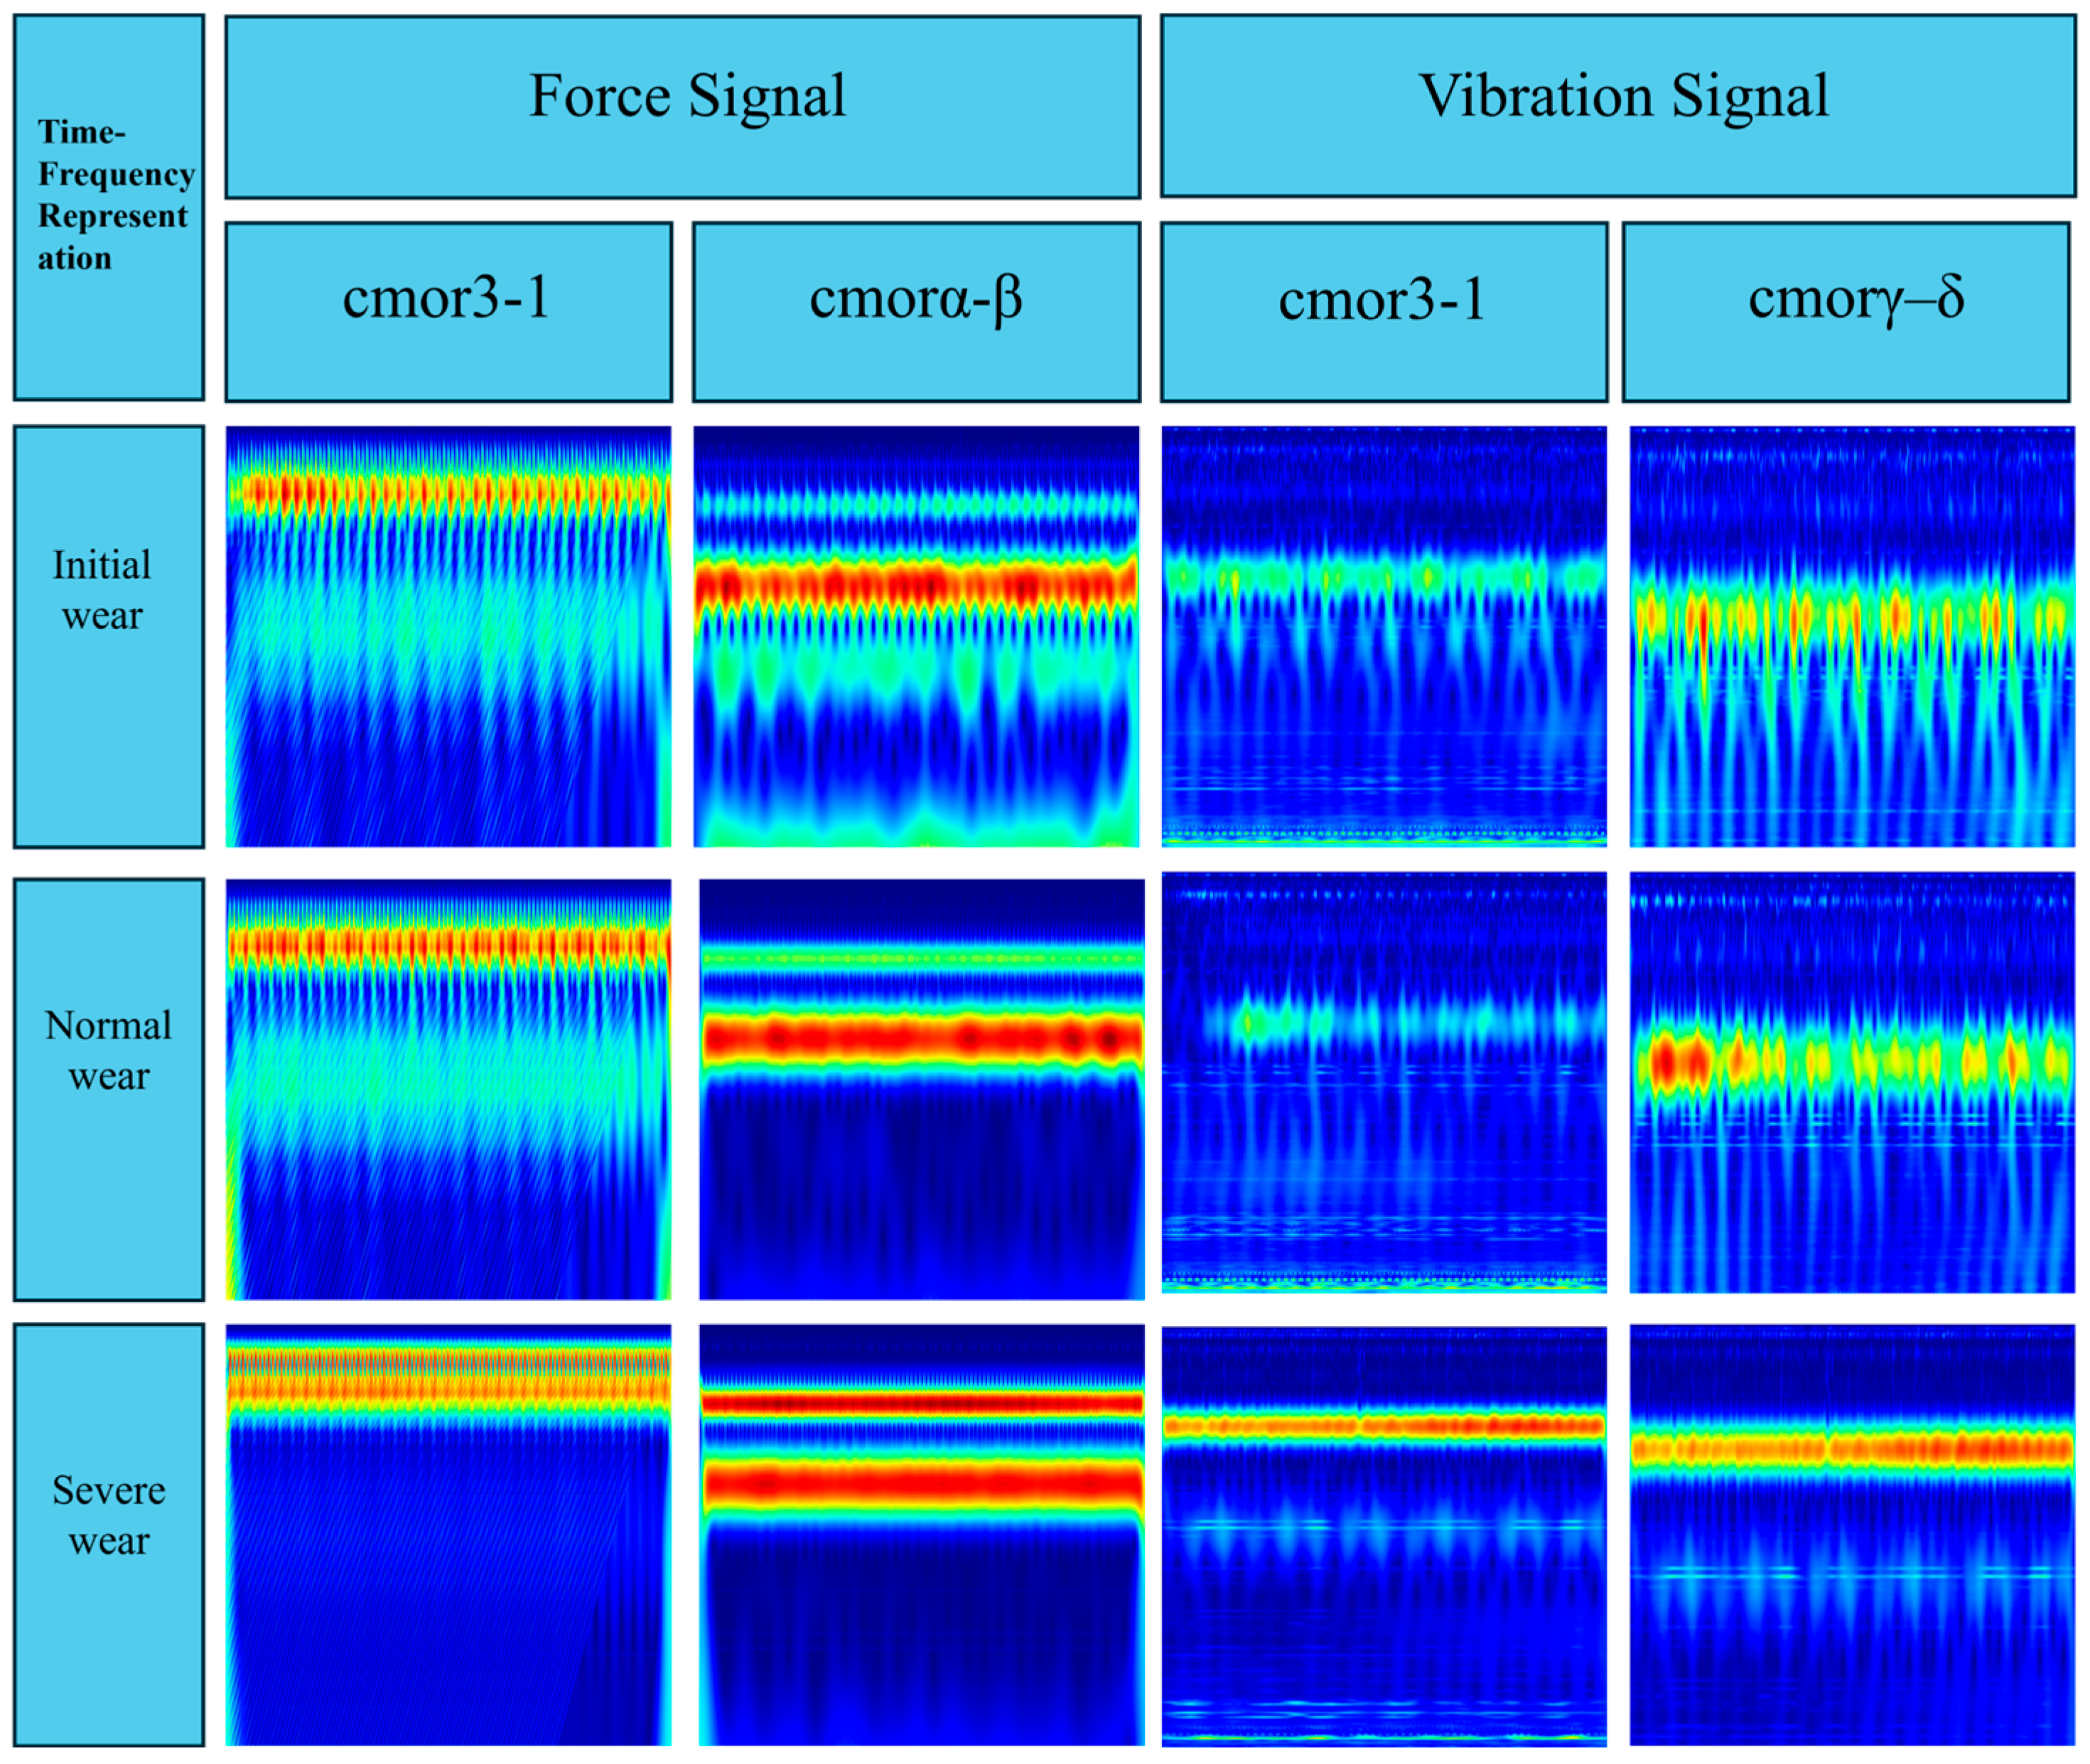
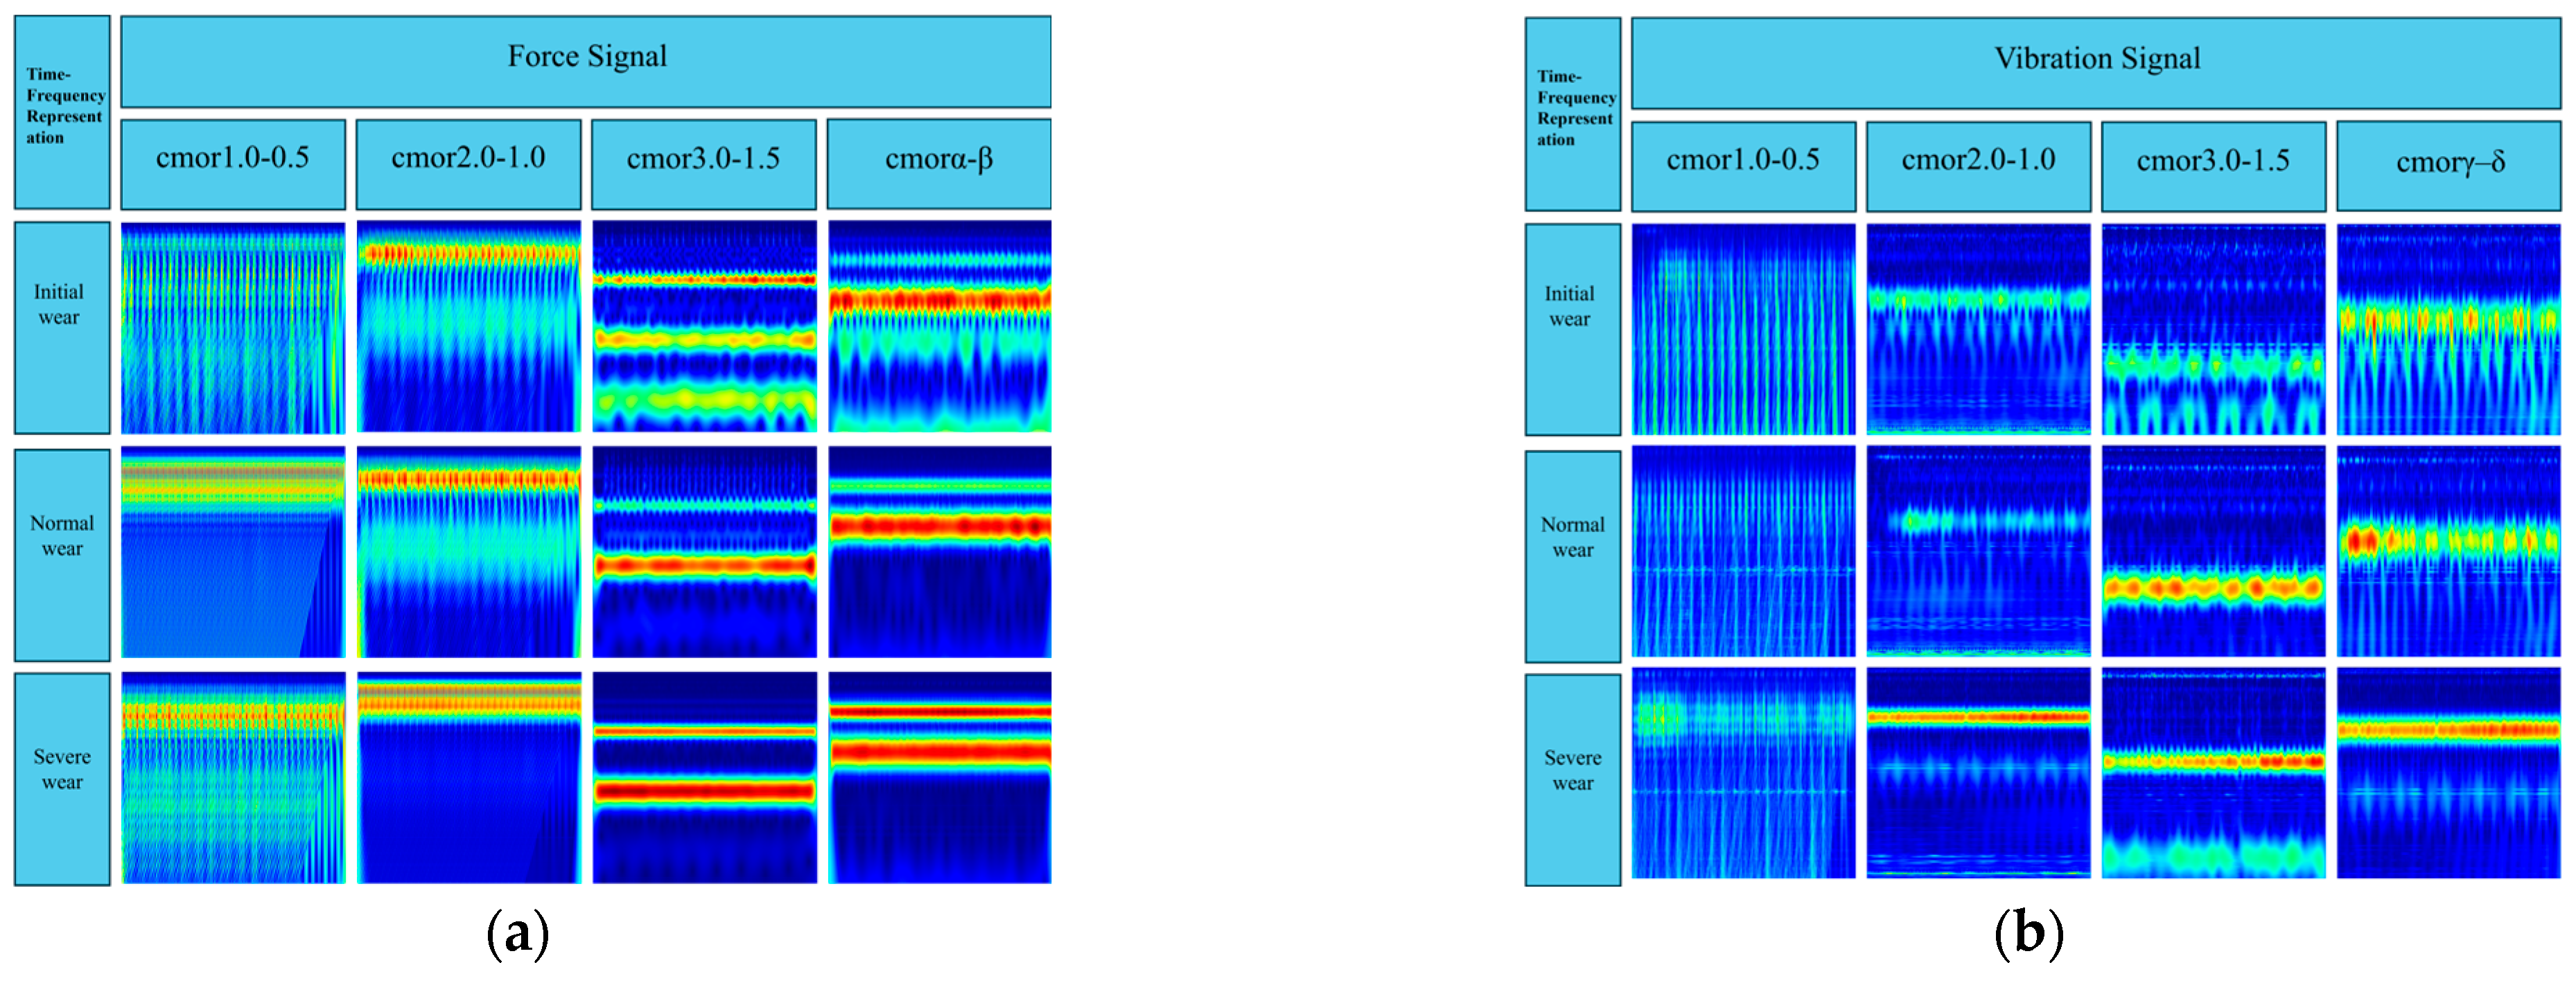
To quantitatively evaluate the impact of CWT parameters on recognition performance and to verify the effectiveness of the proposed SSA-CWT module, an ablation study with four representative complex Morlet (cmor) wavelet configurations was designed based on the time–frequency representations shown in
Figure 14a,b. Specifically,
Figure 14a illustrates the time–frequency distributions of the cutting force signal under different cmor parameter settings and wear stages, whereas
Figure 14b depicts the corresponding results for the vibration signal. Three fixed parameter settings, cmor1.0–0.5, cmor2.0–1.0, and cmor3.0–1.5, were selected as manually designed baseline configurations, and the fourth configuration corresponds to the wavelet parameter pairs optimized by the Sparrow Search Algorithm (SSA), where the cutting force and vibration signals adopt cmorα–β and cmorγ–δ, respectively. For all configurations, an identical multimodal processing pipeline was employed: the three-axis cutting force and vibration signals were first denoised using Hampel filtering and fused by energy-based weighting; high-energy segments were then extracted, and two-dimensional time–frequency representations were obtained via CWT with the corresponding cmor parameters. Finally, the bimodal time–frequency maps of force and vibration were fed into TFF-Net, and all models were trained and tested under the same data partitions and hyperparameter settings to ensure a fair comparison.
For all configurations, an identical multimodal processing pipeline was employed. First, the three-axis cutting force and vibration signals were denoised using Hampel filtering and fused via energy-based weighting. High-energy signal segments were then extracted, and two-dimensional time–frequency representations were obtained by applying CWT with the corresponding cmor parameters. Finally, the bimodal time–frequency maps of force and vibration were fed into TFF-Net, and all models were trained and evaluated under the same data partitions and hyperparameter settings to ensure a fair comparison.
The quantitative results of this ablation study are summarized in
Table 8, which reports the accuracy, F1-score, recall, and precision of the four parameter configurations on the tool wear recognition task. It can be observed that the three manually designed wavelet parameter settings (Configs A–C) already achieve high recognition performance, while the SSA-optimized configuration D (cmorα–β for the force signal and cmorγ–δ for the vibration signal) attains the highest values across all four evaluation metrics, yielding an overall recognition performance superior to that of the manual baseline Config C.
3.5. Ablation Study of the Proposed Framework
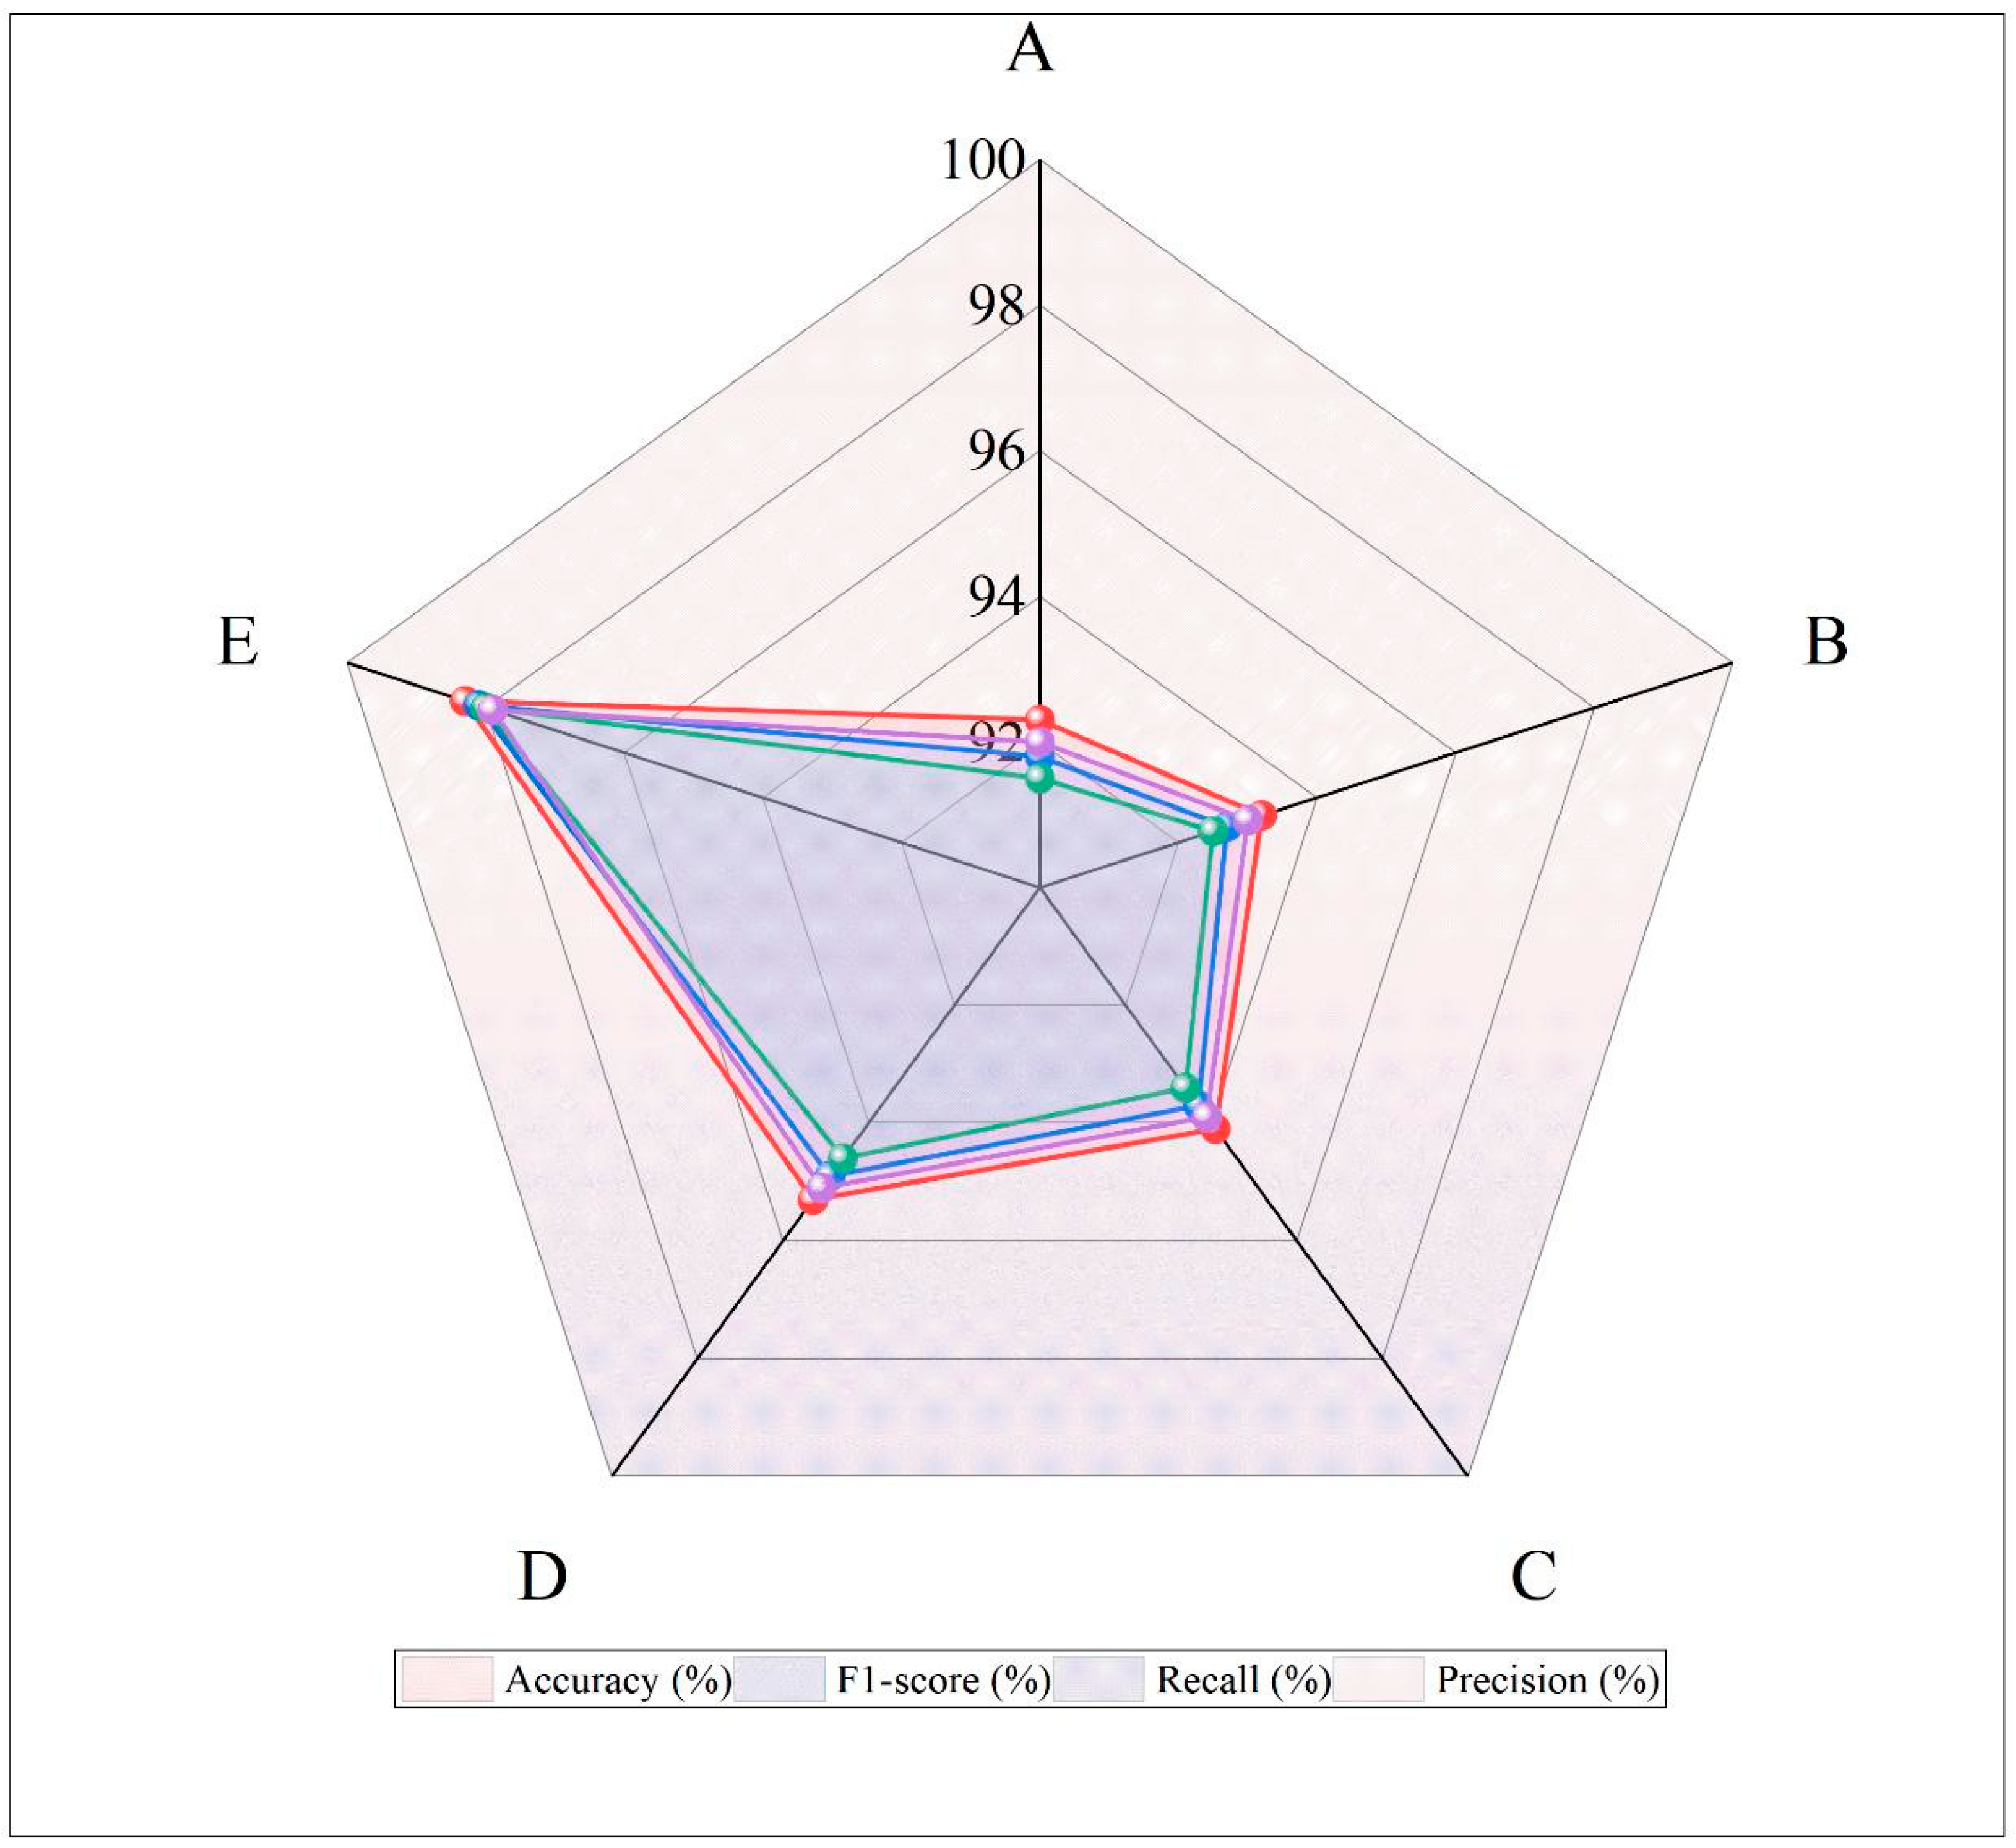
In this section, an ablation study is conducted to evaluate the individual contribution of each component in the proposed framework. Specifically, we investigate the impact of SSA-based wavelet parameter optimization, CWT configuration, preprocessing procedures (Hampel filtering and energy-based fusion), and the cross-modal attention mechanism on tool wear recognition performance. To this end, five model configurations with clearly defined structural differences (Configs A–E) are constructed and trained under identical data partitions and hyperparameter settings to ensure a fair comparison.
Configuration A (Baseline) disables SSA optimization and employs a conventional CWT with fixed cmor3.0–1.5 parameters, without Hampel filtering or energy fusion. The resulting time–frequency representations are directly fed into TFF-Net and serve as the baseline for overall performance comparison. Configuration B corresponds to the full framework without Hampel filtering: the raw three-axis cutting force and vibration signals are first fused by energy-based weighting and then transformed by SSA-optimized CWT before being input to TFF-Net. This setting is used to assess the contribution of Hampel filtering and quantify the effect of noise suppression on feature stability and model robustness. Configuration C retains SSA optimization and Hampel filtering but disables multi-axis energy fusion; instead, only the Fx-axis cutting force component is used as a single-channel input to SSA-CWT and the subsequent network. By comparing this configuration with those using fused multi-axis signals, the benefit of the proposed energy fusion strategy can be quantitatively evaluated. Configuration D preserves SSA optimization, Hampel filtering, and multi-axis energy fusion, but restricts the model to a single modality, i.e., the cutting force signal only, while completely removing the vibration modality and the cross-modal attention mechanism. This design isolates the effect of multimodal interaction and cross-modal attention beyond the influence of preprocessing and time–frequency representation. Finally, Configuration E (Full model) integrates all components of the proposed system, including SSA-optimized CWT, Hampel filtering, energy-based fusion, and the cross-modal attention mechanism, and therefore represents the complete framework and serves as an upper-bound reference.
By comparing the performance of Configurations A–E in terms of accuracy, F1-score, recall, and precision, this ablation study quantitatively reveals the contribution of each module and demonstrates the necessity and effectiveness of SSA optimization, signal preprocessing, multimodal fusion, and cross-modal attention in enhancing tool wear recognition. The corresponding results are summarized in
Table 9, and the performance comparison across these configurations is visually represented in
Figure 15, which illustrates the differences in tool wear recognition performance for each configuration.
3.6. Comparative Study of Cross-Modal Fusion Strategies
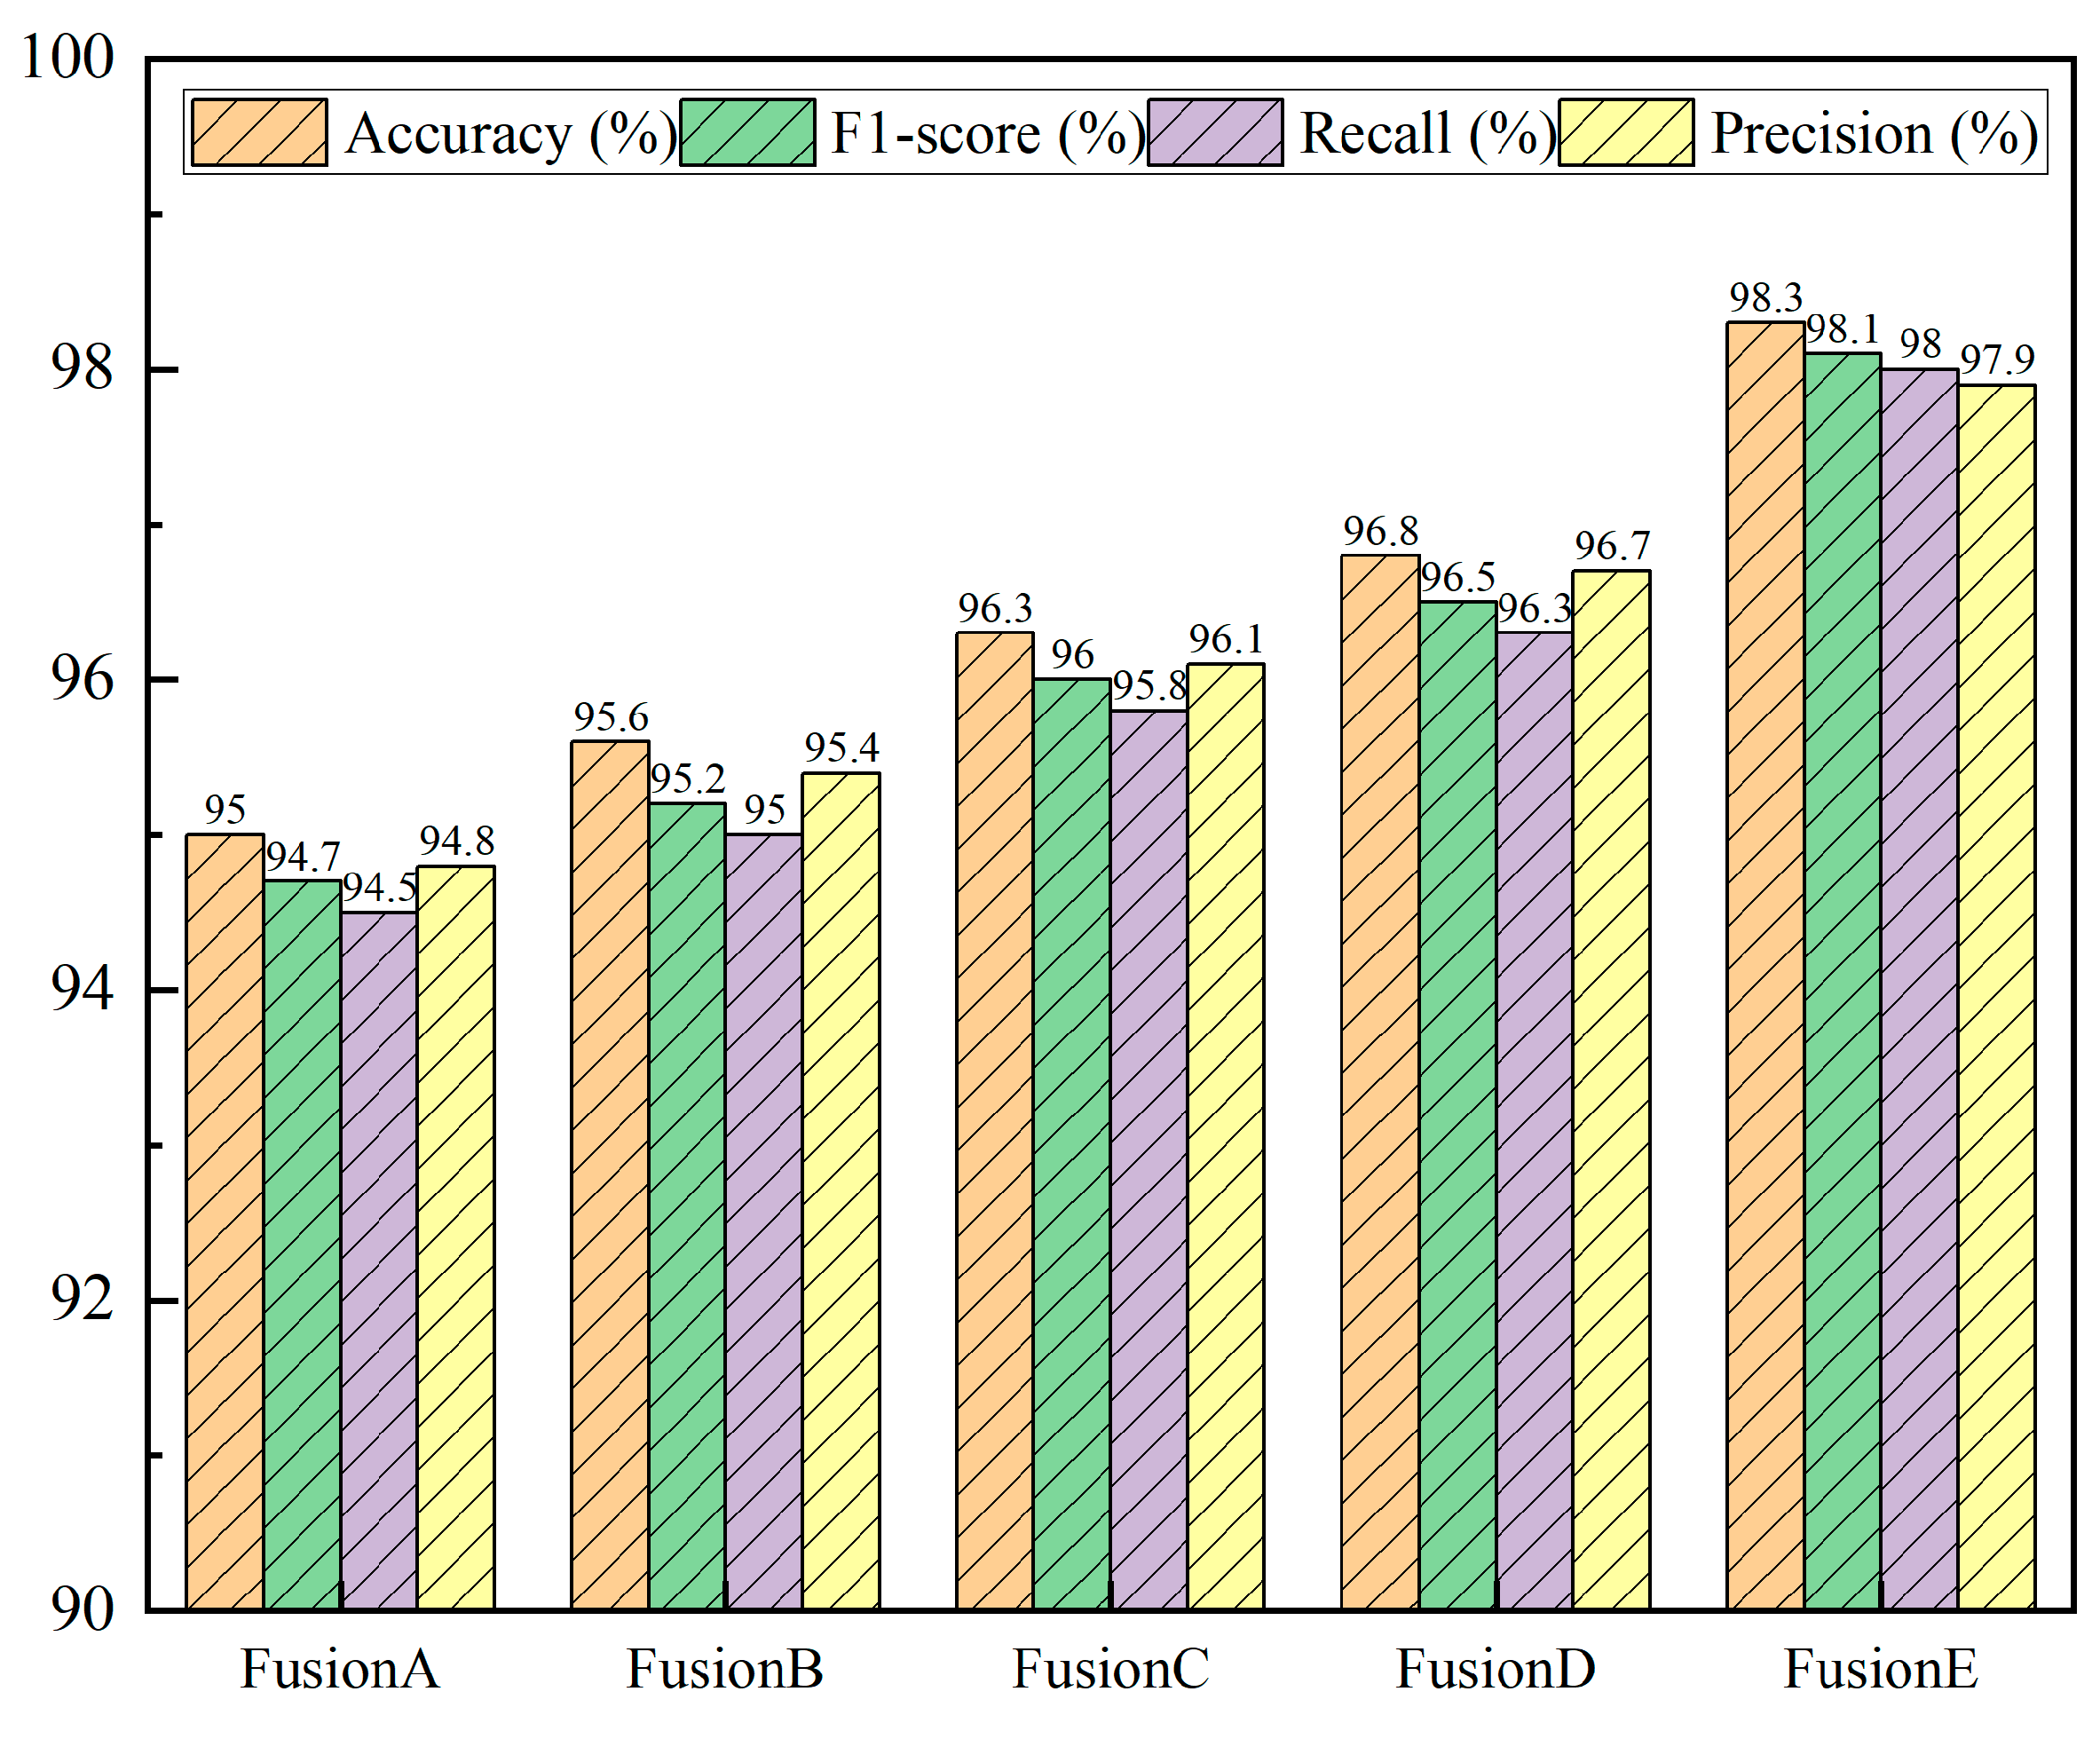
To evaluate the fusion effectiveness of the proposed sliding-window multi-head cross-modal attention mechanism (SW-MCA) and to compare it against commonly used cross-modal fusion methods, a dedicated set of experiments on fusion strategies was conducted. In these experiments, the SSA-CWT-based time–frequency representations of cutting force and vibration signals, as well as the backbone architecture of TFF-Net, were kept unchanged, while only the cross-modal fusion module was replaced. In this way, performance differences can be attributed primarily to the choice of fusion strategy rather than changes in feature quality or model capacity. Specifically, five representative cross-modal fusion configurations were constructed: Fusion A (Early Concatenation), in which the time–frequency features of cutting force and vibration are directly concatenated along the channel dimension and fed into the subsequent network; Fusion B (Late Fusion), in which two independent unimodal branches for force and vibration are built, each performing feature extraction and classification, and their logits are combined by weighted averaging before the final softmax layer; Fusion C (Channel-Attention Fusion), where the two modalities are first concatenated along the channel dimension and then passed through an SE-like channel attention module to adaptively reweight the concatenated features; Fusion D (Global Cross-Attention), which applies a standard multi-head cross-modal attention layer over the entire temporal span between the force and vibration feature sequences to model global cross-modal dependencies; and Fusion E (SW-MCA, Proposed), which partitions the time axis into overlapping sliding windows, performs multi-head cross-modal attention within each local window, and subsequently aggregates the window-wise features. All fusion configurations share the same preprocessing pipeline (Hampel filtering and energy-based fusion), SSA-CWT parameter settings, data partition protocol, and training hyperparameters (optimizer, learning rate, batch size, and number of epochs).
The quantitative results of different cross-modal fusion strategies on the tool wear stage classification task are summarized in
Table 10, where accuracy, F1-score, recall, and precision are reported as evaluation metrics. In addition,
Figure 16 presents a bar-chart comparison of Fusion A–E across these four metrics, providing an intuitive visualization of the performance levels achieved by each fusion strategy.
3.7. Performance Comparison of Different Network Architectures
To validate the performance advantage of the proposed TFF-Net network structure in multimodal time-frequency feature modeling, a comparative experiment was conducted, selecting three typical deep learning models: ConvMixer [
30], Conformer [
31], and Moile-Former [
32]. All models used the same input features, which are time-frequency representations of the cutting force and vibration signals optimized by SSA-CWT, and were trained under consistent hyperparameters to ensure fairness in the experiment.
Table 11 presents the comprehensive performance comparison of the four models in the tool wear recognition task, with evaluation metrics including accuracy, F1-score, recall, precision, inference speed (FPS), and total training time. Additionally,
Figure 17 illustrates the performance distribution across different wear stages, showing a multi-metric comparison of the four models at each stage.
3.8. External Validation Dataset (HMoTP Dataset) and Experimental Results
3.8.1. Experimental Equipment and Parameters
To further evaluate the generalization capability of the proposed model under different machining conditions and tool types, the HMoTP (High-performance Machining of Thin-walled Parts) open dataset was employed for external validation experiments.This dataset originates from tool wear monitoring experiments conducted during high-speed milling of thin-walled titanium alloy components and is designed to provide multi-source signal data for digital twin research in high-performance manufacturing. The workpiece materials were Ti6Al4V and Al7075, both of which are typical aerospace alloys with distinct mechanical and thermal properties. The cutting tool used was a 14 mm diameter double-insert carbide end mill (insert type APMT1135PDER, coated with (Al,Ti)N), operated under dry side-milling conditions throughout the full tool life. All experiments were performed on a Deckel Maho DMU70V five-axis CNC machining center to ensure machining precision and repeatability.
The signal acquisition system integrated multiple sensors to achieve synchronous multi-channel measurement. A Kistler rotating dynamometer was employed to measure the three-component cutting forces (Fx, Fy, Fz) and the axial bending moment (Mz). A Dytran 3263A1 tri-axial accelerometer, mounted on the back surface of the workpiece, was used to capture vibration signals (Vx, Vy, Vz). All channels were sampled at 5 kHz and transmitted to the host computer through a Kistler 5347A4 wireless acquisition module and a multi-channel charge amplifier for synchronous digitization. Each cutting pass was performed along a fixed toolpath under constant spindle speed and feed rate. In total, seven synchronized channels—cutting force, bending moment, and vibration—were recorded, effectively capturing the multimodal dynamic characteristics associated with tool wear evolution.
Tool wear was measured offline after every ten cutting passes using a LEICA digital microscope. The flank wear width (VB) was adopted as the evaluation metric, and based on the measured VB values, the tool wear states were categorized into three stages: initial wear (VB < 0.1 mm), normal wear (0.1 mm ≤ VB < 0.3 mm), and severe wear (VB ≥ 0.3 mm). The wear measurement point was selected at approximately half the distance from the cutting edge to the tool tip to minimize the influence of built-up edge and coating delamination. The complete experimental parameters are summarized in
Table 12.
3.8.2. Dataset Division
In this study, a total of 300 tool wear samples were selected from three experimental sets (T01, T02, and T03) of the HMoTP dataset and used as an independent test set for external validation. The dataset was preprocessed and feature-extracted following the same procedure as the PHM2010 dataset, enabling direct input into the trained model to evaluate its generalization performance under different machining conditions. Each sample contained synchronized signals from seven sensor channels (Fx, Fy, Fz, Mz, Vx, Vy, and Vz) together with the corresponding flank wear value (VB). Since the wear value obtained from a single cutting edge could not accurately represent the overall tool condition, the average wear value of two cutting edges was adopted to determine the representative wear level, thereby reducing the influence of local wear anomalies on the overall evaluation.
Figure 18a illustrates the averaged wear evolution curves of the three experimental sets in the HMoTP dataset, intuitively reflecting the overall wear progression of the tool under various machining conditions.
To ensure consistency with the PHM2010 dataset, the same wear-state division criteria were applied. Based on the averaged VB values, all samples were divided into three wear stages: initial wear (VB < 0.1 mm), normal wear (0.1 mm ≤ VB < 0.3 mm), and severe wear (VB ≥ 0.3 mm). In addition, the K-means clustering algorithm was employed to verify the intra-class compactness and inter-class separability of the samples, ensuring a balanced distribution across the three wear states.
Figure 18b–d present the wear curves corresponding to each wear stage, clearly illustrating the gradual evolution of tool wear from mild abrasion to edge degradation. The statistical distribution of the samples in the three wear stages is summarized in
Table 13.
3.8.3. Experimental Results
To verify the generalization capability of the proposed model, the trained TFF-Net was directly applied to an independent test set constructed from the HMoTP dataset, without any retraining or fine-tuning. The inference experiments were conducted under the same hardware configuration as in previous experiments to ensure consistency in computational conditions.
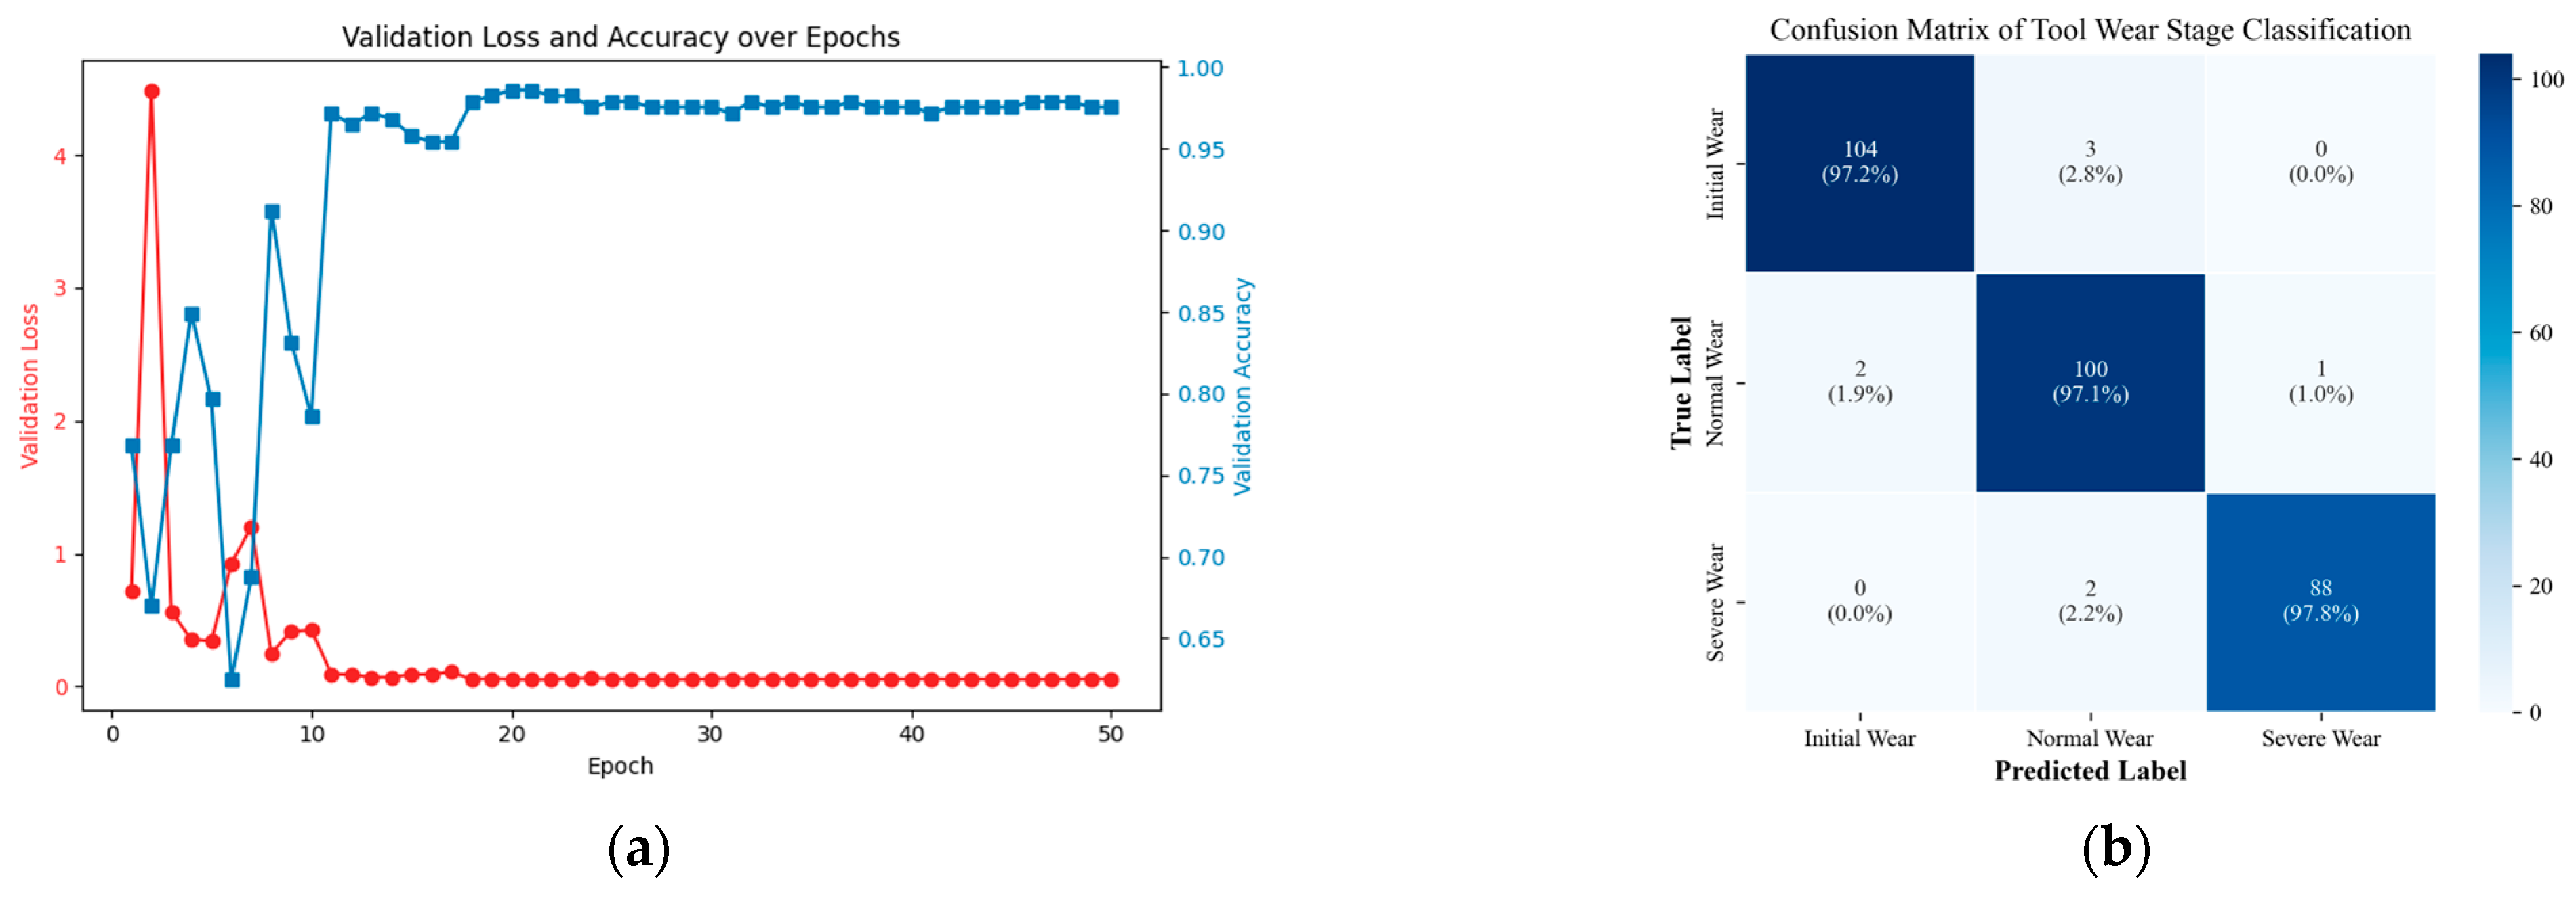
The training and validation performance of the model is illustrated in
Figure 19a. During the training process, the validation loss rapidly decreases and stabilizes after approximately ten epochs, while the validation accuracy quickly rises and remains above 97% thereafter, demonstrating stable convergence and effective generalization.
After training, the model was evaluated on the HMoTP independent test set to assess its recognition performance under different machining conditions. The classification results are shown in
Figure 19b, which presents the confusion matrix of tool wear stage classification. Out of the 300 test samples, the proposed TFF-Net correctly classified 97.3%, achieving class-wise accuracies of 97.2%, 97.1%, and 97.8% for the initial, normal, and severe wear stages, respectively.
4. Discussion
4.1. Analysis of Baseline System Comparison Results
Figure 10b clearly demonstrates the significant differences in accuracy and loss curves between the various methods. The SSA-CWT method exhibits the best classification performance and convergence characteristics throughout the training process. In the early stages of training (around the 5th epoch), the accuracy of SSA-CWT exceeds 0.90 and stabilizes after the 10th epoch, ultimately maintaining between 0.98 and 0.99, almost achieving complete convergence. In contrast, the traditional CWT method shows a similar upward trend, but with a slower pace, stabilizing at 0.94–0.96 after the 10th epoch. The STFT method reaches approximately 0.68–0.70 by the 50th epoch, while the final accuracy for GAF and MTF are 0.62 and 0.58, respectively. The PR method performs the worst, with accuracy remaining between 0.15 and 0.25 throughout the entire training process.
The change in loss curves in
Figure 10a further validates these results. SSA-CWT’s training loss drops sharply within the first 5 epochs, from an initial value of around 0.8 to below 0.1, and remains stable with minimal fluctuation throughout the training process. The CWT method’s convergence is slightly slower, with loss dropping to 0.15–0.2 after the 10th epoch and stabilizing. In contrast, the losses for STFT, GAF, and MTF remain in the range of 1.5–1.8, with slow declines and noticeable fluctuations. The loss curve for the PR method shows almost no significant decrease, hovering between 2.4 and 2.7 for most of the training process.
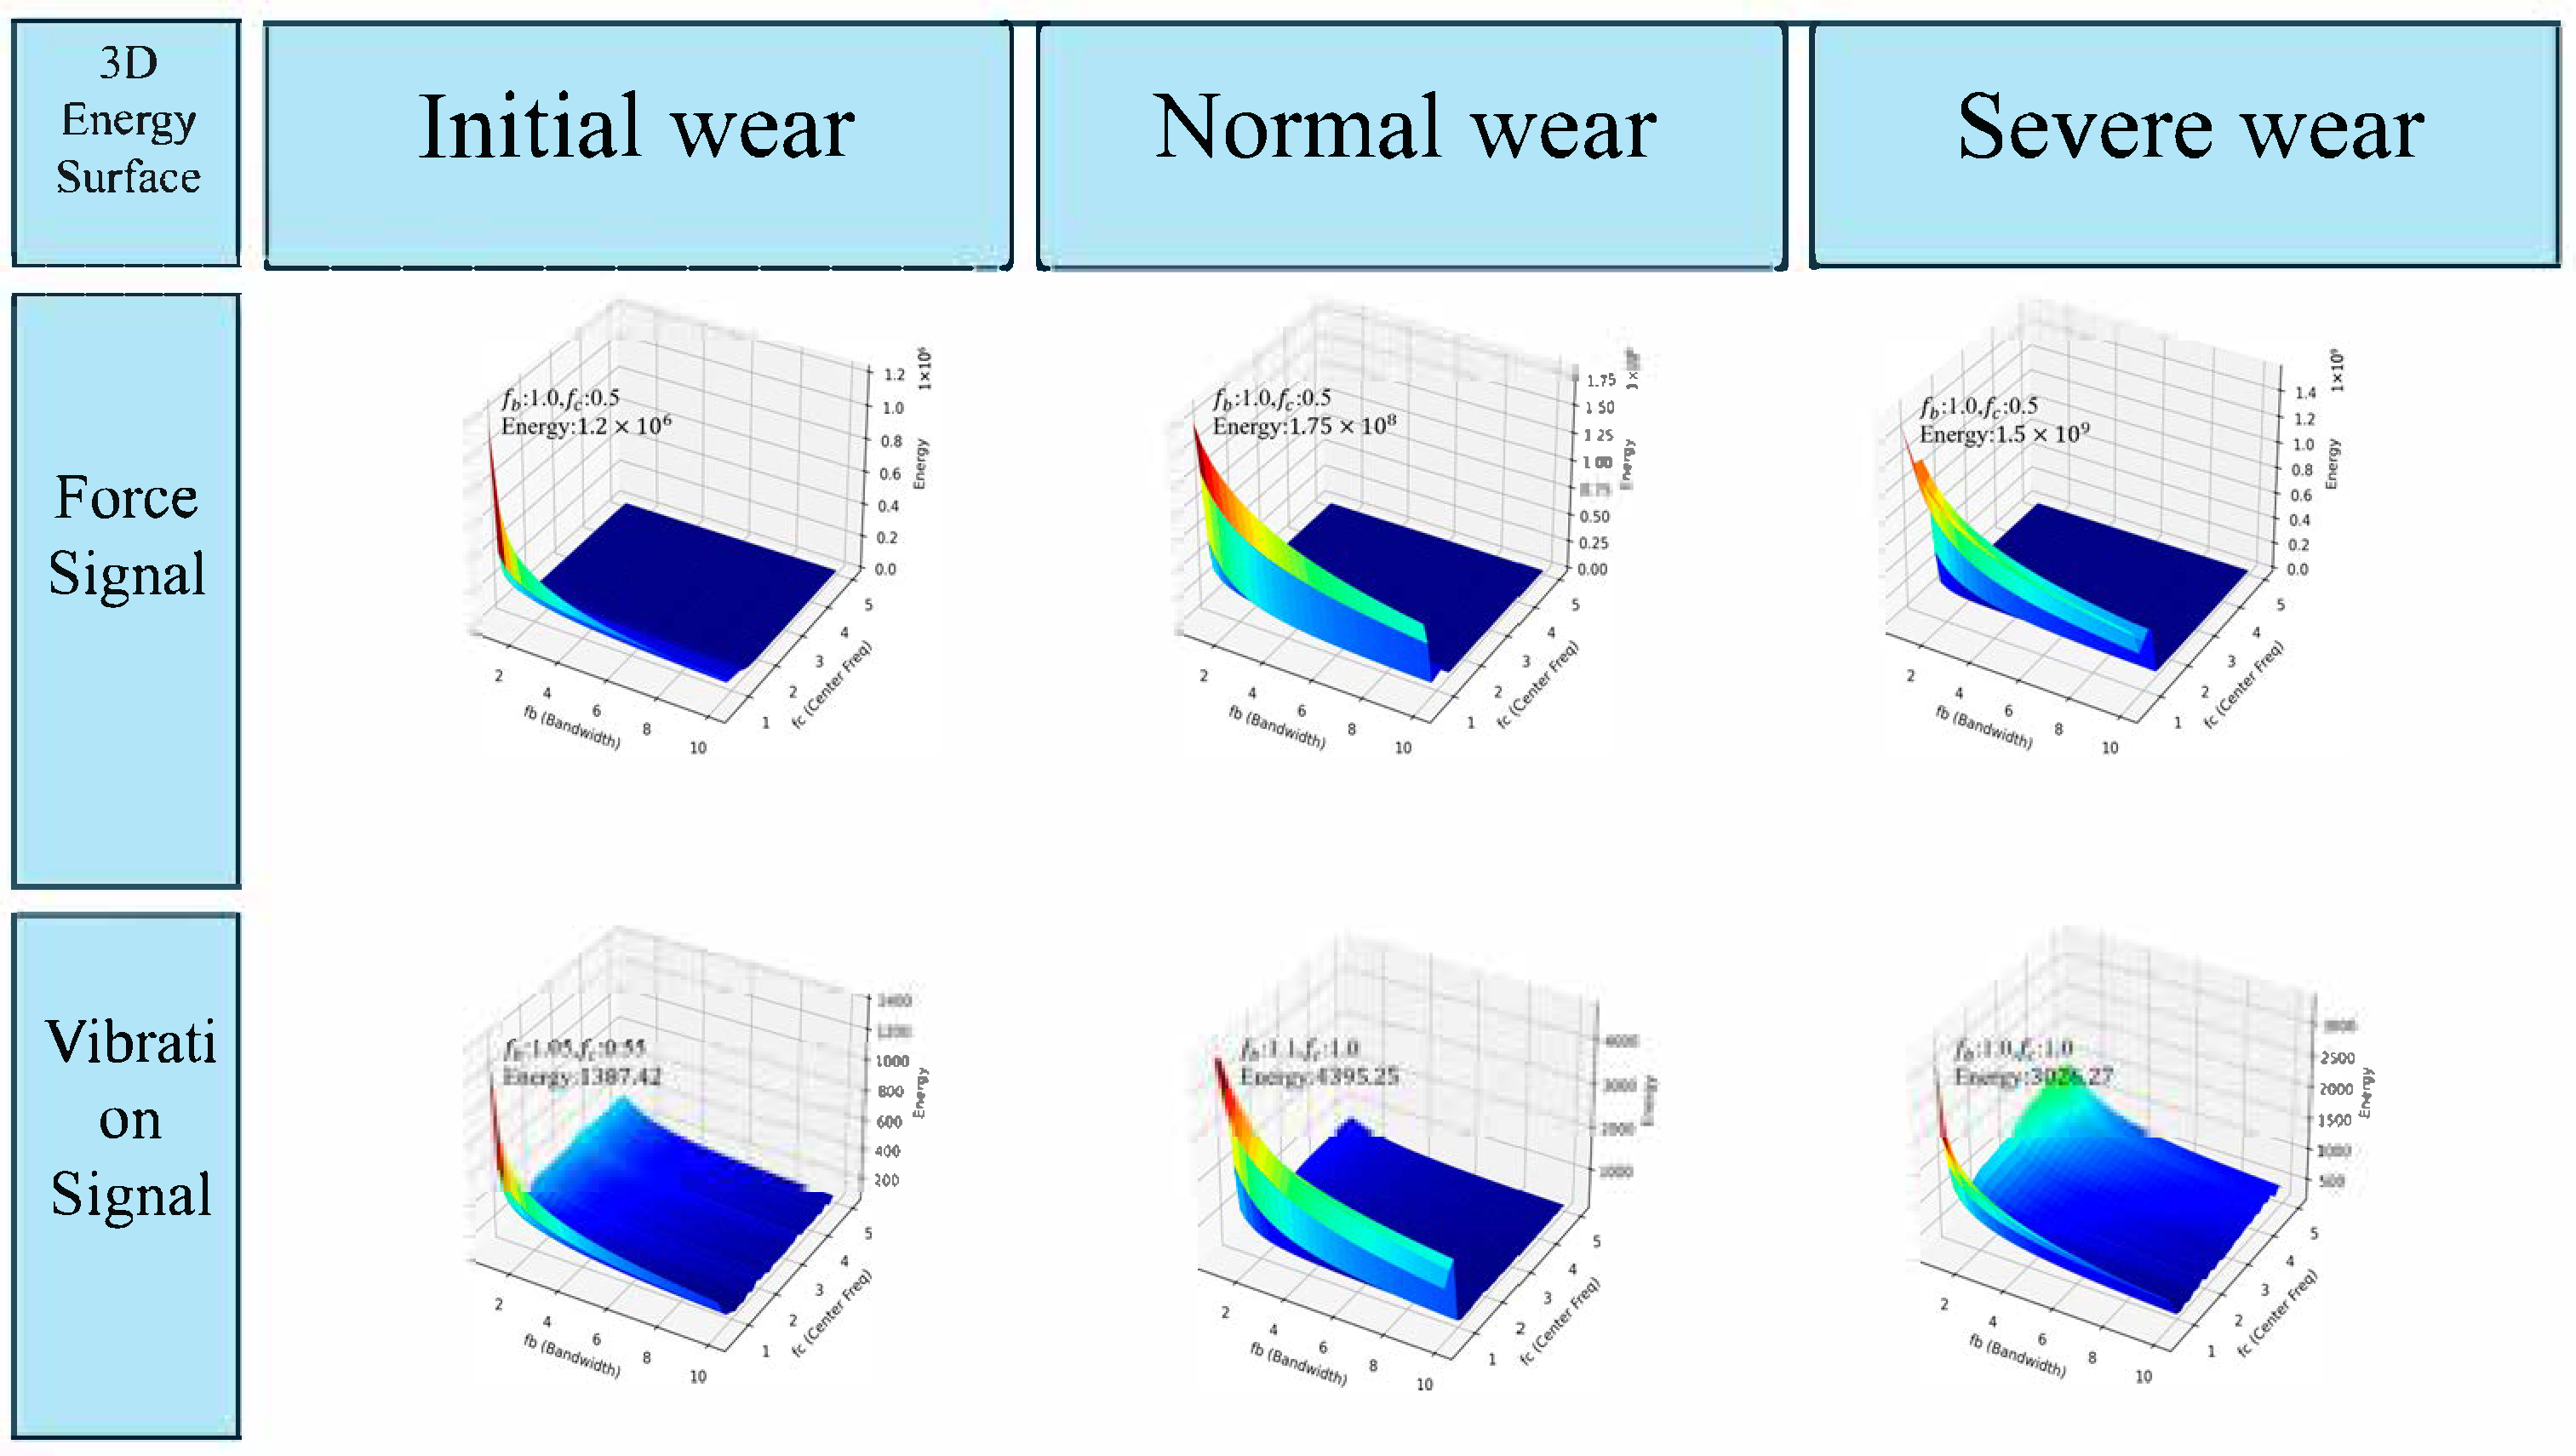
Clearly, SSA-CWT not only achieves the highest accuracy but also demonstrates the lowest loss and the most stable convergence behavior. The significant advantage of SSA-CWT is attributed to its use of the Sparrow Search Algorithm (SSA) for the adaptive optimization of the center frequency and bandwidth of the complex Morlet wavelet. This method minimizes energy entropy as the objective function, performing a global search for the optimal parameter combination on the parameter-energy surface. This results in the concentration of time-frequency energy in key frequency bands and effectively suppresses noise interference, creating clearer energy clustering features in the time-frequency representation. Compared to the fixed parameter CWT method, SSA-CWT not only maintains a balance in time-frequency resolution but also dynamically responds to changes in the frequency distribution of signals at different wear stages, thus capturing transient shocks and non-stationary characteristics of tool wear more effectively.
Therefore, when the time-frequency spectrogram generated by SSA-CWT is used as input to the TFFN, it significantly enhances the discriminability and energy focus of features, enabling the model to converge quickly in the early stages and maintain high accuracy and robustness throughout the training process. Overall, SSA-CWT outperforms PR, MTF, GAF, STFT, and CWT in terms of classification accuracy, convergence speed, and loss stability, demonstrating the effectiveness and superiority of the SSA-optimized wavelet parameter selection strategy in the analysis of tool wear state signals.
As shown in
Figure 11, the six confusion matrices further validate the differences in classification capability among various time–frequency representation methods for tool wear recognition. Overall, SSA-CWT achieved the best performance across all wear stages, with recognition rates of 100% (initial wear), 98.7% (normal wear), and 98.7% (severe wear), and only three minor misclassifications between adjacent categories, demonstrating exceptional accuracy and stability.
In comparison, the CWT method achieved recognition rates of 96.5%/94.0%/96.0%, showing relatively strong overall performance but still exhibiting about 6% boundary confusion between the “normal–severe” classes. This indicates that fixed parameters in conventional CWT struggle to balance the resolution requirements for both high- and low-frequency features. Traditional time–frequency methods such as STFT, GAF, and MTF showed a significant performance drop, particularly in the “normal wear” category, with recognition rates of 73.5%, 62.3%, and 60.9%, respectively. They also exhibited pronounced bidirectional misclassification, reflecting that their energy distributions were overly dispersed and lacked clear inter-class clustering. The PR method performed the worst, with recognition rates below 45% for all wear stages, indicating an inability to effectively capture the non-stationary dynamics of the tool wear signals.
In summary, SSA-CWT, by employing the Sparrow Search Algorithm (SSA) to adaptively optimize the center frequency and bandwidth parameters of the complex Morlet wavelet, achieves highly concentrated signal energy distribution in key frequency bands while effectively suppressing noise. This approach significantly reduces the overlap in the “normal–severe” decision boundary. The proposed optimization strategy not only enhances the energy concentration and feature separability of the time–frequency representation but also improves the discriminative capability and robustness of the model. Consequently, it provides a more reliable and discriminative time–frequency representation framework for tool wear state recognition in complex machining systems.
4.2. Comparison of Single- and Multi-Signal Fusion Experiments
According to the experimental results presented in
Table 7, there is a significant difference in the performance of the tool wear classification task between single-signal and multi-signal fusion modes. From the classification accuracy across five experimental runs, the cutting force signal consistently outperforms the vibration signal. The accuracy of the single cutting force signal remains stable between 91.15% and 92.78%, while the accuracy of the vibration signal fluctuates significantly, ranging from 71.34% to 72.89%. This indicates that the single vibration signal has relatively weak discriminative ability in the tool wear classification task and is unable to provide sufficient feature support.
However, when the multi-signal fusion mode is applied, the model’s classification accuracy improves significantly, ranging from 97.25% to 98.73%, with smaller fluctuations in accuracy across the five runs, indicating stronger stability. The complementary characteristics of the vibration and cutting force signals are maximized through the adaptive fusion enabled by the cross-modal attention mechanism (SW-MCA), which greatly enhances the classification performance.
To further verify the effectiveness of the multi-signal fusion strategy,
Figure 13 shows the confusion matrix results under different input modes. As shown in
Figure 13a, when only the cutting force signal is used, the recognition accuracy for “initial wear” is relatively high (93%), but there is some confusion between the “normal wear” and “severe wear” categories.
Figure 13b illustrates that the overall performance of the vibration signal is weaker, with recognition accuracies of 66.7%, 72.2%, and 70.7% for the three wear stages, indicating that its high-frequency features are more susceptible to noise interference, limiting its discriminative ability. In contrast, the multi-signal fusion result in
Figure 13c is significantly better than the single-signal modes, with recognition accuracies of 100.0%, 98.7%, and 98.7% for the three wear stages. This improvement is attributed to the complementary characteristics of the cutting force and vibration signals in the time-frequency domain and the adaptive fusion via the cross-modal attention mechanism, enabling the model to fully exploit the feature advantages of both modalities and thereby significantly enhance classification accuracy and robustness.
4.3. Analysis of the Ablation Results on SSA-Optimized CWT Parameters
The ablation results in
Table 8 and the time–frequency patterns shown in
Figure 14 jointly demonstrate the importance of properly selecting the cmor wavelet parameters for tool wear recognition. Overall, the three manually designed configurations (Configs A–C) already achieve relatively high performance, confirming that CWT-based time–frequency features are effective for modeling the degradation process of the cutting tool. However, the gradual improvement from Config A to Config C also indicates that the recognition performance is sensitive to the choice of
, and that a suboptimal parameter setting may lead to insufficient feature discrimination.
Specifically, Config A (cmor1.0–0.5) yields the lowest accuracy and F1-score among the four settings. This configuration corresponds to a relatively narrow bandwidth and low center frequency, which tends to over-emphasize certain high-frequency components while introducing noticeable background fluctuations in the time–frequency maps, as seen in
Figure 14. As a result, the time–frequency signatures of different wear stages exhibit partially overlapping patterns, and the separability of the learned features is limited. Config B (cmor2.0–1.0) improves the balance between time and frequency resolution, leading to more regular band structures and clearer energy concentrations in the mid-frequency range, which is reflected by the consistent increase in all four evaluation metrics.
Config C (cmor3.0–1.5) represents a manually tuned baseline that provides the best performance among the fixed parameter choices. In this case, the time–frequency representations of both the force and vibration signals show more stable, band-limited structures across wear stages, with reduced background interference and more distinct differences between the initial, normal, and severe conditions. Consequently, the classifier benefits from more discriminative features and achieves higher accuracy, F1-score, recall, and precision compared with Configs A and B.
Nonetheless, the SSA-optimized configuration (Config D, cmorα–β for force and cmorγ–δ for vibration) further improves the recognition performance beyond the manually tuned baseline. By searching the parameter space with energy entropy as the objective, SSA identifies wavelet parameters that yield more compact and stage-dependent energy distributions in the time–frequency plane. This can be clearly observed in
Figure 14, where the SSA-based representations exhibit sharper energy bands, cleaner backgrounds, and more pronounced inter-stage contrasts for both modalities. Correspondingly, Config D achieves the highest accuracy, F1-score, recall, and precision among all four configurations, indicating that the automatically optimized CWT parameters enable TFF-Net to exploit more informative and less redundant features.
4.4. Results and Analysis of the Ablation Study
In this section, we present the results of the ablation study, evaluating the contribution of each component in the proposed framework. As shown in
Table 9, we compare the performance of five configurations (A–E) in terms of accuracy, F1-score, recall, and precision. The results highlight the impact of each module on tool wear recognition performance and demonstrate the importance of combining SSA optimization, signal preprocessing, multimodal fusion, and the cross-modal attention mechanism.
Configuration A (Baseline) serves as the control experiment, disabling SSA optimization and using a conventional CWT with fixed cmor3.0–1.5 parameters, without Hampel filtering or energy fusion. As expected, it performs the worst across all metrics, with an accuracy of 92.3%, an F1-score of 91.8%, a recall of 91.5%, and a precision of 92.0%. This result underscores the crucial role of SSA optimization and signal preprocessing in improving model performance.
Configuration B introduces SSA optimization and energy fusion while removing Hampel filtering. This configuration results in a noticeable improvement across all metrics, with accuracy reaching 93.2%, F1-score of 92.7%, recall of 92.5%, and precision of 93.0%. This significant performance improvement demonstrates the contribution of SSA optimization and energy fusion to feature extraction and stability.
Configuration C retains SSA optimization and Hampel filtering but disables multi-axis energy fusion, instead using only the Fx-axis cutting force signal as a single-channel input for SSA-CWT and subsequent modeling. This configuration further improves performance, achieving an accuracy of 94.1%, an F1-score of 93.7%, a recall of 93.4%, and a precision of 93.9%. The results highlight the importance of multi-axis fusion in enhancing recognition performance and further validate the necessity of energy fusion for utilizing multi-axis information.
Configuration D preserves SSA optimization, Hampel filtering, and multi-axis energy fusion but restricts the model to a single modality, i.e., the cutting force signal only, while completely removing the vibration modality and the cross-modal attention mechanism. This configuration achieves an accuracy of 95.3%, an F1-score of 94.9%, a recall of 94.6%, and a precision of 95.1%, confirming the positive impact of the cross-modal attention mechanism in multimodal feature interaction and highlighting its significance in processing multimodal signals.
Finally, Configuration E (Full Model) integrates all components of the proposed system, including SSA-optimized CWT, Hampel filtering, energy fusion, and the cross-modal attention mechanism. This configuration performs the best across all metrics, with an accuracy of 98.3%, an F1-score of 98.1%, a recall of 98.0%, and a precision of 97.9%. This result clearly demonstrates that the combination of SSA optimization, preprocessing, multimodal fusion, and cross-modal attention maximizes the model’s tool wear recognition performance.
The results in
Table 9 and the visual comparison in
Figure 15 further illustrate the gradual performance improvements as more components are incorporated. SSA optimization alone (in Configuration B) leads to a significant performance boost, while additional preprocessing steps, such as Hampel filtering and energy fusion, further enhance the performance. The addition of the cross-modal attention mechanism (in Configuration E) brings the most significant improvement, confirming its crucial role in handling multimodal inputs and enhancing feature interaction.
In conclusion, this ablation study quantitatively demonstrates the necessity and effectiveness of each module in improving overall tool wear recognition performance.
4.5. Results and Discussion on Cross-Modal Fusion Strategies
The comparative results of different cross-modal fusion strategies are reported in
Table 10, and their performance distributions are visualized in
Figure 16. Overall, all five fusion schemes (Fusion A–E) achieve relatively high recognition performance, confirming the effectiveness of multimodal integration of cutting force and vibration signals for tool wear stage classification. However, clear performance differences can be observed as the fusion mechanism becomes progressively more structured and attention-aware. The simplest early feature concatenation scheme (Fusion A) yields the lowest performance, with an accuracy of 95.0%, F1-score of 94.7%, recall of 94.5%, and precision of 94.8%, indicating that naive stacking of multimodal features without explicit interaction modeling is suboptimal. Late fusion at the decision level (Fusion B) brings a modest improvement (95.6% accuracy), suggesting that independent unimodal experts with score-level aggregation can better exploit complementary information than raw feature concatenation, but still lack fine-grained cross-modal alignment in the feature space.
When channel-attention-based fusion (Fusion C) is adopted, all metrics improve further (96.3% accuracy, 96.0% F1-score), demonstrating that reweighting the concatenated channels helps emphasize more informative feature dimensions across modalities. The global cross-attention scheme (Fusion D) achieves the strongest performance among the baseline fusion strategies, with 96.8% accuracy, 96.5% F1-score, 96.3% recall, and 96.7% precision, showing that explicitly modeling global cross-modal dependencies between force and vibration sequences is more effective than simple concatenation or channel-wise recalibration. The proposed SW-MCA-based fusion (Fusion E) further surpasses all other configurations, achieving 98.3% accuracy, 98.1% F1-score, 98.0% recall, and 97.9% precision. Compared with the best baseline (Fusion D), SW-MCA provides gains of approximately 1.5% in accuracy, 1.6% in F1-score, 1.7% in recall, and 1.2% in precision. These results indicate that introducing sliding-window local cross-modal attention, rather than relying solely on global interactions, enables finer temporal alignment and more effective exploitation of complementary dynamics between cutting force and vibration signals, thereby yielding a more discriminative and robust multimodal representation for tool wear recognition.
4.6. Comparative Analysis of Different Network Architectures
As shown in
Table 11 and
Figure 17, the overall performance of all models significantly improves after the introduction of multi-source signal fusion, indicating that the joint representation of cutting force and vibration signals effectively enhances the time–frequency characterization and discriminative capability of the models. However, notable differences remain among the network architectures in terms of fusion efficiency and modeling capability, leading to varying degrees of performance improvement.
Among the four compared architectures, ConvMixer primarily relies on convolutional operations with local receptive fields, which limits its ability to capture long-range dependencies. Although multi-signal input slightly improves its classification performance, the model still struggles to fully exploit cross-modal feature correlations, resulting in a relatively low accuracy of 90.2%. Its training process is comparatively fast, requiring only 6.7 min for 50 epochs, but the overall performance improvement remains limited. In contrast, Conformer, which integrates convolutional and Transformer modules, achieves a better balance between local and global feature modeling, reaching an accuracy of 94.1%. However, its fixed fusion mechanism restricts adaptive weighting between modalities, leading to partial redundancy among features. Moreover, its training time is about 11.7 min, reflecting a higher computational complexity. Mobile-Former further enhances feature interaction through lightweight parallel channels and bidirectional communication, achieving both high accuracy (95.0%) and fast inference speed (60 FPS) with a moderate training time of 8.3 min. Nevertheless, the limited depth of cross-modal interaction constrains its ability to model complex nonlinear time–frequency dependencies.
In comparison, the proposed TFF-Net exhibits a distinct advantage in its feature fusion strategy. By incorporating a cross-modal attention mechanism (SW-MCA), the network adaptively allocates feature weights across modalities and achieves multi-scale feature alignment and compensation. The cutting force signal contributes stable low-frequency energy information, while the vibration signal captures high-frequency transient responses. Their complementary properties in the time–frequency domain significantly enhance the discriminability of the fused representation. As a result, TFF-Net achieves the best overall performance across all evaluation metrics—accuracy, F1-score, recall, and precision—all exceeding 98%. Although its inference speed (35 FPS) is slightly lower than that of Mobile-Former (60 FPS) and ConvMixer (75 FPS), and its training time is longer (15.0 min for 50 epochs), the substantial improvement in recognition accuracy and stability under complex operating conditions far outweighs the marginal increase in computational cost, demonstrating an excellent performance–efficiency balance.
Further insights can be drawn from the results at different tool wear stages. As illustrated in
Figure 17a–c, TFF-Net consistently outperforms the other models throughout the entire wear process. In the initial wear stage (
Figure 17a), where signal variations are minimal, all models exhibit relatively high classification accuracy. Nevertheless, TFF-Net stands out with a perfect 100% accuracy, and its F1-score, recall, and precision all exceed 99%, indicating superior sensitivity to subtle feature variations and excellent feature capture ability. In the normal wear stage (
Figure 17b), as signal fluctuations intensify and feature complexity increases, the classification task becomes more challenging. TFF-Net maintains robust performance with an accuracy of 98.7%, showing remarkable stability and generalization. In contrast, Mobile-Former and Conformer show decreased accuracies of 95.3% and 94.8%, respectively, while ConvMixer drops to 90.3%, confirming that TFF-Net possesses stronger adaptability and resistance to dynamic signal perturbations. When entering the severe wear stage (
Figure 17c), the energy distribution of the signals becomes highly uneven, and noise interference increases significantly, imposing higher demands on model robustness. Even under such challenging conditions, TFF-Net retains its superior performance, achieving 98.7% accuracy with F1-score, recall, and precision all exceeding 98%. In comparison, Mobile-Former and Conformer reach 94.5% and 94.1%, respectively, while ConvMixer drops to 88.6%, with more pronounced fluctuations.
Overall, TFF-Net achieves the best and most stable performance across all wear stages, fully validating its effectiveness in multi-source signal fusion and time–frequency feature modeling. The proposed architecture demonstrates strong robustness and adaptability, enabling high-precision and reliable recognition of tool wear states under complex operating conditions, thereby providing a promising solution for intelligent manufacturing and equipment health monitoring.
4.7. External Validation Dataset (HMoTP Dataset) and Analysis of Experimental Results
The results obtained from the external validation experiment on the HMoTP dataset demonstrate that the proposed TFF-Net possesses strong generalization and cross-condition adaptability. Despite being trained solely on the PHM2010 dataset, the model achieved a classification accuracy of 97.3% on the independent HMoTP dataset without any retraining or fine-tuning. This confirms that the proposed SSA-CWT + TFF-Net framework can effectively extract discriminative and transferable time–frequency features that remain stable under varying cutting conditions and tool geometries.
The stable validation curve shown in
Figure 19a further verifies that the model converges efficiently and maintains high generalization performance. The confusion matrix in
Figure 19b indicates that nearly all samples were correctly classified across the three wear stages, with only a few misclassifications between the initial and normal wear stages, where the feature distributions are inherently overlapping. The absence of significant confusion between the normal and severe wear stages implies that the proposed cross-modal time–frequency fusion mechanism effectively captures wear-related degradation patterns.
Overall, these results demonstrate that the proposed method exhibits excellent robustness and transferability across different datasets and machining conditions, providing a reliable basis for intelligent tool wear monitoring in practical industrial applications.
