Article

Experiment Study on Flow-Induced Vibration of O-Type Ball Valve

1
Nuclear and Radiation Safety Center, Ministry of Ecology and Environment, Beijing 100082, China
2
Institute of Advanced Equipment, Zhejiang University, Hangzhou 310027, China
3
Sanmen Nuclear Power Co., Ltd., Taizhou 317112, China
*
Author to whom correspondence should be addressed.
Machines 2025, 13(11), 1065; https://doi.org/10.3390/machines13111065
Submission received: 24 October 2025 / Revised: 10 November 2025 / Accepted: 15 November 2025 / Published: 19 November 2025

Abstract

O-type ball valves are common flow devices that are widely used in different industrial applications. A vibration often occurs when fluid flows through O-type ball valves, and it affects the efficiency and reliability of industrial systems. In this paper, the flow-induced vibration of O-type ball valves is investigated through experimental methods. A vibration experimental platform with the function of isolating the external vibration sources is designed. By analyzing the experimental phenomena and vibration signals, the variation law at various valve openings can be distinguished into two typical conditions, non-cavitation and cavitation conditions. The intensity of vibration exhibits a linear correlation with the square root of the pressure differential across the valve under non-cavitation conditions. The intensity of vibration suddenly rises at specific flow velocities under cavitation conditions. The rise in vibration intensity is concentrated in the higher frequency band of 315–8000 Hz. The relationship between the critical flow velocity at which valve vibration suddenly rises and the valve opening is also proposed based on the nonlinear least squares fitting method. The critical fluid velocities at different valve openings can be predicted through this fitted function. These works are good for the design of vibration suppression of O-type ball valves and further research on the mechanism of the coupling effect between cavitation and vibration.

1. Introduction

In various industrial applications such as energy [1], aerospace, and machinery [2], fluid flow is always present. As one of the most commonly used components, O-type ball valves are often used to control flow. The geometric structure of the O-type ball valve is shown in Figure 1. This valve controls flow by rotating the valve core. However, O-type ball valves often induce flow-induced vibrations, which can lead to control failure and structural damage [3]. Flow-induced vibration is a vibration phenomenon caused by fluid–structure interaction (FSI) [4]. This not only affects the flexibility of operation but also the reliability of the entire industrial system.
The control of pressure pulsations and vibrations in hydraulic systems is critical for reliability and noise reduction, as emphasized by industry standards such as ISO 10767-1 [5], which specifies requirements for pressure ripple levels and their measurement. Recent research has advanced the understanding and mitigation of these phenomena across a wide frequency spectrum. For instance, Stosiak et al. [6] proposed a hybrid pressure pulsation damper effective across both low-frequency (below 100 Hz) and high-frequency (several hundred Hz) ranges, demonstrating that pressure pulsations originate from diverse sources, including pump flow ripple and external mechanical vibrations. Their work underscores the importance of developing suppression devices capable of operating over a broad frequency band. Furthermore, the passive energy storage and damping contributions of hydraulic accumulators have been extensively studied. Stosiak and Karpenko [7] demonstrated that a hydropneumatic accumulator significantly increases system capacitance and damping, thereby reducing dynamic pressure peaks and noise levels during hydrostatic drive transients. Their findings highlight the accumulator’s role in shaping system dynamics through wave propagation and reflection principles, offering a cost-effective means of vibration control.
Due to the high demand for ball valves, scientists have paid significant attention to various aspects of ball valves, including their flow performance, seal performance, erosion characteristics, and so on. Chen et al. [8] researched the accuracy of the four turbulence models with two cavitation models in a ball valve cavity simulation. Iravani et al. [9] carried out research on the flow coefficient and the loss coefficient for ball valves in compressible flow. Zhao et al. [10] investigated the cavitation distribution and emphasized the key function of the stagnation effect. Miao et al. [11] analyzed the flow characteristic of a control ball valve, and the location of a cavity in the ball valve was found. Zhao et al. [12,13] proposed a novel ball valve spool design method for linear flow control. As for the leakage and sealing issues of ball valves, Arora et al. [14] paid attention to the impact of the different magnetorheological finishing (MRF) processes on the seal performance of the ball valve seat. Teles et al. [15] researched the pressure signature profiles based on the moving variance method and identified the leakage in ball valves. Shi et al. [16] proposed an internal leakage detection method of the ball valve using stacking ensemble learning. Sotoodeh et al. [17] found that a deposit of graphite packing on the ball valve’s stem caused the failure of the valve. Regarding the erosion issues, Chen et al. [18] analyzed the gas–liquid–solid multiphase flow in ball valves and the flow-induced erosion characteristics through simulation methods and experimental testing. Zhao et al. [19] carried out a failure analysis of the ball valve and found that erosion of concentrated salts with the electrochemical corrosion are the main reason. Chemaa et al. [20] used the twin-wire arc spray for the ball valve’s surface to improve the performance of corrosion. Moses et al. [21] proved that the failure of a brass ball valve in a partially opened state was caused by extensive fluid erosion and cavitation erosion. Zhu et al. [22] found that the corrosion resistance of ball valves can be improved by the method of laser cladding of Ni60 + WC powder.
Research on ball valves covers multiple aspects, but research on valve vibration is still in the exploratory stage. In fact, valve vibration has become a hot topic in this field in recent years, and scientists have conducted extensive explorations into it. Awad et al. [23] proposed a theoretical model to clarify the excitation mechanism of the turbine inlet valve’s self-excited vibrations. Lv et al. [24] investigated the vibration suppression in a hydraulic servo valve using distributed-parameter mathematical models. Stosiak et al. [25,26] performed research on the effects of external vibration on the valves, and they pointed out the effectiveness of vibration isolation raised by using materials with elastic and dissipative properties. Wang et al. [27] performed research on friction-induced vibration based on spectral kurtosis and peak spectrum for a four-way reversing valve. Musselman et al. [28] proposed a novel processing method for vibration signals of slit valves, and different vibration patterns can be distinguished through this method. Lyu et al. [29] investigated the vibration of pumping systems using experimental methods. They found that a large axial vibration and a small radial vibration on both sides of the valve occurred when the check valve opened. Wang et al. [30] proposed a novel structure for the twin rotary flowrate valve, which had better ability to control the vibration waveform amplitude and the vertical shift. Schröders et al. [31] analyzed the vibration issues in a simple hydraulic circuit and proposed asymptotic approximations of self-excited and forced oscillations. They also described this system via a singularly perturbed third-order differential equation. Miyaki et al. [32] demonstrated a soft compact valve that can induce self-excited vibration. This vibration can help the valve to propel through a 25 mm gap smoothly. Ordoñez et al. [33] measured the low-amplitude vibration for control valves and found that the dominant frequency of valves in the range of 10 to 100 Hz. Kovacevic et al. [34] investigated the free vibration responses of wireless valve position indication sensor systems. The best choice of design and material was proved through the stiffness-to-weight ratio and eigenfrequencies. Zhong et al. [35] turned vibration into a vibration-based measurement method to detect the switching behaviors of the solenoid switching valves. Vibration was also turned into an ultrasonic vibration technology to inhibit the emergence of the edge burrs on the valve sleeve by Wang et al. [36].
For hydraulic machinery, vibrations caused by fluid flow are a significant issue that cannot be overlooked. Scholars have conducted explorations into the connection between the vibration and the cavitation. Lu et al. [37] found that, as a centrifugal pump, cavitation and vibration were strongly connected during the start-up process, and they also proved that the vibration induced by cavitation is above 1000 Hz. The inception and development of cavitation of centrifugal pumps was investigated as well [38]. Feng et al. [39] proposed an accurate cavitation identification method based on the vibration in hydraulic turbines. Liu et al. [40] analyzed the vibration of the cylinder liner, and they found that the vibration-induced cavitation is closely related to the acoustic characteristic of the water jackets. Many cavitation- and vibration-related studies have also been conducted on high-speed helical gears [41], orifice plates [42], Venturi reactors [43], pumps [44], and so on.
In the field of the vibration analysis of valves, some simulation investigations have been conducted by our group [45]. There is a lack of research on flow-induced vibration of ball valves using experimental methods in the valve field. This paper investigated the flow-induced vibration characteristics of O-type ball valves considering cavitation phenomena based on experimental methods. A valve vibration experimental platform with the capability of isolating external vibrations was proposed. The effectiveness of vibration isolation of the experimental platform was verified. The valve vibration intensities under different valve openings and flow velocities were analyzed, and the vibration changes caused by cavitation phenomena during the flow process were also analyzed. This work reveals the vibration changes in O-type ball valves under different operating conditions, and it aids in the design of vibration suppression of O-type ball valves and further research on the mechanism of the coupling effect between cavitation and vibration.

2. Experimental Design and Setup

Valve testing often occurs within a complete piping system, which usually has several vibration sources. These sources, like pumps, transmit vibrations through the pipes and thus complicate accurate measurement of the vibration signal. Therefore, in this section, a novel vibration experimental design is proposed that includes the function of isolating external vibrations. This experimental platform includes three components: vibration-isolation devices, flow data-acquisition devices, and vibration data-acquisition devices.

2.1. Experimental Platform Design

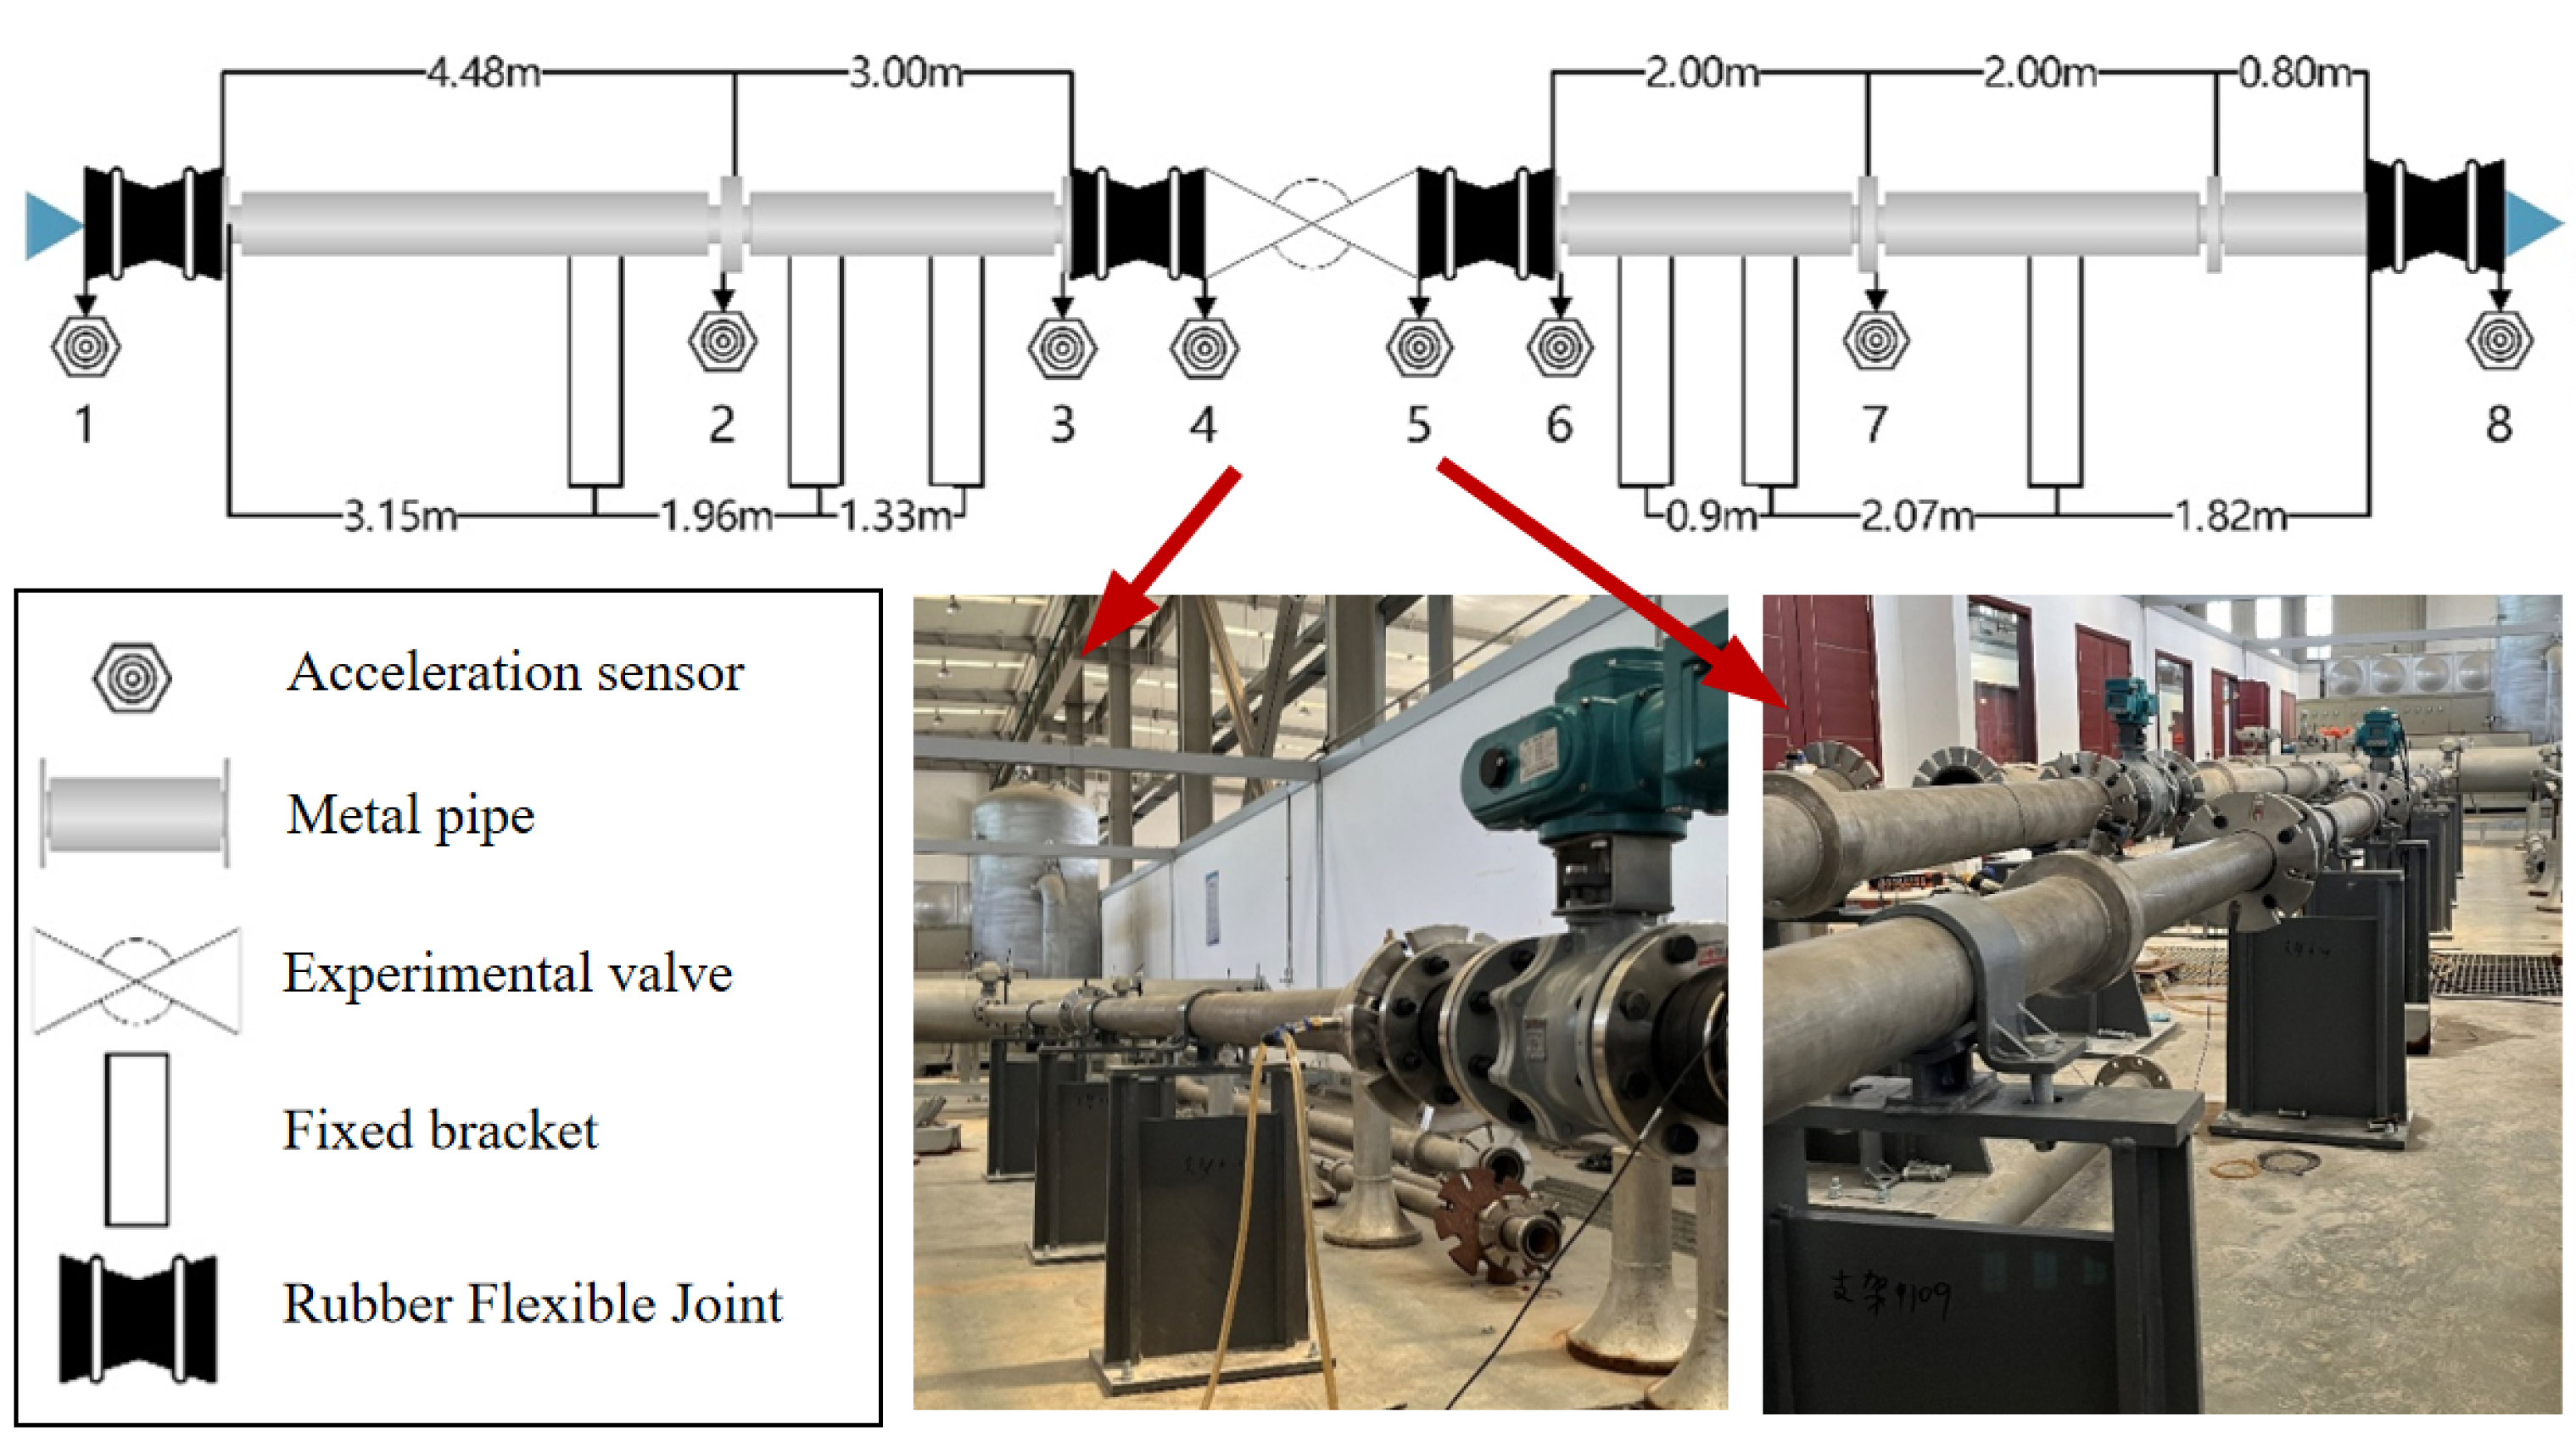
The experimental O-type ball valve size is DN100, its pressure is rated PN16, and it is made of carbon steel. Figure 2 shows the arrangement of vibration-isolation devices for the entire experimental platform. Several rubber flexible joints and fixed brackets are used to isolate vibrations. As for this experimental piping system, there are three main vibration sources. One source of vibration is the inlet fluid caused by the pump before the piping, another is the return flow vibration that appears at the end of the piping, and the last source is the vibration of this experimental O-type ball valve. Therefore, two rubber flexible joints are installed at the front and the end of the piping to isolate the first two vibration sources. Additionally, two more rubber flexible joints are installed around the experimental ball valve, isolating it as an independent vibration system. Due to the shape and material properties, the rubber flexible joints can isolate the vibration sources effectively, and their capabilities of isolation will be verified in Section 3 of this paper. Six brackets are bolted to the ground to hold up and fix the piping. A vibration-isolation pad is placed between the piping and the brackets to weaken vibration transmission. The brackets are symmetrically installed, with half on the piping before the ball valve and half behind that. The actual photos of the installation of vibration-isolation devices are shown in Figure 2 and Figure 3.
The main vibration data-acquisition devices are made up of acceleration sensors and data-acquisition devices. Acceleration sensors are mounted at key positions on the experimental platform. The vibration signals from these positions are transmitted to the signal-acquisition device, which then uses signal-processing software to read and analyze the vibration data. The specific installation positions of eight acceleration sensors are shown in Figure 3. Each acceleration sensor is mounted on the underside of the flange. As illustrated in Figure 2, the entire vibration experimental platform has eight vibration measurement points, denoted as MP-1~MP-8 in this paper. MP-1 and MP-2 are located in the front of the inlet pipe. They capture vibration information as the experimental fluid enters the piping, and then the fluid passes through a flexible joint and a fixed bracket. By comparing the vibration data from these two points, the effectiveness of the vibration-isolation devices in this section can be verified. Points MP-3 to MP-6 are associated with the experimental ball valve. The flow-induced vibration data under different working conditions from both sides of the valve can be collected. By comparing these data, the effectiveness of the vibration isolation provided by the flexible joints on both sides of the valve can be assessed. MP-7 and MP-8 are located at the outlet pipe. Similar to MP-1 and MP-2, these two points can demonstrate the effectiveness of vibration isolation at the downstream end of the piping. In this experiment, MP-1 to MP-2 and MP-7 to MP-8 only collect data from the Y-axis direction. This is because these points are only used to verify the vibration-isolation capability of the experimental platform. Points MP-3 to MP-6 collect data from three different directions corresponding to their respective channels. This is because these points can stand the vibration characteristic of the experimental ball valve.
The specific relationships between each measurement point, acceleration channel, measurement direction, and their abbreviations are detailed in Table 1. The model of the vibration devices is illustrated in Table 2. Two different kinds of acceleration sensors are used in vibration measurement. The sensitivity of PCB-356A25 (PCB Piezotronics, Depew, NY, USA) is 2.6 ± 10% mV/(m/s2), and that of BK-4535-B-001 (Bruel & Kjaer, Nærum, Denmark) is 10 ± 10% mV/(m/s2). The weight of PCB-356A25 is 10.5 g, and that of BK-4535-B-001 is 6 g. Therefore, these two acceleration sensors are suitable for vibration experiments, and the influence of their weight can be ignored.
The normal-temperature water serves as the fluid in this experiment, with a kinematic viscosity of 0.890 × 10⁻⁶ m2/s and a density of 997.044 kg/m3. The pressure gauges are installed on both sides of experimental ball valve, so when the vibration signal is collected, the inlet and outlet pressure data with the flow velocity under the same experimental condition are also recorded.

2.2. Experimental Setup

O-type ball valves are often used at different positions in the flow pipeline, and due to the varying flow demands at these positions, the opening of the O-type ball valves also differs. Therefore, this experiment considers the valve opening as a structural parameter of the ball valve, and the fluid velocity inside the valve as a flow parameter for designing the experimental conditions. The valve opening is evenly divided into 10 parts, ranging from 10% to 100%. Under each specific valve opening, the first experimental flow velocity is controlled at 0.5 m/s, and the flow velocity is gradually increased, with the difference between adjacent flow velocities maintained at approximately 0.5 m/s. To understand the impact of flow velocity on vibration at specific valve openings, a comprehensive dataset with numerous flow velocity conditions is desirable. However, due to experimental limitations, including the maximum power output of the pump in the piping system, only a finite number of different flow velocity conditions can be obtained. Additionally, at low valve openings, as the flow velocity increases, the valve experiences severe vibration accompanied by intense bubble-collapse noise. This phenomenon is indeed caused by cavitation occurring within the valve. To prevent damage to the valve, when excessively intense vibrations are observed at low openings, the flow velocity will not be further increased for the experiment.
Once the flow velocity stabilizes, vibration data from the eight measurement points at that flow velocity are collected. To ensure the fidelity of the vibration signals, the sampling frequency is set to 25.6 kHz, with a sampling duration of 30 s. After each sampling is completed, collect again with a 10 s interval, for a total of 3 groups. Similarly, three sets of pressure data under the same condition are collected and averaged.

2.3. Analysis Methods of Experimental Data

Fourier Transform (FT) is a basic signal-processing technique for vibration data that can decompose the time domain signal into the series of amplitudes and frequencies. The basic equation of FT is as follows:
F ( ω ) = f ( t ) e j ω t d t
where f(t) is the time domain signal, F(ω) is the frequency domain signal, ω represents the radian frequency, and i is an imaginary number.
Spectral analysis is a common method in vibration signal analysis. The basic idea of it is to represent the original vibration signal as a new sequence, which determines the importance of each frequency component in the dynamics of the signal. This process is achieved by using the Fast Fourier Transform (FFT), as specified in Equations (2) and (3):
A ( f x ) = j = 1 j = n x j ω n ( j 1 ) ( f x 1 )
ω n = e 2 π i n
where fx is the frequency, |A(fx)| is the signal amplitude in the frequency domain, and xj is one of the n time domain sampling points of the vibration signal.
In this paper, the 1/3 octave spectrum is used to compare the vibration intensity of different frequencies, which can reflect the frequency characteristics of the vibration in more detail. The entire frequency domain signal is divided into multiple 1/3 octave bands, with each band having a center frequency (fc) and upper and lower frequency limits (fl, fu). They are defined as
f c = 1000 × 10 3 n 30 Hz
f l = f c 2 1 6
f u = f c × 2 1 6
where n is number of the frequency bands. For each 1/3 octave band, calculate the intensity within it. Therefore, the horizontal axis of the 1/3 octave spectrum represents frequency (usually in terms of fc), and the vertical axis represents the calculated intensity.
The vibration Overall Level (OA) is used in this paper for representing the vibration intensity. In fact, the OA is the root mean square (RMS) across the entire frequency band. The RMS is calculated by Equation (7):
RMS = A 0 2 2 + i = 1 k 1 A i 2 + A k 2 2
where A is the amplitude of different frequencies, and k is number of sampling points.

3. Results and Discussion

The results are presented in three sections. Firstly, the 1/3 octave spectrum and overall acceleration level across different frequency bands are utilized to demonstrate the effectiveness of the experimental platform in isolating vibrations under conditions of high, medium, and low valve openings, as well as low and high flow velocities. The impact of flow parameters and structural parameters on vibration is analyzed in Section 2 and Section 3, respectively.

3.1. Verification of Vibration Isolation

3.1.1. Low Flow Velocities

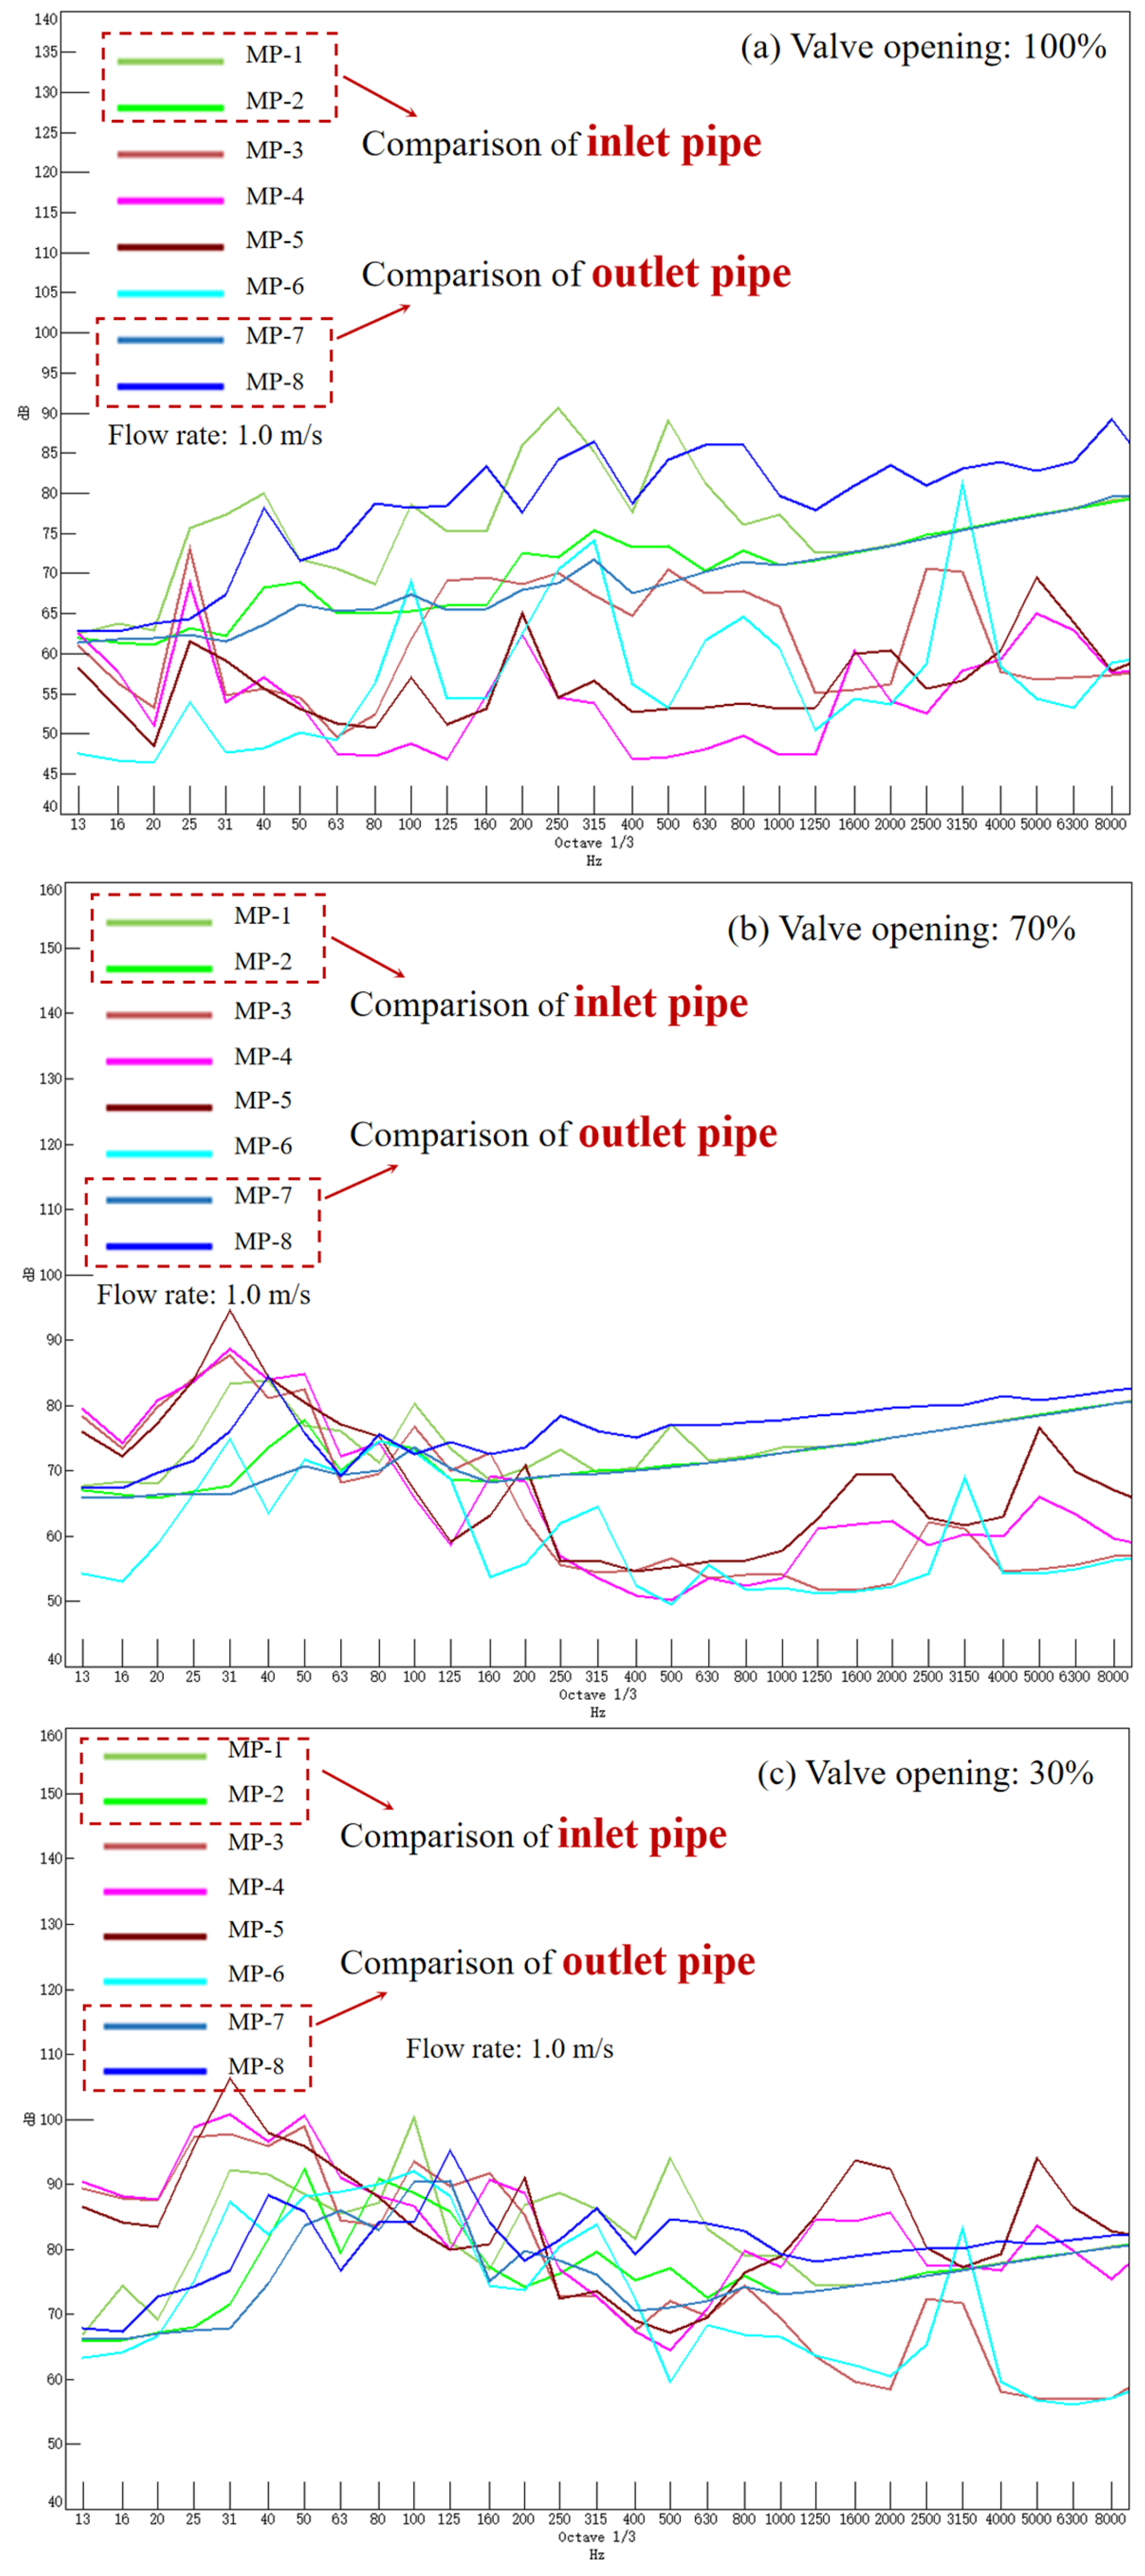
The validation of the vibration-isolation devices consists of two parts: the first part aims to demonstrate that the external vibration sources can be weakened, and the second part seeks to establish the valve as an independent vibration system. In this section, to verify the vibration-isolation capability of the experimental platform under various conditions, 100%, 70%, and 30% valve openings are selected to represent high, medium, and low opening conditions, respectively. The vibration-isolation performance at both low and high flow velocities will also be analyzed. Figure 4 shows the 1/3 octave spectrum of three valve openings, and the flow velocities are all 1.0 m/s. All MPs in Figure 4 use Y-direction vibration data. Comparing the lines for MP-1 and MP-2 at 100% valve opening, it can be observed that the acceleration level at MP-1 is higher than that at MP-2 across all frequency bands. It is directly proved that the vibration intensity decreased after the water passed through the vibration-isolation devices at the inlet section of the pipe. Comparing the lines for MP-7 and MP-8 at the 100% valve opening, the line of MP-8 is always above the line of MP-7; this also proves that this experimental platform can attenuate the vibration induced by the return flow. The same conclusion can be drawn from the 1/3 octave spectrum for valve openings of 70% and 30%.
In fact, flexible joints are also installed between MP-3 and MP-4, as well as between MP-5 and MP-6, to isolate vibrations. However, when observing the lines of these vibration measurement points at different openings, no significant distinction is found. This is because, at low flow velocities, the valve vibration is so little that its effects on MP-3 to 6 can be ignored. Table 3 provides additional evidence for these conclusions. Table 3 shows the acceleration level in the low-frequency band and the full-frequency band of different valve openings at low flow velocities. It can be observed that the vibration intensity at MP-1 is higher than that at MP-2 across the full-frequency band, and the vibration intensity at MP-8 is higher than that at MP-7 across the full-frequency band.

3.1.2. High Flow Velocities

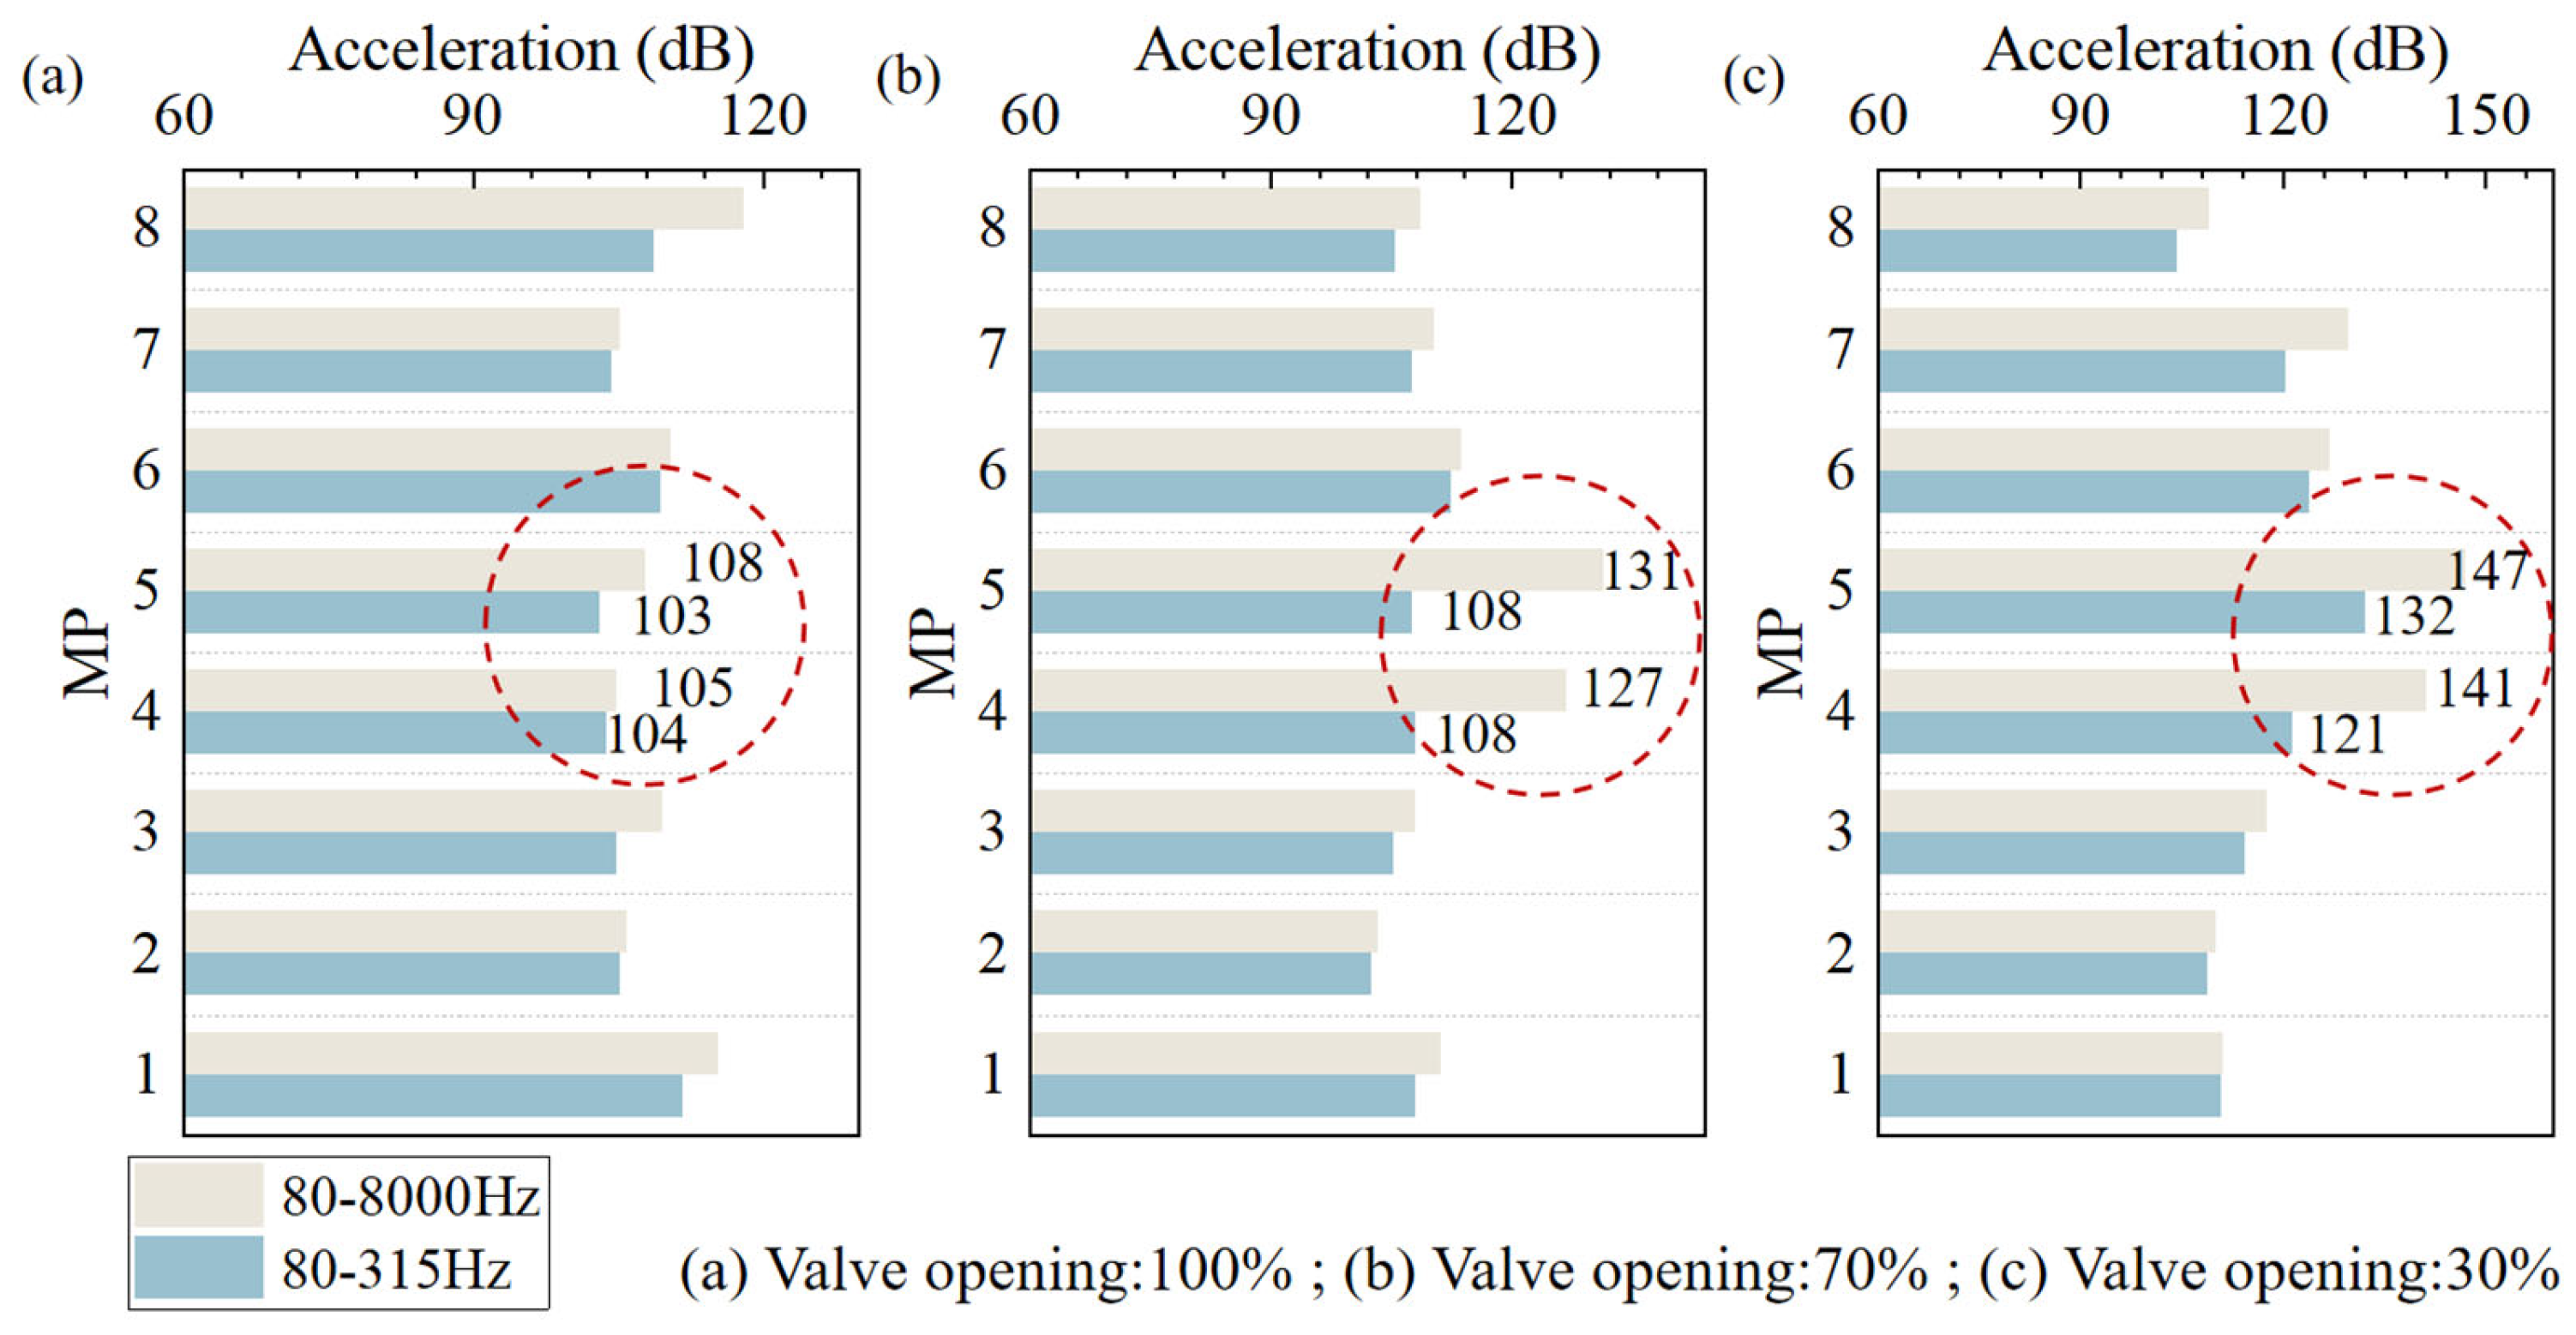
In Figure 5, the overall acceleration levels at high flow velocities under 100%, 70%, and 30% openings are presented. In this figure, the blue part is the overall acceleration level under the 80–315 Hz frequency band, which represents the vibration intensity in low-frequency band, and the gray part is the overall acceleration level under the 80–8000 Hz frequency band, which represents the vibration intensity in the full-frequency band. Figure 5a shows the result of the 100% valve opening, and the flow velocity is 8.5 m/s. The same conclusion as that at low flow velocities is summarized: the weakening of the vibration intensity at the inlet and outlet pipe occurred both in the low-frequency band and full-frequency band. Comparing the dashed circles in Figure 5a–c, it is obvious that at 70% and 30% valve openings, there is a significant change in the vibration intensity across the full-frequency band for MP-4 located at the ball valve inlet, and MP-5 located at the outlet. The overall vibration level at 80–8000 Hz for the 30% valve opening is 147 dB at MP-5:Y, and for the 70% valve opening, it is 131 dB. At the same measurement point, the overall vibration level is only 107 dB. This indicates that the experimental ball valves at 70% and 30% openings become the primary vibration sources in the entire experimental system at high flow velocities. By comparing MP-3 and MP-4 in Figure 5b,c, it can be observed that valve vibration is significantly attenuated during outward transmission across the full-frequency band. Correspondingly, comparing MP-5 and MP-6, the vibration intensity at the valve outlet section also significantly decreases across the full-frequency band. Therefore, the flexible joints at the valve inlet and outlet sections have been proven effective in vibration isolation, and the valve is allowed to be measured as an independent vibration system. In addition, the reduction in vibration intensity in the low-frequency band is relatively smaller than the full-frequency band. This shows that the vibration-isolation effect of the flexible joints is more pronounced in the frequency range of 315–8000 Hz. Further, comparing MP-7 and MP-8 in Figure 5b,c, the phenomenon differs from the previous observations for the 100% valve opening. This may be due to the excessive valve vibration excitation, resulting in the vibration-isolation device between MP-7 and MP-8 still being used to isolate the valve vibration.
In addition, when comparing the vibration intensity of the valve at three openings in the low-frequency band, it is obvious that the rise in overall vibration level across the full-frequency band is primarily due to changes in the high-frequency band of 315–8000 Hz. This aspect will be discussed in detail in Section 3.2.
In a word, the experimental platform proposed in this paper exhibits effective vibration-isolation capabilities under all conditions, whether at high, medium, or low valve openings, and at both low and high flow velocities. This is of significant importance for enhancing the accuracy of valve vibration data. For the O-shaped ball valve, the flow velocity downstream of the valve is higher and changes more drastically. Before cavitation occurs, flow-induced vibration is mainly determined by turbulence intensity, so the vibration acceleration at the measurement point at the outlet is greater than that at the inlet.

3.2. Effects of Flow Velocities on Vibration

In this section, the influence of different flow velocities on valve vibration will be presented. These flow phenomena at various valve openings can be distinguished into two typical characteristics, which will be categorized as cavitation and non-cavitation conditions in this section. This distinction is based on the experimental phenomena observed during the testing process. Under non-cavitation conditions, the highest experimental flow velocity was due to limitations of the experimental system; during the experiment, the valve exhibited no significant vibration and no noticeable noise. Under cavitation conditions, the highest experimental flow velocity was due to the protection for the valve; during the experiment, the valve vibrated significantly, accompanied by the emergence of cavitation noise. To obtain a more accurate understanding of the relationship between flow velocity and vibration, vibration data from MP-4 and MP-5 in three directions have been analyzed.

3.2.1. Non-Cavitation Conditions

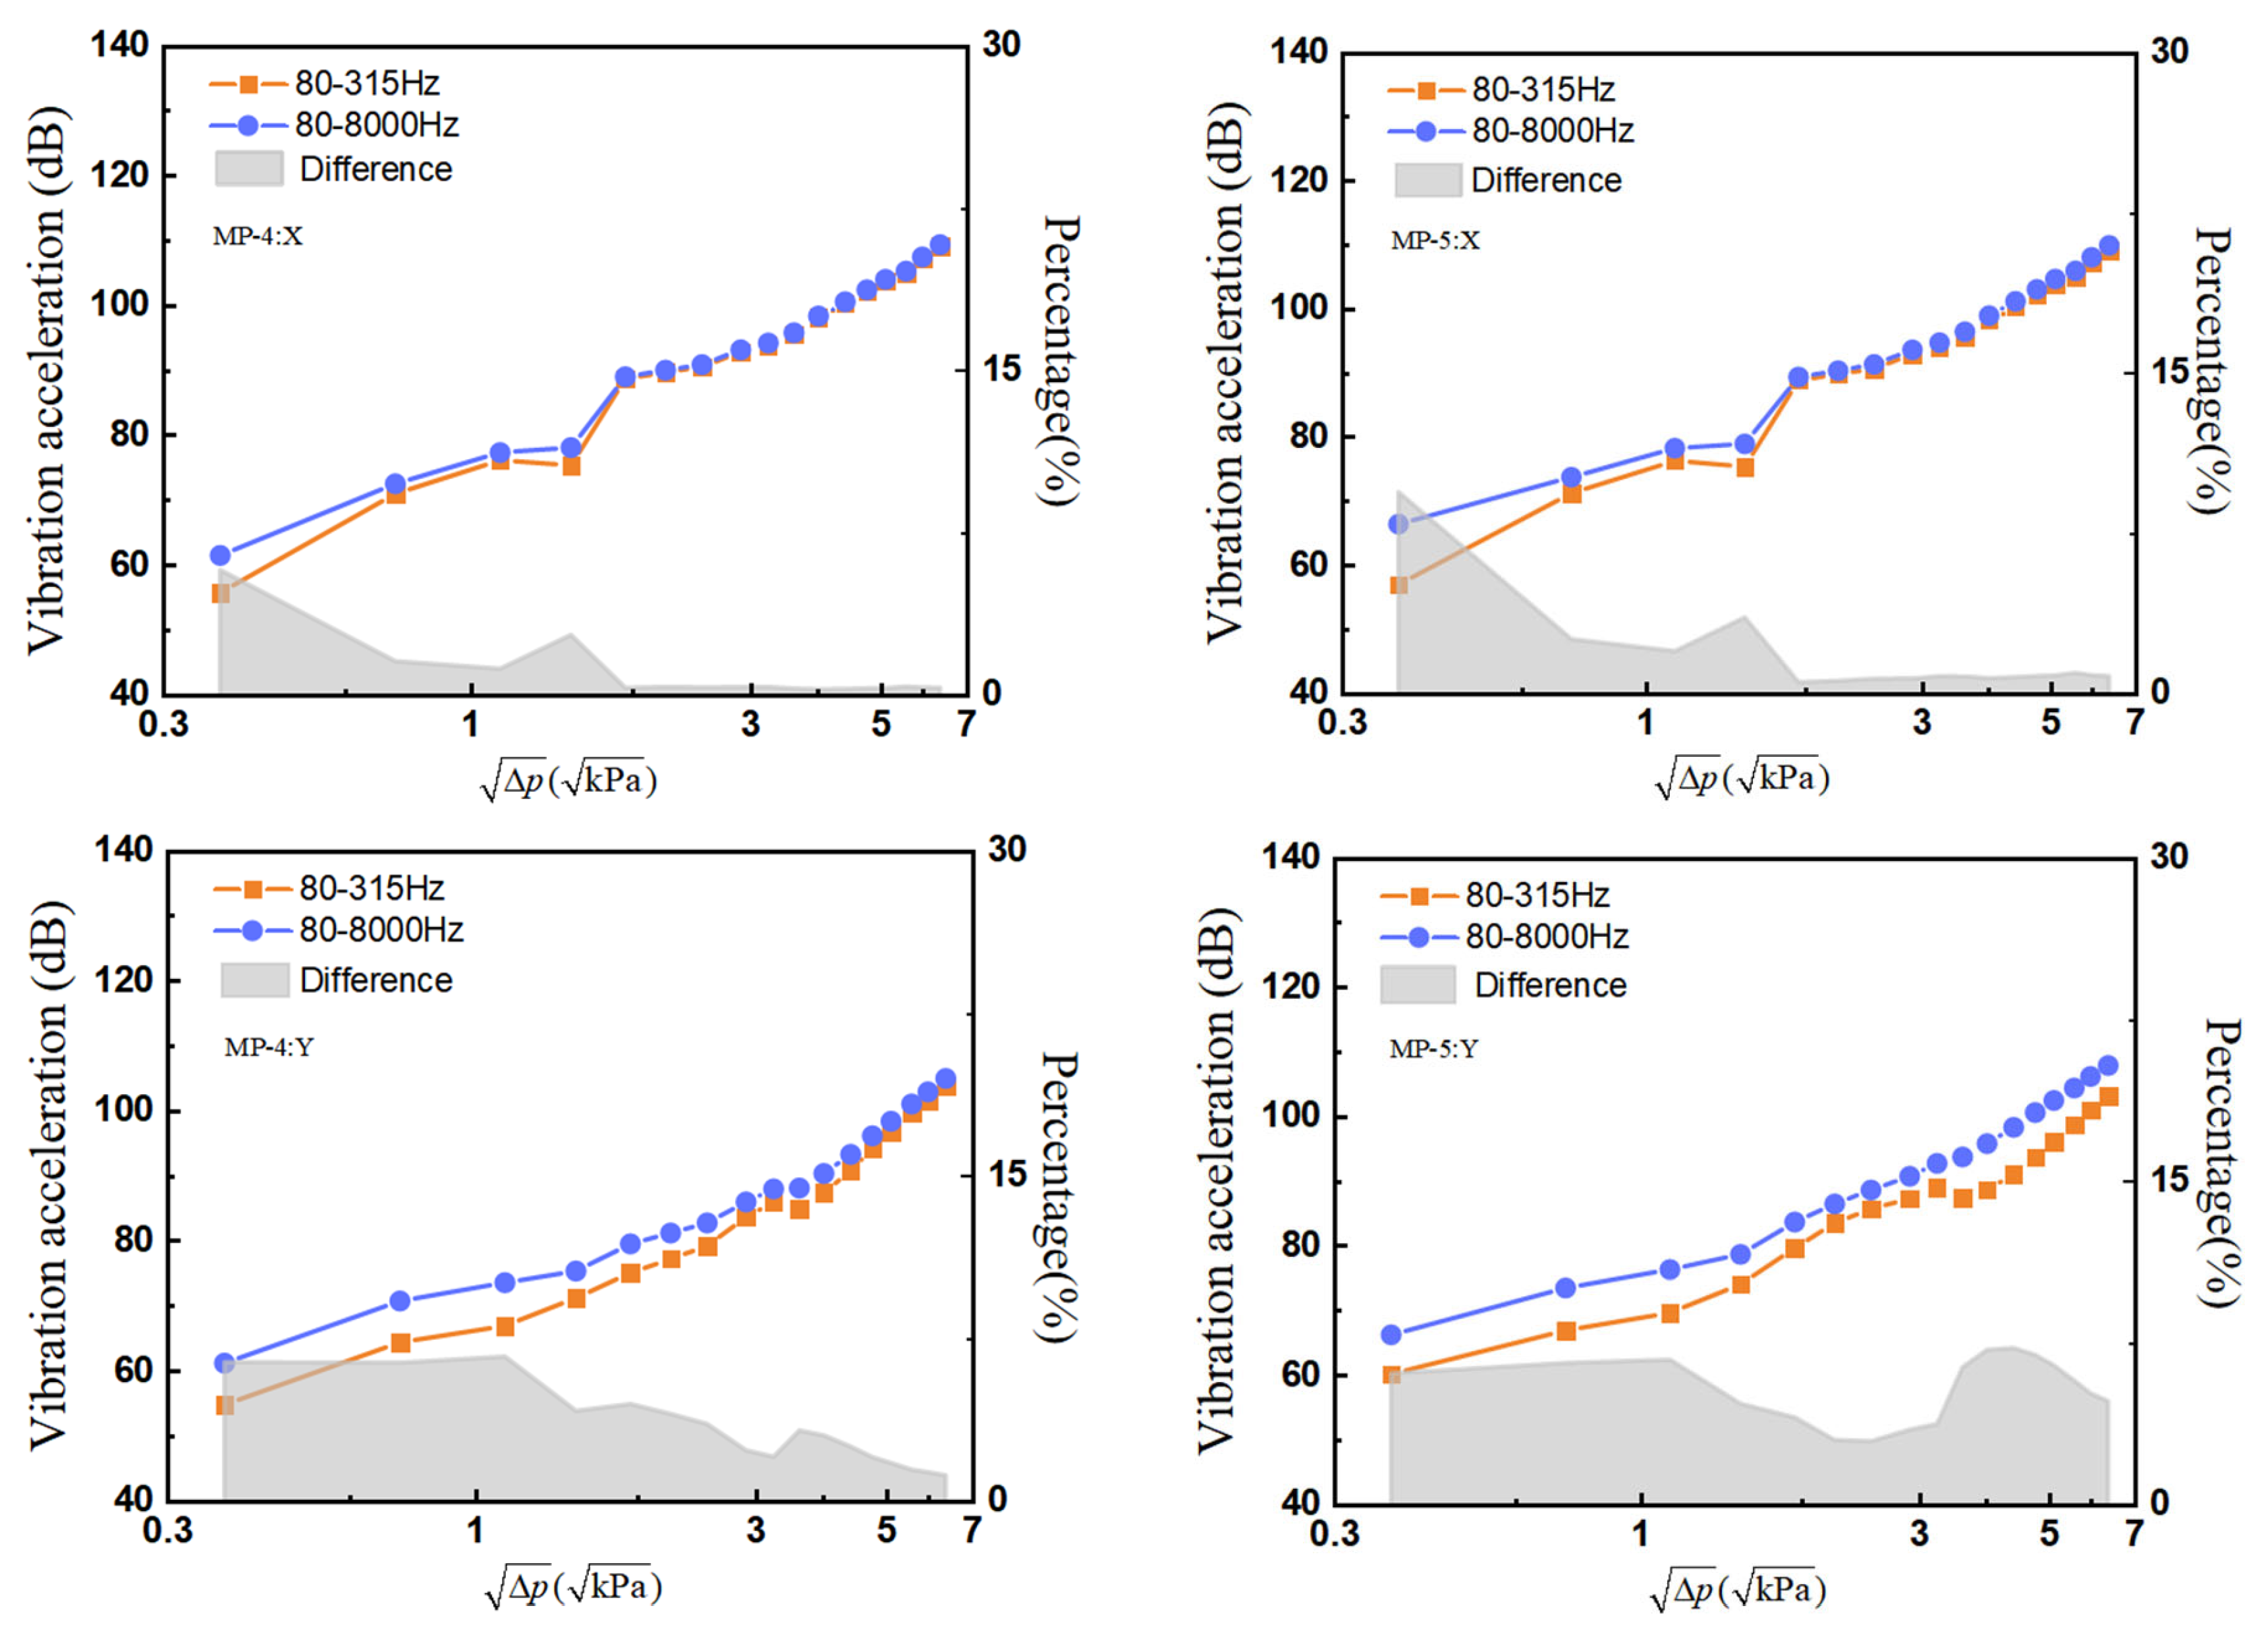
The characteristic of 100% valve opening is a typical characteristic in non-cavitation conditions. As shown in Figure 6, The square root of the inlet and outlet pressure difference (Δp) corresponding to different flow velocities is used as the X-axis. According to Bernoulli’s equation and the equation of the flow coefficient (Cv), for a determined flow process, there is a definite correspondence between flow velocity and pressure difference. This equation is shown as follows:
A v ρ p 1 p 2 = C v
where p1 and p2 are the inlet and outlet pressure of the valve; ρ is the density of the water; v is the flow velocity; and A is the cross-sectional area. For a specific valve opening, Cv is a constant.
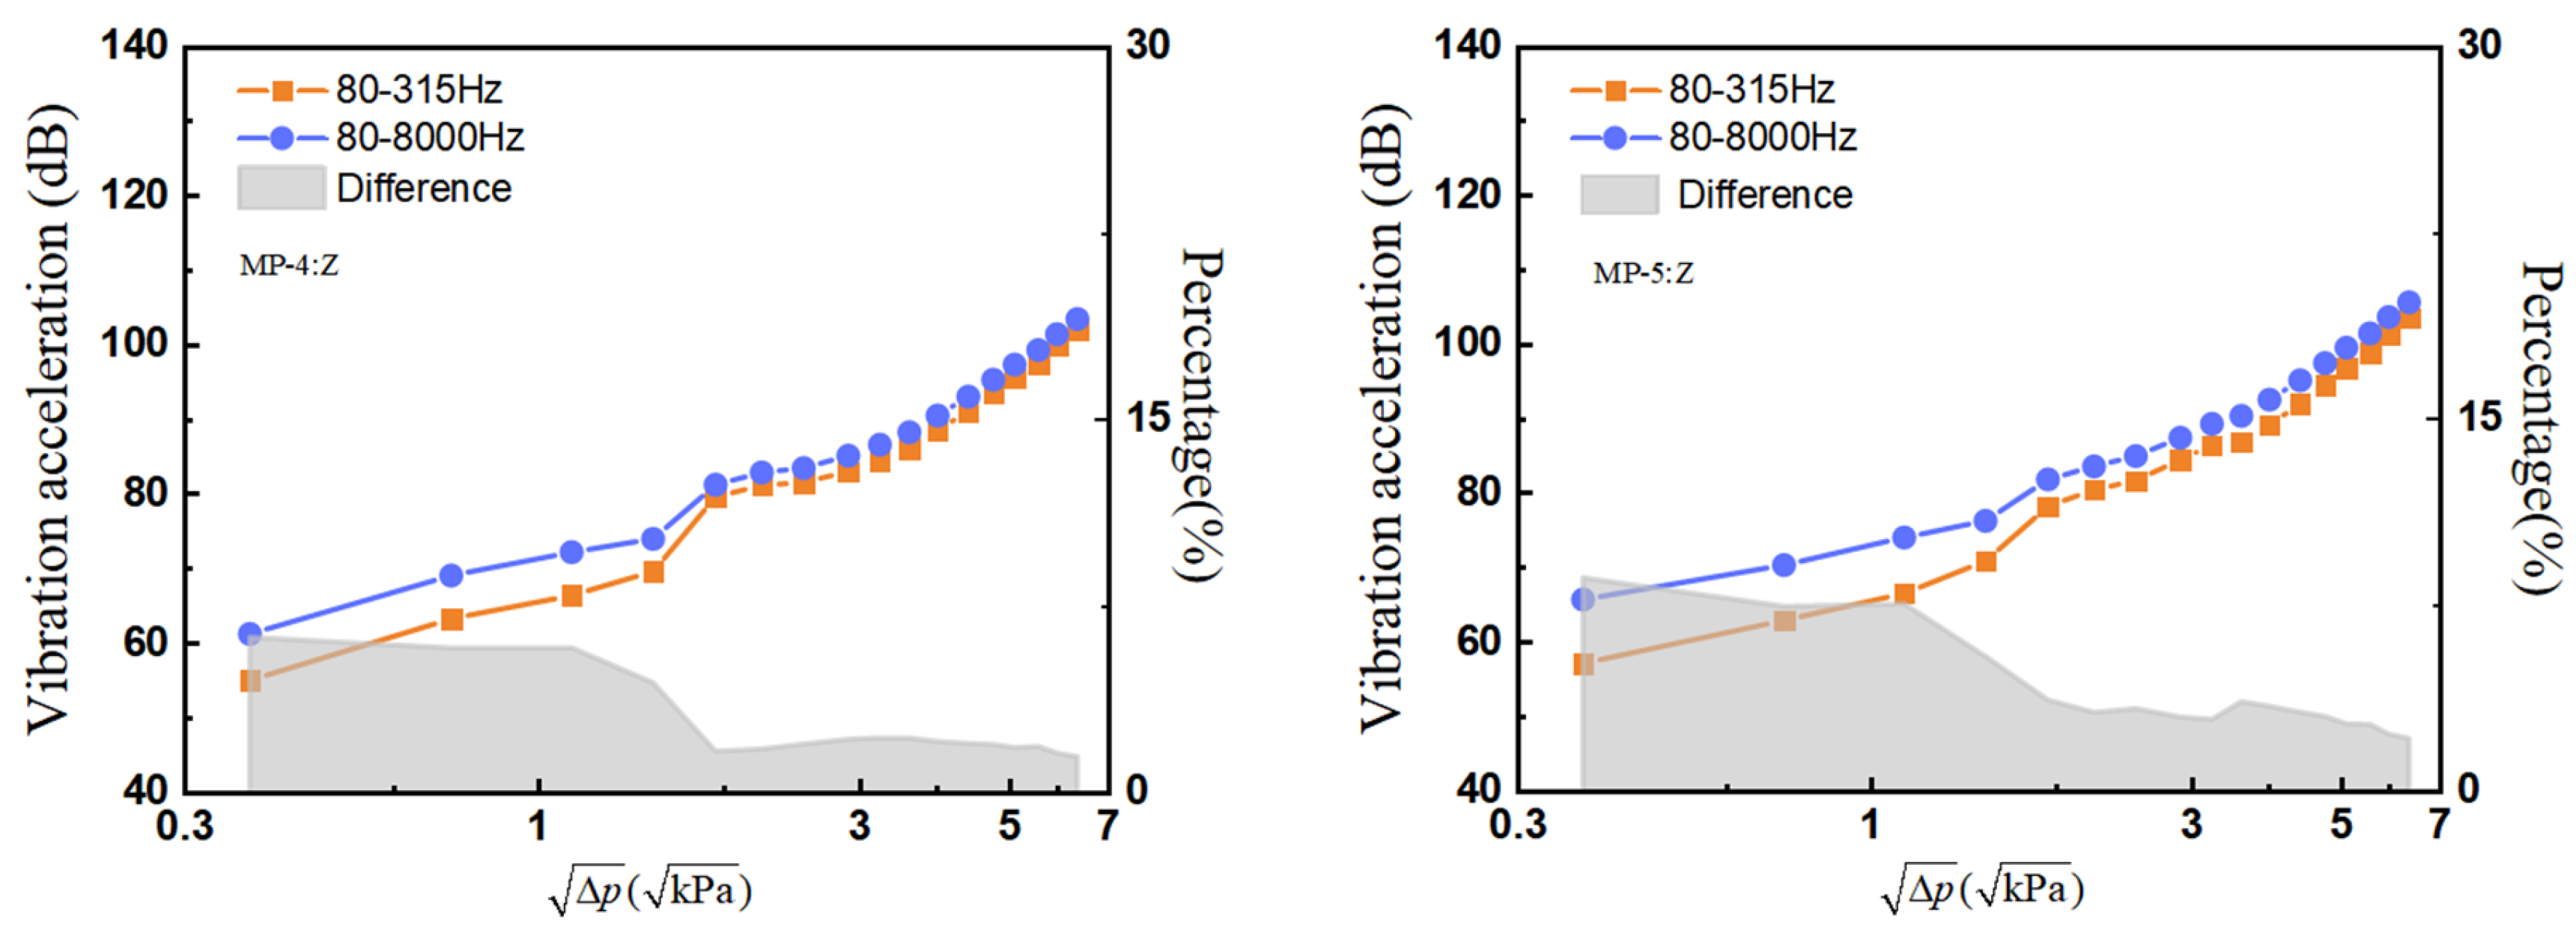
Moreover, the faster the flow velocity inside the valve, the greater the pressure difference between the valve inlet and outlet. The overall vibration levels in the low-frequency band of 80–315 Hz and the full-frequency band of 80–8000 Hz are also distinguished in Figure 6. Additionally, the gray blocks indicate the difference between the two overall vibration levels under different flow velocity conditions. At 100% valve opening, the valve core is fully open, and the flow area of the valve is similar to that of the pipe, resulting in a smaller pressure difference across the valve. The measurement error of the pressure gauge has a significant impact. Therefore, at low flow velocities and small pressure-difference conditions, there is no clear trend in the curve changes in some directions of MP-4 and MP-5. From Figure 6, we can see that the overall vibration level varies linearly with the change in flow velocities, and the trend of vibration changes in different directions at the inlet and outlet sections is basically consistent. In the same vibration direction, the overall vibration level at the valve outlet section is slightly higher than that at the inlet section. This may be related to the specific location of fluid excitation within the experimental ball valve. At each direction in both MPs, the overall vibration level in the full-frequency band is greater than that in the low-frequency band, which is consistent with reality. Furthermore, the difference between the two is very small, indicating that as the flow velocity continues to rise, the vibration intensity in the high-frequency band of the valve remains consistently low. The overall vibration levels in various directions of the valve are similar. At a low flow velocity of 0.5 m/s, the total vibration level ranges from 60 to 70 dB. At a high flow velocity of 8.5 m/s, the total vibration level ranges from 100 to 110 dB.

3.2.2. Cavitation Conditions

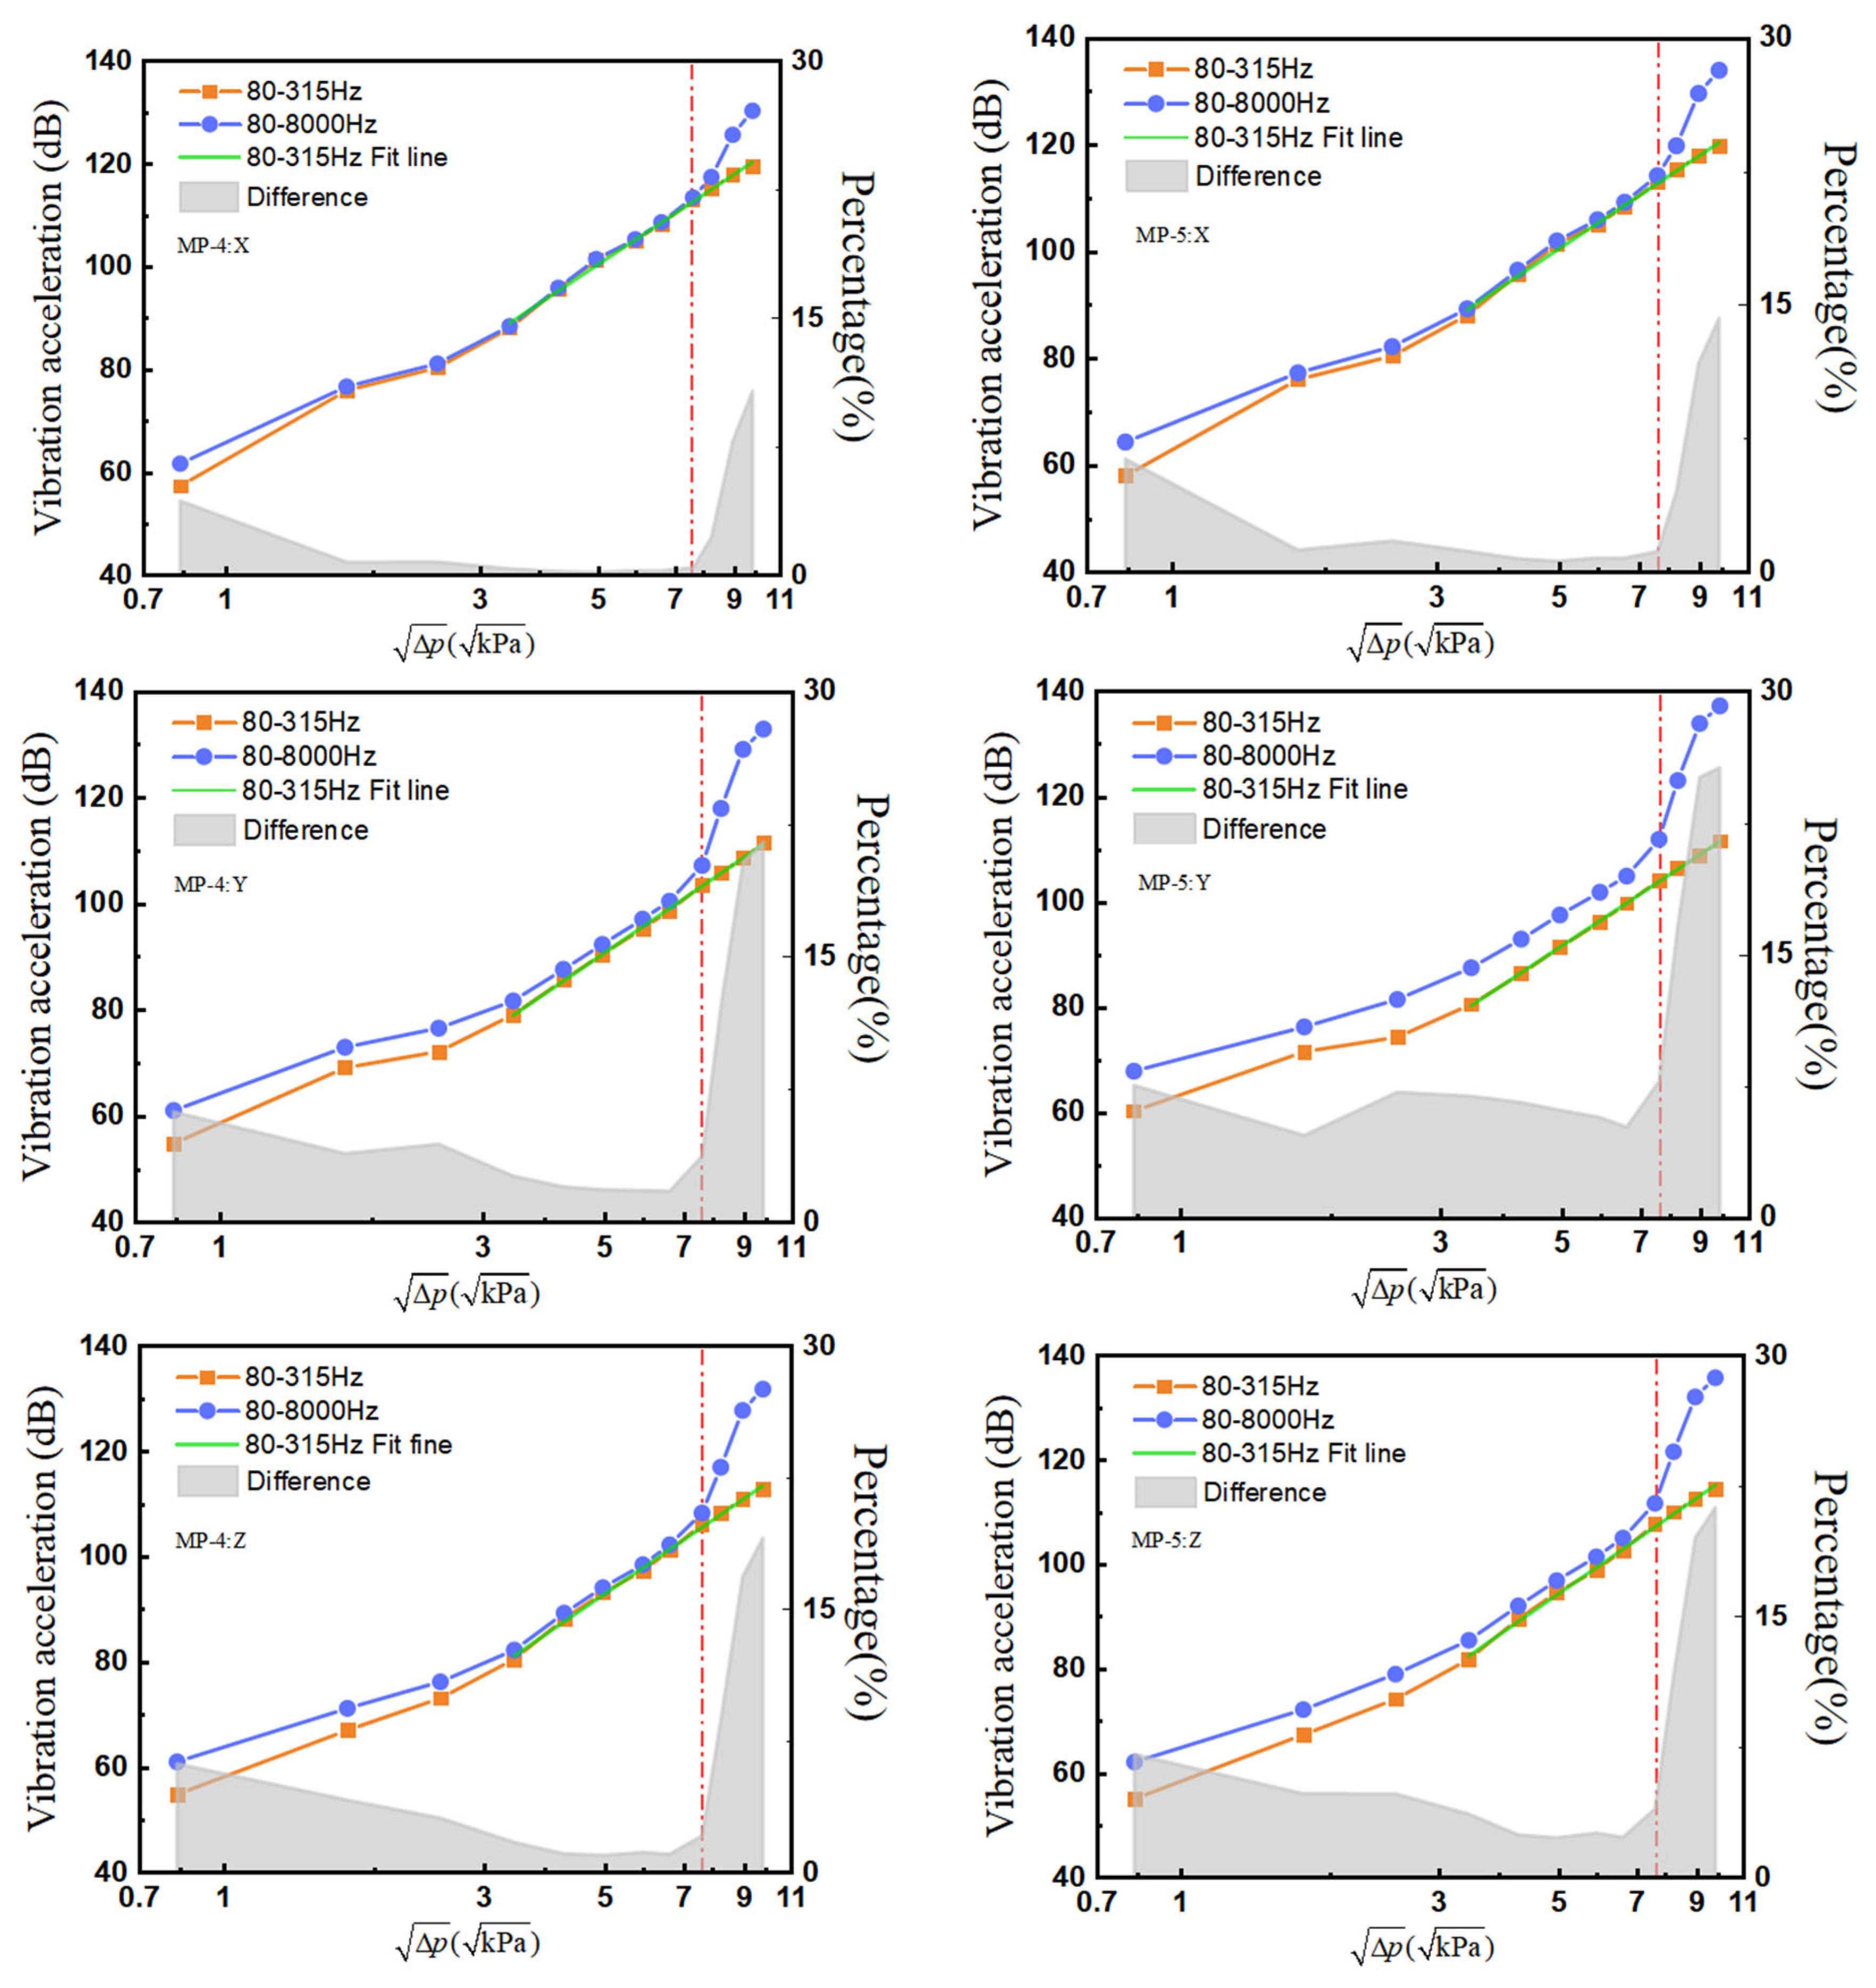
The vibration of the 60% valve opening shows another typical vibration characteristic in cavitation conditions. Curves made according to the same method are displayed in Figure 7. The trends in the six subplots also remain the same, indicating that this change affects the overall vibration of the valve, rather than a single direction. The low-frequency overall vibration level of the valve still increases linearly with the increase in flow velocity. The green fit line in the graph illustrates the linear relationship of vibration-level variation. The specific fitting equation is presented in Table 4, from which it can be clearly observed that the fit of the curve in the low-frequency range is excellent, with all R2 values exceeding 0.99. Meanwhile, the full-frequency vibration level of the valve exhibits new features. The curve of the full-frequency band suddenly rises after a certain flow velocity and maintains the same upward trend. This indicates that there is a sudden change in the vibration intensity of the valve. The red dashed line in Figure 7 represents the occurrence position of the sudden-change phenomenon. On the right side of the red dashed line, the gray blocks representing the difference between the total vibration levels of the two frequency bands rise significantly. This proves that the sudden change in vibration intensity in the full-frequency band mainly originates from the high-frequency band. At a low flow velocity of 0.5 m/s, the total vibration level still ranges from 60 to 70 dB. However, At a high flow velocity, the total vibration level ranges from 130 to 140 dB. During the experimental process, the flow velocity conditions corresponding to the right side of the red dashed line were all accompanied by the occurrence of cavitation noise. Although this study did not employ high-speed imaging to directly observe cavitation phenomena, the sudden increase in vibration coincided with intense cavitation noise (the characteristic crackling sound of bubble collapse) and occurred predominantly in high-frequency bands (315–8000 Hz). These characteristics align closely with cavitation-induced vibration patterns reported in the literature [34,36]. Therefore, we attribute this vibration surge to the occurrence of cavitation within the valve. Therefore, it can be concluded that the sudden increase in valve vibration intensity is caused by cavitation phenomena inside the valve, and the vibration induced by cavitation is concentrated in the high-frequency band of 315–8000 Hz. As shown in Figure 6 and Figure 7, under different operating conditions, the vibration trends in the three directions are generally consistent, but the radial vibration is typically slightly greater than the axial vibration. This may be because fluid impact and cavitation collapse generate greater excitation forces in the direction perpendicular to the flow channel.

3.3. Effects of Valve Openings on Vibration

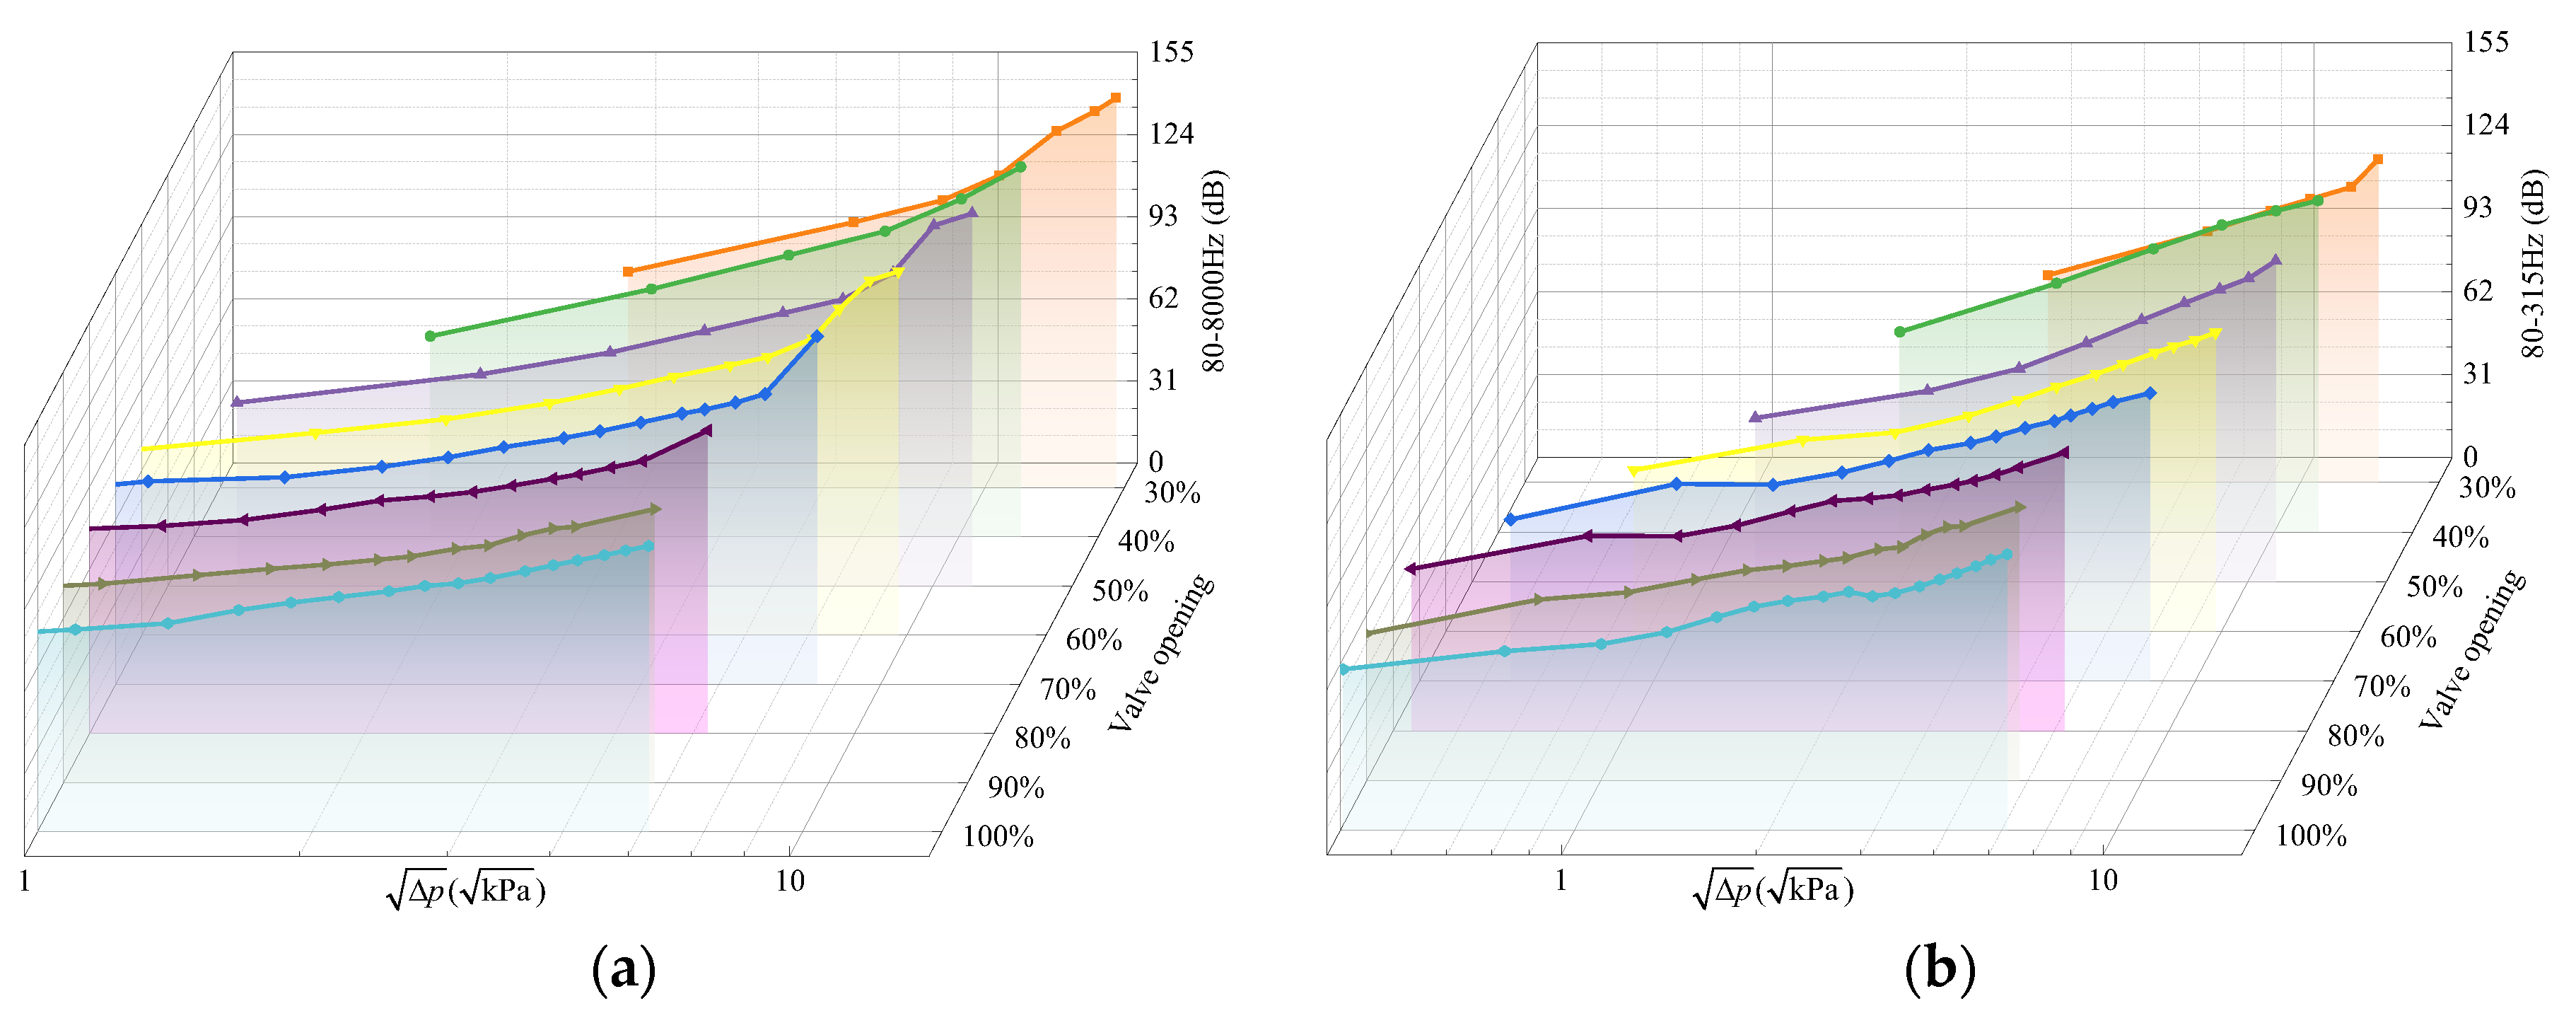
In this section, the trends in valve vibration intensity at different openings are compared. Figure 8 illustrates the overall acceleration level at 100% to 30% valve openings for MP-5:Y, Figure 8a shows the full-frequency band, and the low-frequency band is shown in Figure 8b. Severe vibrations occur at low flow velocity at 10% and 20% valve openings, so these curves are not included in Figure 8. As illustrated in Figure 8a, a sudden rise in the overall vibration-level curves for 100% and 90% valve openings does not occur. However, the curves for all other openings exhibit this sudden rise. This is because cavitation is less likely to occur at large valve openings, and this also proves the correlation between the sudden rise and cavitation. As shown in Figure 8b, the overall vibration-level curves for each valve opening increase in an approximately linear way. This proves that the valve opening does not affect the relationship between the overall vibration level in the low-frequency band and the flow velocity. Figure 9 shows the flow velocity for different valve openings when a sudden rise occurs in overall vibration level. The valve opening significantly affects the flow velocity when the sudden rise in vibration occurs. These flow velocities are called the critical flow velocity for each valve openings. The smaller the valve opening, the lower the critical flow velocity. This indicates that valves with smaller openings are more likely to experience a sudden increase in vibration.
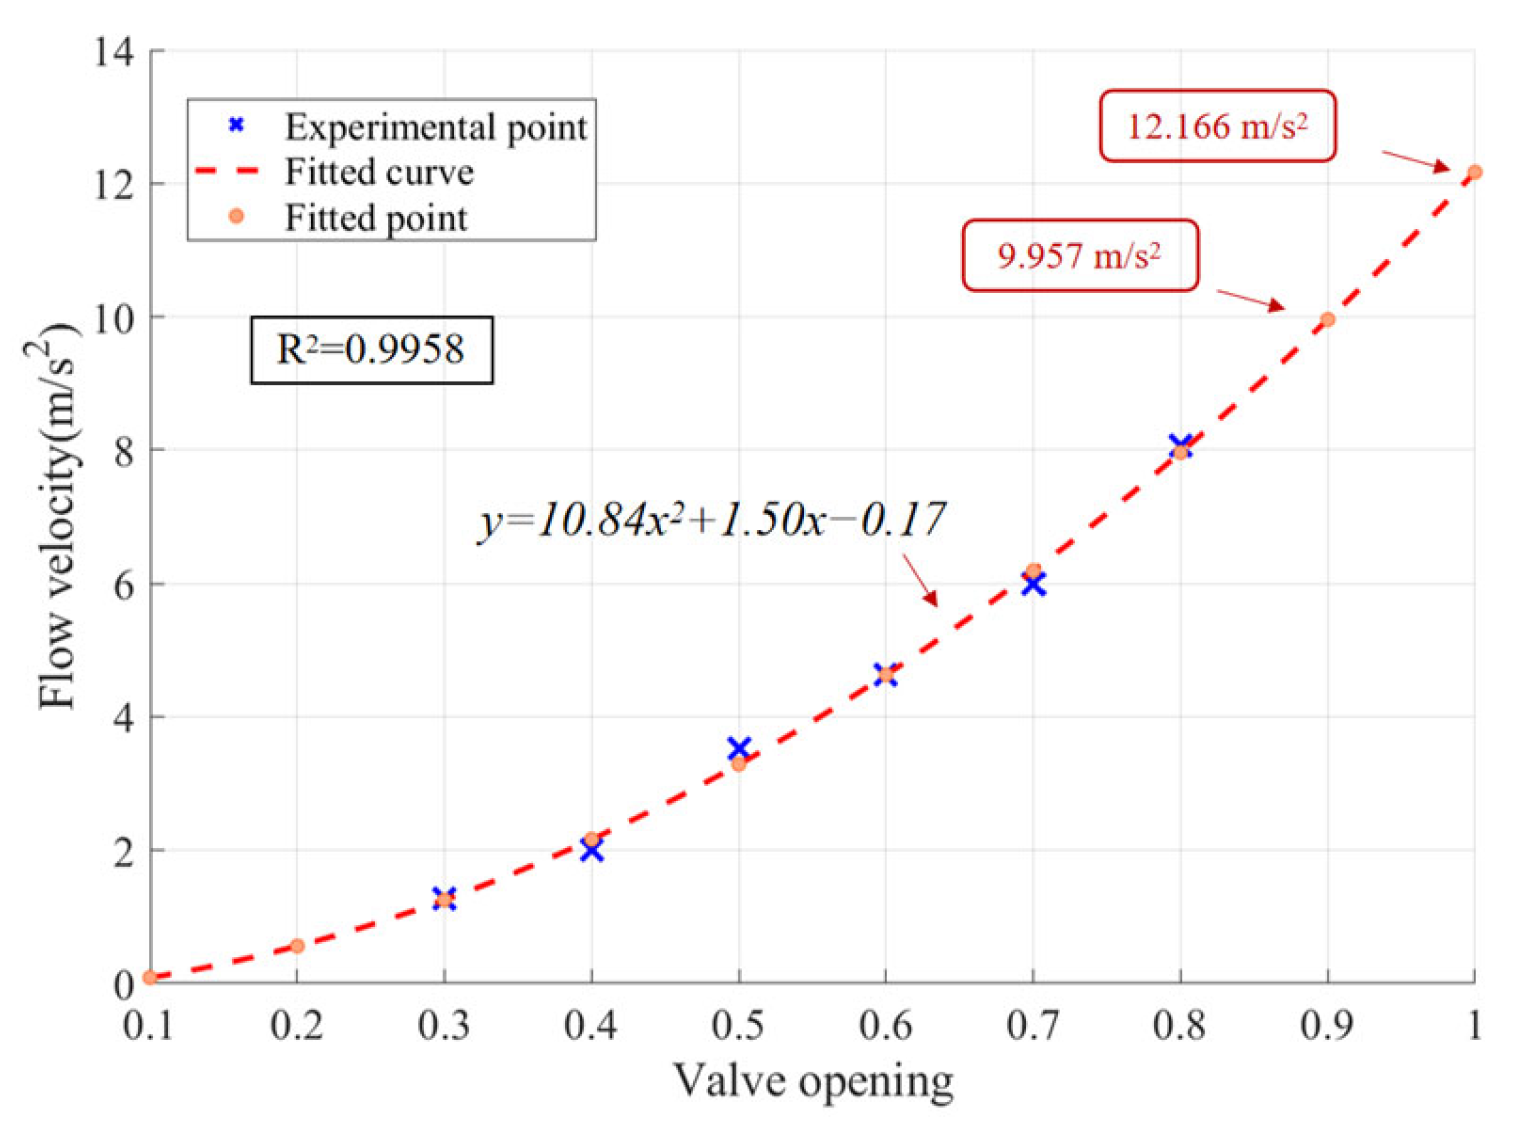
As shown in Figure 10, the mathematical relationship between valve opening and critical flow velocity can be fitted as a second-order function. This fitted curve is proposed by the nonlinear least squares fitting method. The Goodness of Fit, R2, is 0.9958, which shows a high correlation between the fitted curve and the experimental points. The critical fluid velocities at different valve openings can be calculated using the fitted function. For example, the critical fluid velocities at 90% and 100% valve openings are calculated to be 9.957 m/s and 12.166 m/s, respectively. For O-type ball valves with DN100 and internal flow channel structures like those discussed in this paper, manufacturers can use the critical velocity to evaluate the flow boundary conditions that ensure low flow-induced vibration at different valve openings. For O-type ball valves with structures different from the one studied in this paper, the critical velocity needs to be determined according to the method described in this paper. By predicting the critical fluid velocities at different valve openings, it is possible to effectively control the vibration of the ball valve within a lower intensity range, preventing sudden increases in vibration.

4. Conclusions

O-type ball valves are widely used in typical industrial applications as flow control components. The vibration of O-type ball valves is investigated in this paper. A valve vibration experimental platform with the capability of isolating external vibrations is designed to research the flow-induced vibration of O-type ball valves considering cavitation phenomena. The vibration signals are analyzed by 1/3 octave spectrum and overall vibration level to summarize the law between the vibration intensity and the variation in valve openings and flow velocities. The vibration changes caused by cavitation phenomena during the flow process are also investigated. Several conclusions can be proposed. The flexible joints used with brackets are proven to isolate external vibration sources. It is also found that the flexible joints have better isolation performance for high-frequency vibration compared with low-frequency vibration. The variation law at various valve openings can be distinguished into two typical characteristics: non-cavitation and cavitation conditions. Under non-cavitating conditions, the intensity of vibration exhibits a linear correlation with the square root of the pressure differential across the valve. Under cavitation conditions, the intensity of vibration suddenly rises at specific flow velocities. In addition, the rise in vibration intensity is concentrated in the higher frequency band of 315–8000 Hz by comparing the 80–315 Hz and the 80–8000 Hz. This indicates that the influence of cavitation phenomena on valve vibration is more pronounced in the high-frequency band rather than the low-frequency band. The variation law between the critical flow velocity at which valve vibration suddenly rises and the valve opening is proposed in this paper. The smaller the valve opening, the lower the critical flow velocity. The fitted function is calculated by the nonlinear least squares fitting method. The R2 of this function can reach 0.9958. The critical fluid velocities at 90% and 100% valve openings can be predicted through fitted function, and they are 9.957 m/s and 12.166 m/s. This work benefits the design of vibration suppression for O-type ball valves.

Author Contributions

Conceptualization, D.W., K.S., S.-Z.Z. and J.-Y.Q.; Methodology, D.W.; Software, D.W.; Validation, D.W.; Investigation, K.S., S.-Z.Z., J.H., X.-J.G. and L.Y.; Resources, K.S., S.-Z.Z., J.H., X.-J.G. and L.Y.; Data curation, S.-Z.Z., J.H., X.-J.G. and L.Y.; Writing—original draft, D.W., K.S., S.-Z.Z., J.H., X.-J.G. and L.Y.; Writing—review & editing, J.-Y.Q.; Visualization, D.W.; Project administration, J.-Y.Q.; Funding acquisition, J.-Y.Q. All authors have read and agreed to the published version of the manuscript.

Funding

This work is funded by the National Natural Science Foundation of China (NSFC) through Grant No. 52422506.

Data Availability Statement

The original contributions presented in this study are included in the article. Further inquiries can be directed to the corresponding author.

Conflicts of Interest

Author Jie Han was employed by the company Sanmen Nuclear Power Co., Ltd. The remaining authors declare that the research was conducted in the absence of any commercial or financial relationships that could be construed as a potential conflict of interest.

References

  1. Wang, Q.; Qu, J.; Liu, L.; Tan, X.; Guo, J.; Li, Y.; Zhang, J.; Liu, X.; Yu, J.; Ji, G.; et al. Design and Flow Characteristics of a Gravity-Driven Flow Control Valve. Machines 2025, 13, 654. [Google Scholar] [CrossRef]
  2. Asok, S.P.; Vijayaragavan, B.; Sundararajan, T.; Manikandan, G.R. Development of a Hydraulic Conical Valve for the Linearization of Flow. Machines 2025, 13, 866. [Google Scholar] [CrossRef]
  3. Wei, A.B.; Gao, R.; Zhang, W.; Wang, S.H.; Zhou, R.; Zhang, X.B. Computational fluid dynamics analysis on flow-induced vibration of a cryogenic poppet valve in consideration of cavitation effect. J. Zhejiang Univ.-Sci. A 2022, 23, 83–100. [Google Scholar] [CrossRef]
  4. Yang, L.; Li, S.; Hou, J. A Comprehensive Review of Flow-Induced Vibration and Fatigue Failure in the Moving Components of Control Valves. Machines 2025, 13, 766. [Google Scholar] [CrossRef]
  5. ISO 10767-1:2015; Hydraulic Fluid Power—Determination of the Pressure Ripple Levels Generated in Systems and Components—Part 1: Method for Determining Source Flow Ripple and Source Impedance of Pumps. International Organization for Standardization: Geneva, Switzerland, 2015.
  6. Stosiak, M.; Yatskiv, I.; Prentkovskis, O.; Karpenko, M. Reduction of Pressure Pulsations over a Wide Frequency Range in Hydrostatic Systems. Machines 2025, 13, 25. [Google Scholar] [CrossRef]
  7. Stosiak, M.; Karpenko, M. The influence of the hydropneumatic accumulator on the dynamic and noise of the hydrostatic drive operation. Eksploat. Niezawodn.–Maint. Reliab. 2024, 26, 186169. [Google Scholar] [CrossRef]
  8. Chen, P.; Liu, Z.; Xu, R.; Liu, J. Comparative investigation and test verification of cavitation and turbulence models of injector control ball valve. Int. J. Heat Fluid Flow 2024, 109, 109557. [Google Scholar] [CrossRef]
  9. Iravani, M.; Toghraie, D. Design a high-pressure test system to investigate the performance characteristics of ball valves in a compressible choked flow. Measurement 2020, 151, 107200. [Google Scholar] [CrossRef]
  10. Zhao, J.; Chen, S.; Yang, G.; Zhang, H. Simulation study on the cavitation distribution in the ball valve of a common rail injector. Int. J. Engine Res. 2024, 25, 1575–1587. [Google Scholar] [CrossRef]
  11. Miao, X.; Chang, A.B.; Zheng, J.; Chen, X.; Guo, L.; Xia, S.; Di, Y. Flow analysis of a control ball valve in a common rail fuel injector. Int. J. Engine Res. 2024, 25, 1013–1023. [Google Scholar] [CrossRef]
  12. Zhao, Z.; Gao, X.; Liu, Y. The optimized design of a ball valve with large stroke and high precision. Flow Meas. Instrum. 2024, 96, 102545. [Google Scholar] [CrossRef]
  13. Zhao, Z.; Liu, Y.; Gao, X.; Tong, S. Design of a high-precision linear regulating ball valve. Flow Meas. Instrum. 2024, 100, 102708. [Google Scholar] [CrossRef]
  14. Arora, K.; Uppal, A.S.; Singh, A.K. Experimental investigation into magnetorheological finishing of polymer valve seat surface for ball valve performance. Surf. Rev. Lett. 2024, 32, 2550002. [Google Scholar] [CrossRef]
  15. Teles, D.B.; Gouveia, S.M.; Clarke, T.G. Identification of leakage in ball valves by analysis of pressure and torque signatures in cyclical tests under critical operating conditions. Eng. Fail. Anal. 2020, 117, 104828. [Google Scholar] [CrossRef]
  16. Shi, M.; Deng, L.; Yang, B.; Qin, L.; Gu, L. Research on internal leakage detection of the ball valves based on stacking ensemble learning. Meas. Sci. Technol. 2024, 35, 095109. [Google Scholar] [CrossRef]
  17. Sotoodeh, K. Why packing adjustment cannot stop leakage: Case study of a ball valve failing to seal after packing adjustment during fugitive emission as per ISO 15848–1. Eng. Fail. Anal. 2021, 130, 105751. [Google Scholar] [CrossRef]
  18. Chen, D.; Jiang, J.; Ming, L.; Zhang, G.; Lin, Z.; Li, H. Study on gas–liquid–solid multiphase flow and erosion in ball valves. Eng. Fail. Anal. 2025, 167, 108945. [Google Scholar] [CrossRef]
  19. Zhao, Y.; Wang, Y.; Zhang, M.; Li, M.; Zhao, Z.; Liu, L. Failure analysis of the outlet pipeline and ball valve of the circulating pump in the desulfurization liquid concentration tower. Eng. Fail. Anal. 2024, 161, 108338. [Google Scholar] [CrossRef]
  20. Chemaa, K.; Kezrane, M.; Hassani, S.; Abd-El-Yazid, K.; Benmaamar, Z. Austenite stainless steel multilayers coatings on ball valves for tribological behavior improvement. Appl. Phys. A 2022, 128, 616. [Google Scholar] [CrossRef]
  21. Moses, D.; Haider, G.; Henshaw, J. An investigation of the failure of a 1/4″ ball valve. Eng. Fail. Anal. 2019, 100, 393–405. [Google Scholar] [CrossRef]
  22. Zhu, H.; Lin, X.; Xue, X.; Zhang, Y.; Wang, L.; Ning, Y.; Fang, X. Laser cladding of stainless-steel ball valves by a high-power diode laser source with a rectangular beam spot. Opt. Laser Technol. 2024, 169, 110123. [Google Scholar] [CrossRef]
  23. Awad, H.; Parrondo, J. Turbine inlet valve’s self-excited vibrations risk the safe operation of hydropower plants. J. Vib. Eng. Technol. 2024, 12, 3355–3371. [Google Scholar] [CrossRef]
  24. Lv, X.; Chen, B.; Zhang, Y.; Li, S. Vibration suppression of an armature assembly in hydraulic servo valve based on distributed parameters mathematical models. J. Vib. Control 2023, 30, 4801–4813. [Google Scholar] [CrossRef]
  25. Stosiak, M.; Karpenko, M.; Prentkovskis, O.; Deptuła, A.; Skačkauskas, P. Research of vibrations effect on hydraulic valves in military vehicles. Def. Technol. 2023, 30, 111–125. [Google Scholar] [CrossRef]
  26. Stosiak, M.; Karpenko, M.; Deptuła, A.; Urbanowicz, K.; Skačkauskas, P.; Deptuła, A.M.; Łapka, M. Research of vibration effects on a hydraulic valve in the pressure pulsation spectrum analysis. J. Mar. Sci. Eng. 2023, 11, 301. [Google Scholar] [CrossRef]
  27. Wang, H.; Lai, Z.; Wu, D.; Zhang, K.; Zheng, M. Investigation of the friction-induced vibration of a novel four-way reversing valve using spectral kurtosis and number of peaks spectrum. Mech. Syst. Signal Process. 2022, 166, 108425. [Google Scholar] [CrossRef]
  28. Musselman, M.; Xie, H.; Djurdjanovic, D. Nonstationary signal analysis and support vector machine based classification for vibration based characterization and monitoring of slit valves in semiconductor manufacturing. J. Intell. Manuf. 2019, 30, 1099–1110. [Google Scholar] [CrossRef]
  29. Lyu, F.; Cao, C.; Zhao, D.; Li, C.; Su, J.; Zhao, X.; Jia, X. Vibration characteristics analysis of high-pressure long-distance dense paste pipeline transporting with hydraulic active check valve. Alex. Eng. J. 2023, 71, 669–677. [Google Scholar] [CrossRef]
  30. Wang, T.; Liu, Y.; Xu, Q.N.; Han, D. Novel structure for waveform control of twin rotary flowrate valve controlled vibration exciter. IEEE/ASME Trans. Mechatron. 2020, 26, 1183–1188. [Google Scholar] [CrossRef]
  31. Schröders, S.; Fidlin, A. Asymptotic analysis of self-excited and forced vibrations of a self-regulating pressure control valve. Nonlinear Dyn. 2021, 103, 2315–2327. [Google Scholar] [CrossRef]
  32. Miyaki, Y.; Tsukagoshi, H. Self-excited vibration valve that induces traveling waves in pneumatic soft mobile robots. IEEE Robot. Autom. Lett. 2020, 5, 4133–4139. [Google Scholar] [CrossRef]
  33. Ordoñez, V.; Arcos, R.; Romeu, J.; Josefsson, A. Investigation on electromagnetic vibration energy harvesting in water distribution control valves. IEEE Sens. J. 2020, 21, 2734–2741. [Google Scholar] [CrossRef]
  34. Kovacevic, S.; Agarwal, V.; Buttles, J.W. Numerical and Experimental Vibration Analysis of an Additive Manufactured Sensor Mounting Unit for a Wireless Valve Position Indication Sensor System. Nucl. Technol. 2022, 208, 468–483. [Google Scholar] [CrossRef]
  35. Zhong, Q.; Jia, T.; Xu, E.; Yao, Z.; Li, Y.; Yang, H. A Vibration-Based Measurement Method for Dynamic Characteristic of Solenoid Switching Valve. IEEE Trans. Instrum. Meas. 2023, 73, 7500810. [Google Scholar] [CrossRef]
  36. Wang, P.; Yang, C.Y.; Yuan, Y.Y.; Fu, Y.C.; Ding, W.F.; Xu, J.H.; Chen, Y. Study on the mechanism of burr formation in ultrasonic vibration-assisted honing 9Cr18MoV valve sleeve. Adv. Manuf. 2024, 13, 606–619. [Google Scholar] [CrossRef]
  37. Lu, Y.; Tan, L.; Zhao, X.; Ma, C. Experiment on cavitation-vibration correlation of a centrifugal pump under steady state and start-up conditions in energy storage station. J. Energy Storage 2024, 83, 110763. [Google Scholar] [CrossRef]
  38. Mousmoulis, G.; Karlsen-Davies, N.; Aggidis, G.; Anagnostopoulos, I.; Papantonis, D. Experimental analysis of cavitation in a centrifugal pump using acoustic emission, vibration measurements and flow visualization. Eur. J. Mech.-B/Fluids 2019, 75, 300–311. [Google Scholar] [CrossRef]
  39. Feng, J.; Zhao, N.; Zhu, G.; Wu, G.; Li, Y.; Luo, X. Cavitation identification in a hydraulic bulb turbine based on vibration and pressure fluctuation measurements. Mech. Syst. Signal Process. 2024, 208, 111042. [Google Scholar] [CrossRef]
  40. Liu, D.; Li, G.; Sun, N.; Zhu, G.; Cao, H.; Wang, T.; Gu, F. Vibration-induced cavitation in cylinder liners caused by piston slaps. Int. J. Mech. Sci. 2024, 267, 109025. [Google Scholar] [CrossRef]
  41. Ouyang, T.; Li, Y.; Tian, H.; Wang, J.; Zhang, N. Cavitation mechanism of high-speed helical gears induced by vibration. Tribol. Int. 2024, 193, 109440. [Google Scholar] [CrossRef]
  42. Kristian, A. Elimination of cavitation induced vibrations in orifice plates. Exp. Comput. Multiph. Flow 2022, 4, 310–317. [Google Scholar] [CrossRef]
  43. Xu, S.; Wang, J.; Cheng, H.; Ji, B.; Long, X. Experimental study of the cavitation noise and vibration induced by the choked flow in a Venturi reactor. Ultrason. Sonochem. 2020, 67, 105183. [Google Scholar] [CrossRef] [PubMed]
  44. McKee, K.K.; Forbes, G.L.; Mazhar, I.; Entwistle, R.; Hodkiewicz, M.; Howard, I. A vibration cavitation sensitivity parameter based on spectral and statistical methods. Expert Syst. Appl. 2015, 42, 67–78. [Google Scholar] [CrossRef]
  45. Lin, Z.H.; Hou, C.W.; Zhang, L.; Guan, A.Q.; Jin, Z.J.; Qian, J.Y. Fluid-structure interaction analysis on vibration characteristics of sleeve control valve. Ann. Nucl. Energy 2023, 181, 109579. [Google Scholar] [CrossRef]
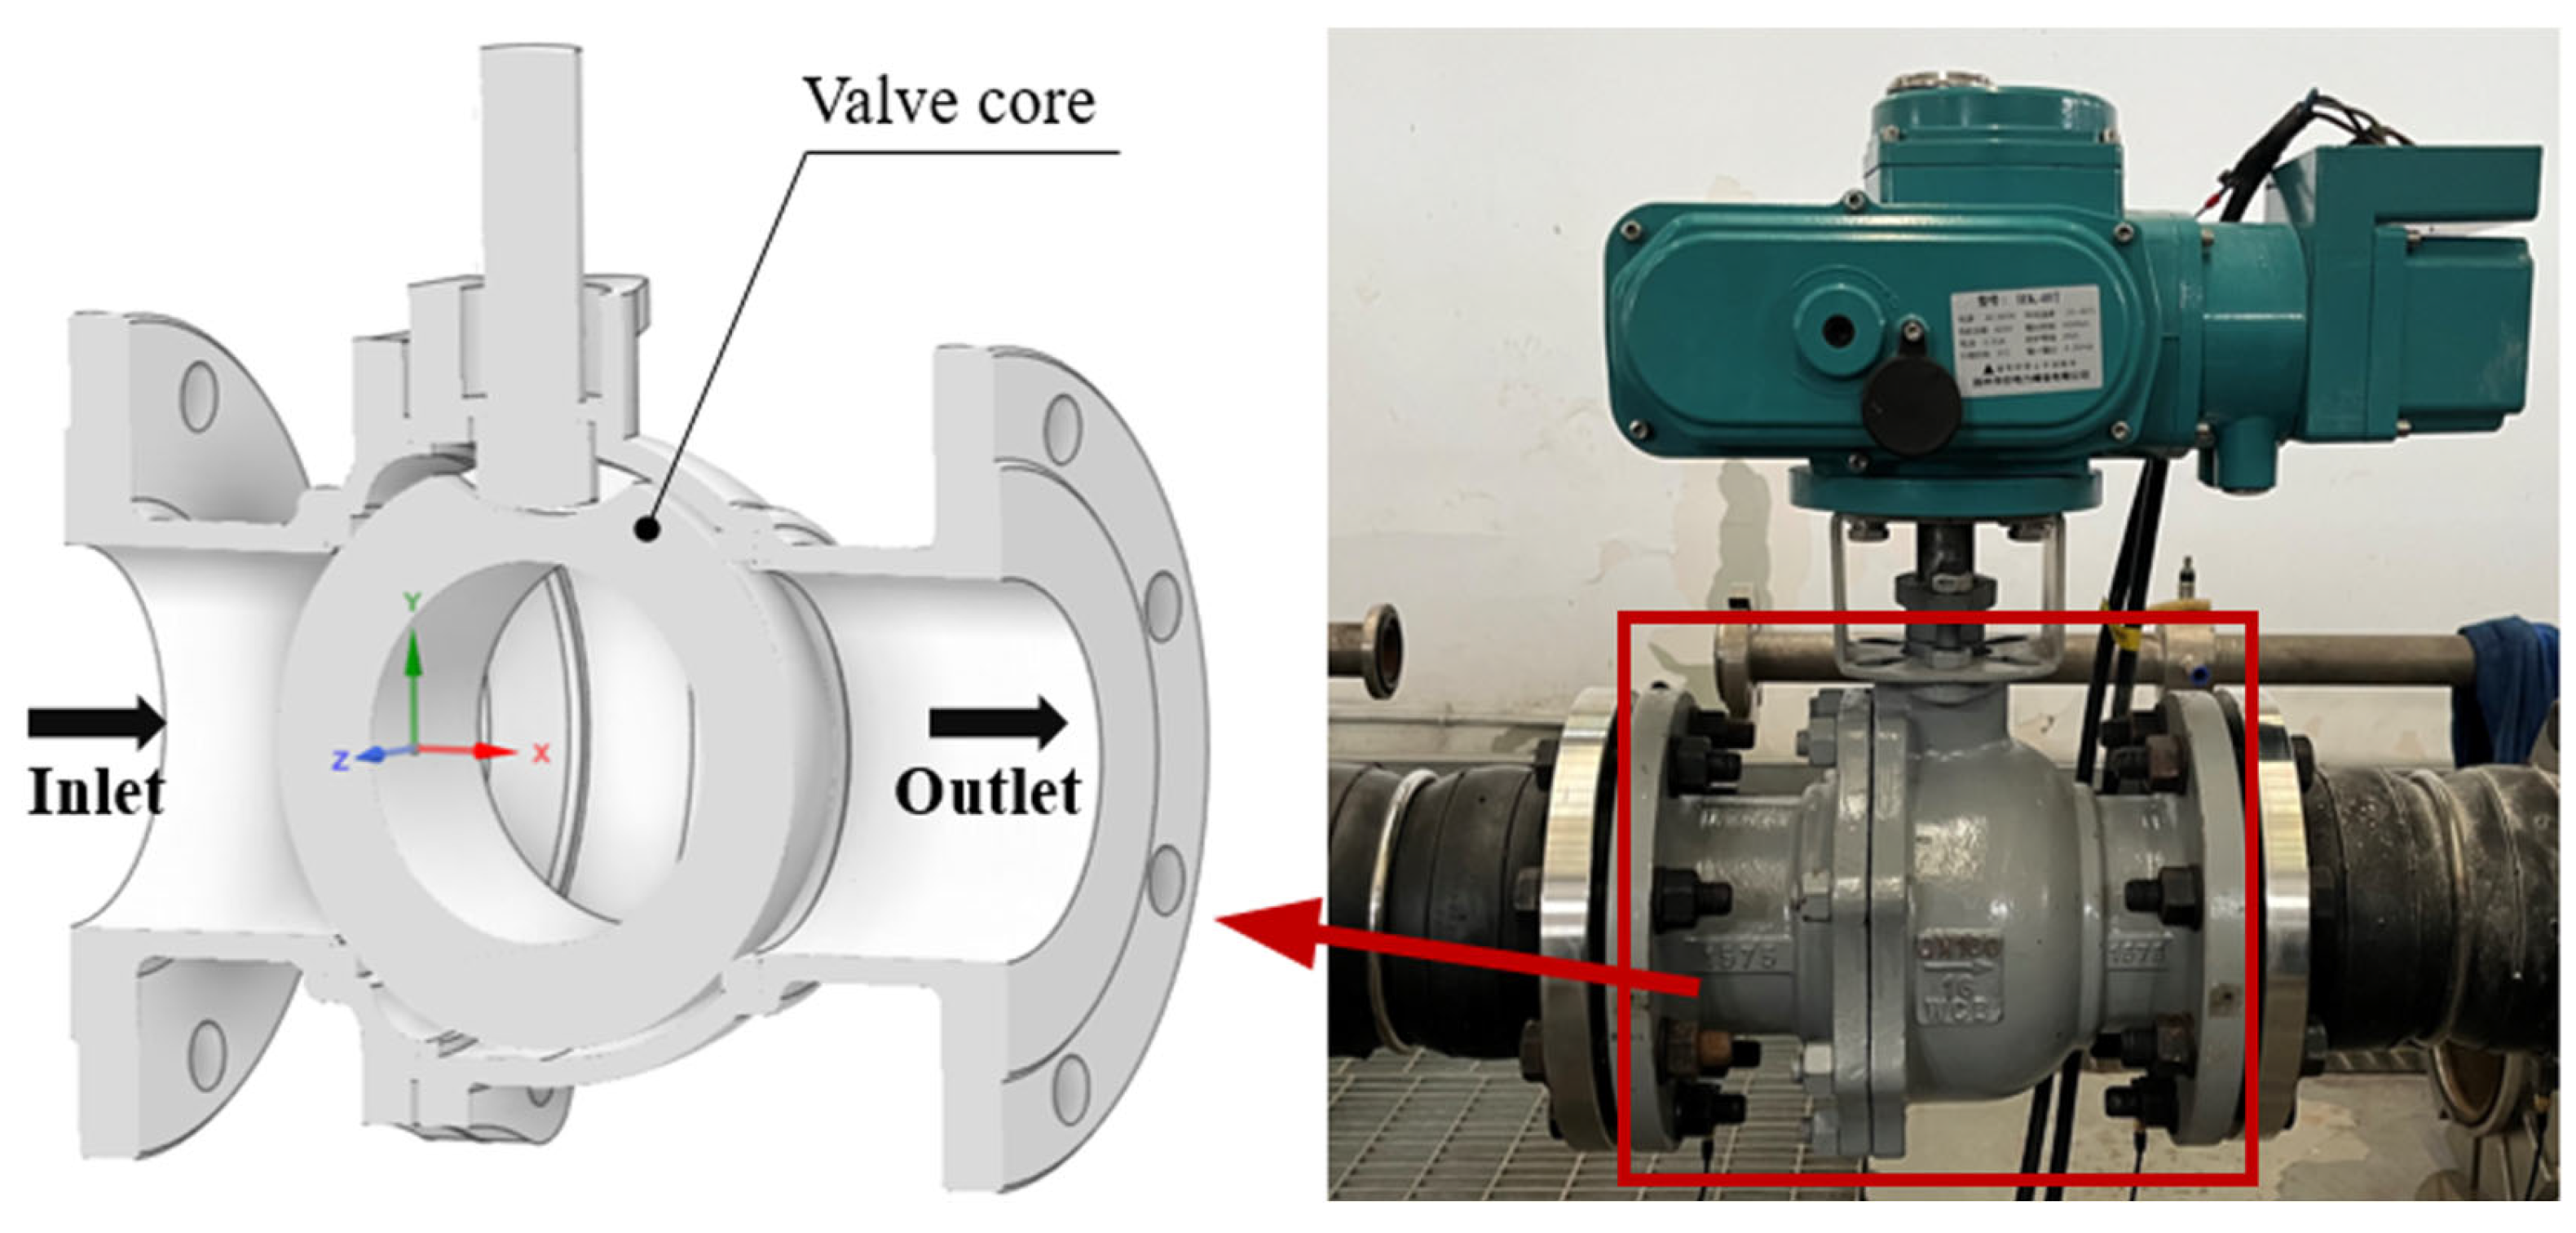
Figure 1. Geometry of the O-type ball valve.
Machines 13 01065 g001
Figure 2. Diagram of the experimental platform.
Machines 13 01065 g002
Figure 3. The installation diagram of eight acceleration sensors: (a) measure points at the inlet section of the pipe, (b) measure points around the valve, and (c) measure points at the outlet section of the pipe.
Machines 13 01065 g003
Figure 4. One-third octave spectrum of different valve openings at low flow velocities.
Machines 13 01065 g004
Figure 5. Overall acceleration level of different valve openings at high flow velocities.
Machines 13 01065 g005
Figure 6. Overall acceleration level for 100% valve opening at MP-4 and MP-5.
Machines 13 01065 g006aMachines 13 01065 g006b
Figure 7. Overall acceleration level for 60% valve opening at MP-4 and MP-5.
Machines 13 01065 g007
Figure 8. Comparison of overall acceleration level at 100% to 30% valve opening for MP-5:Y: (a) 80–8000 Hz and (b) 80–315 Hz.
Machines 13 01065 g008
Figure 9. Comparison of critical flow velocity at 100% to 30% valve opening.
Machines 13 01065 g009
Figure 10. Fitted curves for critical flow velocity.
Machines 13 01065 g010
Table 1. Experimental MP and acceleration sensors.
Measurement Point (MP)Acceleration ChannelMeasurement DirectionAbbreviations
11-YHorizontal radialMP-1:Y
22-YHorizontal radialMP-2:Y
33-XAxialMP-3:X
3-YHorizontal radialMP-3:Y
3-ZVertical radialMP-3:Z
44-XAxialMP-4:X
4-YHorizontal radialMP-4:Y
4-ZVertical radialMP-4:Z
55-XAxialMP-5:X
5-YHorizontal radialMP-5:Y
5-ZVertical radialMP-5:Z
66-XAxialMP-6:X
6-YHorizontal radialMP-6:Y
6-ZVertical radialMP-6:Z
77-YHorizontal radialMP-7:Y
88-YHorizontal radialMP-8:Y
Table 2. Experimental devices of vibration.
DeviceDevice ModelQuantity
Acceleration sensorsBK-4535-B-0014, MP-3~6
PCB-356A254, MP-1~2, MP-7~8
Data-acquisition deviceLMS SCADAS Mobile
(Siemens, Munich, Germany)
1
Table 3. Overall acceleration level of different valve openings at low flow velocities.
Valve Opening (%)1007030
Overall Level (dB)80–315 Hz80–8000 Hz80–315 Hz80–8000 Hz80–315 Hz80–8000 Hz
MP1:Y93.1095.4592.7797.04101.02102.13
MP2:Y79.2087.2279.3687.3694.0695.06
MP3:Y76.1779.8584.4086.1697.2797.35
MP4:Y64.3270.6870.9973.5795.0296.81
MP5:Y66.8873.4473.6776.5593.71100.14
MP6:Y76.7982.7577.5884.0595.6495.93
MP7:Y76.5386.6477.1887.3294.1995.06
MP8:Y90.7596.7191.6496.9496.7898.23
Table 4. Equations for the green fitting lines of MP-4 and MP-5 at 60% valve opening.
Acceleration ChannelFitting Equation
MP-4:Xy = 52.41856 + 68.67104x
MP-4:Yy = 41.17538 + 70.84909x
MP-4:Zy = 43.38455 + 70.88041x
MP-5:Xy = 52.47205 + 68.70526x
MP-5:Yy = 43.7786 + 68.52023x
MP-5:Zy = 44.207 + 71.77222x
Disclaimer/Publisher’s Note: The statements, opinions and data contained in all publications are solely those of the individual author(s) and contributor(s) and not of MDPI and/or the editor(s). MDPI and/or the editor(s) disclaim responsibility for any injury to people or property resulting from any ideas, methods, instructions or products referred to in the content.