Article

Accelerated Life Test and Performance Degradation Test of Harmonic Drive with Failure Analysis

1
Shaanxi Key Laboratory of Advanced Manufacturing and Health Management for Aviation Components, Shaanxi University of Technology, Hanzhong 723001, China
2
School of Mechanical Engineering, Shaanxi University of Technology, Hanzhong 723001, China
3
Engineering Research Center of Manufacturing and Testing for Landing Gear and Aircraft Structural Parts-Universities of Shaanxi Province, Shaanxi University of Technology, Hanzhong 723001, China
4
Shaanxi Provincial “Four Main Bodies and One Union” University-Enterprise Joint Research Center for Aircraft Landing Gear Advanced Manufacturing and Aviation Component Performance Test, Shaanxi University of Technology, Hanzhong 723001, China
5
School of Mechanical Engineering, Xi’an Jiaotong University, Xi’an 710049, China
*
Authors to whom correspondence should be addressed.
Machines 2025, 13(10), 918; https://doi.org/10.3390/machines13100918
Submission received: 5 August 2025 / Revised: 23 September 2025 / Accepted: 29 September 2025 / Published: 5 October 2025
(This article belongs to the Section Machines Testing and Maintenance)

Abstract

Harmonic drive is susceptible to strength failure and performance degradation failure during operation. Given the long life test cycles, limited sample size, and incomplete understanding of degradation laws, this study conducted comprehensive life test and performance degradation test research to enable future failure prediction and reliability assessment for harmonic drive. Building upon established test rigs for a HD life test and performance degradation test, a step-down accelerated life test methodology was developed. Life tests under step-down accelerated conditions were executed, with a concurrent performance degradation test throughout the life test. Key datasets acquired include vibration signal histories, degradation data for critical performance indicators such as stiffness, precision, transmission efficiency, and backlash. Test results show that the predominant strength failure in the atmospheric environment is flexspline fatigue fracture, while significant degradation occurred in stiffness, precision, and backlash across all test conditions; transmission efficiency showed gradual degradation before strength failure followed by a marked decline post-failure. Finally, the failure mechanism of strength and performance degradation is analyzed, and the mechanism consistency of the two failures is verified by Hilbert envelope spectrum analysis and degradation trajectory shape consistency, respectively. The results from this paper provide critical data support and a reference foundation for the proactive maintenance of the harmonic drive.

1. Introduction

The harmonic drive (HD) features a compact structure, lightweight design, large transmission ratio, high precision, high efficiency, and the capability to transmit power to vacuum and sealed spaces. Initially, it was primarily applied in driving components for aerospace equipment operating in space environments [1]. Subsequently, its applications have expanded to various equipment such as robots, radar systems, optical instruments, semiconductor manufacturing, and medical devices. Among these, industrial robot joints represent the most widely used application. During operation, HDs are prone to strength failure (e.g., fatigue fracture of the flexspline [2]) or performance degradation failure (e.g., precision, stiffness [3]). These failures can lead to reduced equipment performance or unexpected breakdowns. Consequently, the operational reliability of an HD cannot guarantee the Mean Time Between Failures (MTBF) required for manufacturing equipment like industrial robots, preventing the implementation of proactive maintenance. Currently, comprehensive life test data for HDs is rarely disclosed. Existing life testing methods for HD suffer from high costs and low efficiency, and there is a lack of publicly available degradation data on their performance indicators. Therefore, it is imperative to conduct experimental research on the accelerated life test (ALT) and performance degradation test for HDs, which will provide crucial data support and a reference basis for accurately assessing its reliability in terms of both strength and performance degradation. And this is also essential to ensure the reliable operation of equipment with HDs.
Currently, most existing life tests for HDs are conducted in simulated space environments (thermal vacuum test systems). Life tests under space environments are typically performed at or below the rated operating condition of HDs. These tests are primarily used to compare and validate the performance and lifespan of an HD, employing different lubricants in a thermal vacuum environment [4,5,6]. However, life tests under rated condition are often time-consuming, labor-intensive, costly, and impractical to implement [7]. Consequently, ALT has gradually emerged as the universal testing method to obtain product life failure data within a controllable test period [8]. Under accelerated space environment condition, Li Junyang et al. conducted a mixed lubrication analysis of the contact pair between the flexspline and the outer ring of the wave generator in an HD, established an accelerated model based on adhesive wear, performed constant accelerated condition life tests of an HD in a thermal vacuum environment, and analyzed the resulting test data and life distribution [9,10,11]. Ueura et al. conducted an ALT of an HD under thermal vacuum environment by applying a constant periodic load. They found that wear on the contact surfaces between the wave generator and the inner wall of the flexspline became particularly severe with prolonged operation time, identifying this as a key factor affecting the operational lifespan of the HD [12]. Zhang et al. performed HD life tests in a thermal vacuum environment under step-up accelerated stress and developed an accelerated model considering segmented stress history, enabling the prediction of HD operational life under rated condition [13]; however, the step-down accelerated life test is more efficient compared to the step-up accelerated life test [14].
The application of HDs has migrated from aerospace equipment to having widespread industrial use, such as in robotics, shifting their operational context from space to atmospheric conditions. This shift has correspondingly altered the principal failure mechanism, from wear at the flexspline–wave generator interface in space to fatigue fracture of the flexspline itself in atmospheric environments. Regarding HD life tests under atmospheric conditions, the corresponding literature is relatively scarce. Existing tests are predominantly conducted under constant accelerated conditions, complete performance degradation data throughout the life test period has not been obtained [15], and the consistency analysis of failure mechanism between the accelerated condition (3 to 4 times the rated condition) and the rated condition has not been performed [16,17]. Nevertheless, such analysis is crucially important for conducting failure analysis (both strength failure and performance degradation failure) of HDs in practical applications like industrial robots and for ensuring reliable equipment operation. Therefore, it is essential to conduct life test and performance degradation test research on HDs under atmospheric conditions and to propose a more efficient testing methodology.
The performance indicators of HD include transmission efficiency, precision, friction torque, starting torque, stiffness, and backlash. These indicators degrade during HD operation, consequently affecting overall HD performance. Therefore, performance degradation tests during HD life tests are essential. Concerning the multiple performance indicators of HDs, the existing literature primarily focuses on developing test apparatuses for individual indicators. This facilitates performance evaluation and dynamic model parameter identification [18,19]. However, the literature on performance degradation tests of HDs throughout the entire lifecycle is scarce. Researchers mainly utilize performance indicators as failure criteria for stopping HD life tests. For instance, in the ALT under thermal vacuum conditions described in references [9,10], transmission efficiency was measured at fixed intervals until it degraded to 50%, and degradation curves for transmission efficiency and transmission accuracy over the HD lifecycle were obtained. Additionally, Schäfer et al. [4] and Zhang et al. [13] used a 10% reduction in transmission efficiency and precision/backlash reaching empirical failure thresholds as criteria for halting HD life tests, respectively. However, they did not provide specific degradation curves for these performance indicators over the lifecycle. The aforementioned studies only obtained relatively complete degradation histories for transmission efficiency and precision. Other performance degradation indicators were neglected, preventing the acquisition of a comprehensive understanding of HD performance degradation laws. Additionally, the failure criteria for HD life test in the current literature vary significantly, with substantial differences in the standards for setting these criteria. Consequently, the life failure data obtained based on these different criteria lack a unified evaluation standard, complicating subsequent data analysis and comparison. Relying on multiple performance indicators to determine the test cessation criterion might lead to a situation where the test is stopped because one indicator exceeds its threshold, while other performance aspects of the HD remain normal. This prevents the acquisition of complete degradation information for all performance indicators. Simultaneously, differences in the primary failure modes of HDs across various application environments also influence the setting of failure criteria and the design of life test systems. Therefore, there is a need to identify a unified failure criterion for harmonic reducer life testing beyond specific performance metrics.
In summary, addressing the limitations identified in the existing research, this paper proposes a step-down ALT method for HDs based on the previously established HD life test and performance degradation test apparatuses. Utilizing this method, a life test under step-down accelerated conditions was conducted while a performance degradation test was performed concurrently throughout the life test process, and the time domain vibration signal history (failure data) and the degradation laws of key HD performance indicators (e.g., stiffness, precision, transmission efficiency, and backlash) were obtained. Furthermore, this work achieved the verification analysis of both the failure mechanisms in the HD ALT and their consistency (between accelerated and rated conditions). The related test results and analysis provide crucial data support and a reference basis for HD reliability assessment and proactive maintenance.

2. Test Rigs of HD Accelerated Life and Performance Degradation

2.1. HD Accelerated Life Test Rig

As shown in Figure 1, the test rig is capable of conducting life tests on harmonic drives under various operating conditions of input speed and loading torque. A detailed description of each component of this accelerated life test rig can be found in reference [20]. Additionally, the servo motor shown in Figure 1 has a power rating of 0.75 kW, and the sensitivity of the acceleration sensor is 100 mV/g. Meanwhile, the vibration signal is captured by the accelerometer and a National Instrument (NI) data acquisition (DAQ) card 9234; the torque signal is captured by the torque sensors and a NI DAQ card 9215. The acquisition software was programmed by NI LabVIEW 2020. The sampling frequency of vibration and torque signals are 20 kHz and 5 kHz. HD life is considered to end if the amplitude of the vibration signal exceeds 20 g [21].
The powder brake in Figure 1 can experience a temperature increase during long-term operation, leading to a reduction in the applied torque. However, the loading torque in the accelerated life test setup shown in Figure 1 is controlled by a host computer control system. Specifically, the acquired torque signal is transmitted in real-time to the host computer control system and compared with the set torque value. Based on the deviation, the host computer sends control signals to automatically adjust the current supplied to the powder brake, ensuring that the torque is maintained near the set value. If the life test runs for an extended period, the original naturally cooled powder brake (model ZKB-20XN) (Mitsubishi Electric, Tokyo, Japan) can be replaced with an air-cooled (model ZKB-20HBN-C) (Mitsubishi Electric, Tokyo, Japan) or water-cooled (model ZKB-20WN) (Mitsubishi Electric, Tokyo, Japan) powder brake, fundamentally mitigating the torque reduction issue caused by overheating of the powder brake.

2.2. HD Performance Degradation Test Rig

HD performance indicators include stiffness, transmission accuracy, transmission efficiency, starting torque, friction torque, and backlash. The definition of these performance indicators are as follows. Transmission Error: The difference between the actual and the theoretical angular position of the output shaft during unidirectional rotation of the input shaft. Backlash: The error caused by the relative lag of the output shaft during direction changes in the transmission process of the HD. Stiffness: With the input end of the HD fixed, a load torque is applied repeatedly in both forward and reverse directions on the output side. The stiffness hysteresis curve is obtained by synchronously collecting torque and rotation angle signals at the output end. The stiffness of the HD is then determined by calculating the slope of the fitted curve. Transmission Efficiency: The ratio of the actual output torque to the ideal output torque at the output end of the HD under rated operating conditions. Starting Torque: The HD is slowly started under no-load conditions while the input torque is recorded. The maximum value of the input torque during the starting process is defined as the starting torque. Friction Torque: When the HD operates under no-load and constant speed conditions, the motor drive force is only used to overcome friction. Ignoring the elastic factors inside the HD, the input torque of the motor corresponds to the friction torque of the HD at that speed.
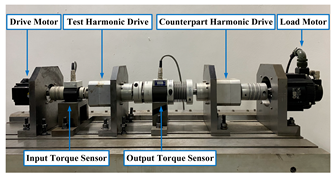
During the performance degradation test, it is necessary to acquire various signals such as torque and angle, while also requiring different output loading conditions, such as no-load, bidirectional reciprocating loading, and unidirectional constant torque loading. Therefore, for a complete test of all performance indicators, it is essential to form distinct test platforms by reconfiguring the test modules, as shown in Table 1.
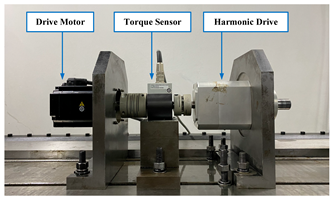
For the HD performance degradation test rigs in Table 1, the drive motor is a SGM7J-08A servo motor (Yaskawa Electric, Shanghai, China). The load motor is a SGM7G-13A (1.3 kW; Yaskawa Electric, Shanghai, China) servo motor. The controller utilizes a Googoltech GE400-SV-PCI motion control card (GOOGOLTECH, Shenzhen, China). The counterpart HD is XBa60-75 (Shaanxi Weihe Tools Co. Ltd., Baoji, China). The input and output shaft angles of the test HD are measured using a Heidenhain rotary encoder (HEIDENHAIN, Schaumburg, Germany) and a Heidenhain RON786 angle encoder (HEIDENHAIN, Schaumburg, Germany), respectively; the acquisition card is a Heidenhain IK220 counter card (HEIDENHAIN, Schaumburg, Germany). The input and output torque of the test HD are measured using HBM T22 torque transducers (HBM, Darmstadt, Germany) with ranges of 0–5 Nm and 0–200 Nm, respectively. Torque signals are acquired via an NI PCI-6143 card (NI, Austin, USA). The motion control and signal acquisition cards are all installed in the motherboard of an Advantech 610 L industrial computer (Advantech, Kunshan, China).

3. Plan of Step-Down Accelerated Life Test and Performance Degradation Test

3.1. Stress Level and Sample Number of Step-Down Accelerated Life Test

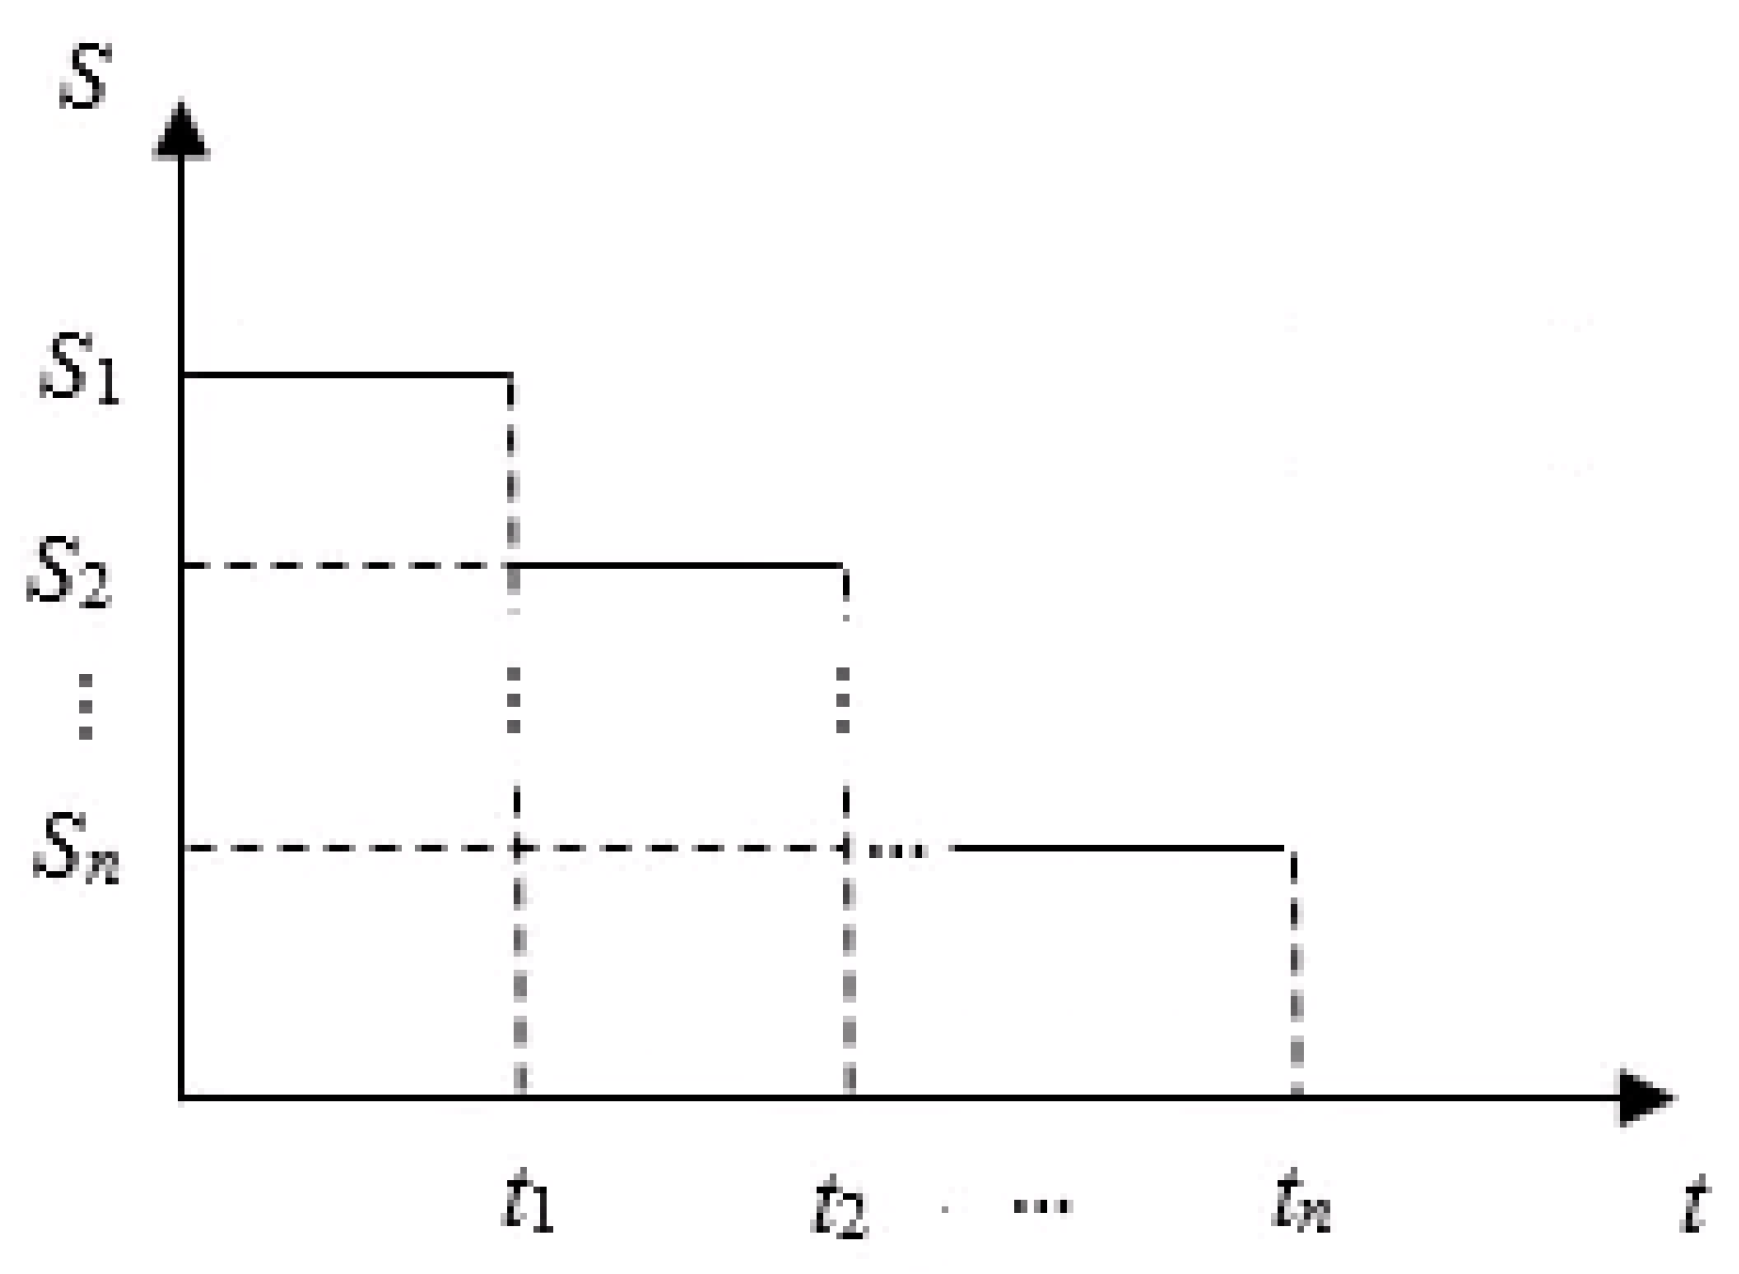
Let S represent the accelerated stress applied to the HD. As illustrated in Figure 2, several stress levels are selected: S1, S2, …, Sn, where S1 > S2 > … > Sn. Here, S1 denotes the highest stress level, and Sn denotes the lowest stress level, typically near the rated condition of the test HD. When conducting ALT under step-down stress conditions, testing initially commences at the highest stress level, S1. Testing continues until either a predetermined number of failures occurs (Type-I censoring) or a predetermined test duration is reached (Type-II censoring). At this point, the stress level is stepped down to the next level, S2, for the surviving test samples (those not yet failed). Testing then continues at S2 until the specified failure count or test time criterion is again met. For samples still surviving, the stress is then stepped down to S3, and testing proceeds. This process continues iteratively, sequentially stepping down the stress level for surviving samples after meeting the censoring criteria at each stage, until the test concludes at the lowest stress level, Sn, upon reaching either the target number of failures or the specified test duration.
The fatigue failure of a HD typically manifests as fatigue fracture at the tooth root of the flexspline. Based on the static strength limit formula for the critical position of the HD [21], the maximum allowable value of torque can be determined, which can provide a reference for establishing the highest accelerated stress level for the HD.
The test samples for the life test and performance degradation test in this study are HDs of Xba-60-75 (Shaanxi Weihe Tools Co. Ltd., Baoji, China), with rated conditions of 2000 rpm and 50 Nm, and a reduction ratio of 75. According to the formula in reference [22], the allowable loading torque of the HD under extreme conditions is calculated to be 334.1 Nm based on the corresponding parameters of the Xba-60-75 model.
In a study on accelerated life test of HD in space environments conducted by Chongqing University, the rated loading torque was 5 Nm, and the maximum torque was set at 30 Nm, which is 6 times the rated torque [23]. In a life test of harmonic reducers in atmospheric environments conducted by Shanghai Jiao Tong University, the maximum torque was 3–4 times the rated torque [16]. Neither of these two studies performed validation of the consistency of the accelerated failure mechanisms. Considering that the rated torque of the HD used in this study is already relatively high (50 Nm), and taking into account the allowable loading torque based on the static strength of the HD as well as the loading range of the life test system, the highest accelerated stress level in the subsequent step-down accelerated life test was set to 100 Nm (2 times the rated torque).
The output torque loading applied to the HD serves as the accelerated stress for the Step-Down ALT. Three levels of step-down accelerated stress were defined as S1 (Highest Stress Level): 100 Nm; S2 (Intermediate Stress Level): 75 Nm (set equidistantly between S1 and S3); S3 (Lowest Stress Level): 50 Nm (since the lowest stress level should approximate rated condition). According to the quantitative analysis in the literature [10,24], as the load on the output of HD increases, the meshing force between the teeth of the circular spline and flexspline, as well as the normal force at the contact area between the flexspline and the major axis of the wave generator, also increase. Simultaneously, the stress and deformation in the tooth rim area of the flexspline increase as well. Therefore, in the life tests of HDs conducted in this study, when the torque level increases from the rated condition to the accelerated condition, it leads to increased pressure and accelerated wear on the tooth surfaces of the circular spline and flexspline, and on the contact surface between the flexspline and the wave generator. This results in the degradation of performance indicators such as the transmission accuracy of HD. Furthermore, the increased torque also leads to higher stress at the tooth root of the flexspline. Over extended operation time, this causes fatigue damage and increases the rate of micro-crack initiation and propagation within the flexspline material, ultimately leading to an earlier occurrence of fatigue fracture failure at the tooth root of the flexspline in HD.
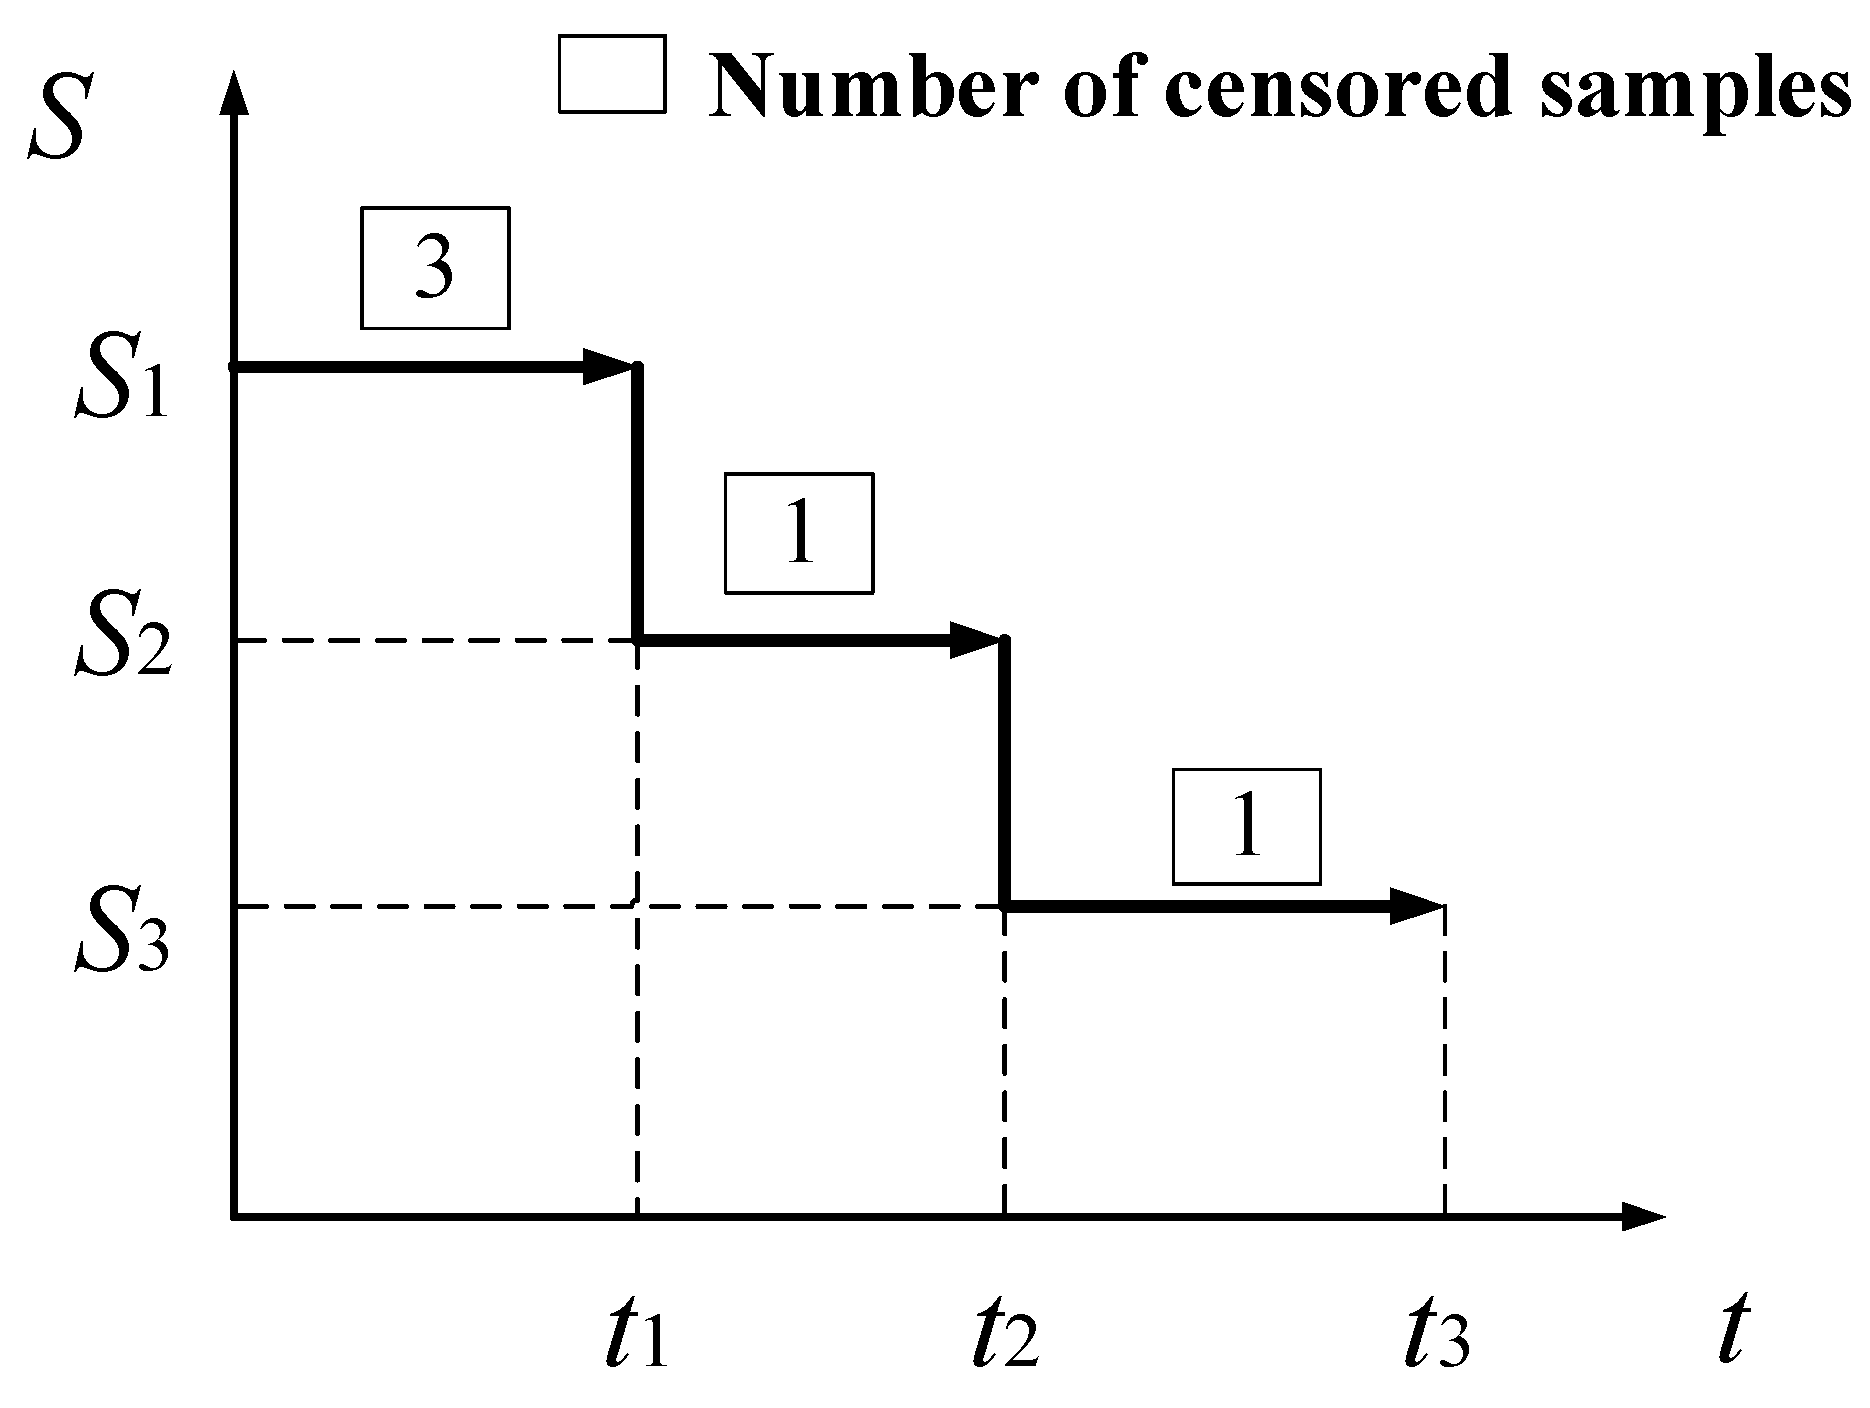
The test employed a Type I censoring scheme with an asymmetric censoring count design. Each life test run produced one failed sample. Concurrently, at 100 Nm torque, Type I censoring yielded three constant-stress failure samples. At 75 Nm torque, Type I censoring yielded one step-down stress failure sample with two stress levels. At 50 Nm torque, Type I censoring yielded one step-down stress failure sample with three stress levels. The correspondence between the number of censored failure samples and the applied stress levels is illustrated in Figure 3.

3.2. Procedure of HD Accelerated Life Test

Due to the hardware constraints of the HD life test rig established in this study, concurrent testing of multiple HD samples was not feasible. Consequently, the test methodology differs from conventional step-down accelerated test approach. Specifically, the ALT and performance degradation test were conducted on a total of five HD samples. The testing was organized into three groups, comprising these five samples, as detailed in Table 2.
Accounting for randomness, the time duration t1 at the first stress level (100 Nm) before stepping down to the second stress level (75 Nm) was set to one-third of the minimum lifetime value observed among the samples that failed at the first stress level. Similarly, the operating time at the second stress level (75 Nm) prior to stepping down to the third stress level (50 Nm), denoted as the difference between t2 and t1, was set to one-third of the lifetime test duration for the sample that failed during step-down testing at the 75 Nm accelerated stress level.
Group 1 Test: Three constant accelerated life tests were conducted at the highest stress level (Level 1: 100 Nm loading torque). This produced three failure samples.
Group 2 Test: A two-level step-down accelerated life test (denoted as ALTSD1) was performed on a sample under 100 Nm–75 Nm loading. The sample was first tested under a 100 Nm loading torque for duration t1, then under a 75 Nm loading torque until failure.
Group 3 Test: A three-level step-down accelerated life test (denoted as ALTSD2) was performed on a sample under 100 Nm–75 Nm–50 Nm loading. The testing sequence was as follows: 100 Nm loading torque for duration t1; 75 Nm loading torque for duration (t2 − t1); then stepped down to 50 Nm loading torque until failure.

3.3. Performance Degradation Test

Throughout the HD life test process, vibration signals were acquired for 2 s at 2 min intervals until HD life test ceased. Concurrently, during the step-down ALT, periodic tests of key HD performance indicators were conducted on the performance test platform in Table 1 at regular intervals. These tests included starting torque, friction torque, stiffness, precision, backlash, and transmission efficiency. This comprehensive performance degradation tests enabled the derivation of HD performance degradation laws across the life test.

4. Results of Accelerated Life Test and Performance Degradation Test of HD

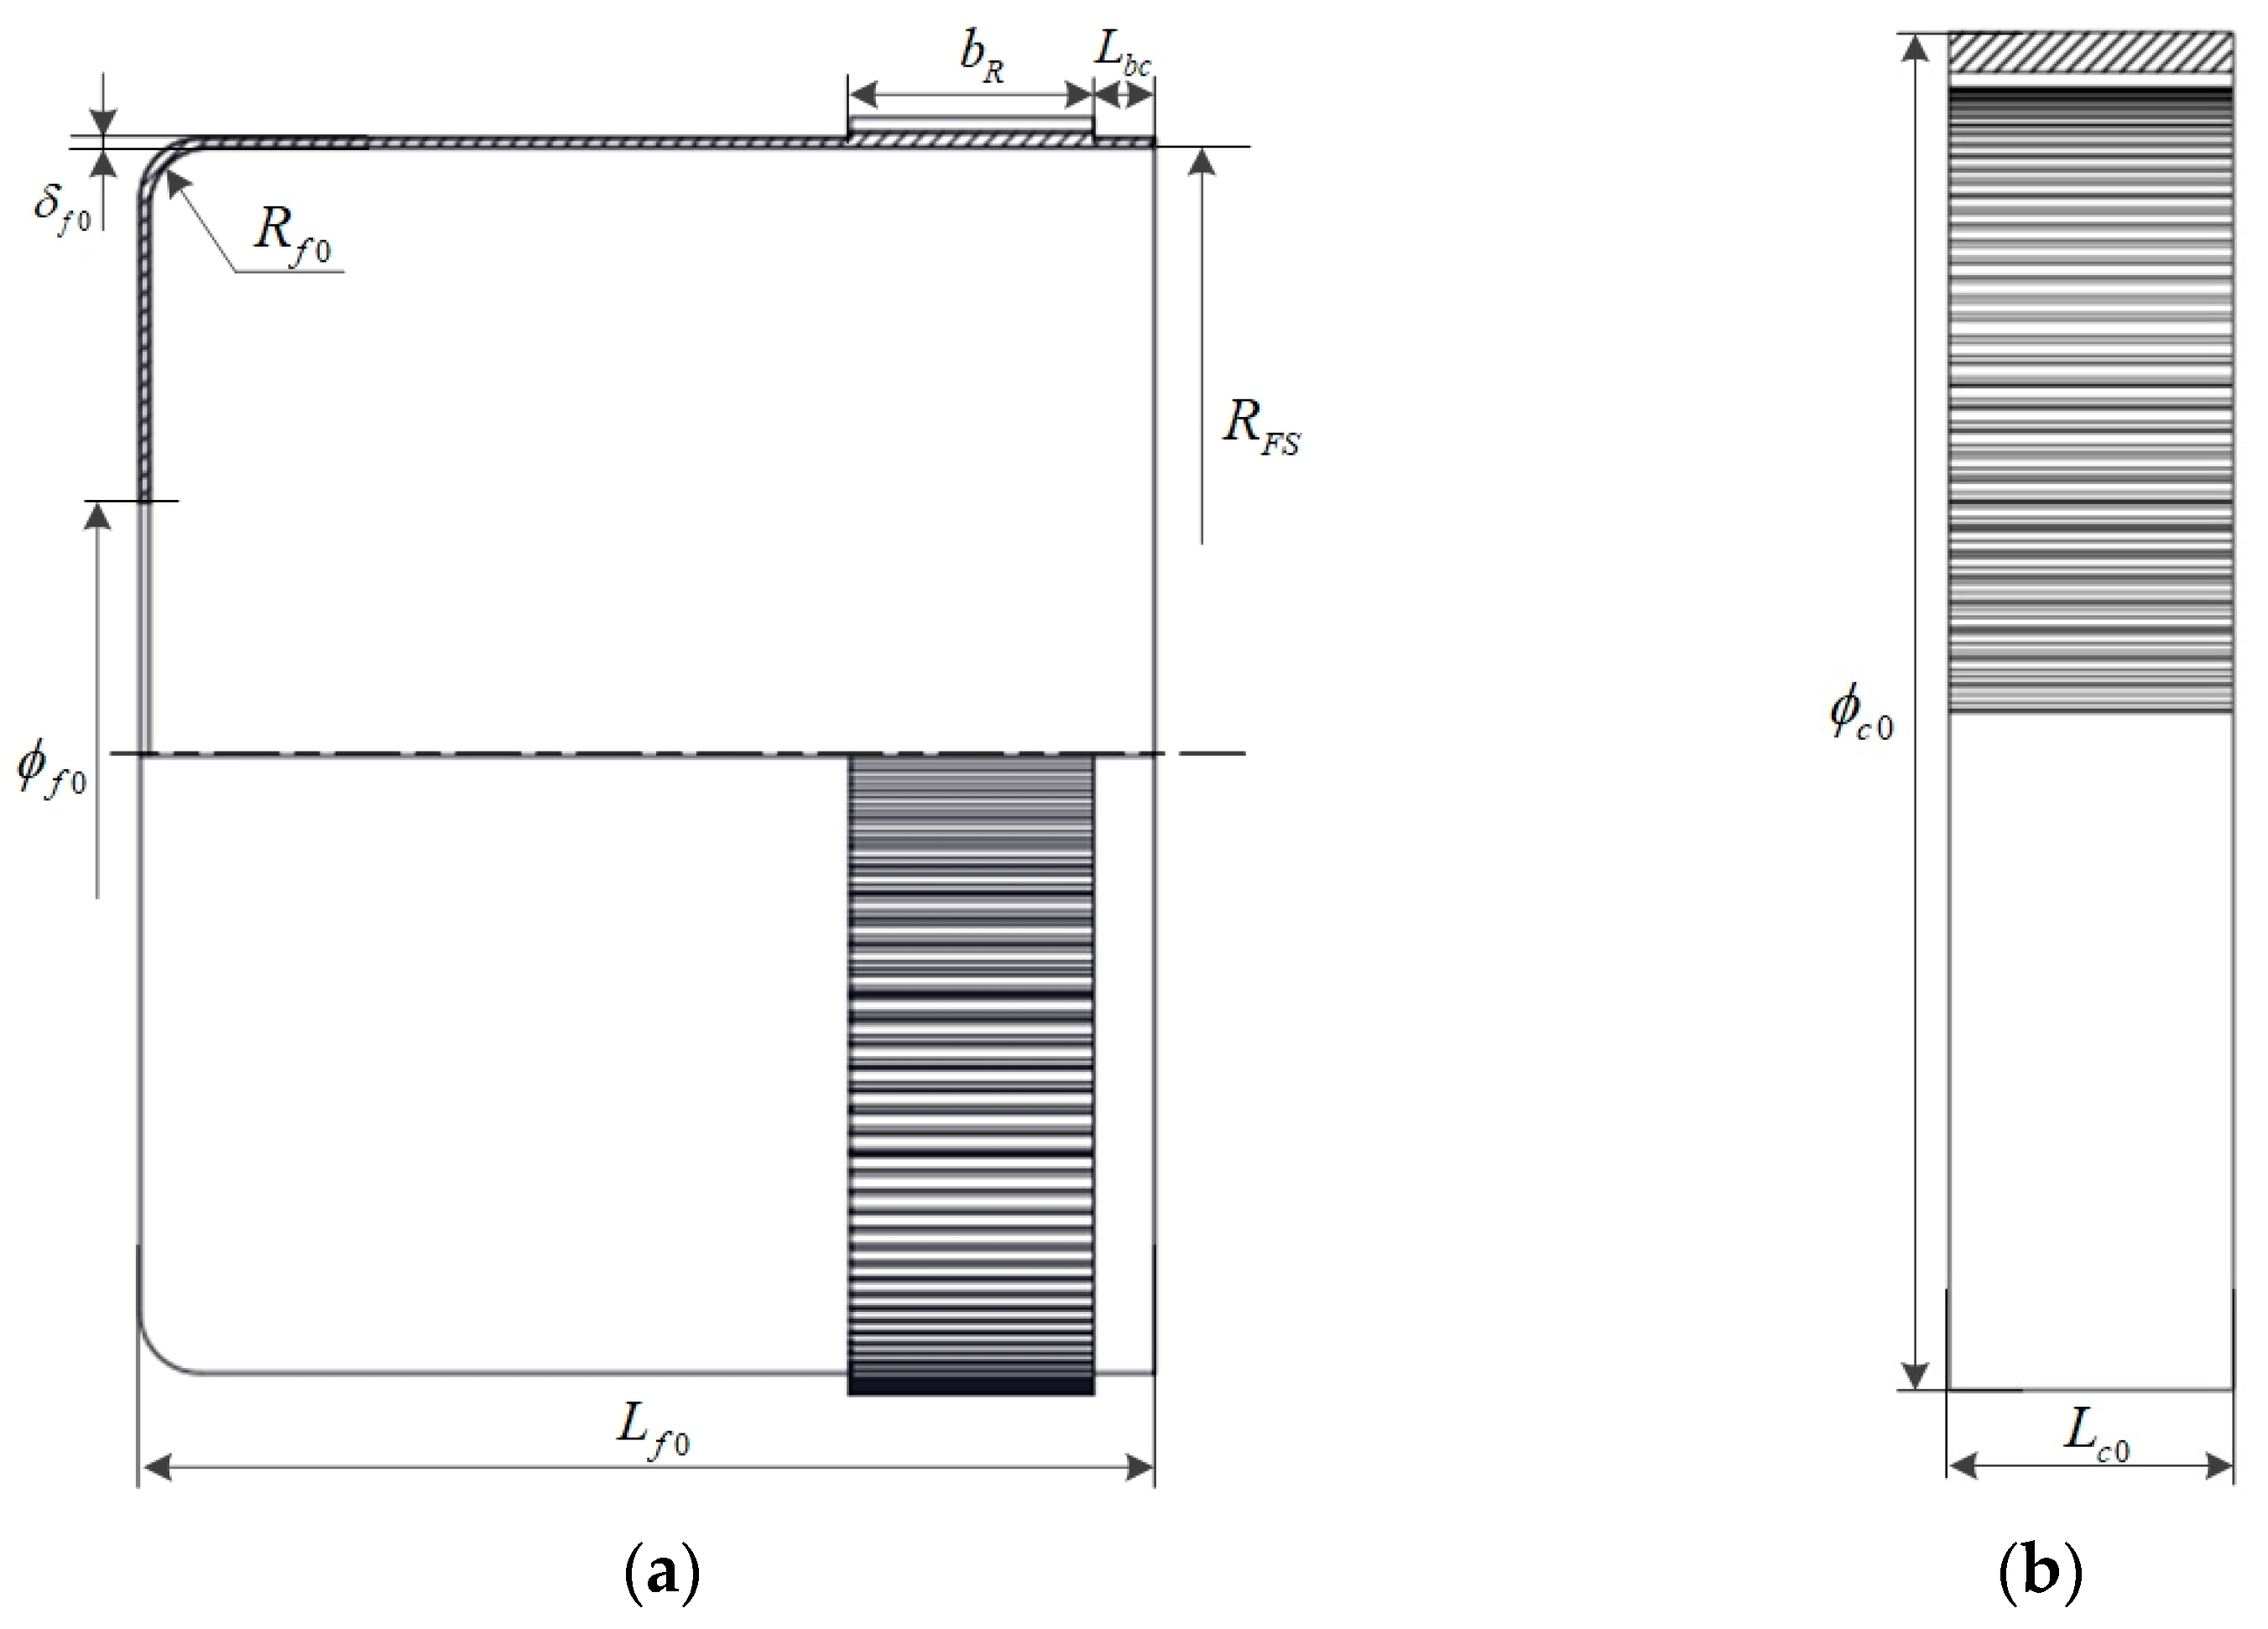
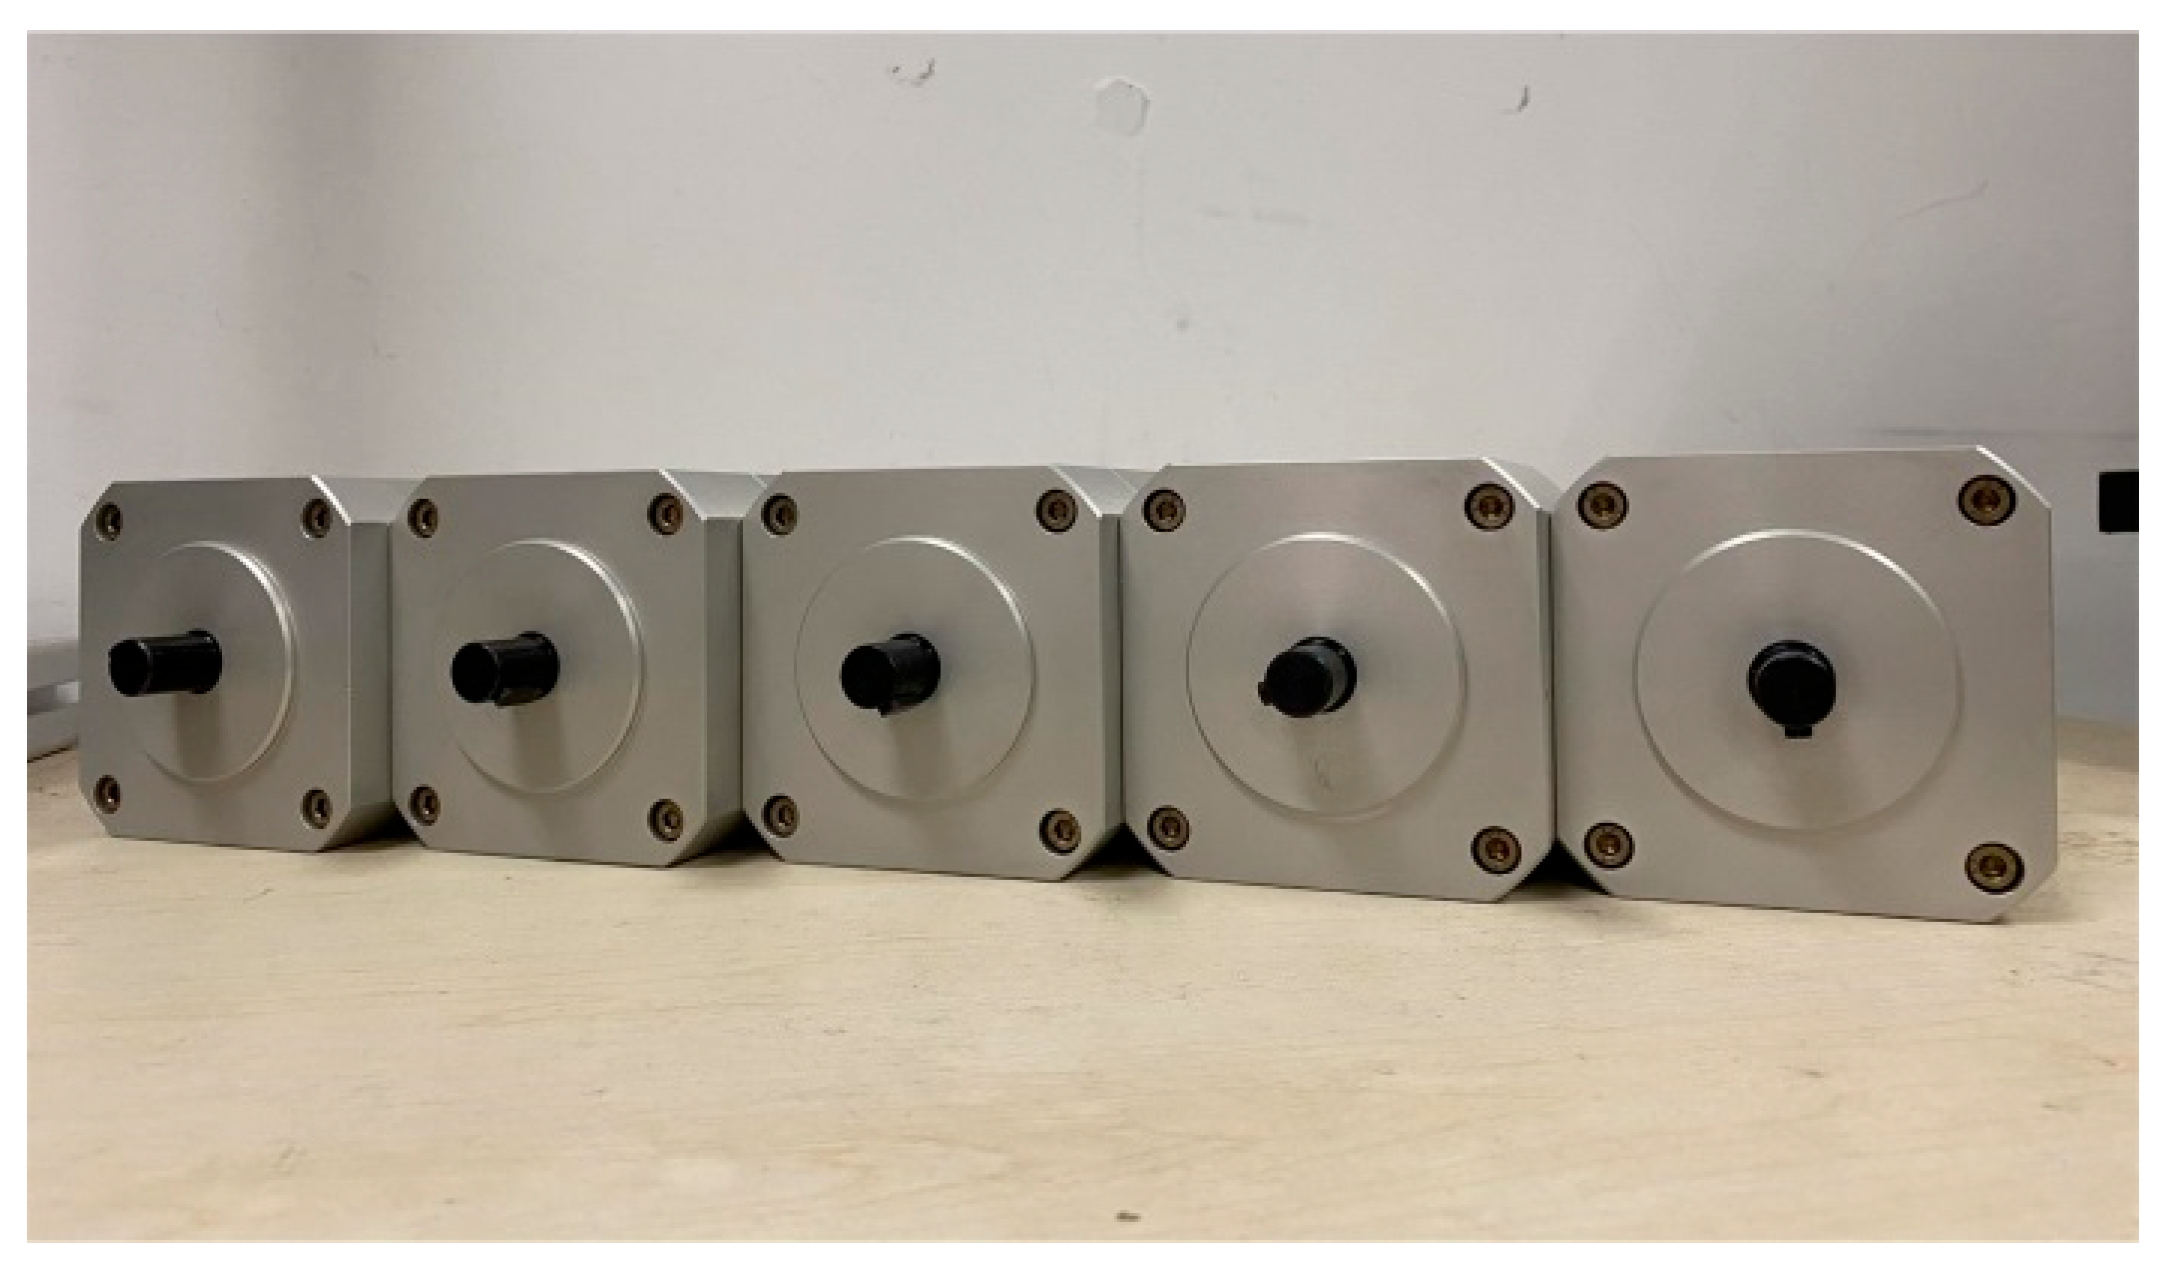
The test samples for ALT and performance degradation test are HDs of Type Xba-60-75, with a rated condition of 2000 rpm, 50 Nm, and the grease type is HARMONIC SK-1A (Harmonic Drive Systems Inc., Tokyo, Japan). The relevant geometric parameters of FS (Flexspline) and CS (Circular Spline) in HD are shown in Figure 4 and Table 3. Five HD samples were tested in the step-down ALT conducted in this paper; images of the five samples are shown in Figure 5.
Before HD ALT, all HD samples underwent no-load running-in and noise tests. These tests were performed in accordance with the relevant Chinese National Standards (GB/T 14118-1993 and GB/T 30819-2014) [25,26], and the results met all specified requirements. Furthermore, the load cycles accumulated during the running-in phase were not included in the subsequent life data analysis. Finally, the initial values of all performance indicators were measured using the performance degradation test rig.

4.1. Step-Down ALT Results Under 100 Nm

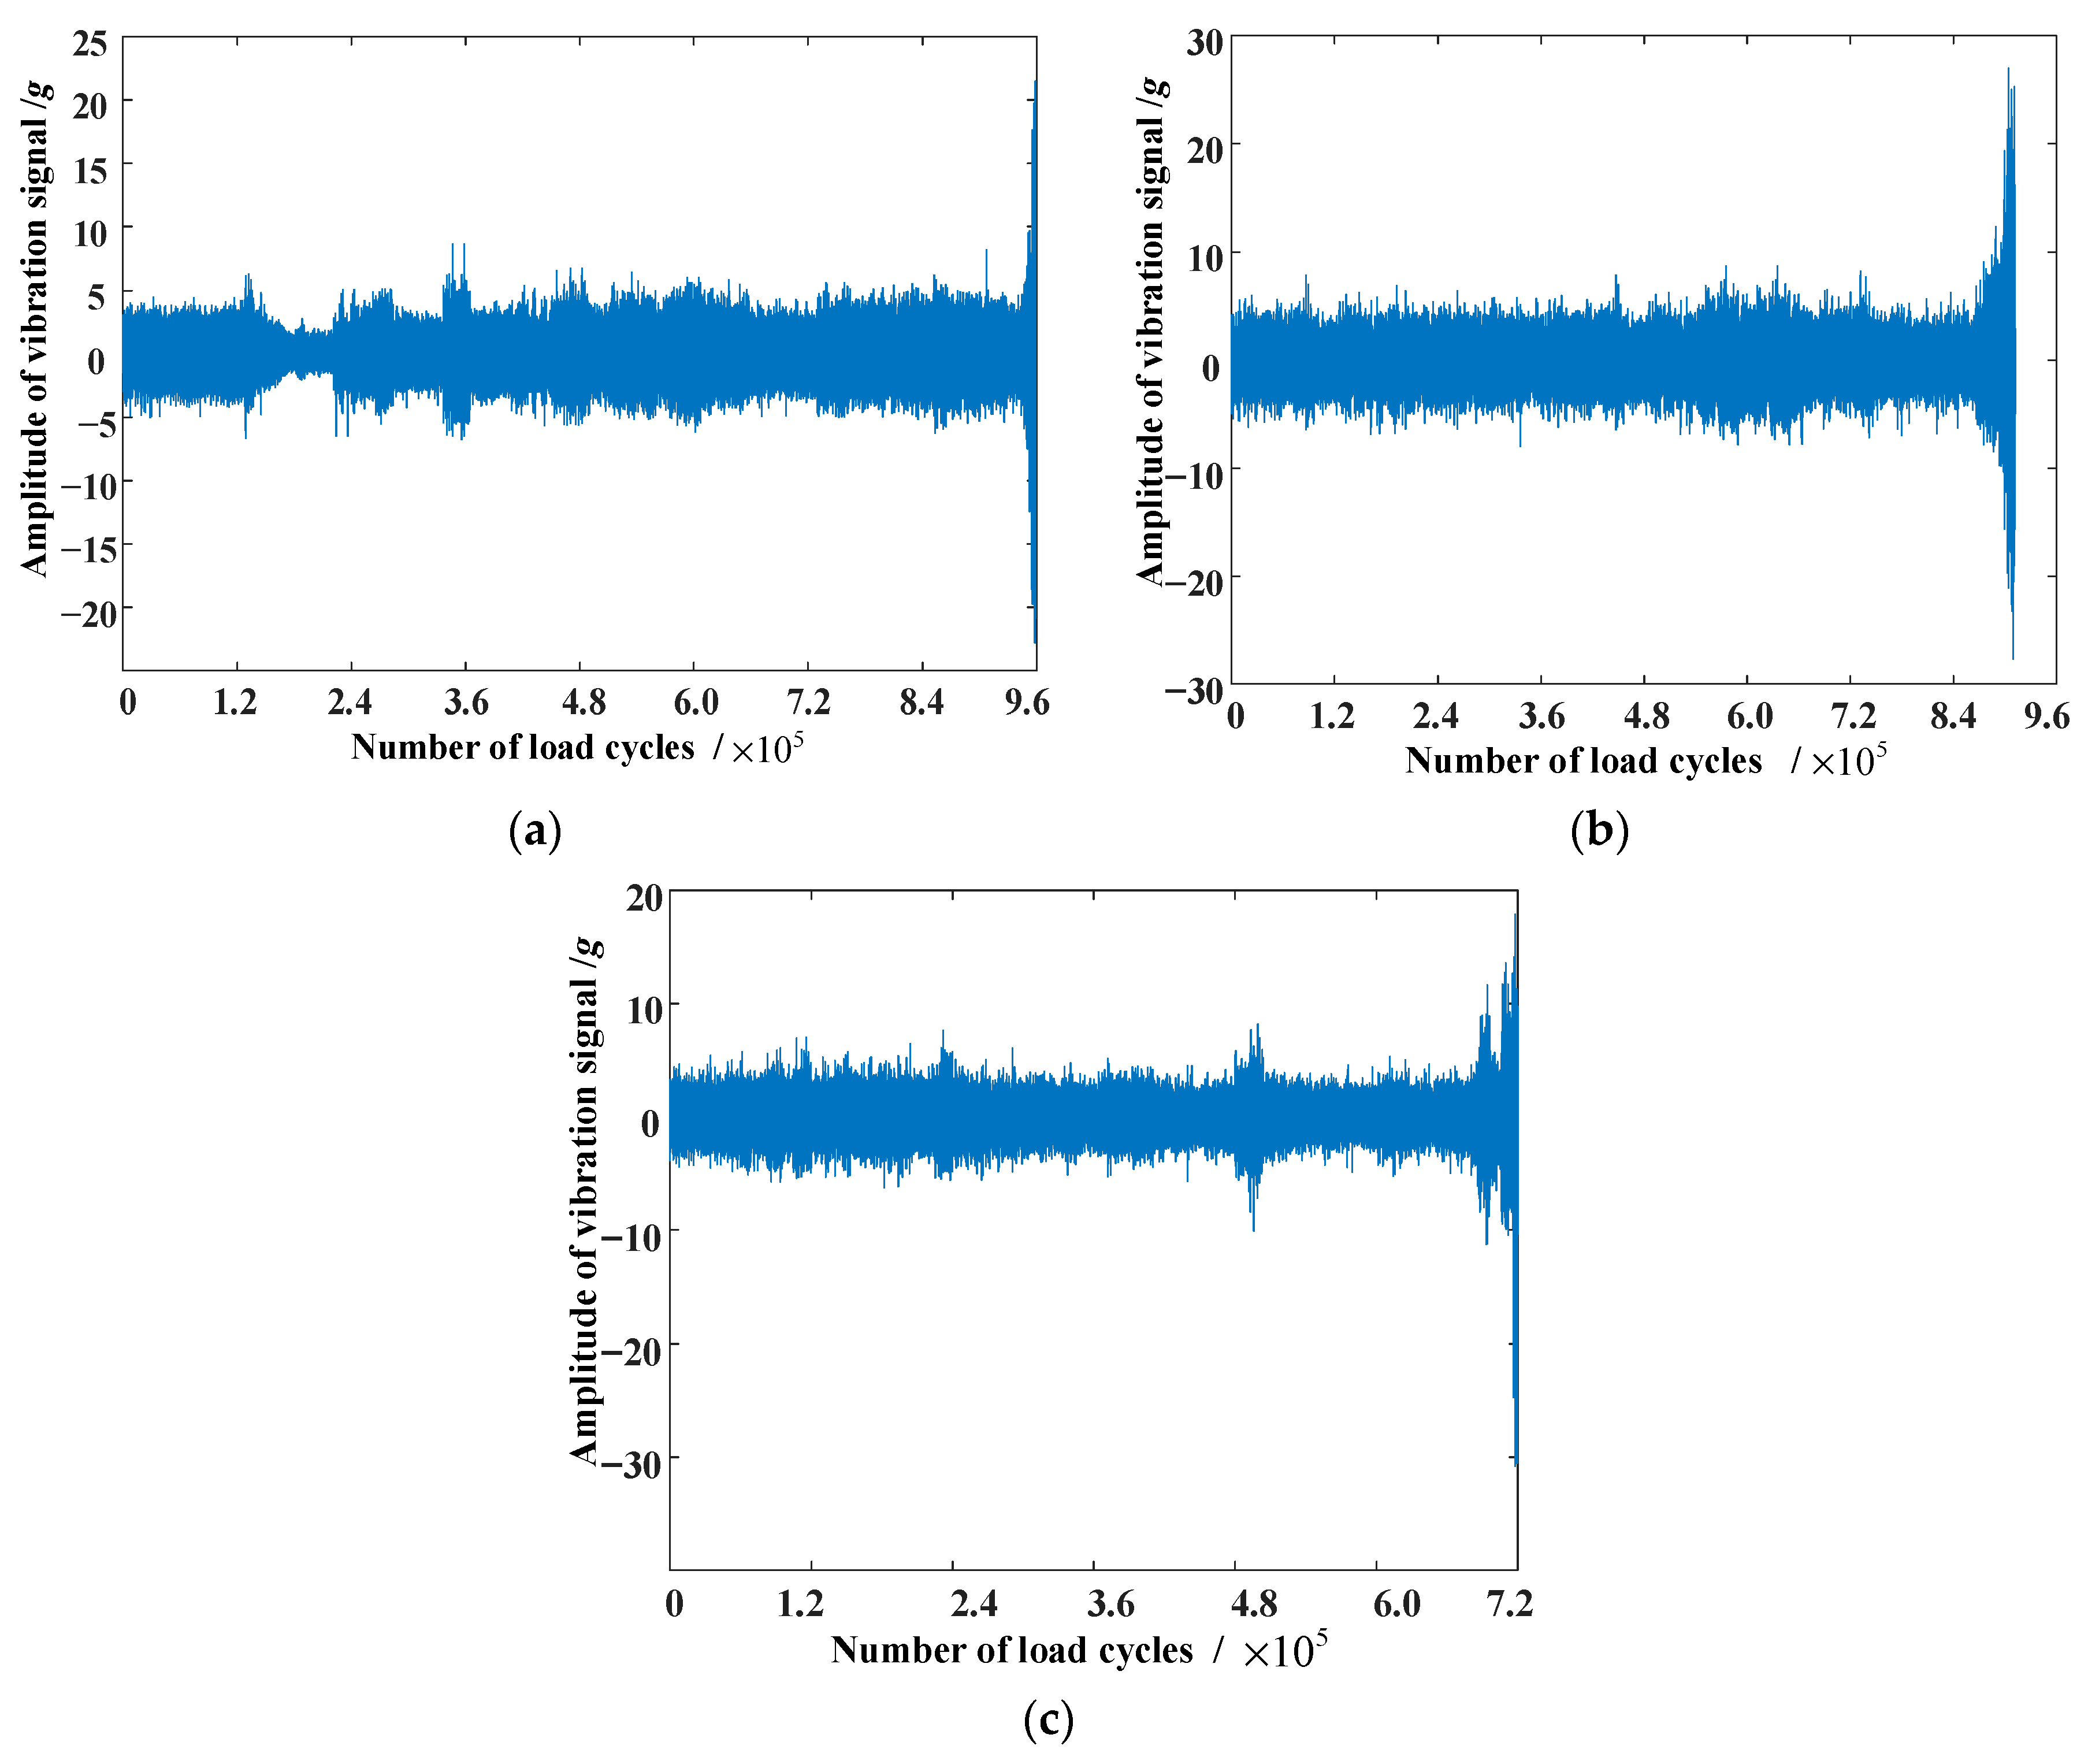
Three HD ALTs were conducted under 2000 rpm, 100 Nm. The time history of vibration signal is shown in Figure 6. During HD operation, all three samples exhibited minor localized fluctuations in their vibration signals during the initial and mid-operation phases. In the later operation phase, after fatigue cracks initiated in the HD samples, the vibration signal amplitude increased rapidly with crack propagation until it ultimately exceeded 20 g, resulting in life failure. The failure times for the three samples were 8.0 h, 7.6 h, and 6.0 h, corresponding to the number of load cycles of 9.6 × 10⁵, 9.12 × 10⁵, and 7.2 × 10⁵, respectively.
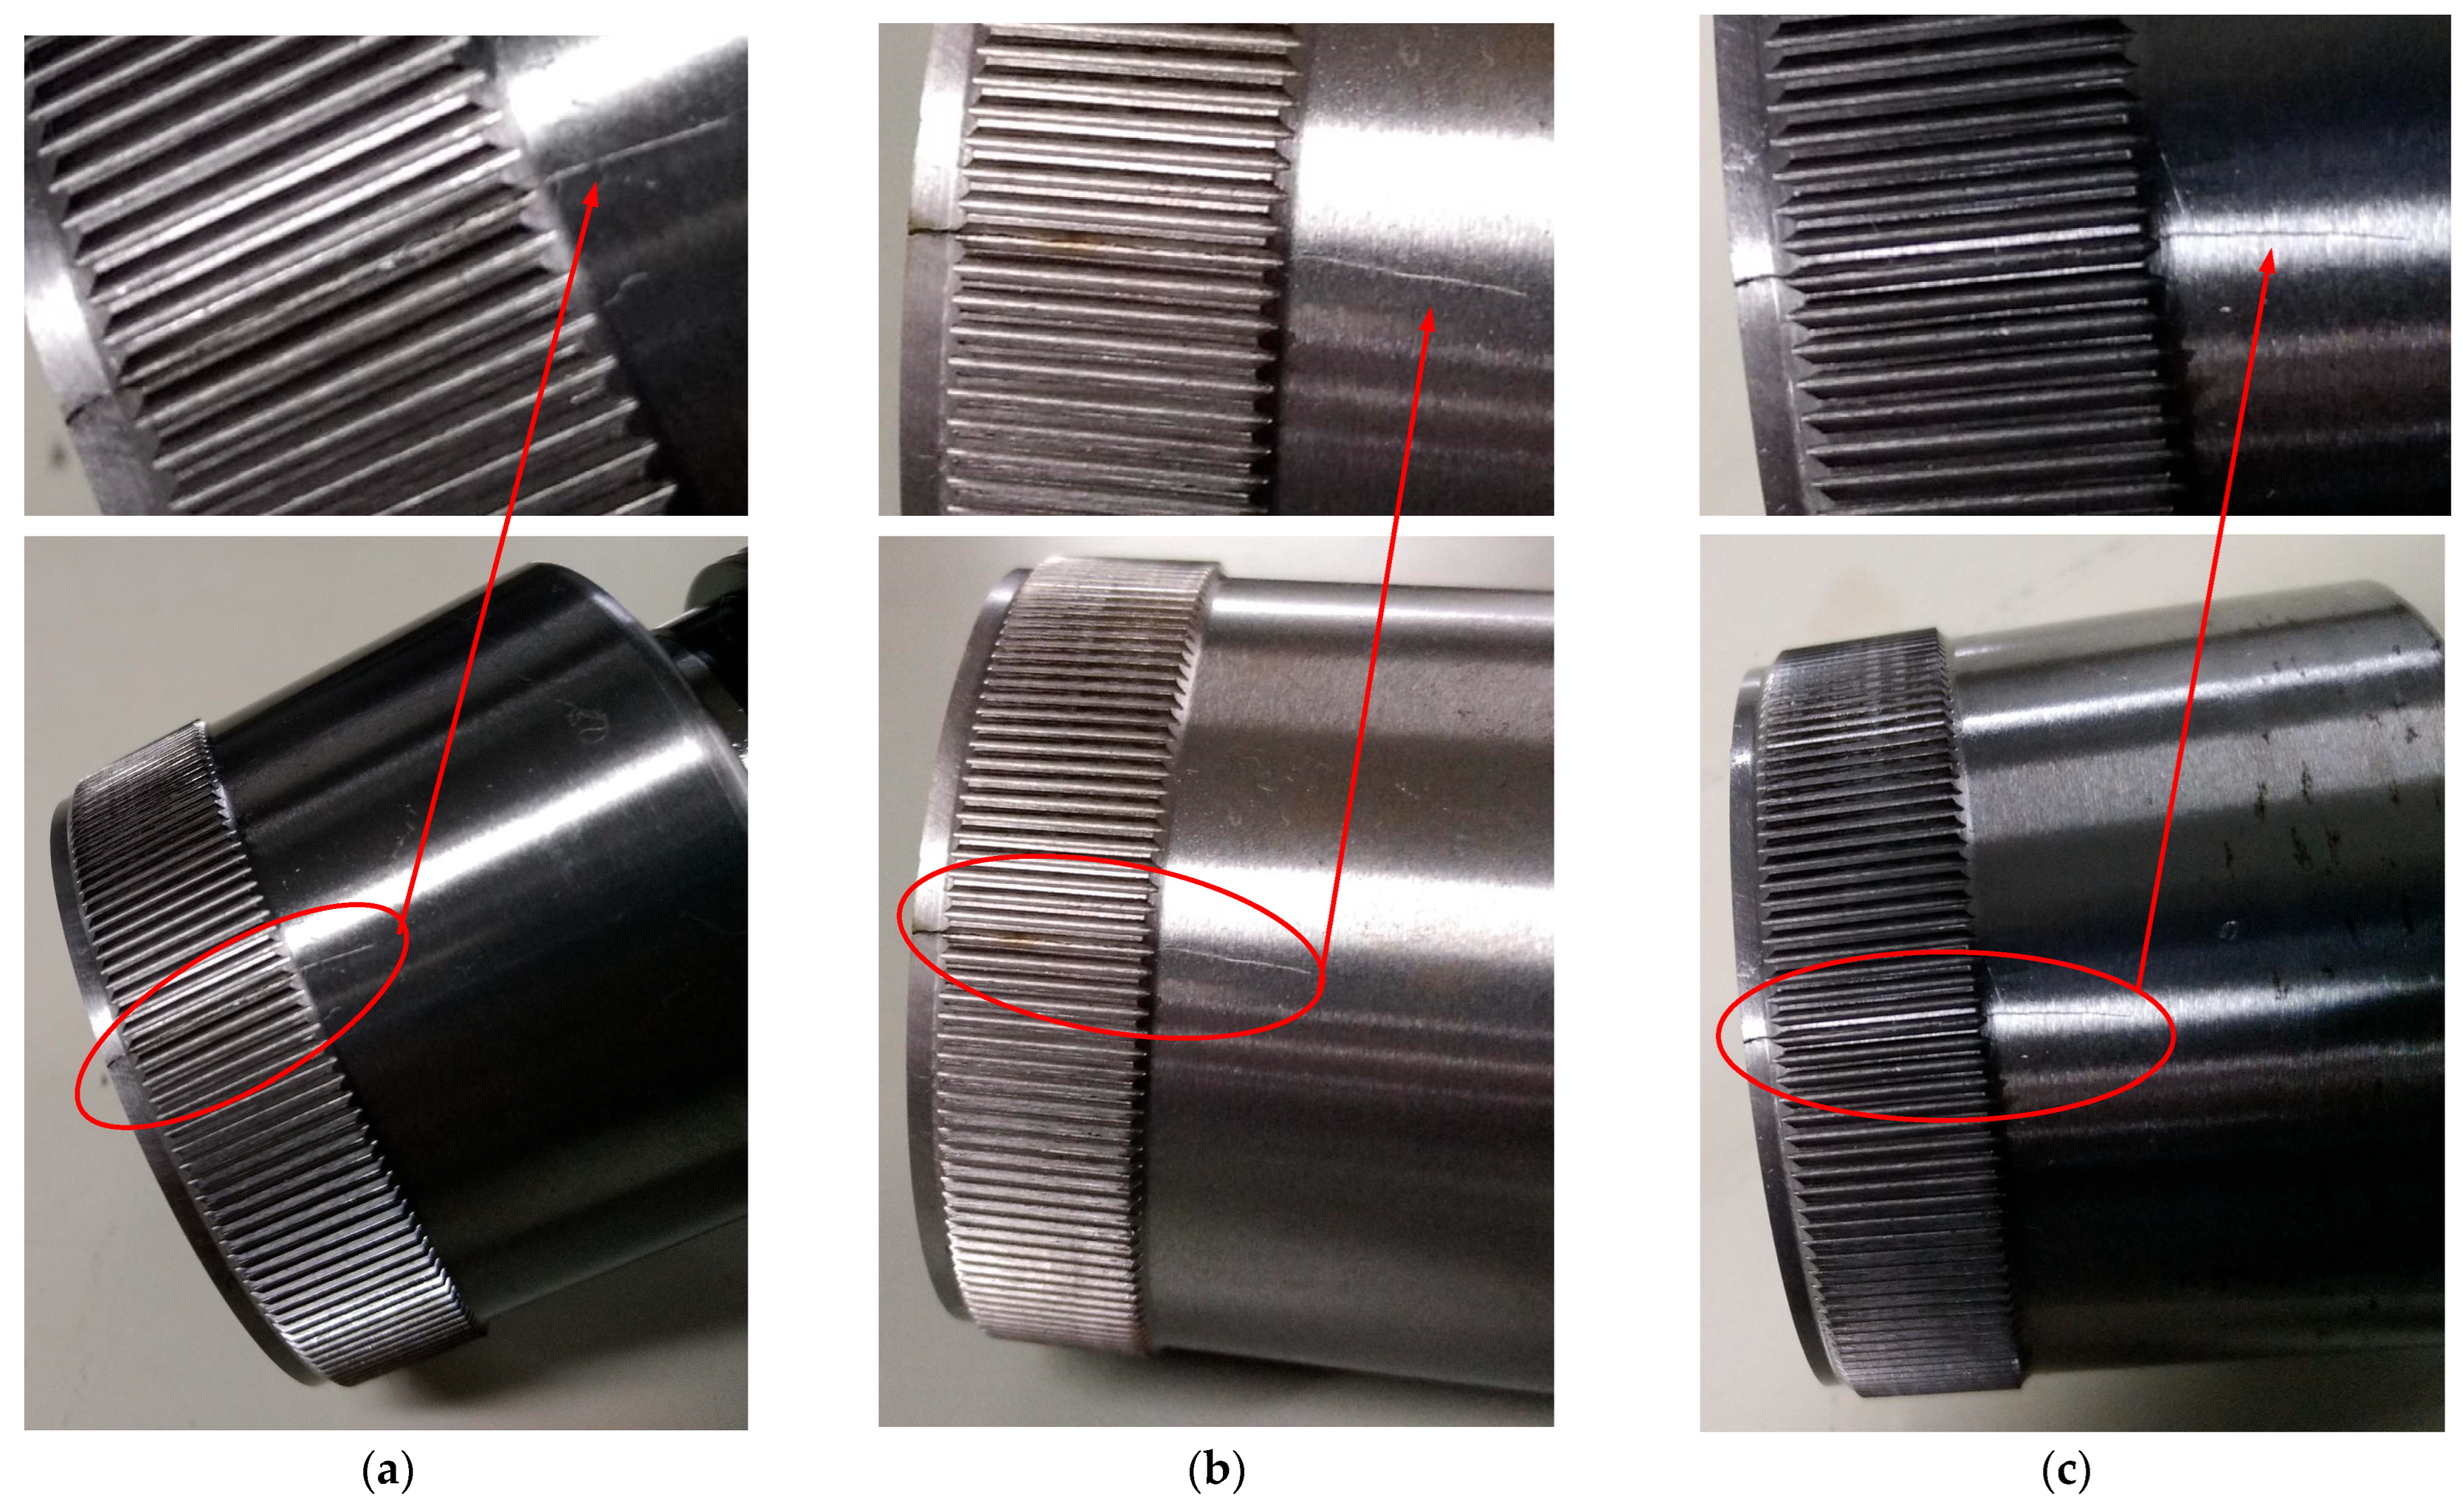
Following the failure of the HD samples, all three samples were disassembled. After ultrasonic cleaning, fatigue cracks were observed at the flexspline gear ring of each HD, as illustrated in Figure 7. HD can operate normally prior to fatigue failure; when the applied stress exceeds the material strength, fatigue cracks initiate and propagate continuously, leading to escalating vibration and noise. Ultimately, the HD experiences seizure and loses its ability to transmit motion normally. And this failure pattern is also defined as strength failure of the HD.
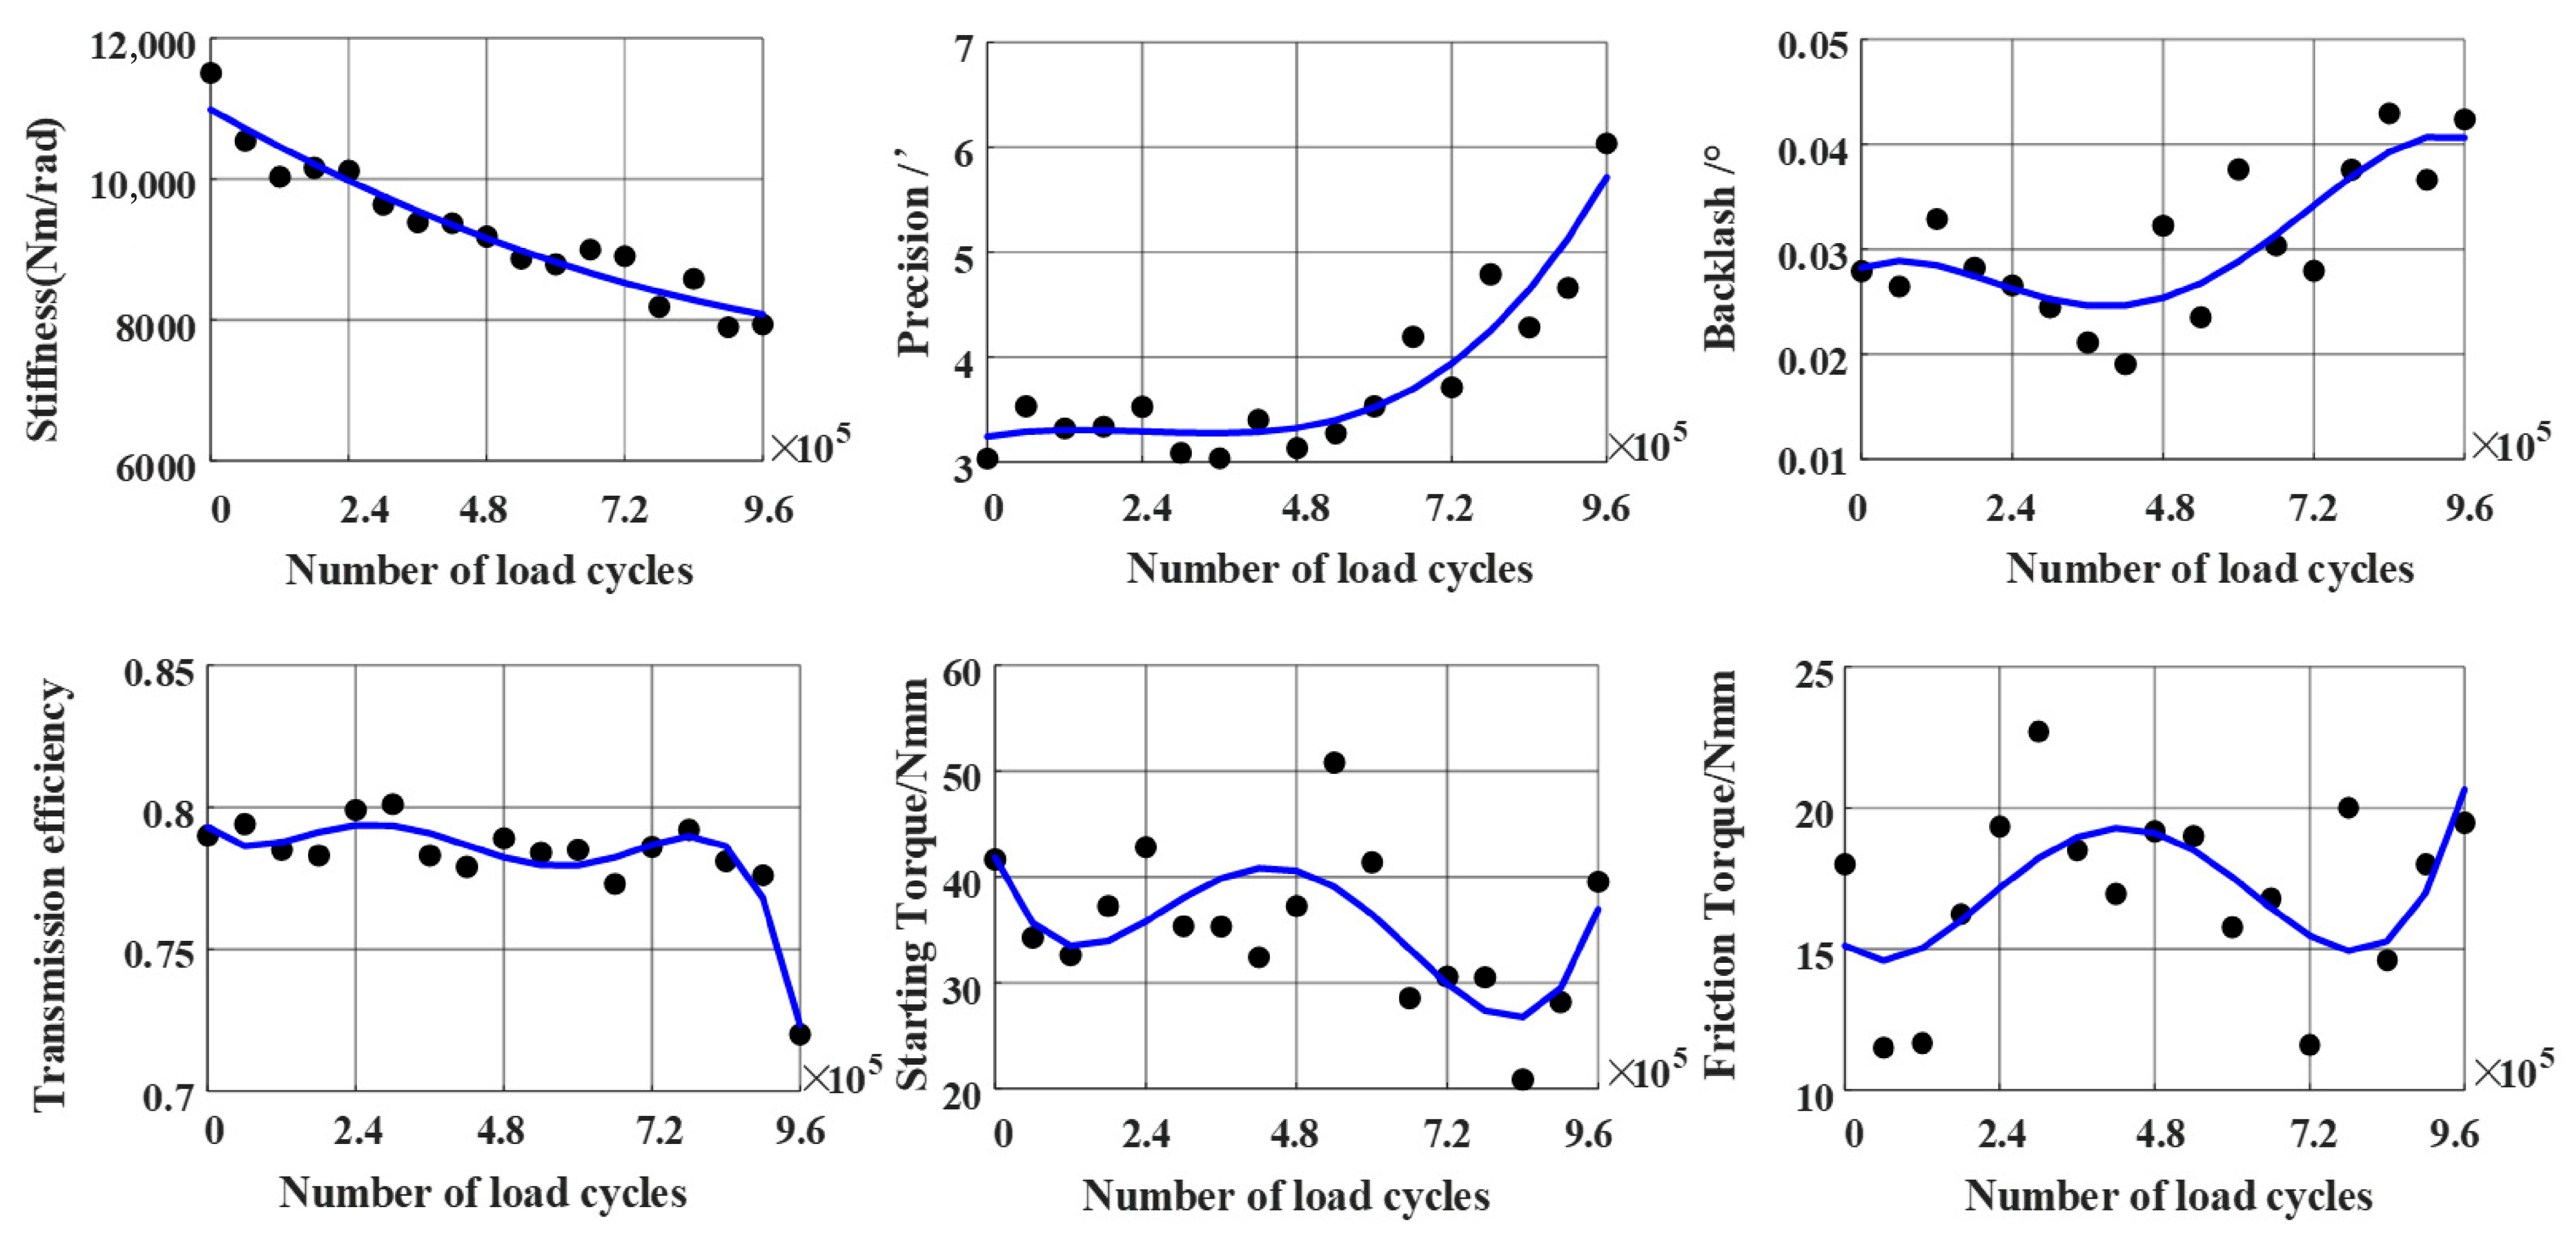
In accordance with the HD ALT protocol, not only were life tests conducted on three samples under a 100 Nm accelerated condition, but performance indicators of the test samples—including stiffness, precision, backlash, transmission efficiency, starting torque, and friction torque—were also tested throughout the life test process. The performance degradation data for the three samples are presented in Figure 8, Figure 9, and Figure 10, respectively. The test data is represented by black dots, and the blue curve shows the result of polynomial regression.
Figure 8, Figure 9 and Figure 10 reveal the following degradation trends across the six HD performance indicators over runtime: Precision consistently degraded. Stiffness consistently decreased. Both exhibited significant degradation trends across all three samples. Backlash displayed an overall degradation trend but with significant fluctuations. Friction torque and starting torque showed no discernible degradation trend, remaining predominantly in a fluctuating state. Transmission efficiency fluctuated throughout the lifespan, showing a slight degradation trend; it experienced a noticeable decline after strength failure of the sample, though it did not fall below 50%.

4.2. Two-Stress Step-Down ALT Results Under 100–75 Nm

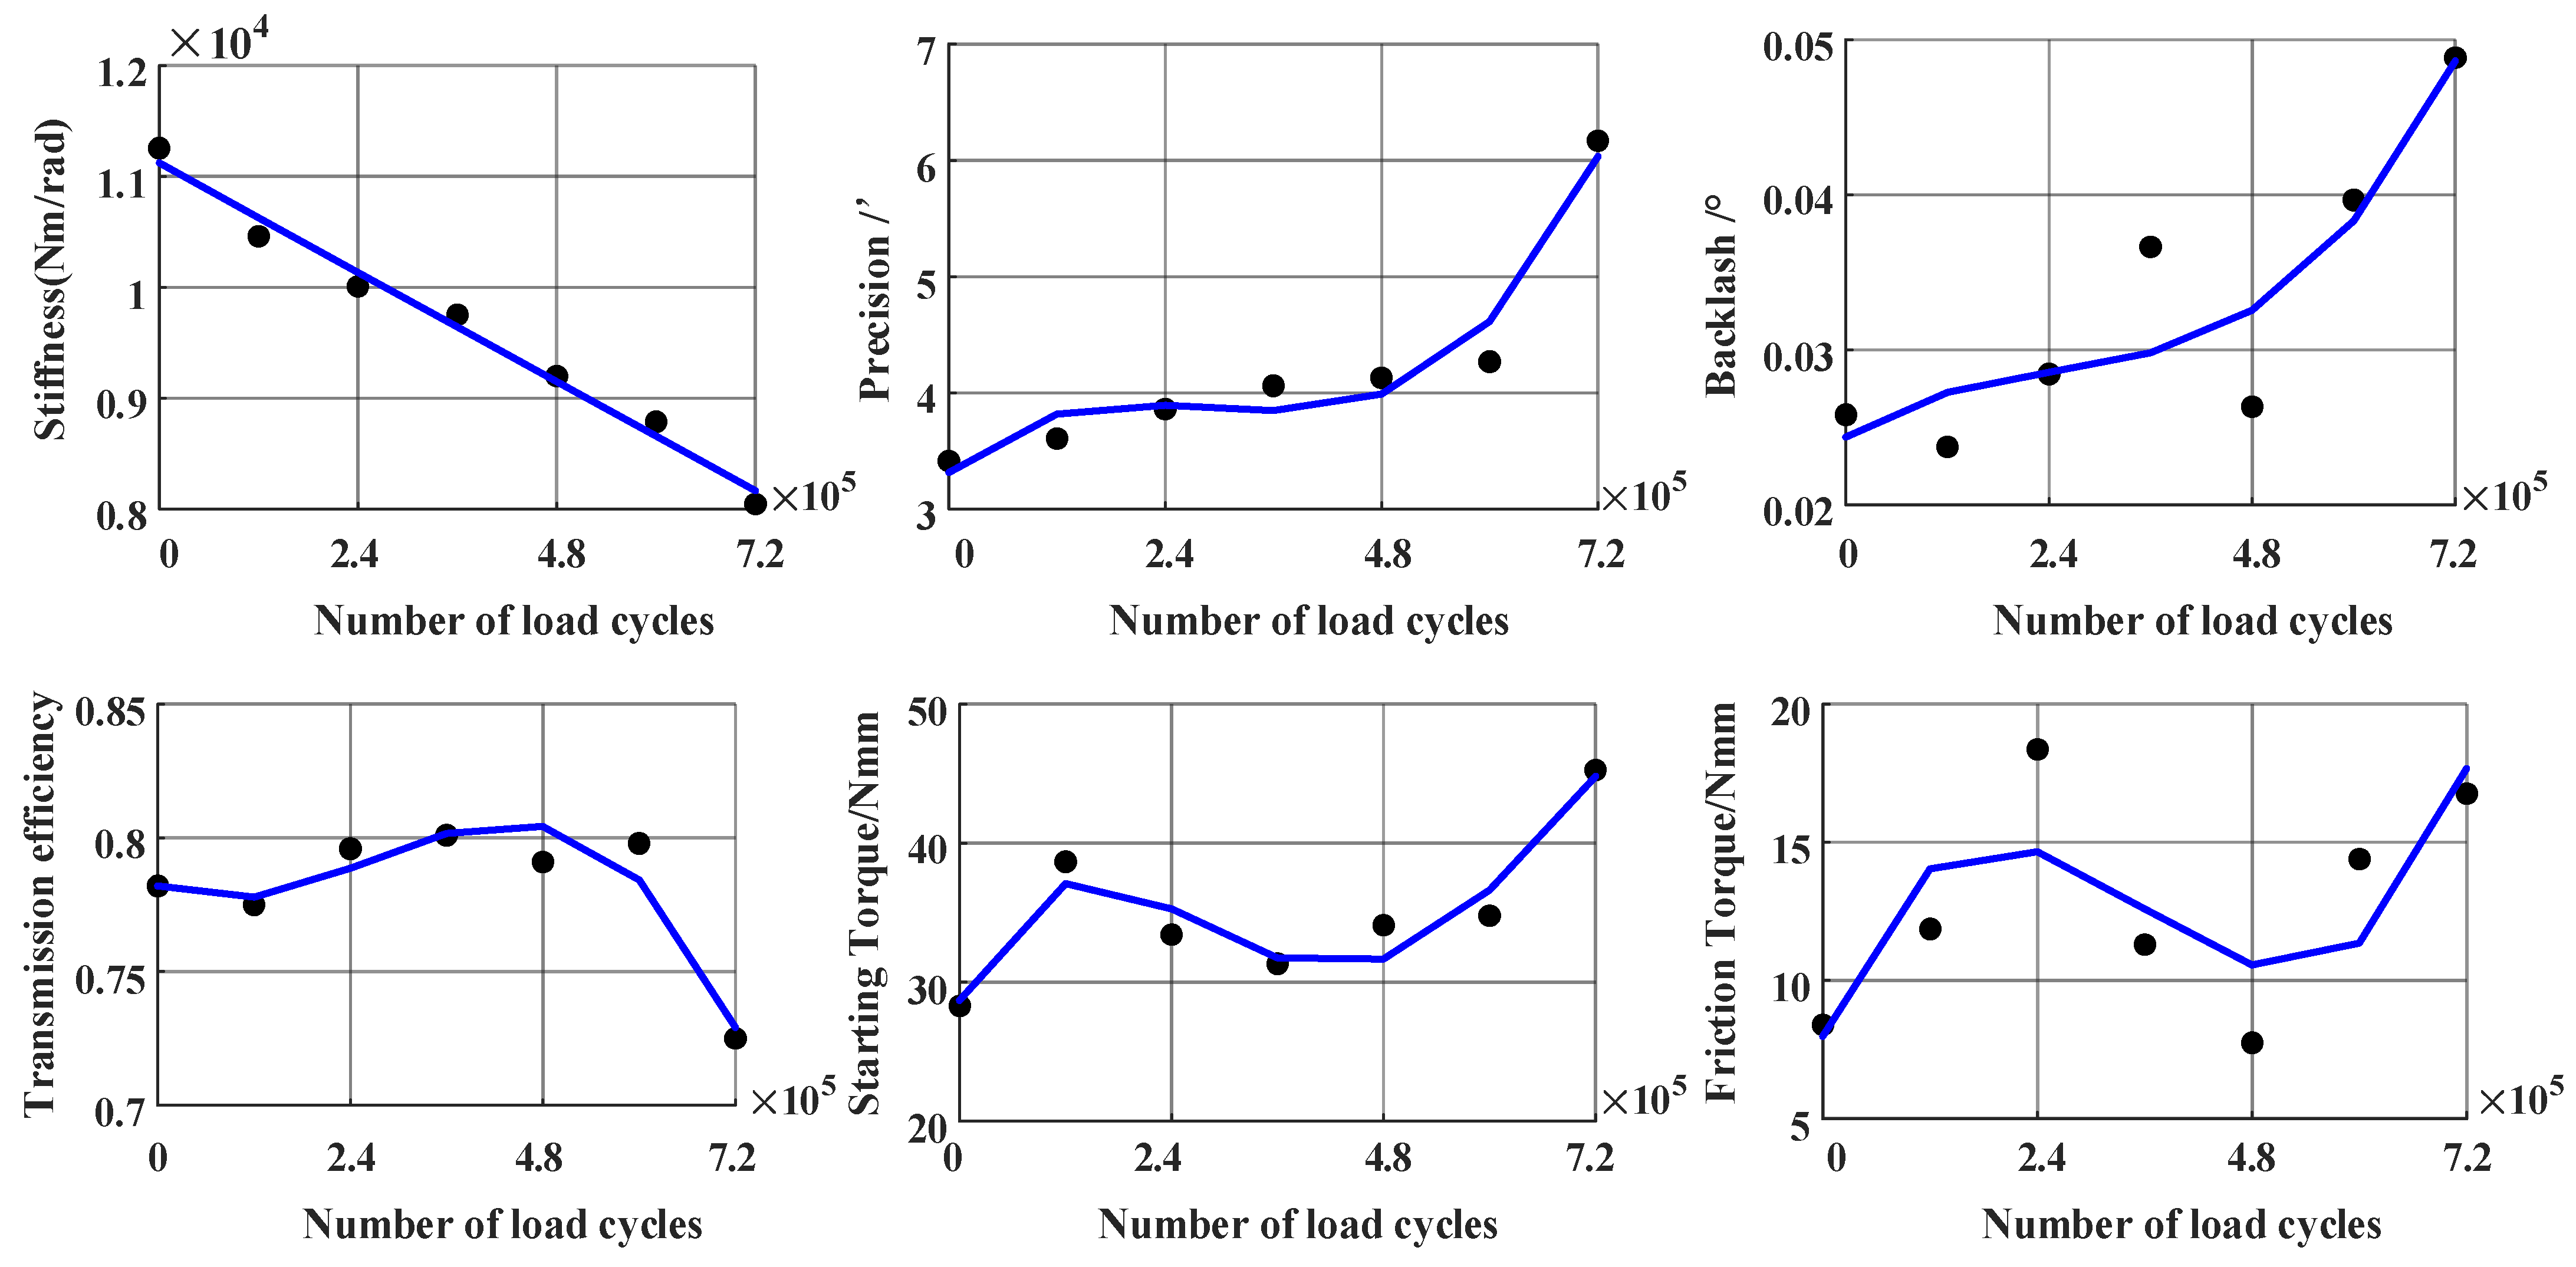
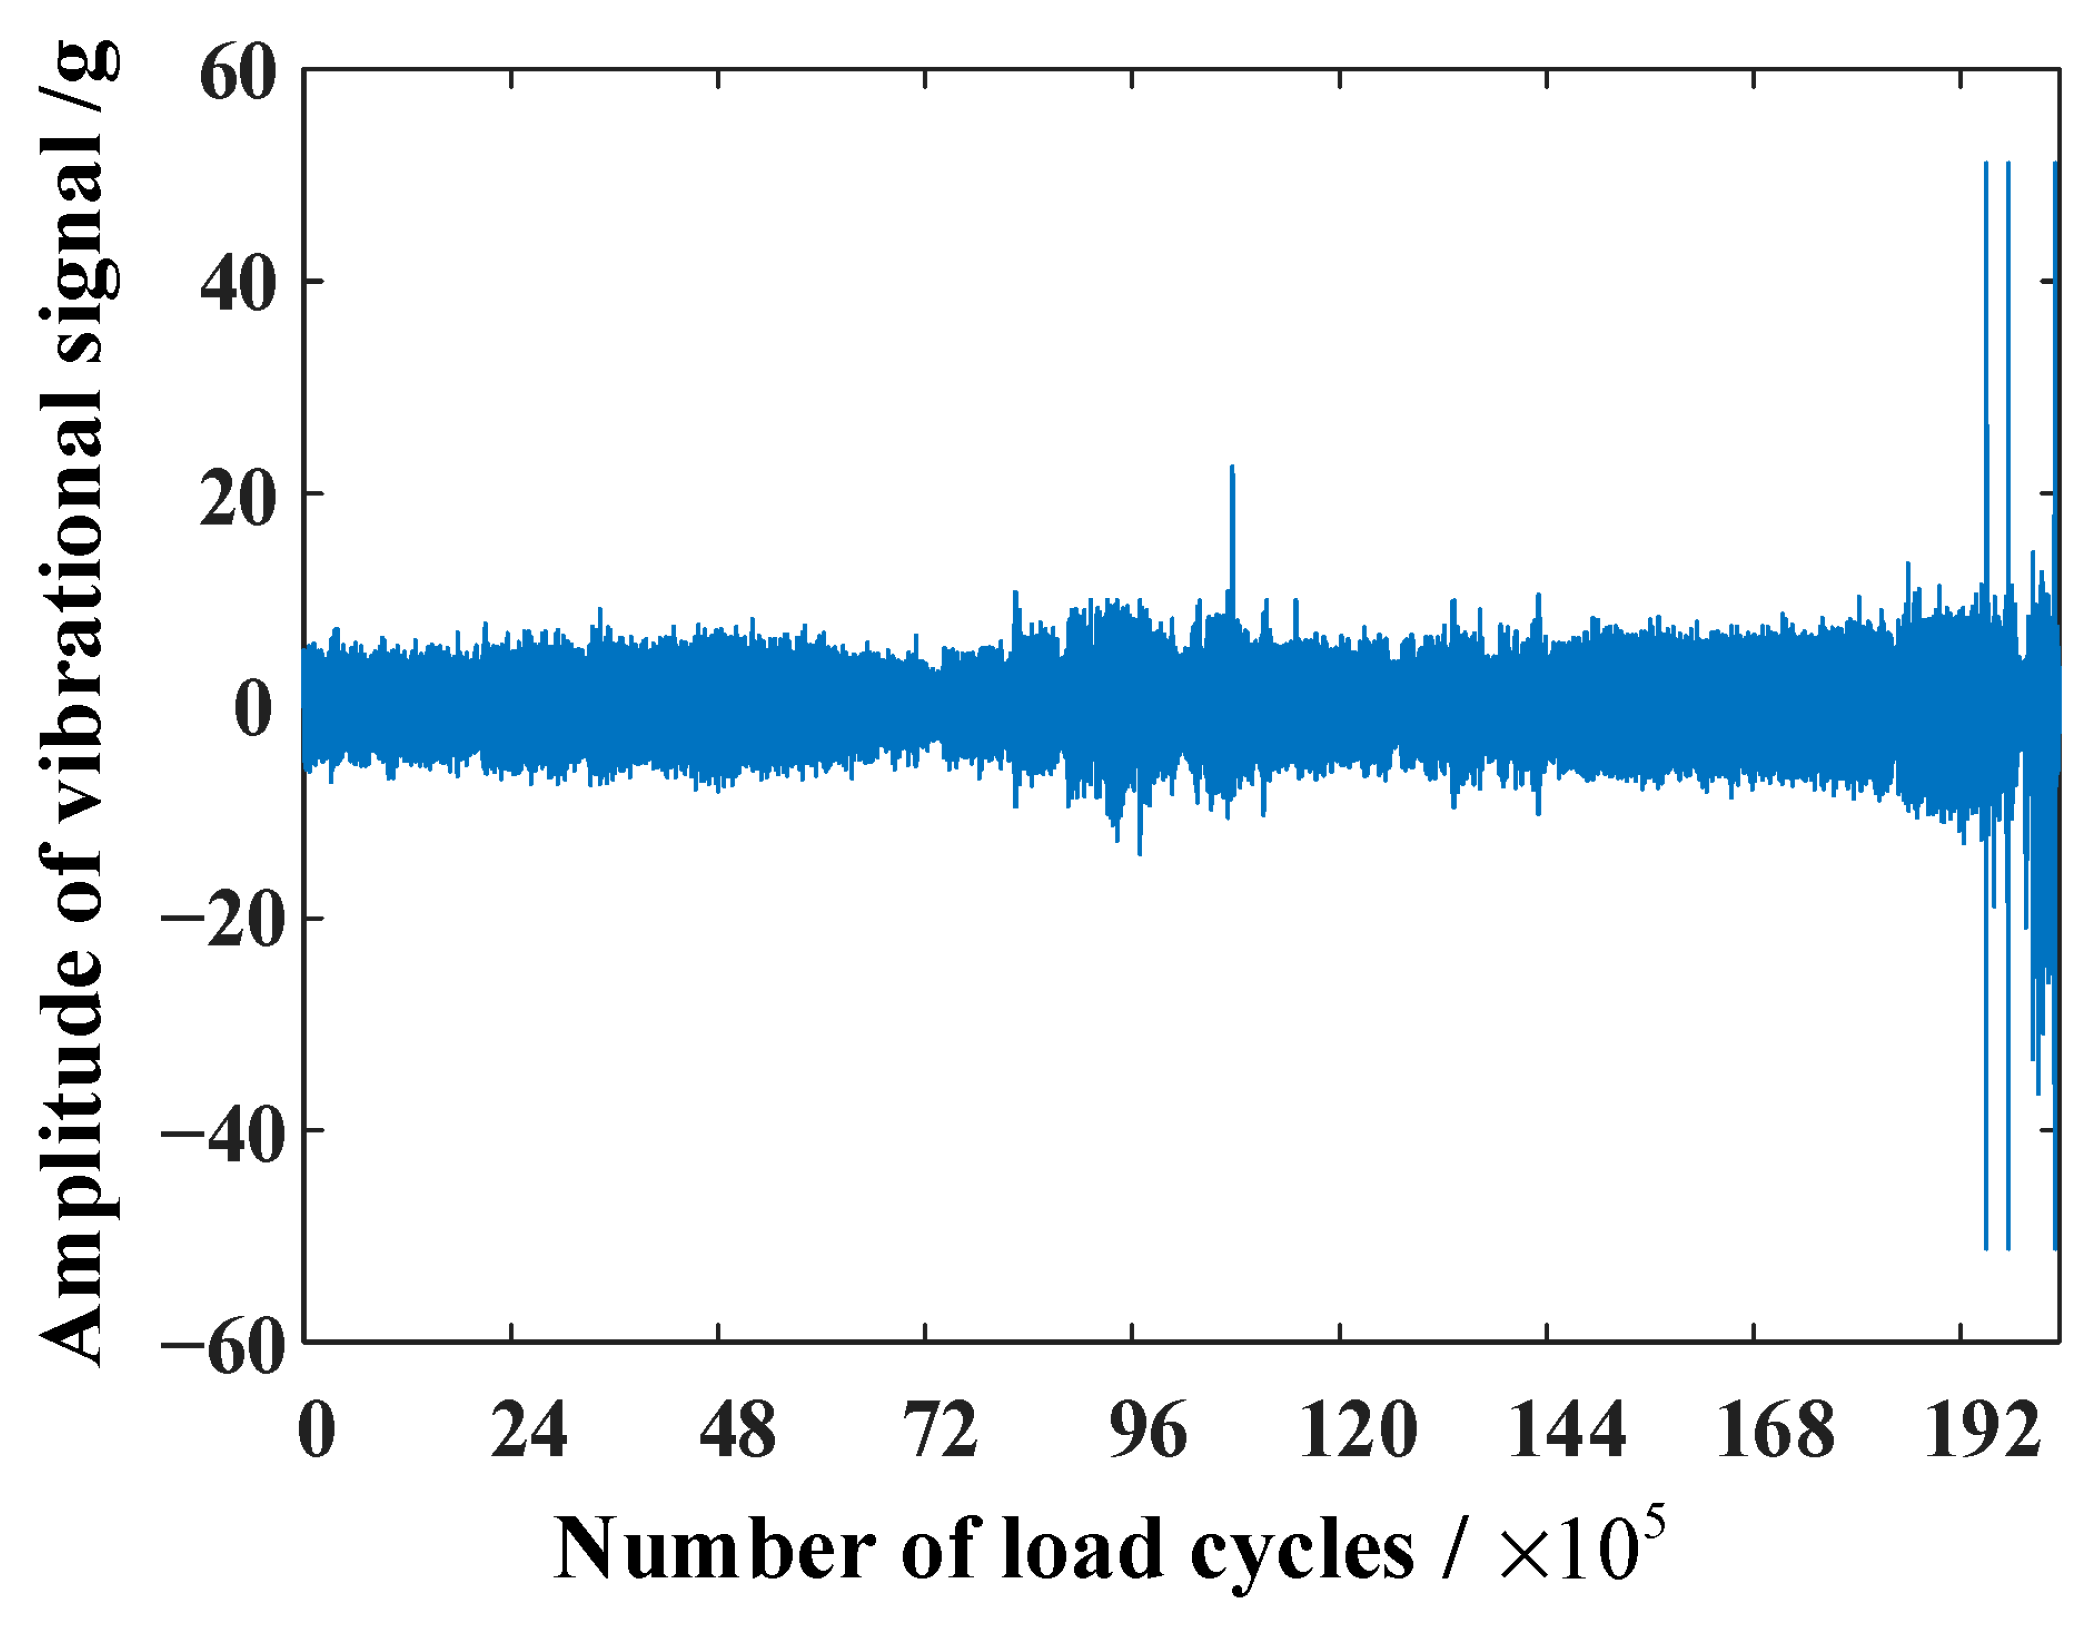
A two-level step-down ALT (denoted as ALTSD1) was conducted on one sample under 100–75 Nm loading. The test protocol involved the following: operation at 100 Nm for 2 h, followed by stepping down to 75 Nm, and continued operation until failure. The time history of the vibration signal for this sample is shown in Figure 11. Due to the accidental detachment of the accelerometer from the measurement point during the test, vibration signal acquisition was interrupted. Consequently, the signal amplitude approaches zero near the 2 h (the number of load cycles is 2.4 × 10⁵) and 6.5 h (the number of load cycles is 7.8 × 10⁵) marks. Excluding these two time points, the vibration signal remained relatively stable until fluctuations began around the 7 h (the number of load cycles 8.4 × 10⁵) mark. Subsequently, fatigue crack initiation caused the vibration signal amplitude to increase continuously until it exceeded 20 g, resulting in strength failure at 8.33 h (the number of load cycles is 9.996 × 10⁵). An image of the failed sample is presented in Figure 12. The performance degradation data for this sample during ALTSD1 are shown in Figure 13, and the blue curve shows the result of polynomial regression.
As shown in Figure 13, the performance degradation curves of the HD sample under the two-level step-down ALD are largely consistent with the patterns observed in the three samples tested at 100 Nm. Notably, the fluctuation in precision increased compared to the previous cases. Furthermore, the degradation trend of the sample’s stiffness under the two-level step-down accelerated condition clearly reveals that the degradation rate during the 100 Nm accelerated phase was significantly higher than that during the 75 Nm phase. Similar patterns, though less pronounced, were observed in the changes in precision and backlash.

4.3. Three-Stress Step-Down ALT Results Under 100–75–50 Nm

A three-level step-down ALT (denoted as ALTSD2) was conducted on one sample under 100–75–50 Nm. The testing protocol comprised the following: operation at 100 Nm for 2 h, stepped down to 75 Nm for 2 h, and finally stepped down to 50 Nm for continued operation until failure. The vibration signal time history during this sample’s ALT is presented in Figure 14. Firstly, the vibration signal remained largely stable, followed by a slight gradual increase. After 40 h (the number of load cycles is 4.8 × 10⁶), it began to decrease gradually, then increased again after 60 h (the number of load cycles is 7.2 × 10⁶). Around 80 h (the number of load cycles is 9.6 × 10⁶), localized high-amplitude fluctuations and isolated spikes appeared. Subsequently, the signal stabilized with minor fluctuations until approximately 120 h (the number of load cycles is 1.44 × 10⁷), when it commenced a steady, slow increase. After 162.5 h (the number of load cycles is 1.95 × 10⁷), two spikes exceeding 20 g occurred. Finally, beyond 166.9 h (the number of load cycles is approximately 2 × 10⁷), the vibration signal amplitude remained consistently above 20 g, resulting in strength failure at 166.9 h (the number of load cycles is approximately 2 × 10⁷). An image of the failed sample is shown in Figure 15, revealing a distinct fatigue crack at the gear ring on the inner wall of the HD flexspline. The performance degradation data for this sample during ALTSD2 are shown in Figure 16, and the blue curve shows the result of polynomial regression.
As shown in Figure 16, the performance degradation curves of the HD sample under the three-stress step-down accelerated condition are largely consistent with the patterns observed in the previously tested samples under 100 Nm and the two-stress step-down accelerated condition. Notable differences exist in two aspects. One is transmission efficiency change. In the three-stress step-down ALT, the sample’s transmission efficiency slowly decreased and stabilized with reduced fluctuation prior to strength failure. Following strength failure, it declined rapidly. Notably, the transmission efficiency of this three-stress step-down ALT sample even dropped to approximately 30% after strength failure. The other is backlash change. The backlash evolution for the three-stress step-down ALT sample initially aligned with that of previous samples. However, during the third stress level (50 Nm), the growth trend of the sample’s backlash gradually decelerated over runtime, eventually approaching saturation.

5. Results Analysis

5.1. Performance Degradation Failure Mechanism Analysis

Based on the performance degradation curves of the HD under the 100 Nm accelerated condition (Figure 8, Figure 9 and Figure 10), 100–75 Nm two-stress step-down ALT (Figure 13), and 100–75–50 Nm three-stress step-down ALT (Figure 16), comparative analysis reveals the following degradation laws. Overall, transmission stiffness continuously decreased throughout the life tests, exhibiting a linear degradation trend. The stiffness degradation rate varied across different operating conditions, being higher under high accelerated stress conditions than under lower ones. Precision and backlash continuously increased, showing nonlinear trends. Backlash exhibited significant fluctuations. Transmission efficiency fluctuated during the life tests, displaying a slight degradation trend, and experienced a marked decline after strength failure of the test sample. Starting torque and friction torque showed no discernible degradation trend, remaining predominantly in a persistent fluctuation state.
The aforementioned performance degradation laws primarily stem from two underlying reasons: wear and fatigue damage. During the HD life test, prolonged operation inevitably induces different degrees of wear at contact interfaces, particularly the FS/CS (Flexspline/Circular Spline) and FS/WG (Flexspline/Wave Generator) pairs. Accumulated wear at the FS/WG interface reduces the flexspline deformation and tooth engagement depth. Wear at the FS/CS interface directly increases circumferential backlash between CS and FS teeth. The combined effect elevates transmission error (manifesting as precision degradation) and increases backlash during performance test. Furthermore, increased backlash diminishes the HD meshing zone, reduces the number of engaged tooth pairs, and decreases meshing stiffness. This cascade effect contributes to the progressive decline in overall transmission stiffness.
Additionally, materials in components like the flexspline inevitably undergo fatigue damage during operation, initiating micro-cracks. Under operational loads, these cracks propagate, further reducing transmission stiffness. Friction torque and starting torque are predominantly influenced by lubrication conditions at internal contact pairs. Since all life tests were conducted in atmospheric environments—unlike space applications where lubrication failure occurs—these torques exhibited fluctuating behavior without significant degradation trends.
Transmission efficiency correlates with frictional losses at contact interfaces. The absence of severe lubrication failure (characteristic of space environments) meant that before fatigue crack initiation, efficiency showed a slight decreasing trend due to increasing interfacial wear. After crack initiation, power transmission from input to output shafts encountered obstruction, causing power loss and efficiency decline. This decline became pronounced as cracks propagated, culminating in a significant drop upon final fatigue fracture of the flexspline.

5.2. Mechanism Consistency Analysis of HD Performance Degradation Failure

Ensuring invariant failure mechanisms under accelerated conditions is a fundamental prerequisite for conducting accelerated life tests. Consistency in the failure mechanisms of accelerated life tests signifies that the product’s failure modes under accelerated conditions are identical to those under normal operating conditions. When setting the maximum accelerated stress level (torque) for HDs, it must be ensured that the failure mechanism remains unchanged at this stress level. To validate the appropriateness of the accelerated life tests performed in this study, the consistency of HD failure mechanisms under the applied stress levels needs to be investigated. This study employs the Consistency of Degradation Trajectory Shapes method [27] to verify failure mechanism consistency in the HD accelerated life tests.

5.2.1. Degradation Trajectory and Accelerated Factor

As established in Reference [28], the acceleration factor is a constant independent of product reliability, which can serve as a basis for verifying the consistency of failure mechanisms across different stress levels. Let the degradation trajectory of a product be denoted by g(t); the mean performance value at time t is then expressed as x = g(t). In performance degradation-based accelerated test, the acceleration factor can be equivalently defined as follows: For a product exhibiting the same degradation increment d under different stress levels Ei and Ej, the acceleration factor of stress level Ei relative to Ej is the ratio of the degradation time td,j at stress level Ej to the degradation time td,i at stress level Ei. If this acceleration factor is a constant independent of reliability, it can be proven that the failure mechanisms are consistent across the two stress levels. When the product’s degradation follows a linear function, i.e.:
g t = α t + β
where α is the rate of linear degradation trajectory and β is the initial performance value. For HD under different stress levels, the initial stiffness performance values exhibit only random inter-individual variation and are independent of the applied accelerated stress level during testing. Consequently, the initial value can be considered equal across all stress levels. The acceleration factor can thus be simplified as follows:
K i j = d β / α j d β / α i = α i α j
where α j and α i are the gradient of performance degradation trajectories under different stress level, and they are constants. Consequently, provided that the degradation trajectory models under both normal and accelerated stress levels are linear, it can be demonstrated that the acceleration factor is a constant independent of reliability, and the failure mechanism remains unchanged.
When the product’s degradation follows a nonlinear function, such as exponential degradation, the product performance satisfies the following relationship:
z t = a e b t + c
where a and b are parameters of performance degradation models and c is the initial performance value. For HDs under different stress levels, the initial precision performance value c exhibits only random inter-individual variation and is independent of the applied accelerated stress level during testing. Therefore, the initial value c can be considered equal across all stress levels. The acceleration factor can thus be simplified to the following:
K i j = b i b j ln ( d c ) ln a j ln ( d c ) ln a i
where ai, aj, bi, and bj are parameters of the exponential precision degradation model, and they are constants. Consequently, provided that the model parameters satisfy ai = aj, it can be demonstrated that the acceleration factor remains invariant with respect to changes in the degradation increment d, constituting a reliability-independent constant. This confirms the failure mechanism remains unchanged.

5.2.2. Verification of Failure Mechanism Consistency

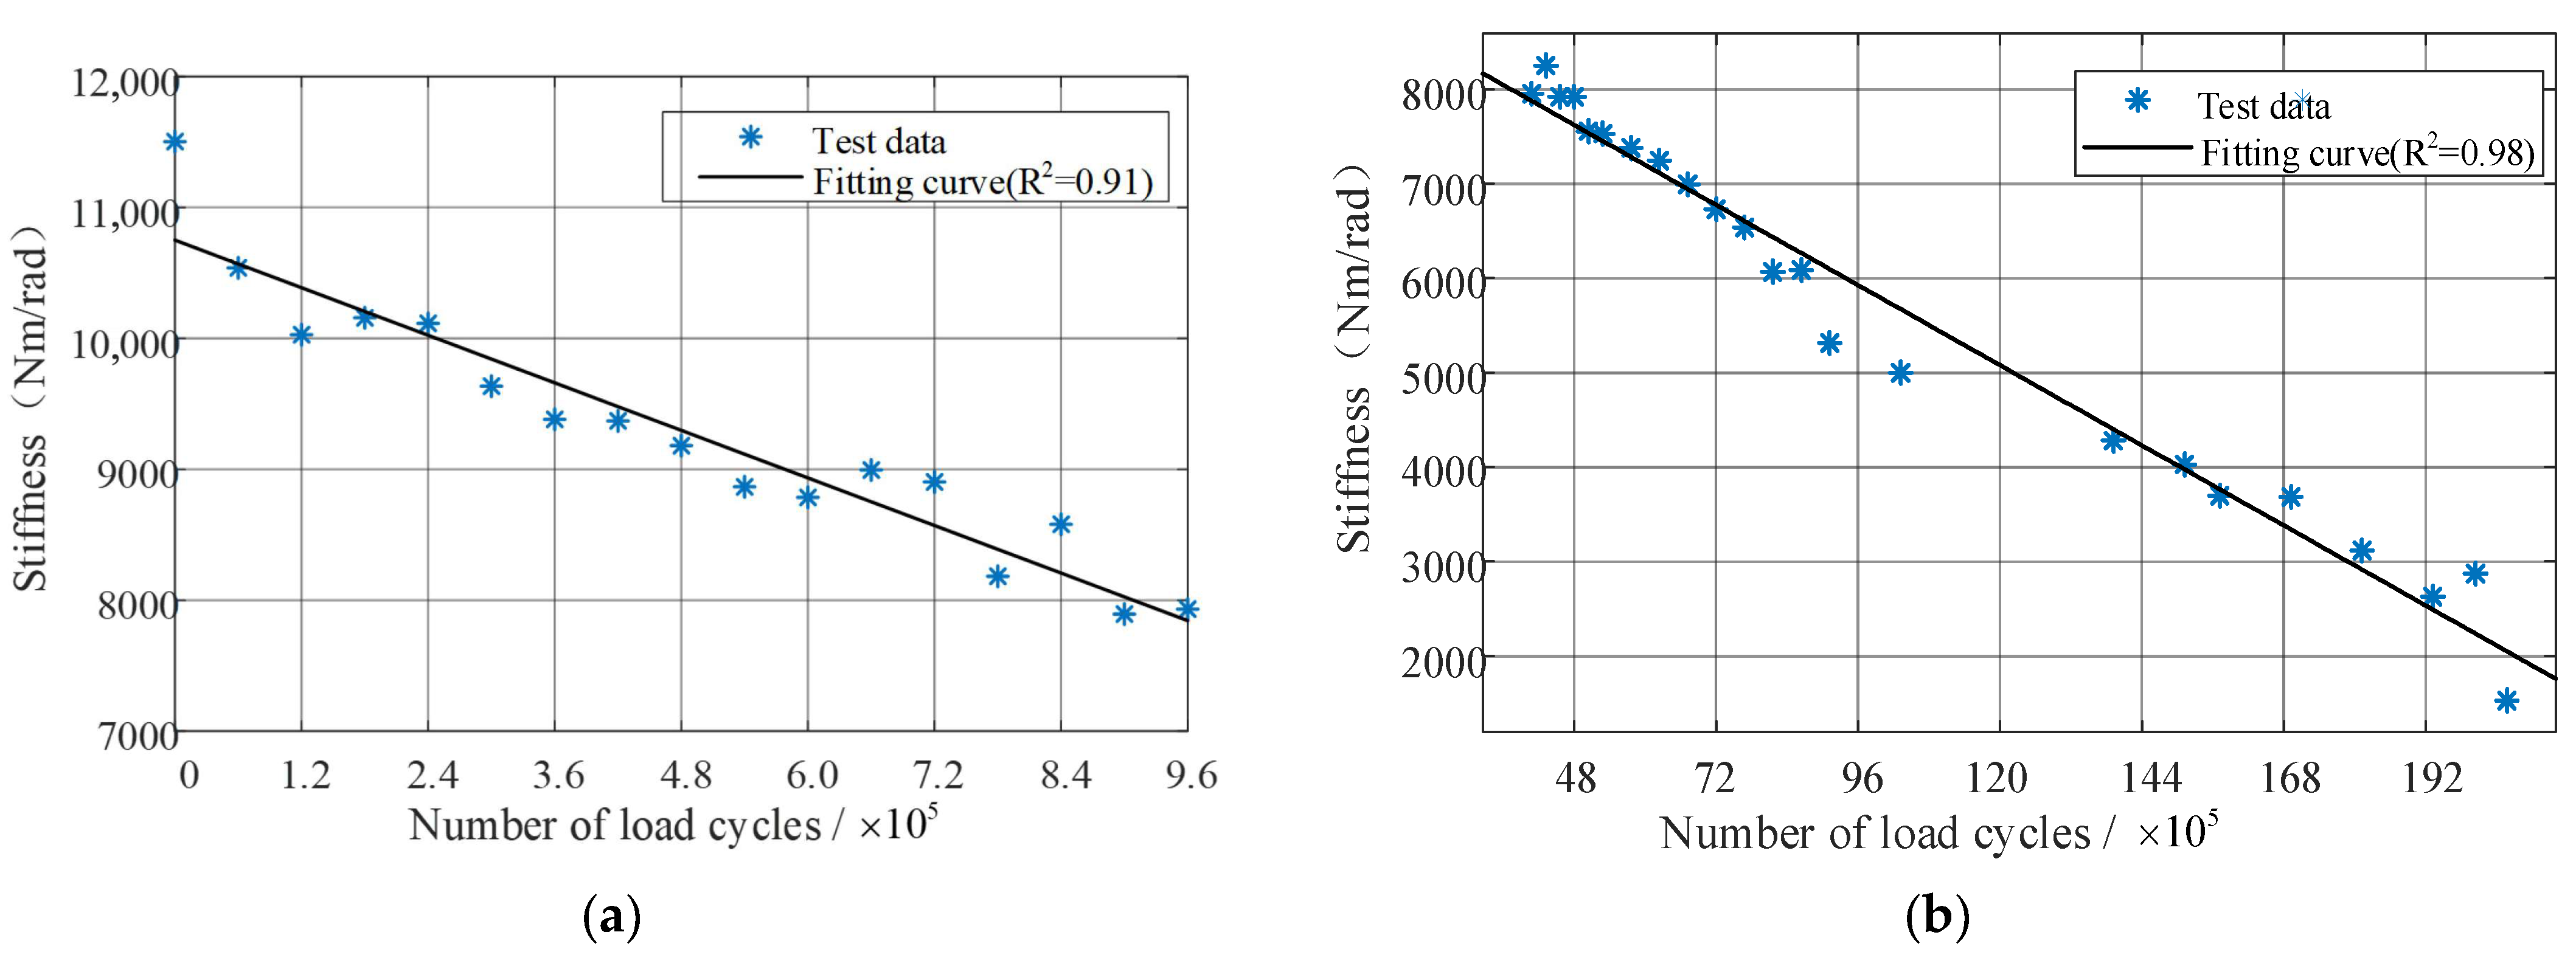
The accelerated stress for HD ALT was the output loading torque; the maximum loading torque is 100 Nm and the loading torque under rated condition is 50 Nm. Based on the step-down ALT and performance degradation test data presented earlier, the stiffness performance degradation curves of HD under the constant 100 Nm ALT and during the 50 Nm phase of the 100–75–50 Nm three-stress step-down ALT (ALTSD2) are shown in Figure 17.
Figure 17 demonstrates that during HD life test, stiffness degradation approximates linear behavior. Furthermore, the stiffness degradation rate under high accelerated stress (100 Nm) exceeds that under lower stress levels. Linear regression was applied to the stiffness degradation curves of two HD samples under high-stress (100 Nm) and normal-stress (50 Nm) torque loading, with fitting results displayed in Figure 17a,b, respectively. The figures confirm that stiffness degradation trajectories under both 100 Nm and 50 Nm can be effectively approximated by linear models, validating the linear degradation assumption. According to Equation (2), the acceleration factor is therefore a reliability-independent constant. This confirms consistent failure mechanisms between 100 Nm and 50 Nm operating conditions.
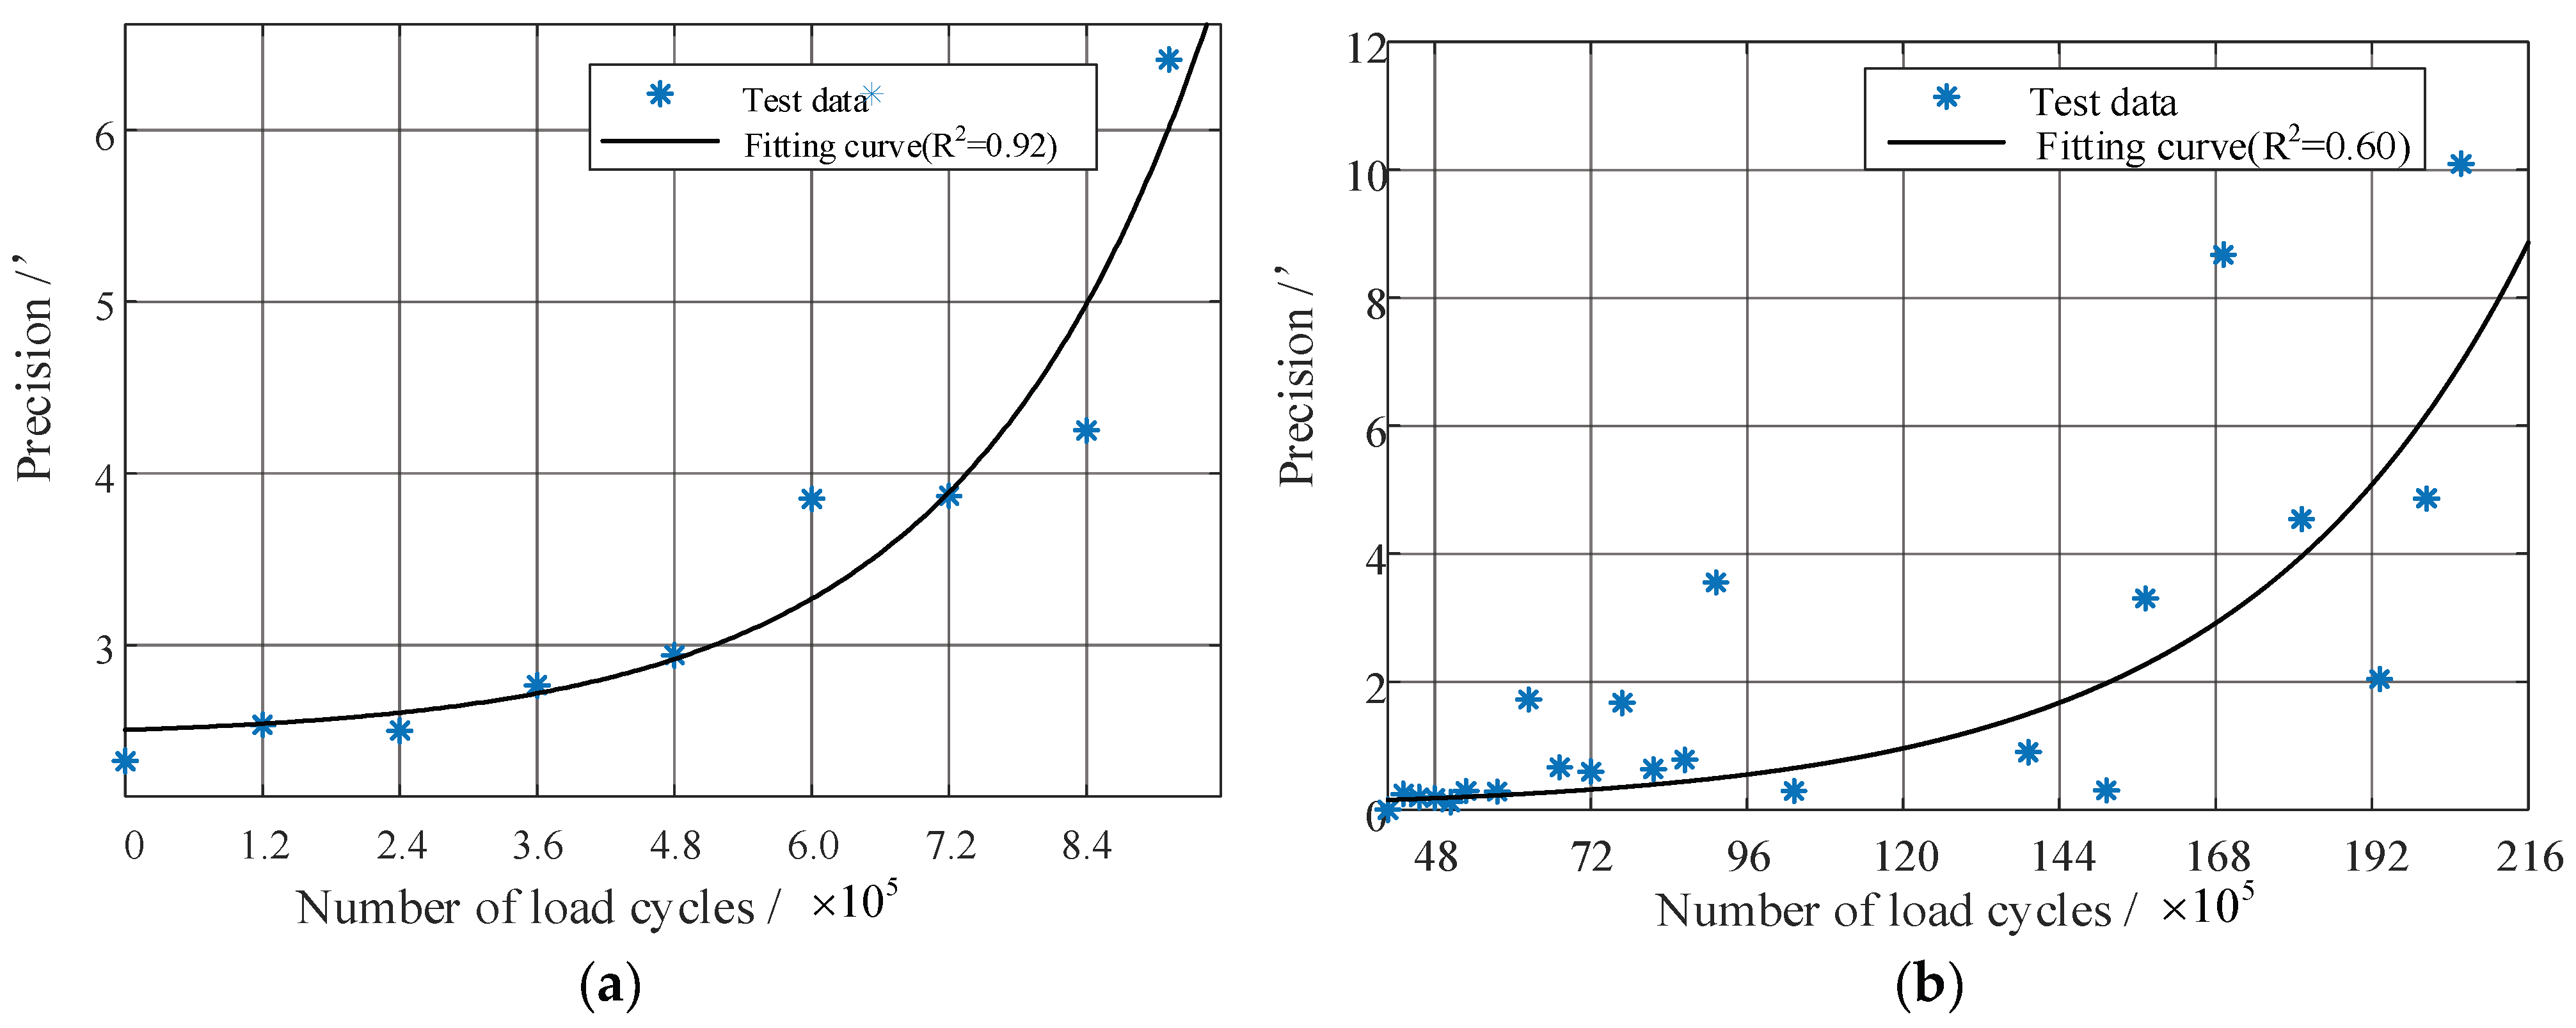
Similarly, precision degradation curves under 100 Nm ALT and during the 50 Nm phase of the 100–75–50 Nm three-stress step-down ALT (ALTSD2) are presented in Figure 18.
Figure 18 demonstrates that precision degradation during HD life test approximates a nonlinear exponential pattern. The exponential model defined in Equation (3) was fitted to the precision degradation trajectories under 100 Nm and 50 Nm, with fitting results shown in Figure 18. The exponential model parameters ai and aj for the two stress levels were determined as 0.0474 and 0.0508, respectively, which can be considered approximately equal. Consequently, according to Equation (4), the acceleration factor remains invariant with respect to degradation increment d, constituting a reliability-independent constant. This confirms consistent failure mechanisms between the 100 Nm and 50 Nm operating conditions.

5.3. Strength Failure Mechanism and Its Consistency Analysis

In atmospheric environments, failure modes of HD include flexspline fatigue failure [29], wave generator bearing fatigue failure [30], and gear tooth wear [31]. Among these, the predominant fatigue failure mode is flexspline fatigue fracture, typically occurring at the transition zone between the flexspline gear ring and cylinder [20,32]. This is intrinsically linked to the HD transmission principle. During HD operation, the wave generator forces the thin-walled flexspline into periodic deformation (with the assembly position near the flexspline gear ring). This enables torque transmission through meshing between flexspline and circular spline teeth. With prolonged operation, cyclic loading induces cumulative fatigue damage in the flexspline material, progressively degrading its strength. When the flexspline’s strength degrades below the applied operational stress, fatigue cracks initiate. Under sustained cyclic loading, these cracks propagate along the flexspline generatrix, ultimately leading to flexspline fatigue fracture failure.
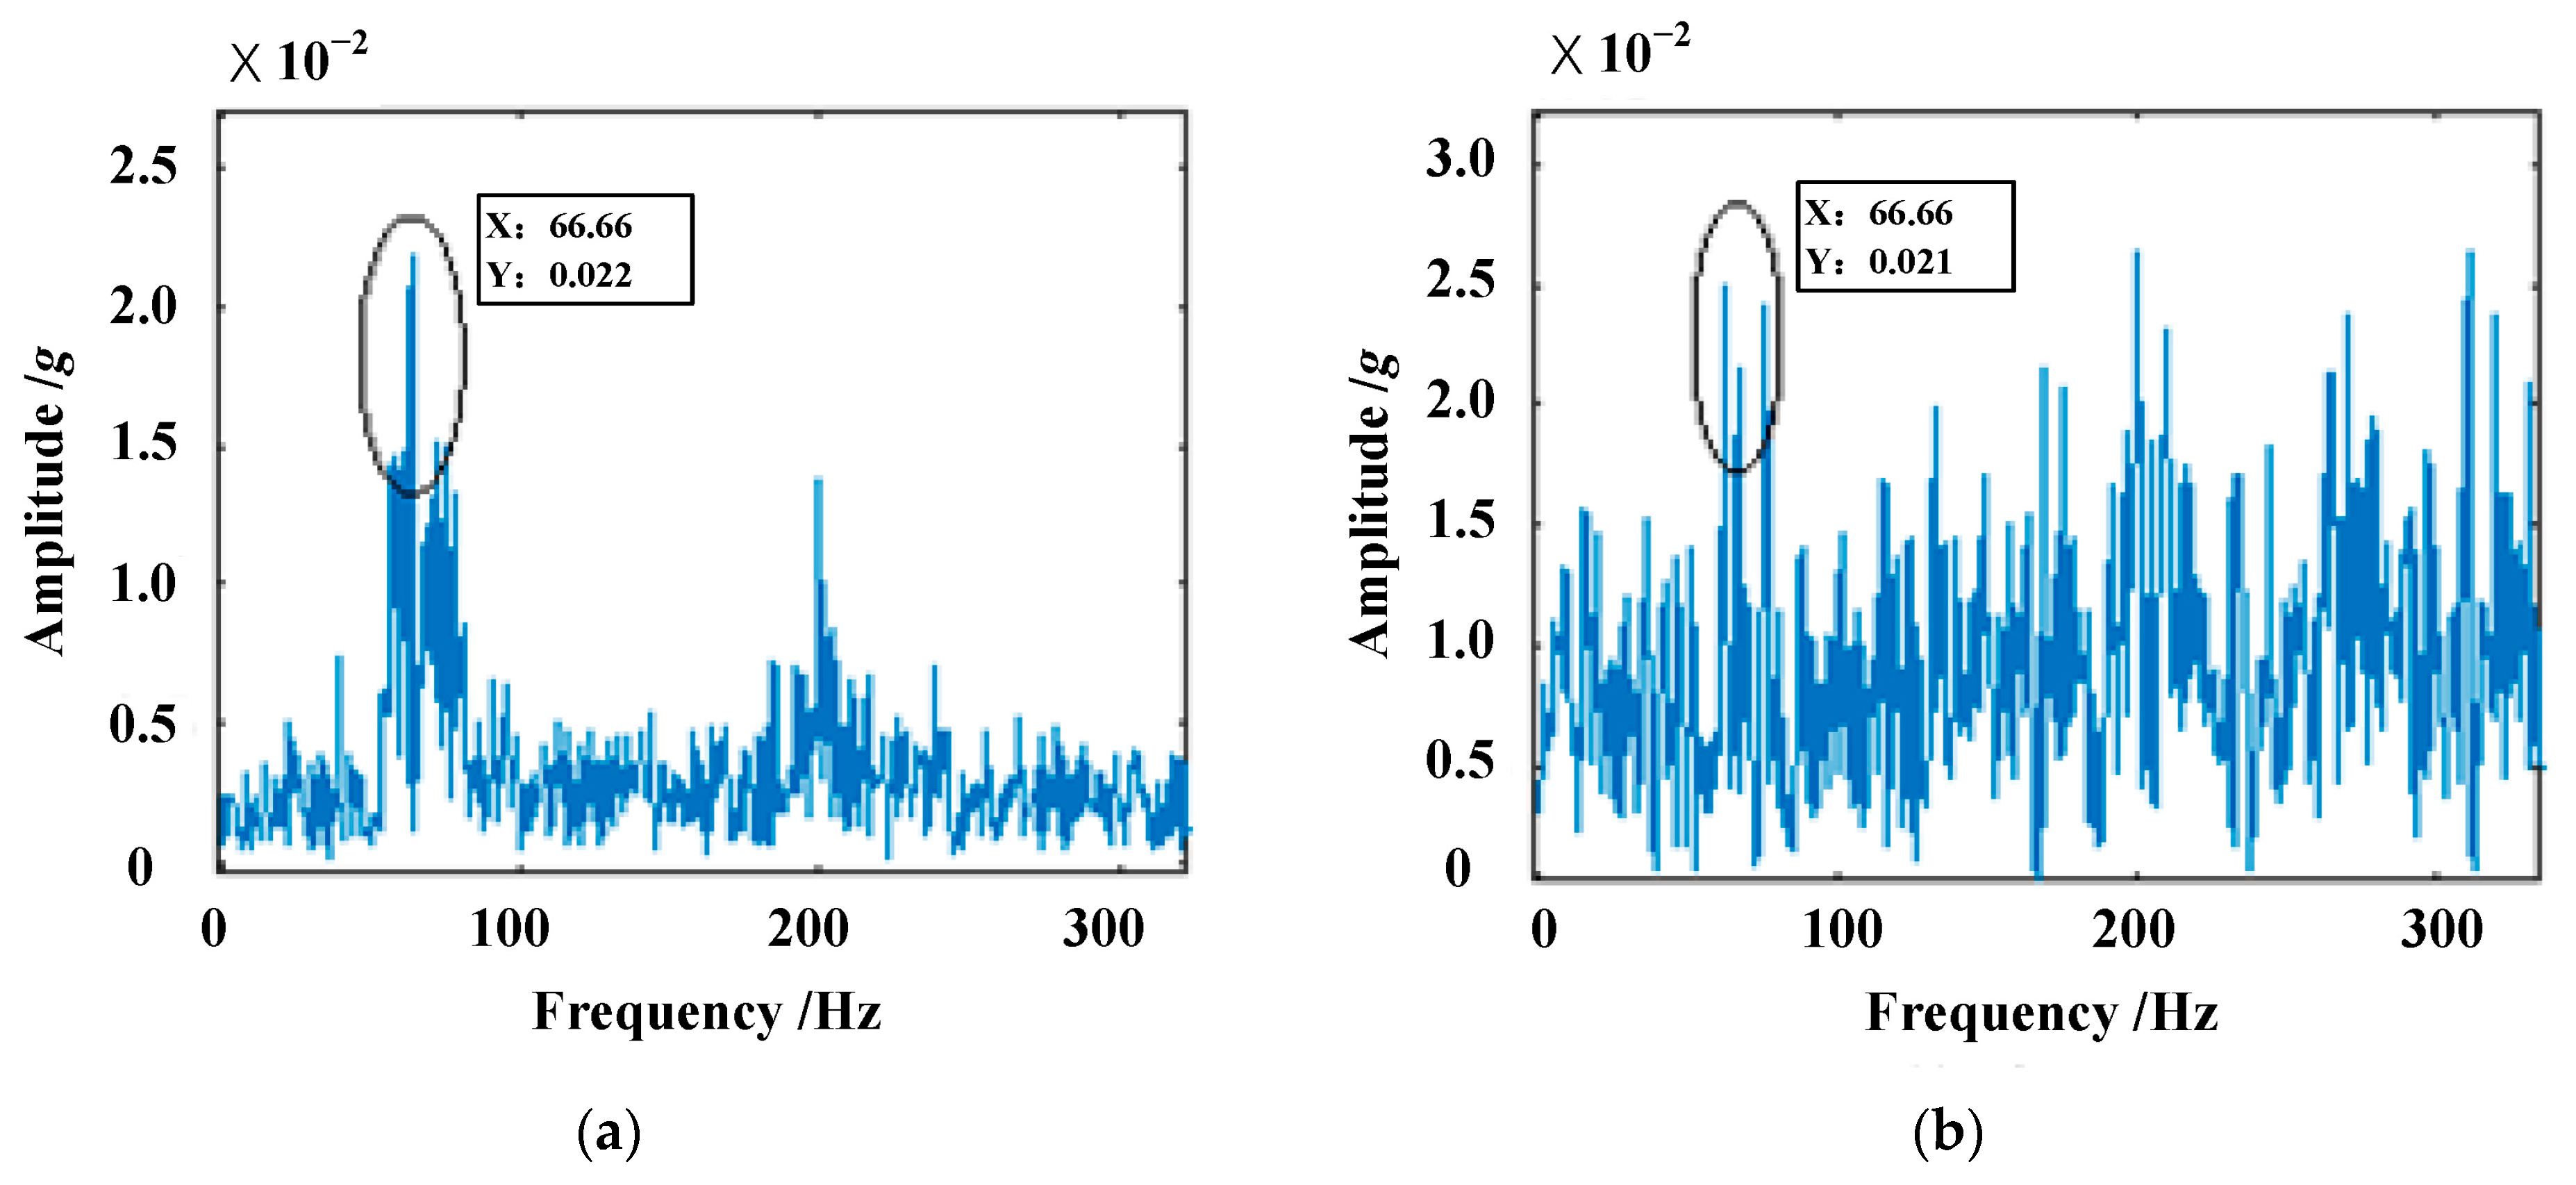
Prior to fatigue crack initiation in the flexspline, the HD’s vibration signals remained stable throughout the life test without significant fluctuations. As fatigue damage accumulated, leading to flexspline crack initiation and progressive propagation under cyclic loading, the vibration intensity progressively increased. Ultimately, upon fatigue fracture of the flexspline gear ring, the vibration amplitude exceeded 20 g, triggering termination of the HD life test. During testing, the HD operated at 2000 r/min, corresponding to a rotational frequency of 33.33 Hz. Given that flexspline and circular spline teeth mesh twice per revolution, vibration frequencies induced by flexspline gear ring cracks predominantly manifest at twice the rotational frequency, i.e., 66.66 Hz. Using the HD sample under 100 Nm ALT as an example, direct spectrum analysis was performed on vibration time domain signals acquired during the mid-life stage (pre-fracture) and acquired near end-of-life (imminent fracture); the resulting spectra are presented in Figure 19.
Figure 19 reveals that in the results obtained through direct spectrum analysis, while sideband variations are observable, no significant difference exists in the amplitude magnitude at twice the rotational frequency. After exploring multiple approaches, the Hilbert envelope spectrum analysis method yielded effective diagnostic outcomes. The implemented procedure comprises the following: performing Hilbert transform, extracting the signal envelope, and conducting spectrum analysis via Fourier transform. The resulting envelope spectrum is presented in Figure 20. In the Hilbert envelope spectrum analysis, a Hanning window is applied during the analysis of the high-frequency resonance signal after bandpass filtering. A rectangular window is used when performing the FFT on the demodulated low-frequency envelope signal to generate the envelope spectrum.
Figure 20 demonstrates that when applying Hilbert envelope spectrum analysis to HD vibration signals, no discernible signal at twice the rotational frequency is present during the mid-life stage. Conversely, at end-of-life (imminent fatigue fracture), a pronounced signal emerges at twice the rotational frequency with significantly amplified amplitude. This confirms Hilbert envelope spectrum analysis provides superior detection capability for HD fault signatures.
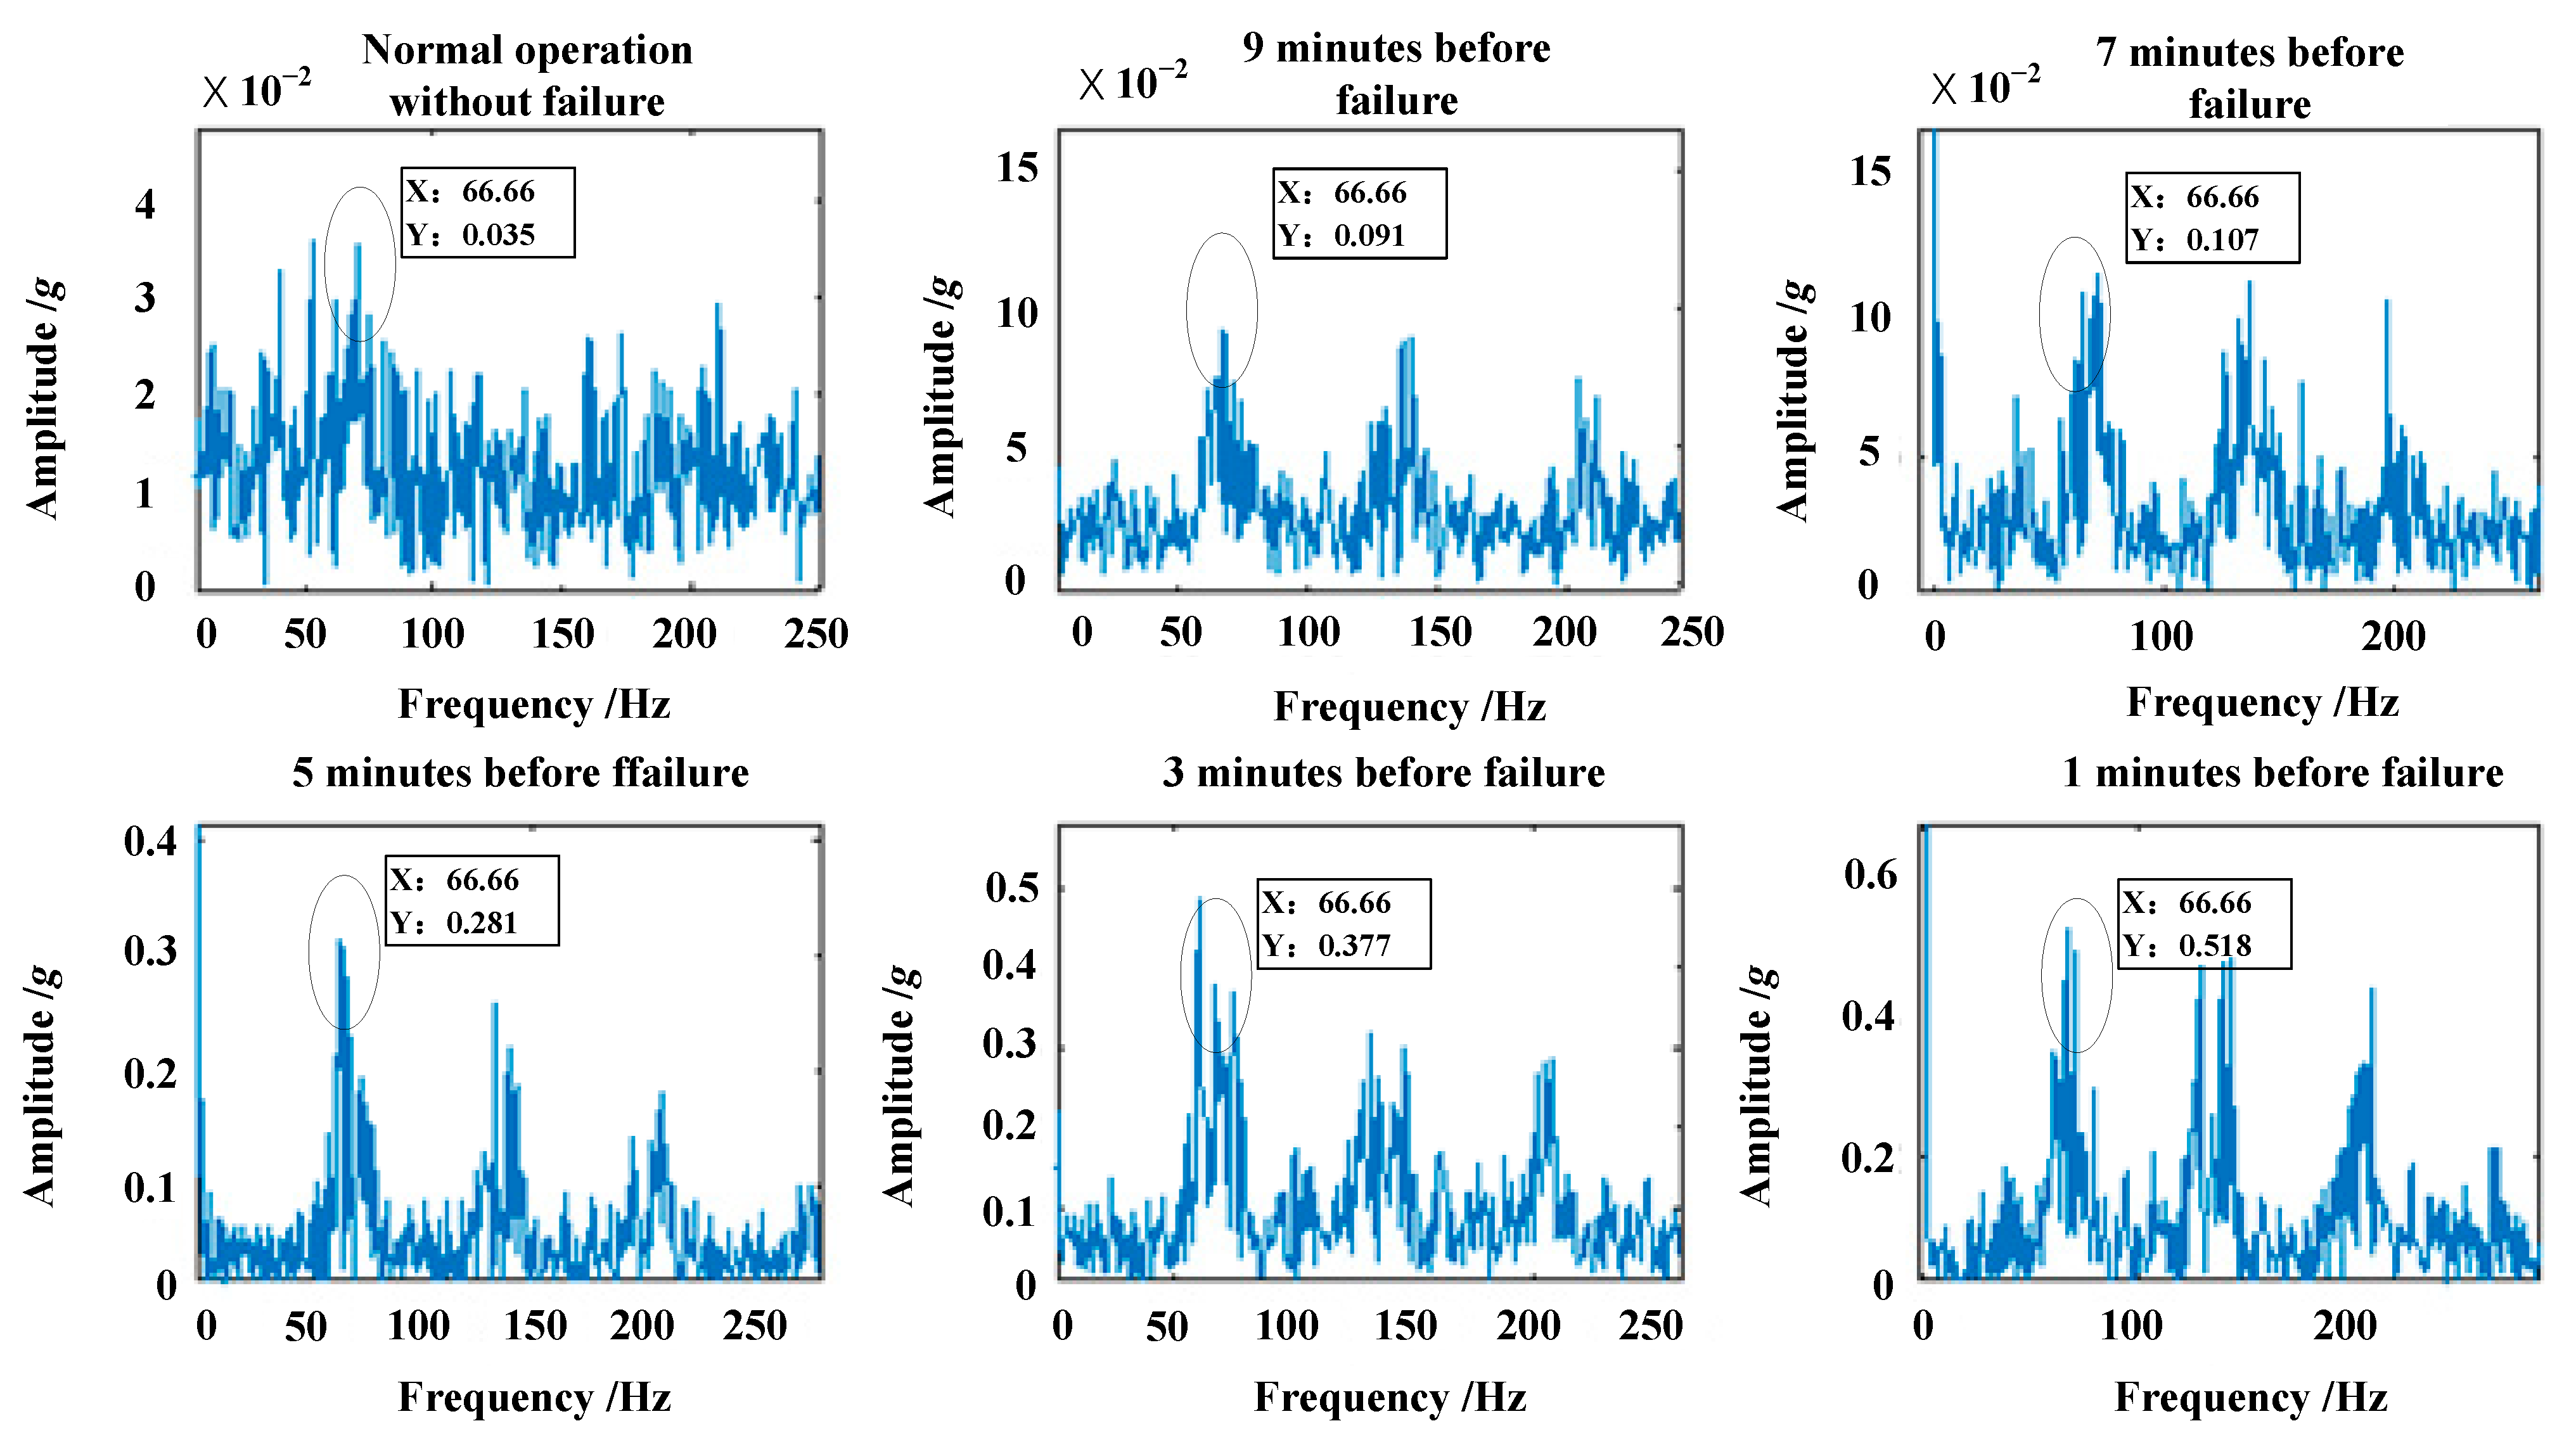
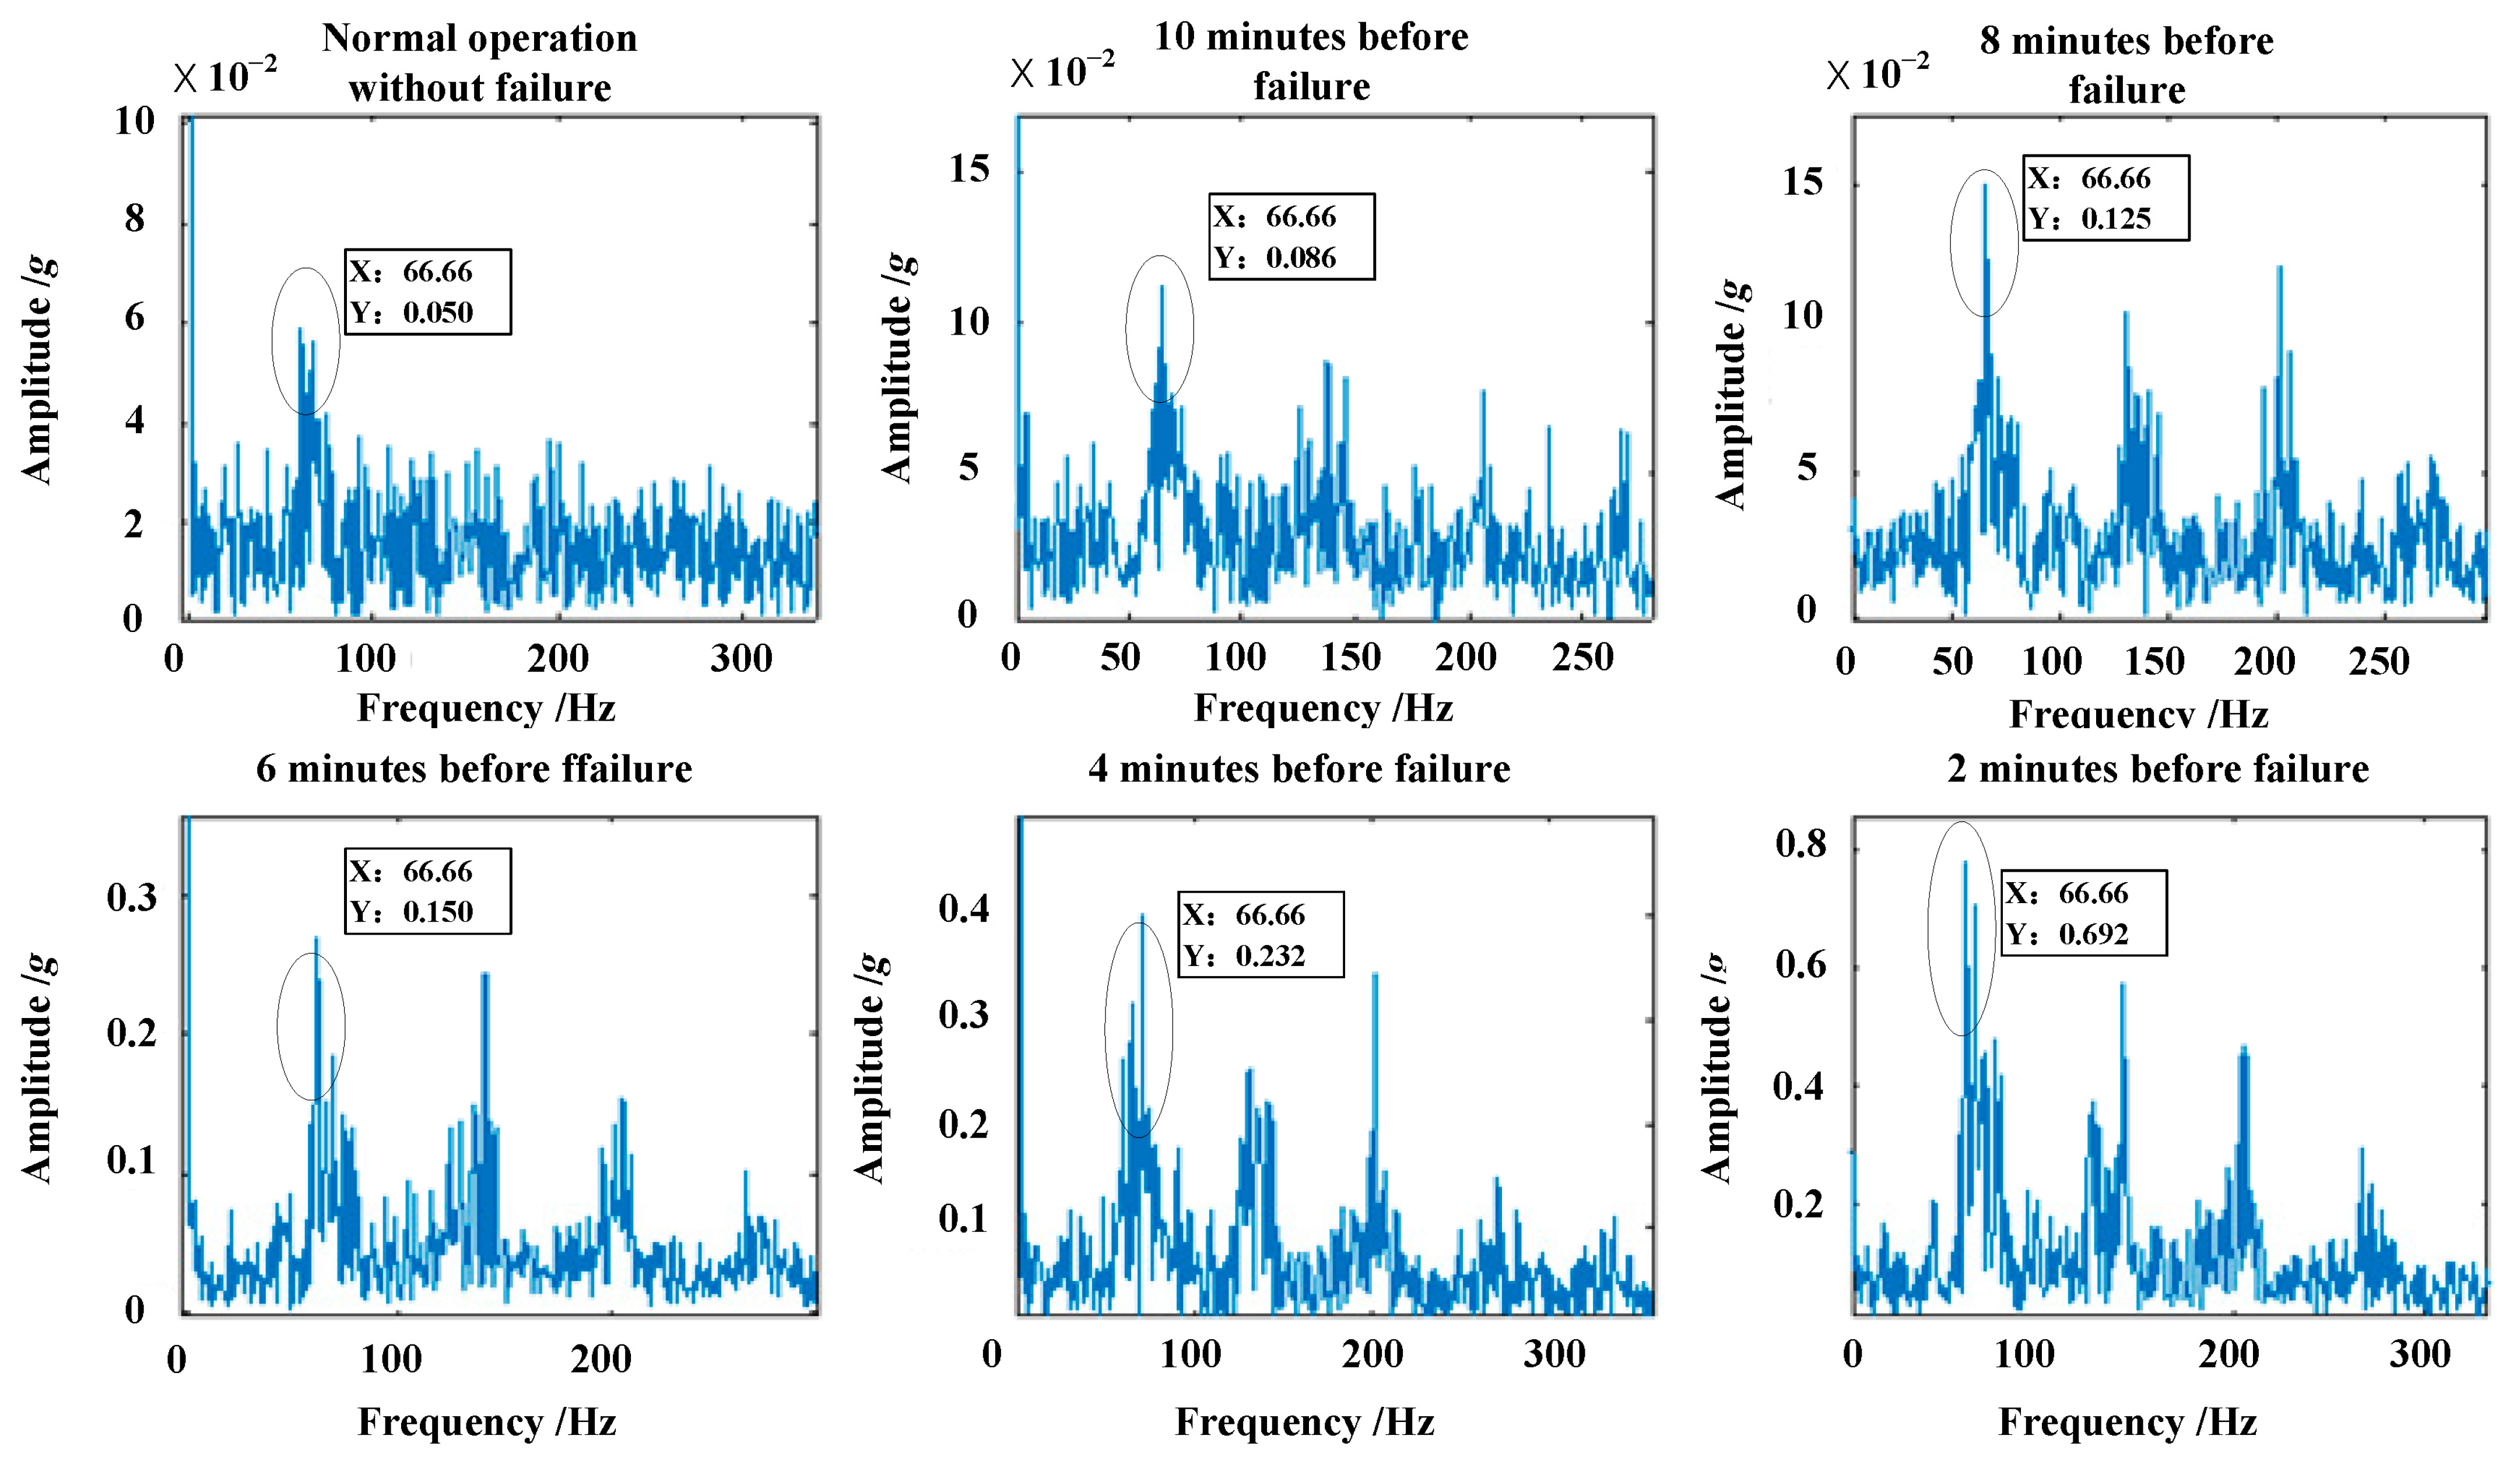
To assess fault severity progression, sequential Hilbert envelope spectrum analysis were performed on vibration data segments from the final minutes preceding HD failure (flexspline gear ring fatigue fracture). Results for the samples under 100 Nm and the 100–75 Nm step-down ALT are presented in Figure 21 and Figure 22, respectively.
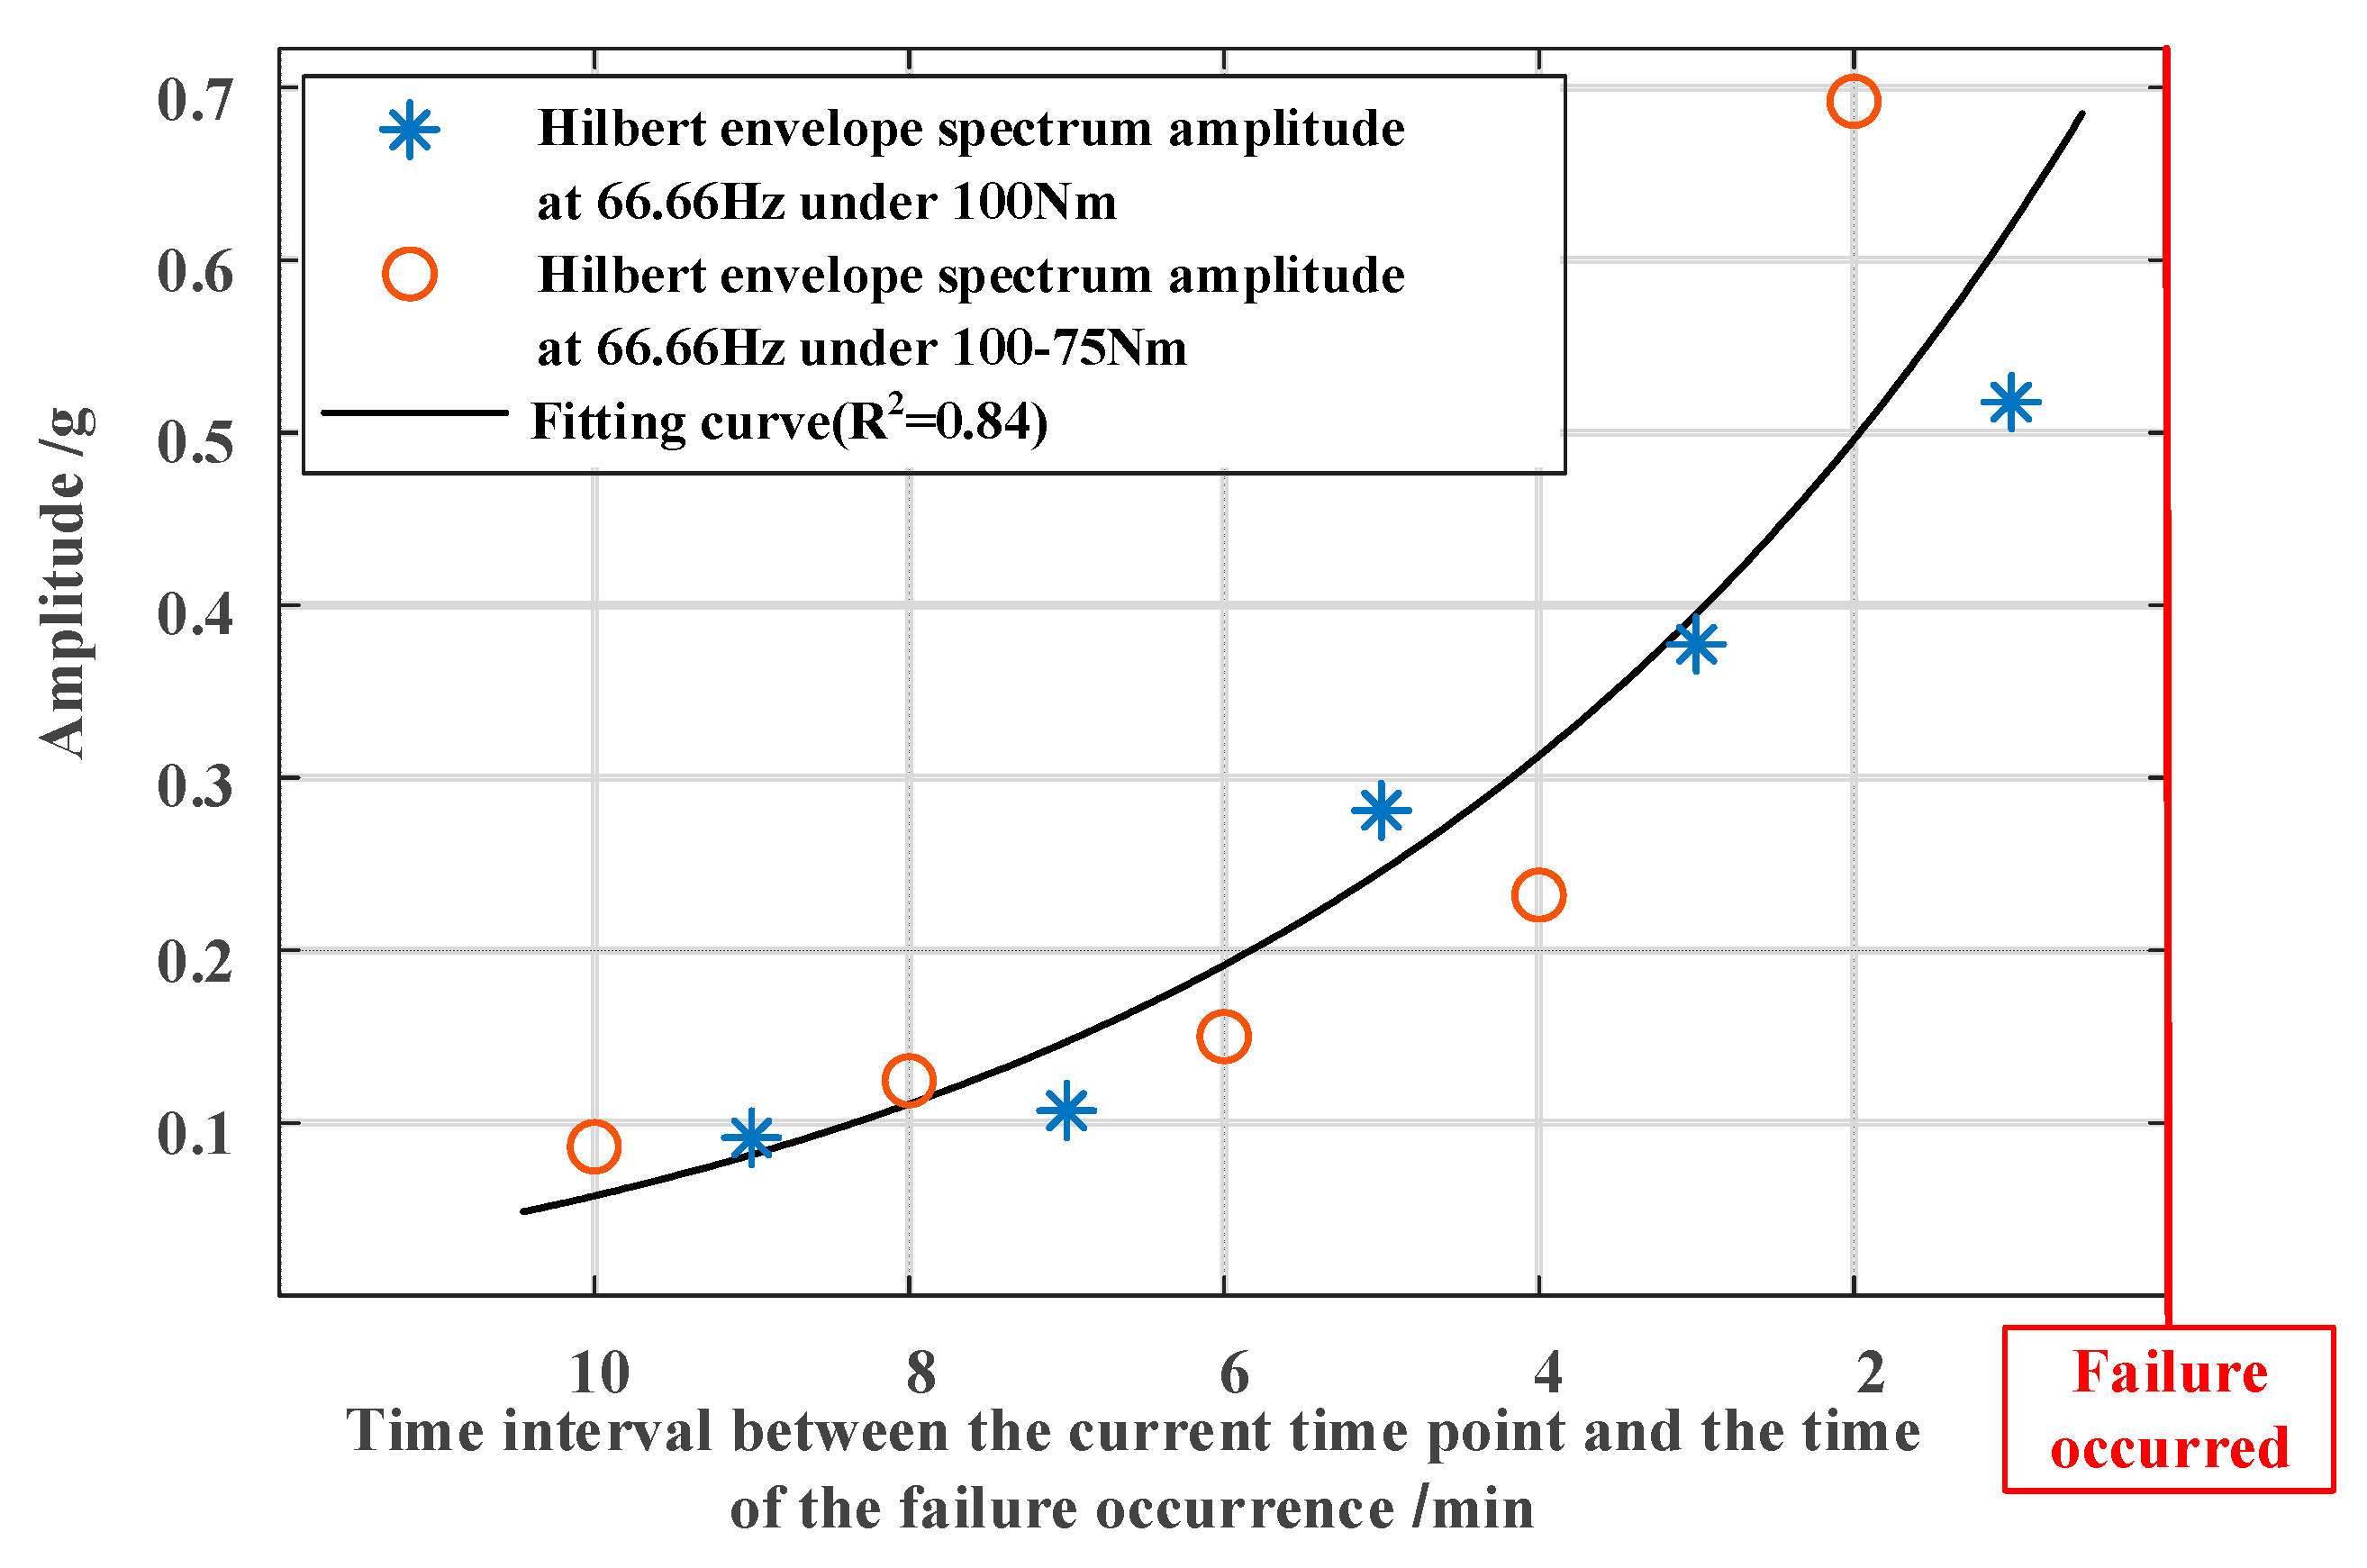
As shown in Figure 21 and Figure 22, compared to vibration signals during fault-free normal operation, the envelope spectrum amplitudes at twice the rotational frequency (66.66 Hz), progressively increasing in the minutes preceding the flexspline gear ring fatigue fracture. This trend is observed in both the 100 Nm and 100–75 Nm step-down ALT samples, as quantitatively illustrated in Figure 23. Notably, despite differing pre-failure stress levels (100 Nm vs. 75 Nm), the envelope spectrum amplitudes at twice the rotational frequency exhibit nearly identical exponential growth trends before failure. This behavior can be characterized by a single exponential model, indirectly validating consistent strength failure mechanisms across different stress levels. Furthermore, the evolution of envelope spectrum amplitudes at this characteristic frequency provides valuable insights for HD fault diagnosis and condition monitoring.

6. Conclusions

This study proposes a methodology for step-down accelerated life test and performance degradation test of HD, accompanied by relevant experimental data. The primary contributions are summarized as follows:
(1)
An HD life test rig and performance degradation test rig were developed. This platform permits life test under multiple operating conditions with synchronous vibration signal acquisition. Throughout the life tests, periodic assessments are conducted to measure key performance indicators, including stiffness, precision, backlash, transmission efficiency, starting torque, and friction torque.
(2)
A comprehensive protocol for HD step-down ALT and performance degradation testing is developed.
(3)
An HD ALT under multiple operating conditions is conducted. Testing revealed that strength failure in atmospheric environment manifests as fatigue fracture at the transition zone between the gear ring and cylinder of the flexspline. Life failure data across three different test conditions were obtained.
(4)
Performance degradation test during life tests under various conditions is conducted. Key findings include the following: significant degradation in stiffness, precision, and backlash (with pronounced fluctuations in backlash degradation curves), transmission efficiency showing negligible degradation before strength failure but marked decline after strength failure, and starting torque and friction torque exhibiting persistent fluctuation without discernible degradation trends.
(5)
Based on ALT and performance degradation data, mechanisms of strength failure and performance degradation failure are analyzed, and the failure mechanism consistency in step-down ALT is verified.
The primary objective of this paper is to obtain life failure data and performance degradation laws of HDs through step-down accelerated life testing, and to verify the consistency of failure mechanisms under accelerated conditions. Meanwhile, this study can provide data support for the reliability assessment and proactive maintenance of HDs, which is also valuable for future failure prediction and reliability optimization of HDs. Admittedly, this study has some limitations, such as conducting life tests on only five HD samples of one type HD. However, the methodologies involved—including the three-step step-down accelerated life testing method, the approach for analyzing the consistency of failure mechanisms under accelerated conditions, the accelerated life test failure data, the complete performance degradation data obtained during the tests, and the insights into the failure mechanisms and performance degradation laws of HD—can provide valuable references for accelerated life testing of other types of HDs.

Author Contributions

Conceptualization, X.Z.; methodology, X.Z.; software, F.Y.; validation, X.Z. and C.Z.; formal analysis, P.W. and X.Y.; investigation, P.W.; resources, C.Z.; data curation, C.P.; writing—original draft preparation, X.Z.; writing—review and editing, C.P.; visualization, X.Z.; supervision, X.Y.; project administration, C.Z.; funding acquisition, X.Z. and C.Z. All authors have read and agreed to the published version of the manuscript.

Funding

This research was founded by the Key Research and Development Program of Shaanxi Province (No. 2024GX-YBXM-295), the Key industrial chain project of Shaanxi Province (No. 2023-ZDLGY-28), and the “Scientists + Engineers” research team of QINCHUANGYUAN PLATFORM (No. 2022KXJ-139).

Data Availability Statement

The data used to support the findings of this study are available from the corresponding author upon reasonable request.

Acknowledgments

We acknowledge the Youth Innovation Team of Shaanxi Universities-Material Processing and Component Performance Testing of Aviation for their valuable suggestions on the manuscript.

Conflicts of Interest

The authors declare no conflicts of interest.

Abbreviations

The following abbreviations are used in this manuscript:
HDHarmonic Drive
ALTAccelerated Life Test
MTBFMean Time Between Failures
NINational Instrument
DAQData Acquisition
FSFlexspline
CSCircular Spline
WGWave Generator

References

  1. Xiang, Z.L.; Li, T.; Yang, L.; Shang, Y.S. Study on status and problem research of harmonic gear drive. J. Mech. Transm. 2020, 44, 151–162. [Google Scholar]
  2. Zuo, D.; Chen, D.; Zhu, M. Reliability analysis of harmonic drive with multiple failure modes based on improved calculation model of flexspline stress. Meccanica 2025, 60, 257–269. [Google Scholar] [CrossRef]
  3. Zhang, X.; Zhang, C.; Wang, P.; Yang, F.; Peng, C. Stiffness reliability analysis of harmonic drive considering contact pairs wear. Eng. Comput. 2024, 41, 1327–1352. [Google Scholar] [CrossRef]
  4. Schafer, I.; Bourlier, P.; Hantschack, F. Space lubrication and performance of harmonic Drive gears. In Proceedings of the 11th ESMATS Symposium, Lucerne, Switzerland, 21–23 September 2005. [Google Scholar]
  5. Schmidt, J.; Schmid, M. Life test of an industrial standard and of a stainless steel harmonic drive. In Proceedings of the 14th European Space Mechanisms & Tribology Symposium, Constance, Germany, 28–30 September 2011. [Google Scholar]
  6. Li, J.Y. Failure Mechanism Theory and Accelerated Life Testing Method Research for Space Lubrication Harmonic Drive. Ph.D. Thesis, Chongqing University, Chongqing, China, 2012. [Google Scholar]
  7. Elsayed, E.A. Overview of reliability testing. IEEE Trans. Reliab. 2012, 61, 282–291. [Google Scholar] [CrossRef]
  8. Pan, R.; Yang, T.; Seo, K. Planning constant-stress accelerated life tests for acceleration model selection. IEEE Trans. Reliab. 2015, 64, 1356–1366. [Google Scholar] [CrossRef]
  9. Li, J.Y.; Wang, J.X.; Fan, K.J. Accelerated life model for harmonic drive under adhesive wear. Tribology 2016, 36, 297–303. [Google Scholar]
  10. Li, J.Y.; Wang, J.X.; Zhou, G.W. Accelerated life testing of harmonic driver in space lubrication. Proc. Inst. Mech. 2015, 229, 1479–1490. [Google Scholar] [CrossRef]
  11. Li, J.Y.; Wang, J.X.; Zhou, G.W. Failure Mechanism of harmonic drivers for space. Tribology 2013, 33, 44–48. [Google Scholar]
  12. Ueura, K.; Kiyosawa, Y.; Kurogi, J. Tribological aspects of a strain wave gearing system with specific reference to its space application. Proc. Inst. Mech. 2008, 222, 1051–1061. [Google Scholar] [CrossRef]
  13. Zhang, C.; Wang, S.; Wang, Z. An accelerated life test model for harmonic drives under a segmental stress history and its parameter optimization. Chin. J. Aeronaut. 2015, 28, 1758–1765. [Google Scholar] [CrossRef]
  14. Wang, R. Comparison analysis of efficiency for step-down and step-up stress accelerated life testing. IEEE Trans. Reliab. 2012, 61, 590–603. [Google Scholar] [CrossRef]
  15. Lee, J.H.; Cho, Y.H.; Kim, D.S. Lifetime estimation of harmonic reducer for manufacturing robot using accelerated life test. J. Mech. Sci. Technol. 2022, 36, 2879–2887. [Google Scholar] [CrossRef]
  16. Su, P.F.; Liu, J.H.; Guan, E.G.; Zhao, Y.Z. Torsional stiffness detection and failure analysis of harmonic drive. Mach. Electron. 2020, 38, 41–44+50. [Google Scholar]
  17. Zhao, Y.Y.; Li, P.X.; Ding, H.L.; Cao, J.B.; Yan, W.X. Harmonic Reducer Performance Prediction Algorithm Based on Multivariate State Estimation and LargeVis Dimensionality Reduction. IEEE Access 2023, 11, 126762–126774. [Google Scholar] [CrossRef]
  18. Preissner, C.; Royston, T.J.; Shu, D. A high-fidelity harmonic drive model. J. Dyn. Syst. Meas. Control 2012, 134, 011002. [Google Scholar] [CrossRef]
  19. Zhou, H.; Zheng, J.; Sang, R.P. Tungsten containing hydrogenated DLC coatings on grease lubricated harmonic drive gear for space application. In Proceedings of the ESMATS 2011—14th European Space Mechanisms and Tribology Symposium, Constance, Germany, 28–30 September 2011. [Google Scholar]
  20. Zhang, X.; Jiang, G.D.; Zhang, H.; Yun, X.L.; Mei, X.S. Time-dependent reliability analysis of harmonic drive based on transient FEA and accelerated life test. J. Eng. Comput. 2020, 37, 2293–2317. [Google Scholar] [CrossRef]
  21. Wang, B.; Lei, Y.G.; Li, N.P. A hybrid prognostics approach for estimating remaining useful life of rolling element bearings. IEEE Trans. Reliab. 2018, 69, 401–412. [Google Scholar] [CrossRef]
  22. Ivanov, M. Harmonic Gear Drives; Visajas Kola Press: Moscow, Russia, 1981. [Google Scholar]
  23. Guan, H. Research on Performance Degradation and Life Analysis of Space Harmonic Drive. Master’s Thesis, Chongqing University, Chongqing, China, 2014. [Google Scholar]
  24. Zou, C.; Tao, T.; Mei, X.S.; Lü, J.W.; Jiang, G.D. Contact analysis for short harmonic reducer in robotic joints. J. Xi’an Jiaotong Univ. 2013, 47, 82–87. [Google Scholar]
  25. GB/T 14118-1993; Harmonic Drive Reducers. The State Bureau of Quality and Technical Supervision: Beijing, China, 1993.
  26. GB/T 30819-2014; Harmonic Drive Gear Reducers for Robots. General Administration of Quality Supervision, Inspection and Quarantine of the People’s Republic of China, Standardization Administration of the People’s Republic of China: Beijing, China, 2014.
  27. Feng, J. Consistent test of accelerated storage degradation failure mechanism based on rank correlation coefficient. J. Aerosp. Power 2011, 26, 2439–2444. [Google Scholar]
  28. Wang, H.W.; Xu, T.X.; Wang, W.Y. Test method of failure mechanism consistency based on degradation model. Acta Aeronaut. Astronaut. Sin. 2015, 36, 889–897. [Google Scholar]
  29. Liu, W.Z.; Zhang, N.R.; Zhang, C.L.; Zhao, Y.Z. Finite element calculation and analysis on the column-shaped flex spline of harmonic drive. Chin. J. Mech. Eng. 2006, 42, 52–57. [Google Scholar] [CrossRef]
  30. Ostapski, W. Analysis of the stress state in the harmonic drive generator-flexspline system in relation to selected structural parameters and manufacturing deviations. Bull. Pol. Acad. Sci. Tech. Sci. 2010, 58, 683–698. [Google Scholar] [CrossRef]
  31. Li, Q.; Zuo, Y.Y. Failure mode analysis of harmonic drive flexspline. Robot. Tech. Appl. 2013, 37–38. [Google Scholar]
  32. Wang, S.; Jiang, G.D.; Mei, X.S. A rapid stress calculation method for short flexspline harmonic drive. Eng. Comput. 2019, 36, 1852–1867. [Google Scholar] [CrossRef]
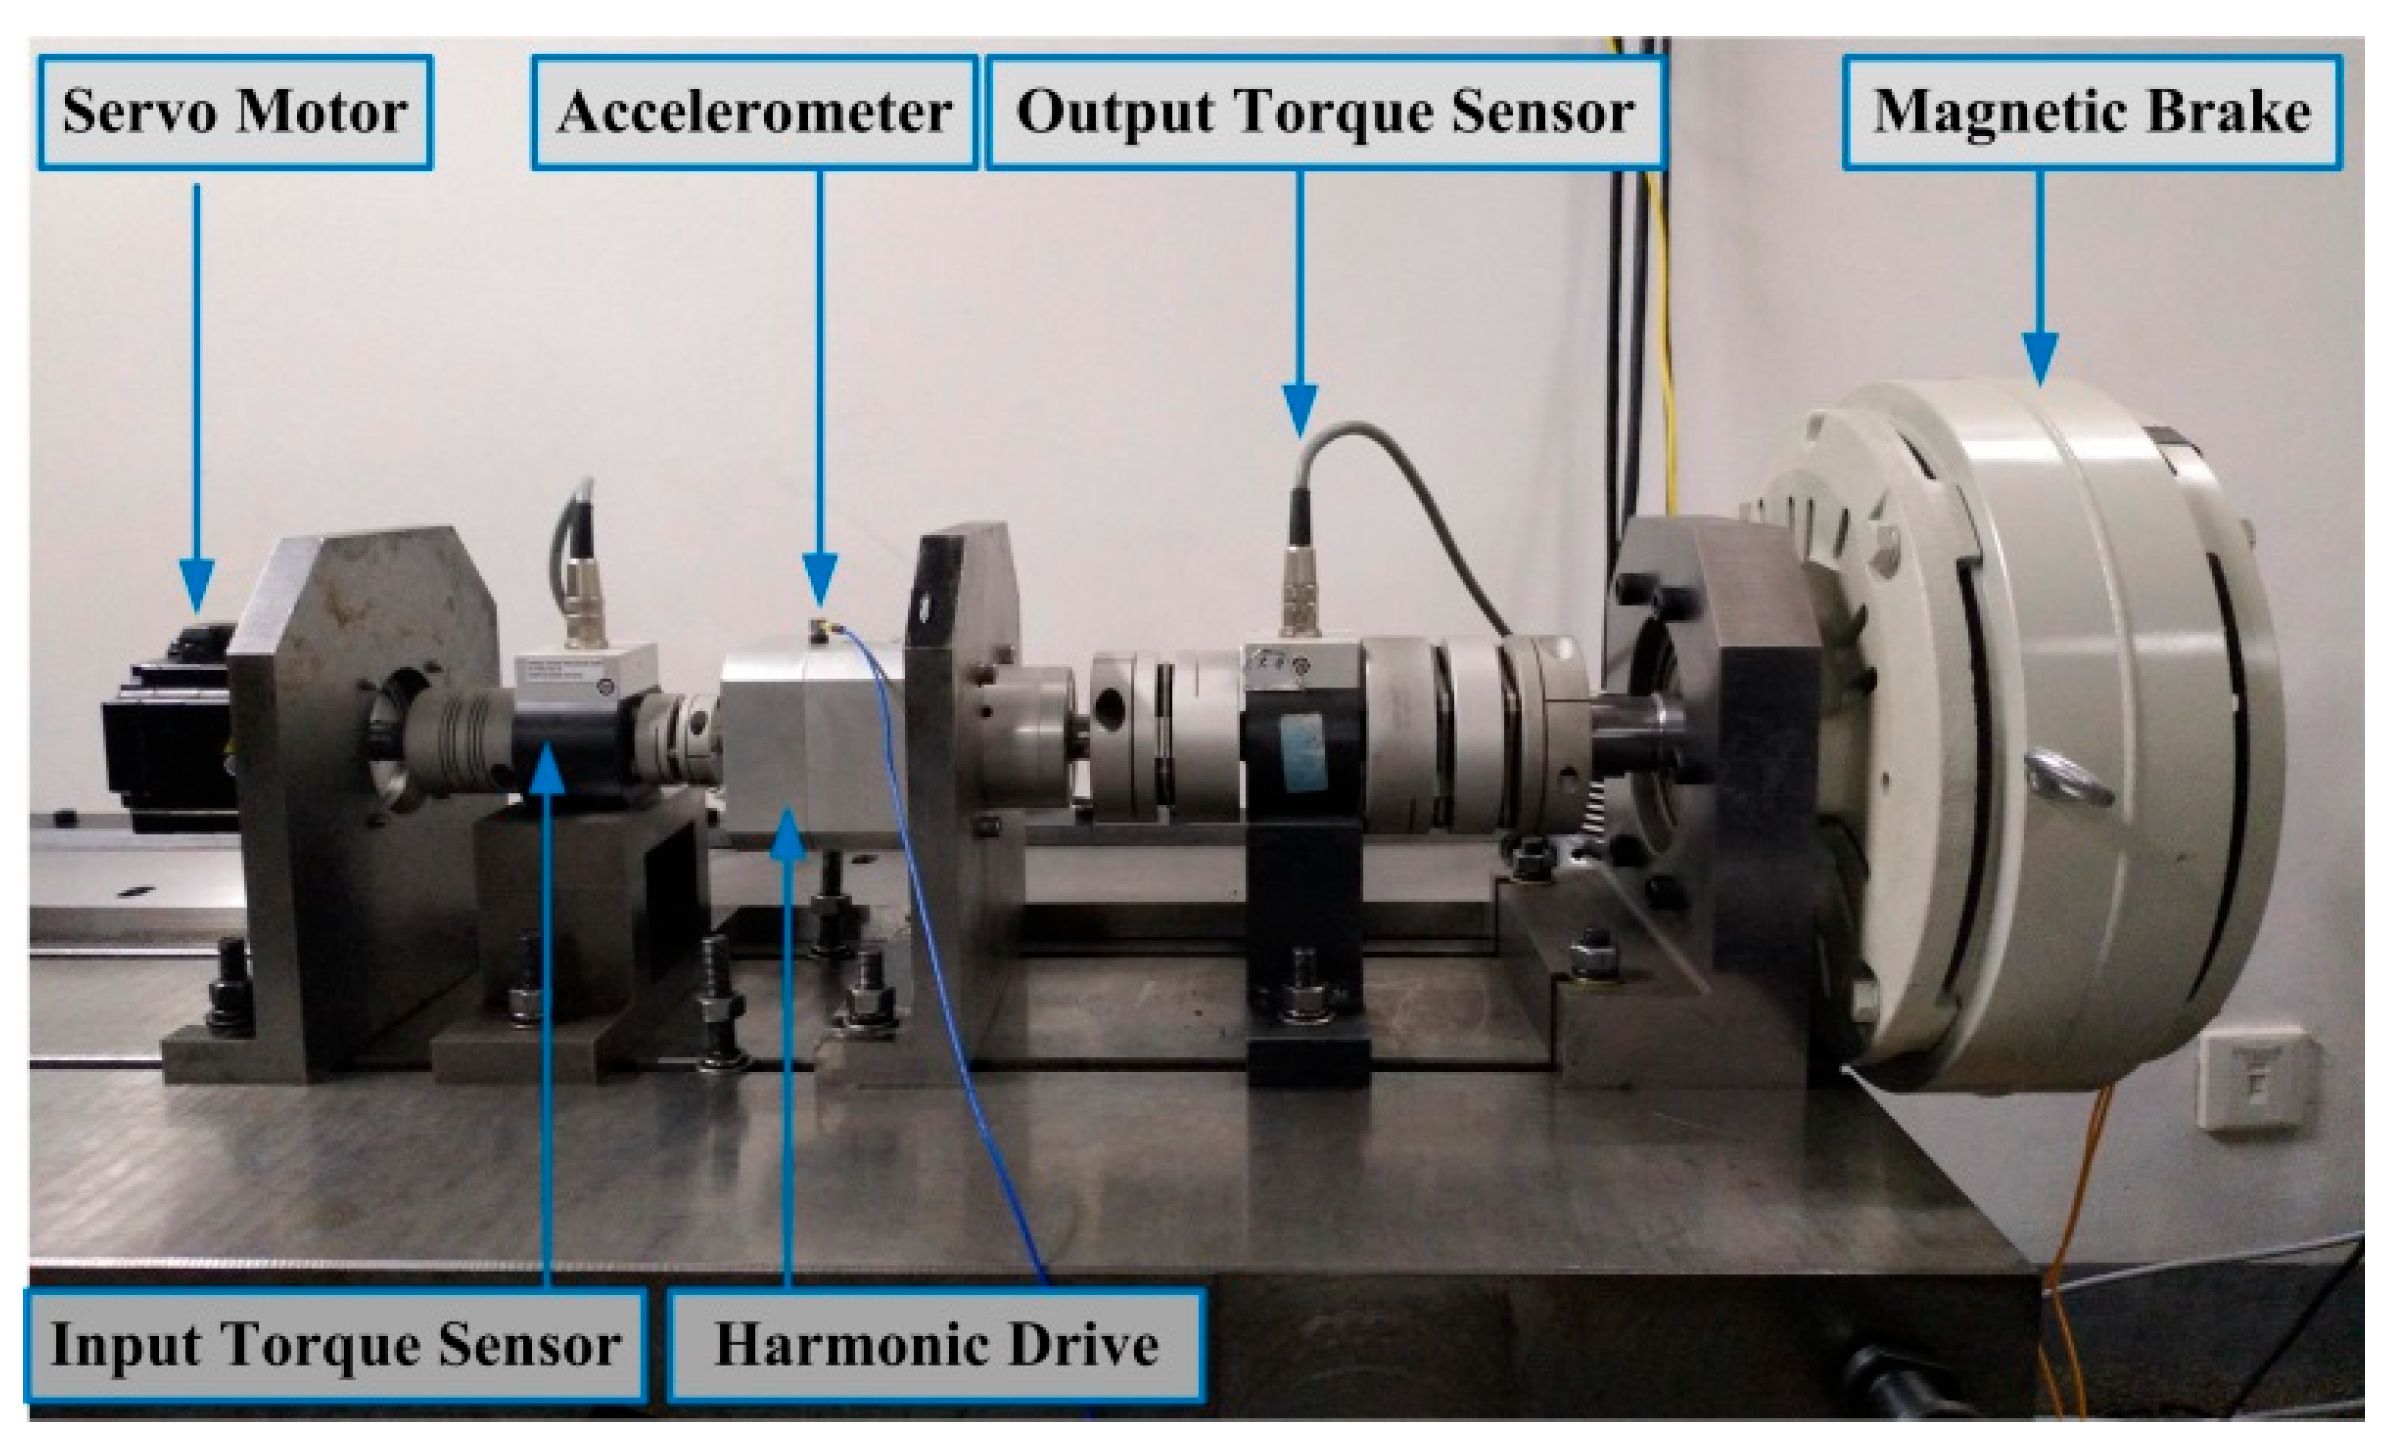
Figure 1. Accelerated life test rig of HD.
Machines 13 00918 g001
Figure 2. Illustration of loading procedure in step-down accelerated life test.
Machines 13 00918 g002
Figure 3. Stress level and the number of failure samples in HD ALT.
Machines 13 00918 g003
Figure 4. Geometrical structure illustration of FS (a) and CS (b) in HD.
Machines 13 00918 g004
Figure 5. Five HD samples.
Machines 13 00918 g005
Figure 6. HD vibration signal history under 100 Nm: (a) Sample 1; (b) Sample 2; (c) Sample 3.
Machines 13 00918 g006
Figure 7. Strength failure samples under 100 Nm: (a) Sample 1; (b) Sample 2; (c) Sample 3.
Machines 13 00918 g007
Figure 8. Performance degradation curves of Sample 1 under 100 Nm.
Machines 13 00918 g008
Figure 9. Performance degradation curves of Sample 2 under 100 Nm.
Machines 13 00918 g009
Figure 10. Performance degradation curves of Sample 3 under 100 Nm.
Machines 13 00918 g010
Figure 11. HD vibration signal time history of ALTSD1.
Machines 13 00918 g011
Figure 12. Strength failure sample of ALTSD1.
Machines 13 00918 g012
Figure 13. Performance degradation curves of ALTSD1.
Machines 13 00918 g013
Figure 14. HD vibration signal time history of ALTSD2.
Machines 13 00918 g014
Figure 15. Strength failure sample of ALTSD2.
Machines 13 00918 g015
Figure 16. Performance degradation curves of ALTSD2.
Machines 13 00918 g016
Figure 17. HD stiffness degradation curves: (a) under 100 Nm ALT; (b) during the 50 Nm phase of ALTSD2.
Machines 13 00918 g017
Figure 18. HD precision degradation curves: (a) under 100 Nm ALT; (b) during the 50 Nm phase of ALTSD2.
Machines 13 00918 g018
Figure 19. Spectrum analysis of HD vibration signal: (a) acquired during the mid-life stage; (b) acquired near end-of-life.
Machines 13 00918 g019
Figure 20. Hilbert envelope spectrum analysis of HD vibration signal: (a) acquired during the mid-life stage; (b) acquired near end-of-life.
Machines 13 00918 g020
Figure 21. Hilbert envelope spectrum analysis of HD vibration signal acquired near end-of-life under 100 Nm.
Machines 13 00918 g021
Figure 22. Hilbert envelope spectrum analysis of HD vibration signal acquired near end-of-life under 100–75 Nm.
Machines 13 00918 g022
Figure 23. Amplitude variation in Hilbert envelope spectrum before failure.
Machines 13 00918 g023
Table 1. Test method and test rig of HD performance indicator.
PerformanceTest MethodTest Rig
StiffnessThe drive motor pauses at home position, and the load motor rotates back and forth within rated torque range. Meanwhile, the torsional angle and torque signals of output are acquired synchronously for stiffness calculationMachines 13 00918 i001
Precision
(transmission error)
HD is operated at a constant speed under no-load, low-speed condition. By having the HD output shaft rotate by at least one revolution, the angular displacement values at both the input and output ends are synchronously acquired by two angular encoders for precision calculationMachines 13 00918 i002
BacklashHD is driven to rotate back and forth. Reversal points within the transmission error signal are extracted, and the transmission error in the forward motion segments and the reverse motion segments are distinguished. The transmission error values for all forward segments and all reverse segments are then averaged separately, and the difference between forward average and reverse average is calculated to determine the backlashSame as precision
Transmission efficiencyUnder rated condition, the input and output torque signals of the HD are synchronously acquired for transmission efficiency calculationMachines 13 00918 i003
Starting torqueHD is slowly accelerated under no-load condition while the input torque is acquired. The peak torque value occurring during the startup phase is then taken as the starting torque value of HDMachines 13 00918 i004
Friction torqueHD is operated under no-load and constant-speed condition, and the motor driving force is solely utilized to overcome friction, neglecting elastic factors within the HD. The input driving torque is the friction torque at that constant speedSame as starting torque
Table 2. Test condition of HD step-down ALT.
Group NameSample NumberAccelerated Stress Level
Group 13100 Nm
Group 2 (ALTSD1)1100 Nm–75 Nm
Group 2 (ALTSD2)1100 Nm–75 Nm–50 Nm
Table 3. Geometric parameters of FS and CS in HD.
Geometric Parameter (Unit)ValueGeometric Parameter (Unit)Value
Length of FS Lf0 (mm)50Diameter of CS’s outer circle ϕc0 (mm)68
Fillet radius at FS bottom Rf0 (mm)3Width of CS Lc0 (mm) 14
Number of FS teeth 150Number of CS teeth152
Thickness of FS cylinder δf0 (mm)0.45Width of FS gear ring bR (mm)12
Diameter of inner hole at FS bottom ϕf0 (mm)25Distance between the gear ring and front end of FS Lbc (mm)3
Gear module (mm)0.4Radius of FS’s dedendum circle (mm)30.75
Radius of CS’s dedendum circle (mm)32.01Radius of FS’s addendum circle (mm)31.47
Radius of CS’s addendum circle (mm)31.29Inner hole diameter of FS’s gear ring RFS (mm)60
Disclaimer/Publisher’s Note: The statements, opinions and data contained in all publications are solely those of the individual author(s) and contributor(s) and not of MDPI and/or the editor(s). MDPI and/or the editor(s) disclaim responsibility for any injury to people or property resulting from any ideas, methods, instructions or products referred to in the content.